Embed Size (px)
Citation preview


struct
struct

studente = struct('nome', 'Giovanni', 'eta', 24)
studente.nome = 'Giovanni';
studente.eta = 24;

struct
nomeStruct.nomeCampo;
nomeStruct.nomeCampo
nomeCampo
(indice)
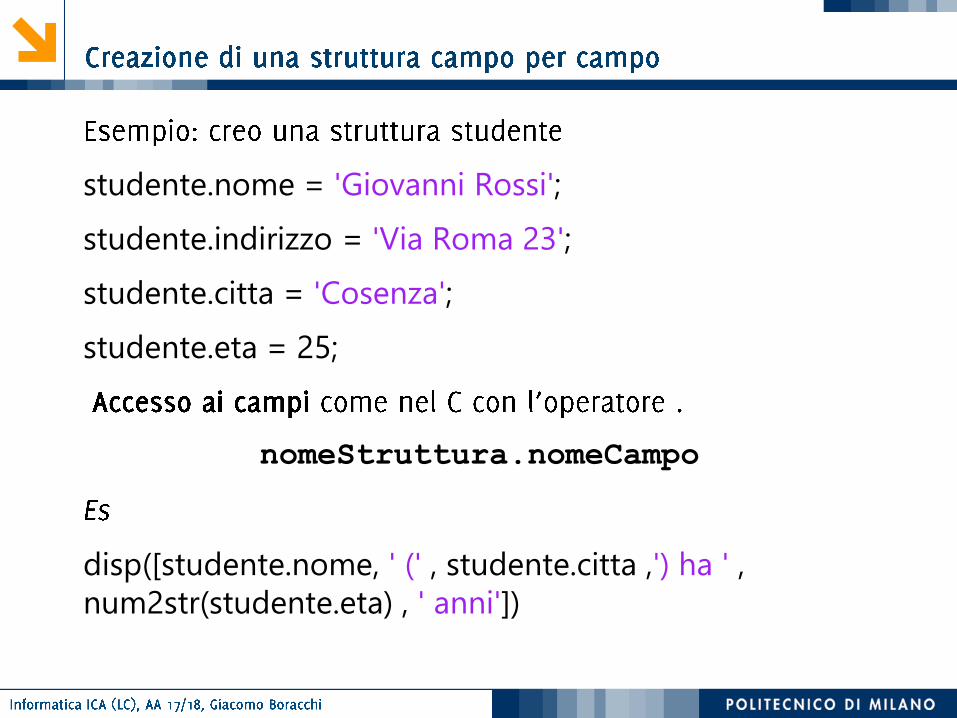
studente.nome = 'Giovanni Rossi';
studente.indirizzo = 'Via Roma 23';
studente.citta = 'Cosenza';
studente.eta = 25;
nomeStruttura.nomeCampo
disp([studente.nome, ' (' , studente.citta ,') ha ' ,
num2str(studente.eta) , ' anni'])

studente.nome = ‘Giovanni Rossi’;
studente.indirizzo = ‘Via Roma 23’;
studente.citta = ‘Cosenza’;
studente.media = 25;
studente
studente(2)
studente(2).nome = ‘Giulia Gatti’;
studente(2).media = 30;
studente(2):

%facciamo riferiemento alla definizione di studente delle
slide precedenti
studente(2).esami = [20 25 30];
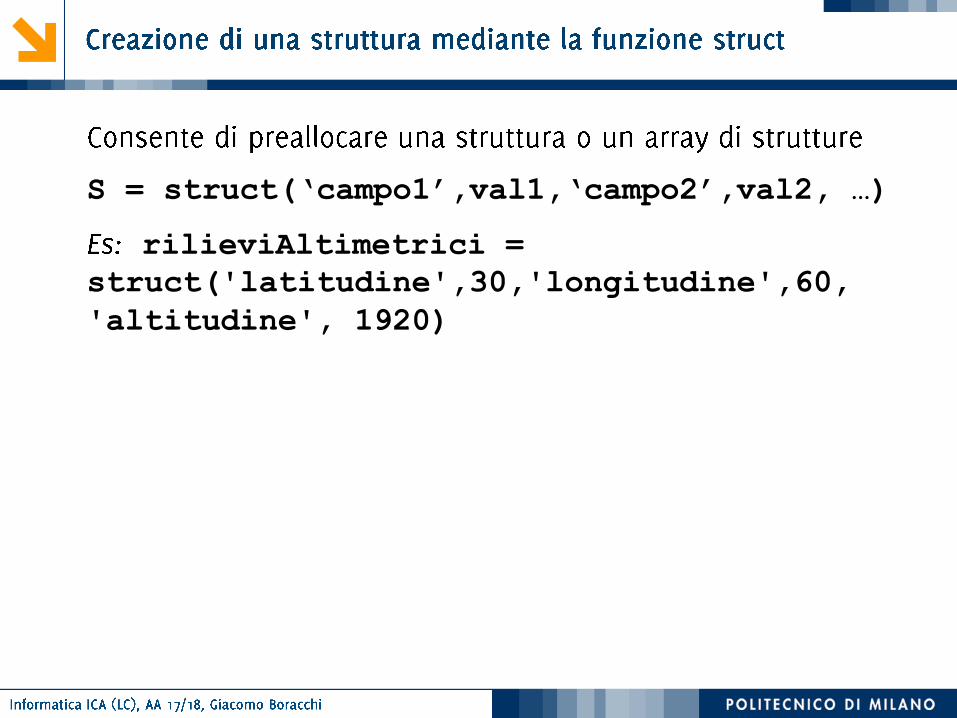
S = struct(‘campo1’,val1,‘campo2’,val2, …)
rilieviAltimetrici =
struct('latitudine',30,'longitudine',60,
'altitudine', 1920)

S = struct(‘campo1’,val1,‘campo2’,val2, …)
rilieviAltimetrici =
struct('latitudine',30,'longitudine',60,
'altitudine', 1920)
s(5) = struct(‘x',10,‘y’,3);
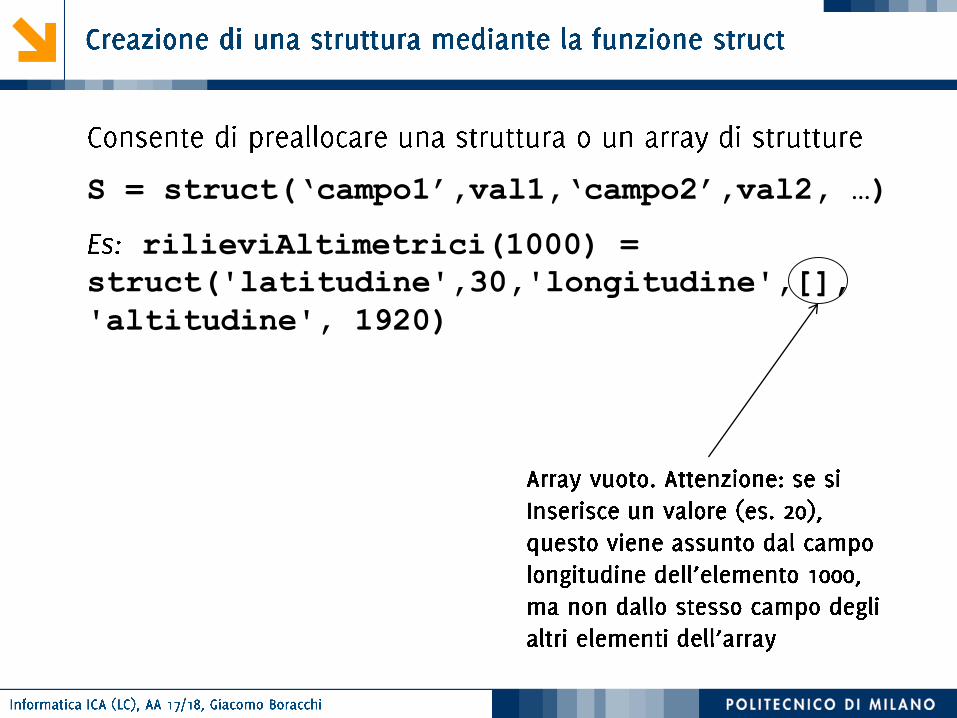
S = struct(‘campo1’,val1,‘campo2’,val2, …)
rilieviAltimetrici(1000) =
struct('latitudine',30,'longitudine',[],
'altitudine', 1920)

studente(1).corso(1).nome='InformaticaB';
studente(1).corso(1).docente='Von Neumann';
studente(1).corso(2).nome='Matematica';
studente(1).corso(2).docente='Eulero';


% s = struct('altezza',[],'latitudine',[], 'longitudine',[])
n = input(['quanti rilievi? ']);
% acquisizione dei rilievi
for ii = 1 : n
s(ii).altezza = input(['altezza rilievo nr ', num2str(ii), ' ']);
s(ii).latitudine= input(['latitudine rilievo nr ', num2str(ii), ' ']);
s(ii).longitudine= input(['longitudine rilievo nr ', num2str(ii), ' ']);
end
% creo dei vettori con i valori dei campi
LAT = [s.latitudine];
LON = [s.longitudine];
ALT = [s.altezza];
% operazioni logiche per definire il sottovettore da estrarre da altezza
latOK = (LAT > 30) & (LAT <60);
lonOK = (LON> 10) & (LON<100);
posOK =latOK & lonOK;
% estrazione sottovettore e calcolo media
mean(ALT(posOK));

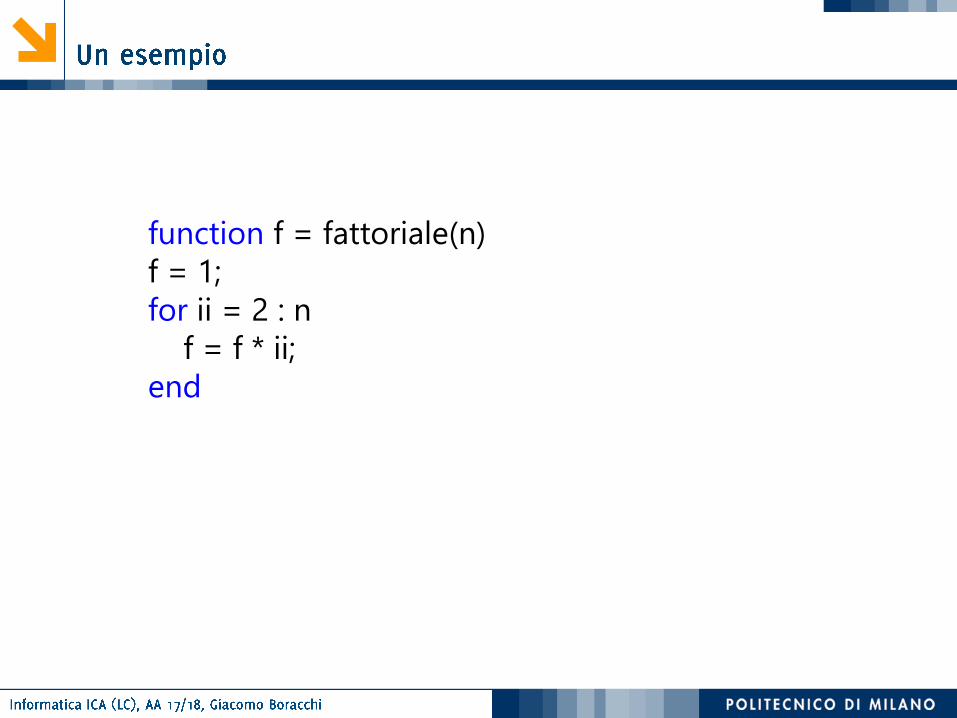
function f = fattoriale(n)
f = 1;
for ii = 2 : n
f = f * ii;
end

function f = fattoriale(n)
f = 1;
for ii = 2 : n
f = f * ii;
end
𝒏!𝑛 > 0
𝑛! = 𝑛 ∗ 𝑛 − 1 ∗ 𝑛 − 2 ∗ ⋯∗ 2 ∗ 1

fattoriale(2)
ans =
2
function f = fattoriale(n)
f = 1;
for ii = 2 : n
f = f * ii;
end

fattoriale(2)
ans =
2
function f = fattoriale(n)
f = 1;
for ii = 2 : n
f = f * ii;
end

k = 2;
f2 = fattoriale(k);
function f = fattoriale(n)
f = 1;
for ii = 2 : n
f = f * ii;
end
•
•
•
•
•
•
•
•

k = 2;
f2 = fattoriale(k);
function f = fattoriale(n)
f = 1;
for ii = 2 : n
f = f * ii;
end
•
•
•
•
•
•
•
•

f2 = fattoriale(2)
f2 =
2
f3 = fattoriale(3)
f3 =
6
f4 = fattoriale(4)
f4 =
24
f5 = fattoriale(5)
f5 =
120
f6 = fattoriale(6)
f6 =
720

𝑛! = 𝑛 ∗ 𝑛 − 1 !
𝑛! = 𝑛 ∗ 𝑛 − 1 ∗ 𝑛 − 2 ∗ ⋯∗ 2 ∗ 1
𝑛 − 1 !


function [f] = factRic(n)
if (n == 0)
f = 1;
else
f = n * factRic(n - 1);
end

function [f] = factRic(n)
if (n == 0)
f = 1;
else
f = n * factRic(n - 1);
end
0! = 1

function [f] = factRic(n)
if (n == 0)
f = 1;
else
f = n * factRic(n - 1);
end 𝑛! = 𝑛 ∗ 𝑛 − 1 !


function [f]=factRic(n)
if (n==0)
f=1;
else
f=n*factRic(n-1);
end

function [f]=factRic(n)
if (n==0)
f=1;
else
f=n*factRic(n-1);
end
factRic(3)

function [f]=factRic(n)
if (n==0)
f=1;
else
f=n*factRic(n-1);
end
factRic(3)

function [f]=factRic(n)
if (n==0)
f=1;
else
f=n*factRic(n-1);
end
factRic(3)

function [f]=factRic(n)
if (n==0)
f=1;
else
f=n*factRic(n-1);
end
factRic(3)

function [f]=factRic(n)
if (n==0)
f=1;
else
f=n*factRic(n-1);
end
factRic(3)

function [f]=factRic(n)
if (n==0)
f=1;
else
f=n*factRic(n-1);
end
factRic(3)

function [f]=factRic(n)
if (n==0)
f=1;
else
f=n*factRic(n-1);
end
factRic(3)

function [f]=factRic(n)
if (n==0)
f=1;
else
f=n*factRic(n-1);
end
factRic(3)

function [f]=factRic(n)
if (n==0)
f=1;
else
f=n*factRic(n-1);
end
factRic(3)
ans =
6

function [f]=factRic(n)
if (n==0)
f=1;
else
f=n*factRic(n-1);
end

function [f]=factRic(n)
f=n*factRic(n-1);

function [f]=factRic(n)
if (n==0)
f=1;
else
f=n*factRic(n-1);
end

function [f]=factRic(n)
if (n==0)
f=1;
else
f=n*factRic(n);
end

>> factRic(600)
Maximum recursion limit of 500 reached. Use
set(0,'RecursionLimit',N) to change the limit. Be aware that
exceeding your available stack space can crash MATLAB
and/or your computer.
Error in factRic

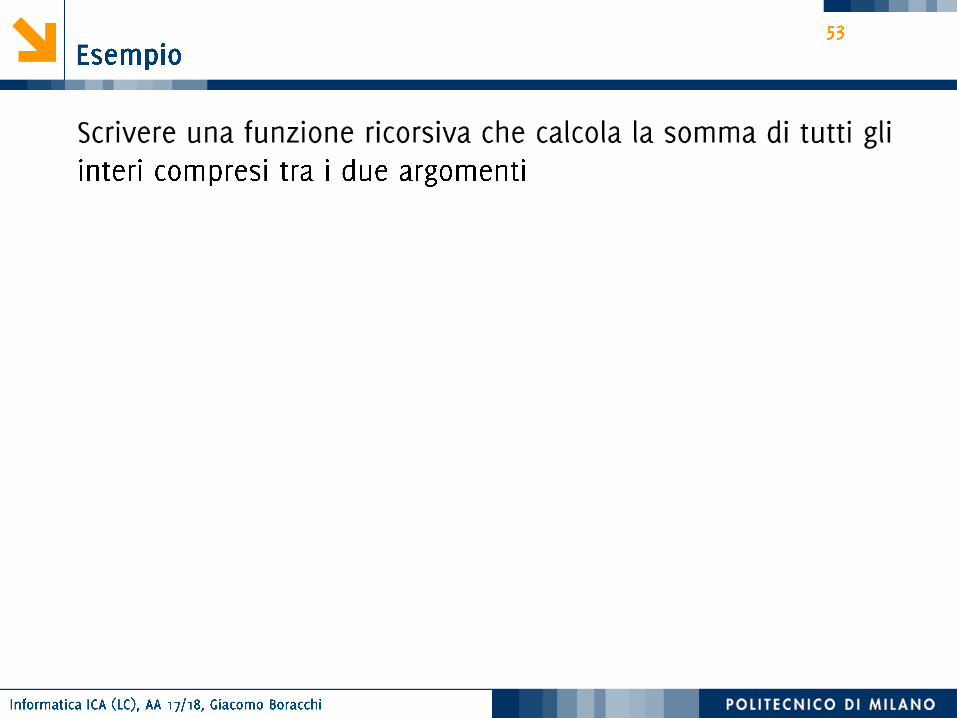

function somma = sommaNumeriCompresi(a ,b)
if a == b
somma = a;
disp(['caso base somma vale ' , num2str(somma)]);
else
disp(['prima chiamata a = ' ,num2str(a)]);
somma = a + sommaNumeriCompresi(a+1 , b);
disp(['dopo chiamata a = ' ,num2str(a)]);
end

function somma=calcolaSommaCompresi2(a_temp,b_temp)
a=min([a_temp,b_temp]);
b=max([a_temp,b_temp]);
if(a==b)
disp(['caso base 1 a=',num2str(a),'b=',num2str(b)])
somma=a;
else
if(b-a==1)
disp(['caso base 2 a=',num2str(a),'b=',num2str(b)])
somma=a+b;
else
disp(['prima della chiamata ricorsiva a=',num2str(a),'b=',num2str(b)])
somma=a+calcolaSommaCompresi2(a+1,b-1)+b;
disp(['dopo la chiamata ricorsiva a=',num2str(a),'b=',num2str(b),'
somma =',num2str(somma)])
end
end
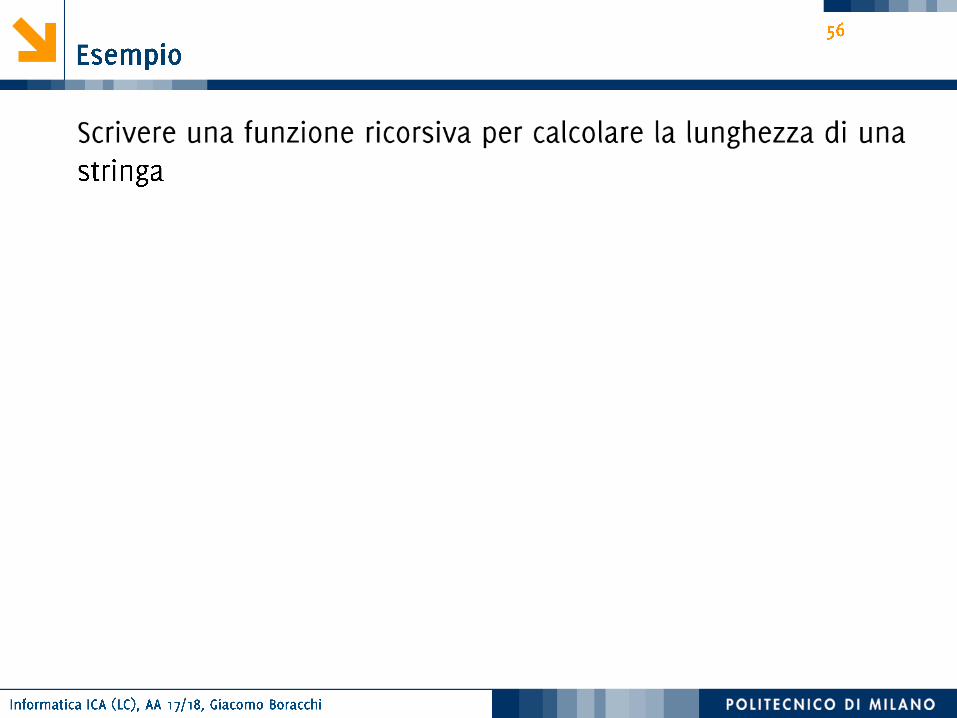

function s = calcolaLunghezza(str)
if(isempty(str))
s = 0;
else
s = 1 + calcolaLunghezza(str(2 : end));
end

function stampaAlContrario(frase)
% caso base
if isempty(frase)
% return
else
% chiamata ricorsiva
disp(frase(end)); % stampa al contrario
stampaAlContrario(frase(1:end-1))
end

function stampaAlContrario(frase)
% caso base
if isempty(frase)
% return
else
% chiamata ricorsiva
stampaAlContrario(frase(1:end-1))
disp(frase(end)); % stampa dritto
end

function stampa(frase)
% caso base
if isempty(frase)
% return
else
stampa(frase(2:end))
disp(frase(1));
end

function stampa(vettore)
if (length(vettore)==1)
% caso base
fprintf('%c',vettore(1));
fprintf('%c',vettore(1));
else
fprintf('%c',vettore(1));
stampa(vettore(2:end));
fprintf('%c',vettore(1));
end

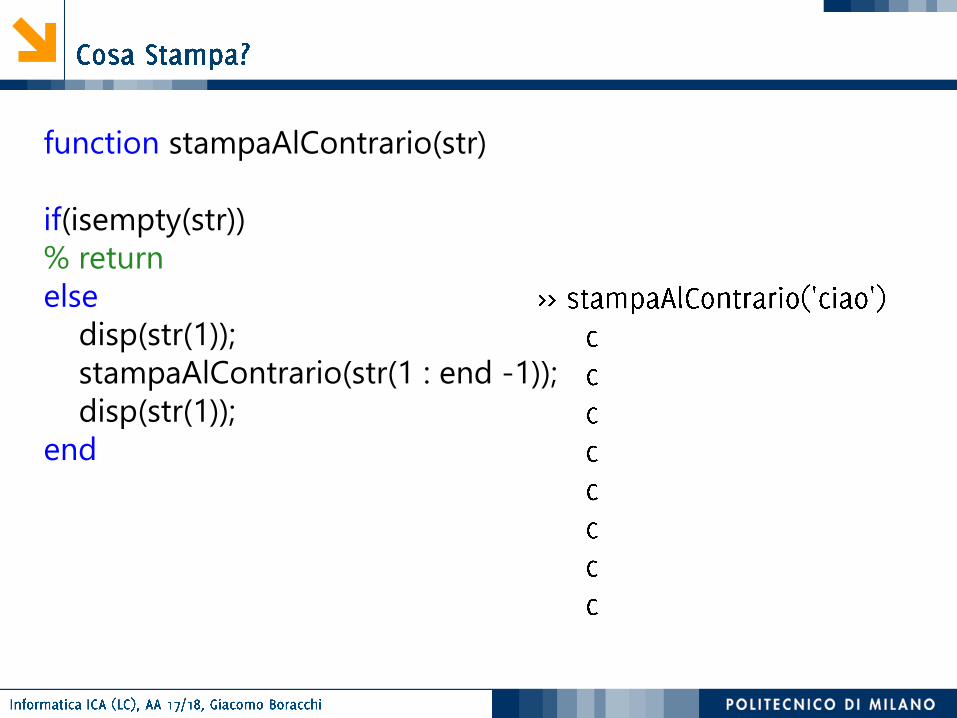
function stampaAlContrario(str)
if(isempty(str))
% return
else
disp(str(end));
stampaAlContrario(str(1 : end -1));
disp(str(end));
end

function stampaAlContrario(str)
if(isempty(str))
% return
else
disp(str(end));
stampaAlContrario(str(1 : end -1));
disp(str(end));
end

function stampaAlContrario(str)
if(isempty(str))
% return
else
disp(str(end));
stampaAlContrario(str(2 : end));
disp(str(end));
end

function stampaAlContrario(str)
if(isempty(str))
% return
else
disp(str(end));
stampaAlContrario(str(2 : end));
disp(str(end));
end

function stampaAlContrario(str)
if(isempty(str))
% return
else
disp(str(1));
stampaAlContrario(str(2 : end));
disp(str(1));
end

function stampaAlContrario(str)
if(isempty(str))
% return
else
disp(str(1));
stampaAlContrario(str(2 : end));
disp(str(1));
end

function stampaAlContrario(str)
if(isempty(str))
% return
else
disp(str(1));
stampaAlContrario(str(1 : end -1));
disp(str(1));
end
function stampaAlContrario(str)
if(isempty(str))
% return
else
disp(str(1));
stampaAlContrario(str(1 : end -1));
disp(str(1));
end

30
12
12
18
6
18
6 6

function [M]=MCDeuclidRic(m,n)
if m==n
M=m;
else
if m>n
M = MCDeuclidRic(m-n,n);
else
M = MCDeuclidRic(m,n-m);
end
end

−
−
−
−

– –
+
+
1 1
1
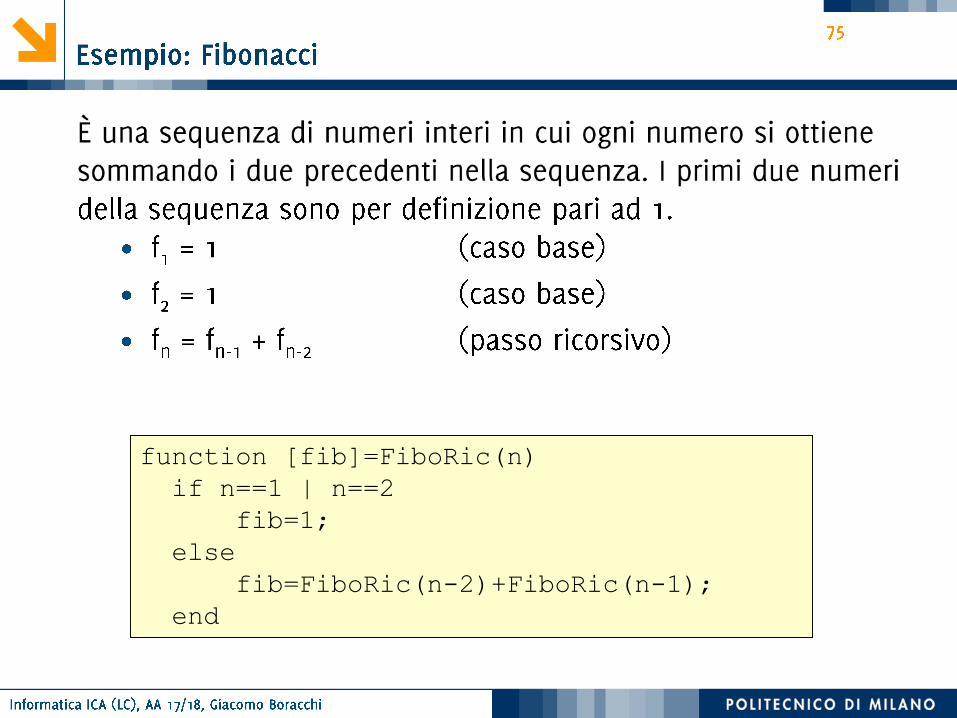
function [fib]=FiboRic(n)
if n==1 | n==2
fib=1;
else
fib=FiboRic(n-2)+FiboRic(n-1);
end

function [fl]=Fiblist(n)
fl(1)=1;
fl(2)=1;
for k=3:n
fl(k)=fl(k-2)+fl(k-1);
end


1 n = 0
1 1 n = 1
1 2 1 n = 2
1 3 3 1 n = 3
1 4 6 4 1 n = 4
1 5 10 10 5 1 n = 5
1 6 15 20 15 6 1 n = 6


function gg = stagno(n, f, N)
% caso base: se ho già N ninfee nello stagno
% non devo aspettare alcun giorno
if (n >= N)
gg = 0;
else
% non abbiamo ancora N ninfee -> chiamata ricorsiva:
% il numero di giorni necessari per coprire lo stagno è
% uguale a: un giorno +
% il numero di giorni che saranno necessari domani
% (quando le ninfee saranno diventate n*f).
gg = 1 + stagno(n * f, f, N);
end

𝑛 𝑑 𝑛 𝑑

function [res , esp] = controllaSePotenzaDi(numero , base)
% caso base
if numero == base
res = 1;
esp = 1;
else
if(mod(numero , base) == 0)
% esp = esp + 1; % da errore
[res , esp] = controllaSePotenzaDi(numero/base , base);
esp = esp + 1;
else
res = 0;
esp = NaN;
end
end

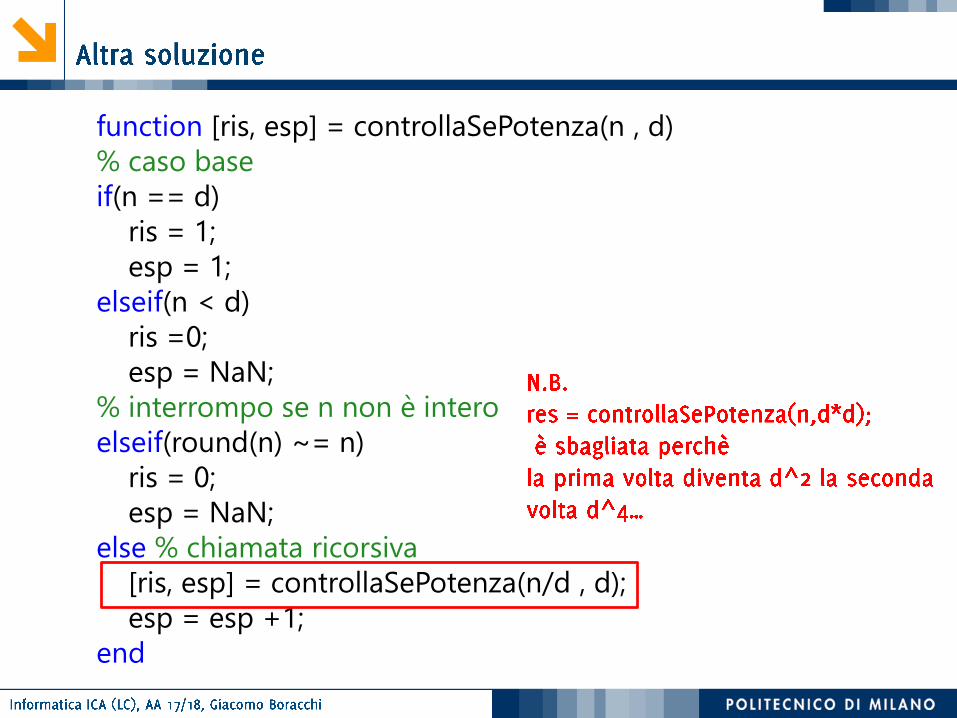
function [ris, esp] = controllaSePotenza(n , d)
% caso base
if(n == d)
ris = 1;
esp = 1;
elseif(n < d)
ris =0;
esp = NaN;
% interrompo se n non è intero
elseif(round(n) ~= n)
ris = 0;
esp = NaN;
else % chiamata ricorsiva
[ris, esp] = controllaSePotenza(n/d , d);
esp = esp +1;
end
function [ris, esp] = controllaSePotenza(n , d)
% caso base
if(n == d)
ris = 1;
esp = 1;
elseif(n < d)
ris =0;
esp = NaN;
% interrompo se n non è intero
elseif(round(n) ~= n)
ris = 0;
esp = NaN;
else % chiamata ricorsiva
[ris, esp] = controllaSePotenza(n/d , d);
esp = esp +1;
end

function r=cosafa(array)
k=size(array,2);
if (k == 1)
r = 1;
elseif (k==2)
if (array(1)+array(2)==10)
r = 1;
else
r=0;
end
else
if (array(1)+array(k)==10)
r = cosafa(array(2:k-1));
else
r=0;
end
end

function [ris] = mistero(v, n)
if (n > 1)
v2 = v(mod(v, n) ~= 0 | v == n);
ris = mistero(v2, n-1);
else
ris = v;
end

function [ris] = mistero(v, n)
if (n > 1)
v2 = v(mod(v, n) ~= 0 | v == n);
ris = mistero(v2, n-1);
else
ris = v;
end

function [ris] = mistero(v, n)
if (n > 1)
v2 = v(mod(v, n) ~= 0 | v == n);
ris = mistero(v2, n-1);
else
ris = v;
end

A = input('Inserisci un numero intero positivo: ');
ris = mistero(2:A, A);
disp(ris);


Un supermercato ha memorizzato il proprio archivio di
scontrini nel file scontrini.mat, che contiene l'array struttura
scontrini i cui elementi hanno i seguenti campi:
IDcliente: id numerico del cliente (>0)
totale: totale della spesa in Euro
punti: punti premio extra associati alle promozioni
Per ogni spesa, viene assegnato al cliente un quantitativo di
punti premio pari alla somma dei punti più un ulteriore punto
premio per ogni 10 euro spesi.
Scrivere uno script in MATLAB che legge il file scontrini.mat e
costruisce un opportuno array struttura saldo, contenente per
ciascun cliente, l’ID del cliente e il totale dei suoi punti premio.
Nota: Si faccia attenzione al fatto che un cliente può comparire
in più di uno scontrino

load scontrini
clienti = [scontrini.IDcliente];
saldo .ID=-1;
saldo .punti=0;
n=1; %contatore clienti unici in saldo
for cc = 1 : length(clienti)
if (~any([saldo.ID]==clienti(cc))
% considero il cliente solo se non è già presente nel saldo
ii = find(clienti==clienti(cc));
% tutti gli scontrini riferiti a clienti(cc)
pFagiolo = sum ([scontrini(ii).puntiFagiolo]);
% totale punti fagiolo
puntiSpesa = sum(floor([scontrini(ii).totale]/10)));
%totale punti per ogni 10 euro di spesa
saldo(n).ID = clienti(cc);
saldo(n).punti = pFagiolo + puntiSpesa;
n = n + 1;
end
end
Mette in un vettore tutti
gli elementi che compaiono
nei campi Idcliente dell’array
Di strutture scontrini
Inizializza l’array di
strutture saldo
Trova le posizioni
all’interno di scontrini
che hanno un campo
pari a clienti(cc)
Aggiungi l’elemento a
saldo

…
statistica(1)=sum([saldo.punti]<=1000);
statistica(2)=sum([saldo.punti]>1000 & [saldo.punti]<=5000);
statistica(3)=sum([saldo.punti]>5000);
Infine, si costruisca un array statistiche di tre elementi
rispettivamente pari al numero di clienti che possiede
meno di 1000 punti premio, il numero di clienti con più di
1000 punti ma meno di 5000 punti e infine il numero di
clienti con più di 5000 punti.


>> seno=@sinseno = @sin>> seno(pi/2)ans = 1
>> sq=@(x)x^2
sq = @(x)x^2
>> sq(8)
ans = 64

% definizione della funzione inline
h = @(x) -x
% valutazione della funzione h nei punti 2 e 9
h(2);
h(9);
% g che viene definita in maniera tale da operare su vettori
g = @(x)x.^2
g(2)
g([2 : 2])
g([-2 : 2])
% è possibile "comporre" le funzioni (si da l'output di g come input di h)
h(g([-2 : 2]))
% NB: non è possibile sommare i function hanldes
g + h


% creo una funzione per fare quello che fa g
function y = elevaAlQuadrato(x)
y = x.^2;
elevaAlQuadrato(8)
% faccio una funzione di ordine superiore
per valutare se una funzione (passata come argomento mediante un
function handle ) è idempotente in un punto x
% se f(f(x)) == f(x)
function res = controllaSeIdempotente(f , x)
if ( f(f(x)) == f(x))
res = 1;
else
res = 0;
end

% chiamata della funzione di ordine superiore
controllaSeIdempotente(g , 1)
% ma non funziona se passo la funzione elevaAlQuadrato
controllaSeIdempotente(elevaAlQuadrato , 1)
Error using elevaAlQuadrato (line 2)
Not enough input arguments.
% occorre creare un function handle per elevaAlQuadrato
controllaSeIdempotente(@elevaAlQuadrato, 1)
% oppure
controllaSeIdempotente(@(x)elevaAlQuadrato(x) , 2)
% il nome delle variabili utilizzate per definire function handle non
conta
k=@(asd) elevaAlQuadrato(asd)
controllaSeIdempotente(k , 2)

function [vout]=map(f, vin)
for ii=1:length(vin)
vout(ii)=f(vin(ii));
end;
>> A=[1,2,3,4,5,6];
>> map(sq,A)
ans = 1 4 9 16 25 36


[x] =acc(f, a, u)
function [x]=acc(f, a, u)
x=u;
for ii=1:length(a)
x=f(x, a(ii));
end

function [s]=sommatoria(a)
p = 1;
for ii = 1 : numel(x)
p= p * x(ii);
end
function [s]=sommatoria(a)
som=@(x,y)x+y;
s=acc(som,a,0);
function [s]=produttoria(a)
prd=@(x,y)x*y;
s=acc(prd,a,1);


𝑓𝑎, 𝑏
𝑓 𝑎 ∗ 𝑓 𝑏 ≤ 0
𝑐 ∈ 𝑎, 𝑏 𝑓 𝑐 = 0.
𝑓

𝑓𝑎, 𝑏
𝑓 𝑥 == 0
𝑓 𝑥 < 𝜖 𝜖


plot(x,y)
plot
plot(x,y) x y
xlabel
ylabel title

>> x = -10:0.1:10;
>> y=x.^3;
>> plot(x,y);
>> xlabel('ascisse');
>> ylabel('ordinate');
>> title('cubica');
-10 -8 -6 -4 -2 0 2 4 6 8 10-1000
-800
-600
-400
-200
0
200
400
600
800
1000
ascisse
ord
inate
cubica
>> x=[-8:0.1:8];
>> y= sin (x) ./ x;
>> plot(x, y);
>> xlabel('ascisse');
>> ylabel('ordinate');
-8 -6 -4 -2 0 2 4 6 8-0.4
-0.2
0
0.2
0.4
0.6
0.8
1
ascisse
ord
inate

plot(x,y) x
y x. x
y
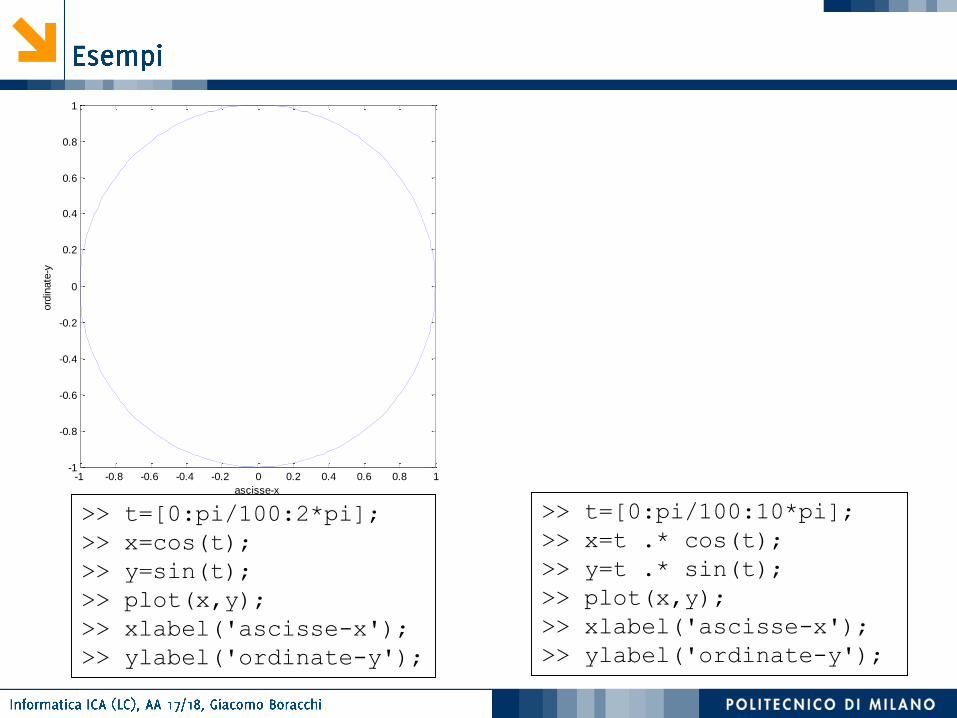
>> t=[0:pi/100:2*pi];
>> x=cos(t);
>> y=sin(t);
>> plot(x,y);
>> xlabel('ascisse-x');
>> ylabel('ordinate-y');
>> t=[0:pi/100:10*pi];
>> x=t .* cos(t);
>> y=t .* sin(t);
>> plot(x,y);
>> xlabel('ascisse-x');
>> ylabel('ordinate-y');

>> t=[0:pi/100:2*pi];
>> x=cos(t);
>> y=sin(t);
>> plot(x,y);
>> xlabel('ascisse-x');
>> ylabel('ordinate-y');

-1 -0.8 -0.6 -0.4 -0.2 0 0.2 0.4 0.6 0.8 1-1
-0.8
-0.6
-0.4
-0.2
0
0.2
0.4
0.6
0.8
1
ascisse-x
ord
inate
-y
>> t=[0:pi/100:2*pi];
>> x=cos(t);
>> y=sin(t);
>> plot(x,y);
>> xlabel('ascisse-x');
>> ylabel('ordinate-y');
-1 -0.8 -0.6 -0.4 -0.2 0 0.2 0.4 0.6 0.8 1-1
-0.8
-0.6
-0.4
-0.2
0
0.2
0.4
0.6
0.8
1
ascisse-x
ord
inate
-y
>> t=[0:pi/100:2*pi];
>> x=cos(t);
>> y=sin(t);
>> plot(x,y);
>> xlabel('ascisse-x');
>> ylabel('ordinate-y');
>> t=[0:pi/100:10*pi];
>> x=t .* cos(t);
>> y=t .* sin(t);
>> plot(x,y);
>> xlabel('ascisse-x');
>> ylabel('ordinate-y');

-1 -0.8 -0.6 -0.4 -0.2 0 0.2 0.4 0.6 0.8 1-1
-0.8
-0.6
-0.4
-0.2
0
0.2
0.4
0.6
0.8
1
ascisse-x
ord
inate
-y
-30 -20 -10 0 10 20 30 40-30
-20
-10
0
10
20
30
ascisse-x
ord
inate
-y
>> t=[0:pi/100:2*pi];
>> x=cos(t);
>> y=sin(t);
>> plot(x,y);
>> xlabel('ascisse-x');
>> ylabel('ordinate-y');
>> t=[0:pi/100:10*pi];
>> x=t .* cos(t);
>> y=t .* sin(t);
>> plot(x,y);
>> xlabel('ascisse-x');
>> ylabel('ordinate-y');

𝑦 = 𝐶 1 𝑥𝑛−1 + 𝐶 2 𝑥𝑛−2 + …+ 𝐶 𝑛 − 1 𝑥1 + 𝐶(𝑛)
𝑦 = 𝑥 – 1;𝑦 = 2 𝑥2 + 𝑥 – 12;𝑦 = −0.1𝑥3 + 2 𝑥2 − 10 𝑥 − 12

function [xx, yy] = samplePolynomial(polyCoeff, interval)
% determina 100 nell'intervallo interval
% appartenenti al polinomio avente coefficienti polyCoeff
% per essere certi che a <= b
a = min(interval);
b = max(interval);
xx = [a : (b-a) / 100 : b];
% oppure xx = linspace(a , b, 100)
yy = zeros(size(xx));
for ii = 1 : 1 : length(polyCoeff)
yy = yy + polyCoeff(ii) * xx.^(length(polyCoeff) - ii);
end

interval = [-10 , 10];
rettaCoeffs = [1 ,-1];
parabolaCoeffs = [ 2 , 1 , -12] ;
cubicaCoeffs = [-0.1 , 2 ,-10 , -12];
% calcola i valori dei polinomi
[rx,ry] = samplePolynomial(rettaCoeffs , interval);
[px,py] = samplePolynomial(parabolaCoeffs , interval);
[cx,cy] = samplePolynomial(cubicaCoeffs, interval);
% determina i punti ad ordinata maggiore per ogni ascissa
indx_r = find(ry > py & ry > cy);
indx_p = find(py > ry & py > cy);
indx_c = find(cy > py & cy > ry);

%plot polynomials
figure(2),
plot(rx, ry, 'k-');
hold on
plot(px, py , 'b-')
plot(cx, cy, 'r-')
% disegna il punto ad ordinata maggiore per ogni curva
plot(rx(indx_r), ry(indx_r) , 'ro' , 'LineWidth' , 2);
legend('retta' , 'parabola' , 'cubica' , 'maggiore')
plot(px(indx_p), py(indx_p) , 'ro' , 'LineWidth' , 2);
plot(cx(indx_c), cy(indx_c) , 'ro' , 'LineWidth' , 2);
hold off

plot3(x,y,z) x
y z
xlabel, ylabel, zlabel, title
-40
-20
0
20
40
-40
-20
0
20
400
10
20
30
40
ascisseordinate
quote
t = 0:0.1:10*pi;
plot3 (t.*sin(t), t.*cos(t), t);
xlabel('ascisse');
ylabel('ordinate');
zlabel('quote');

t = linspace(0,4*pi ,200);
plot_hnd = plot3(sin(t),cos(t),cos(3/2 *t))
set(plot_hnd, 'LineWidth', 3)
xlabel('ascisse');
ylabel('ordinate');
zlabel('quote');


t = linspace(0,4*pi ,200);
plot_hnd = plot3(sin(t),cos(t),cos(3/2 *t))
set(plot_hnd, 'LineWidth', 3)
xlabel('ascisse');
ylabel('ordinate');
zlabel('quote');
set(plot_hnd ,'LineStyle','none','Marker','o’,
'MarkerFaceColor ‘, [0 1 0],…
'MarkerEdgeColor',[1 0 1],…
'MarkerSize',5,'LineWidth' ,1.5)


mesh(xx,yy,zz)
• xx
• yy
• zz
xx yy
zz

meshgrid(x,y)
[xx,yy]= meshgrid(x,y)
• x y
• xx yy
xx x
yy
y


% Disegnamo z=x+y
x=[1, 3, 5];
y=[2, 4];
[xx, yy] = meshgrid(x, y);
zz = xx + yy;
mesh(xx, yy, zz);
xlabel('ascisse-x'); ylabel('ordinate-y');
(1,2,3) (3,2,5) (5,2,7)(1,4,5) (3,4,7) (5,4,9)
(NB: z=x+y)
1
2
3
4
5
2
2.5
3
3.5
4
3
4
5
6
7
8
9
ascisse-xordinate-y
(1,2) (3,2) (5,2)(1,4) (3,4) (5,4)
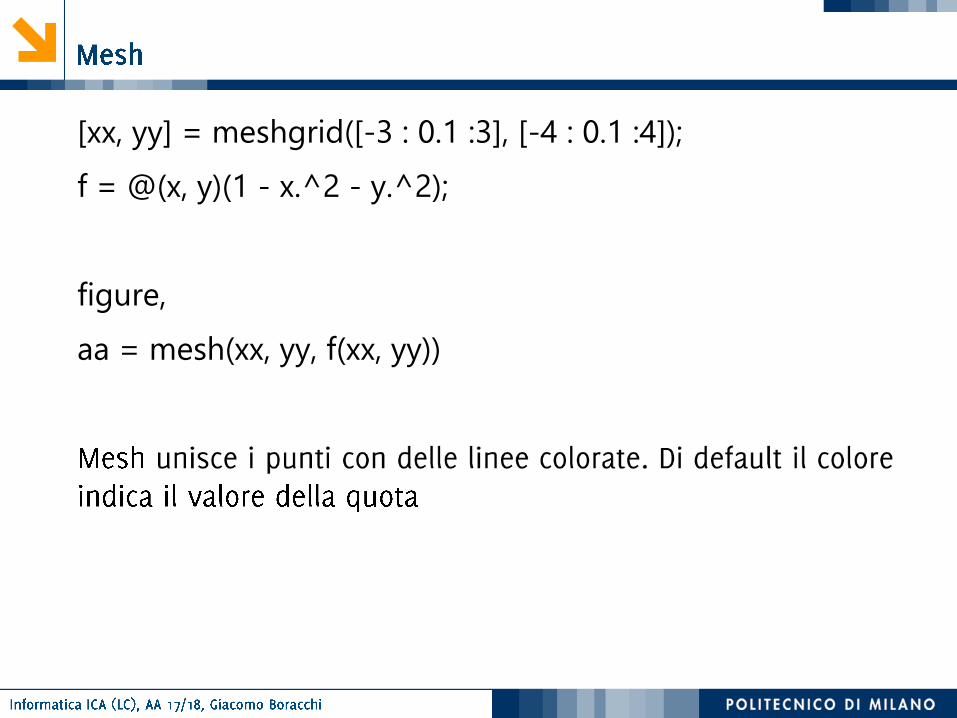
[xx, yy] = meshgrid([-3 : 0.1 :3], [-4 : 0.1 :4]);
f = @(x, y)(1 - x.^2 - y.^2);
figure,
aa = mesh(xx, yy, f(xx, yy))


[xx, yy] = meshgrid([-3 : 0.1 :3], [-4 : 0.1 :4]);
f = @(x, y)(1 - x.^2 - y.^2);
figure,
aa = surf(xx, yy, f(xx, yy))
set(aa, 'EdgeColor', 'none')


[xx, yy] = meshgrid([-3 : 0.1 :3], [-4 : 0.1 :4]);
f = @(x, y)(1 - x.^2 - y.^2);
figure,
aa = surf(xx, yy, f(xx, yy))
set(aa, 'EdgeColor', 'none')
light % aggiunge una sorgente luminosa per il rendering


hold on
hold off

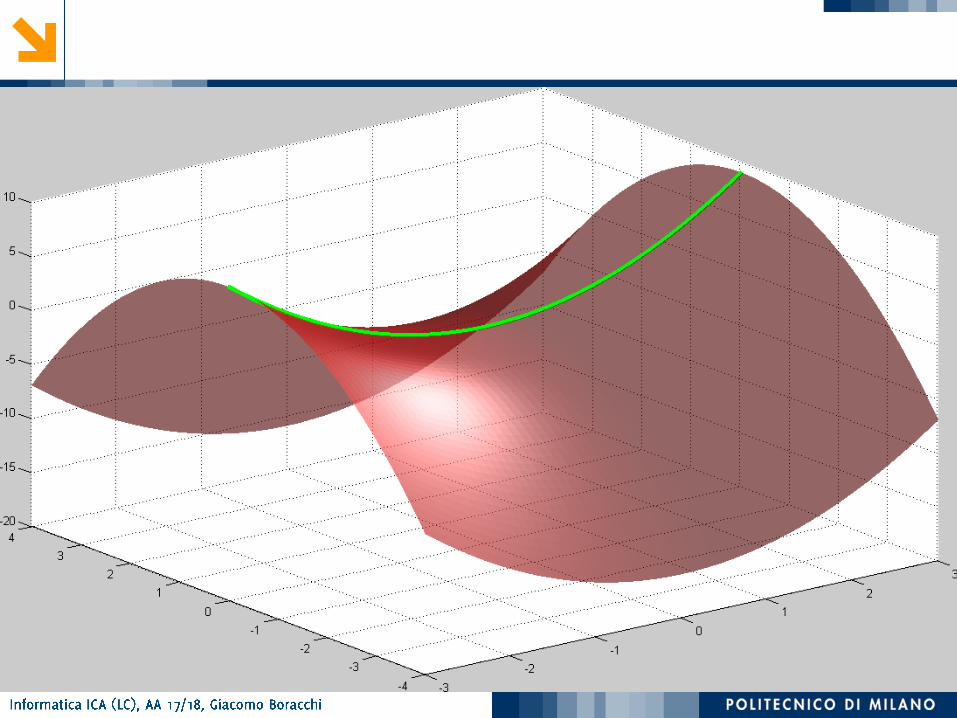
𝑧 = 𝑥2 − 𝑦2 ቊ𝑧 = 𝑥2
𝑦 = 0
[xx, yy] = meshgrid([-3 : 0.1 :3], [-4 : 0.1 :4]);
f = @(x, y)(x.^2 - y.^2);
figure(),
aa = surf(xx, yy, f(xx, yy))
hold on
x = xx(1, :);
y = zeros(size(x));
bb = plot3(x, y, f(x,y), 'g-')
set(aa, 'EdgeColor', 'none', 'FaceColor', 'red', 'FaceAlpha', 0.6)
set(bb, 'Linewidth', 3)
light
hold off

𝑧 =sin 𝑥2 + 𝑦2
𝑥2 + 𝑦2
tx=[-8:0.1:8];
ty=tx;
[xx, yy] = meshgrid (tx, ty);
f = @(x,y)(sin(sqrt(x.^2 + y.^2)) ./ sqrt(x.^2 + y.^2));
figure,
aa = surf(xx, yy, f(xx, yy));
hold on
bb = plot3(tx, tx, f(tx, tx), 'r-' ,'LineWidth', 3)
set(aa, 'EdgeColor', 'none')


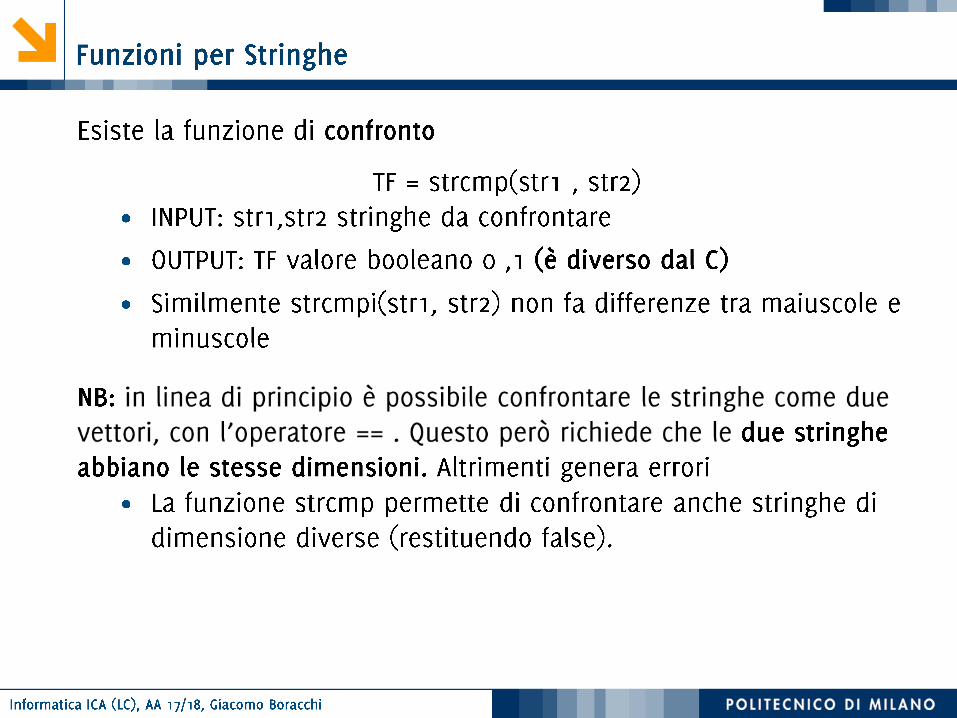

if('cane'== 'canguro')
disp('uguali')
else
disp('diverse')
End
if strcmp('cane','canguro')
disp('uguali')
else
disp('diverse')
end


function [p,m]=cercaMultiplo(v, a)
for k = 1 : length(a)
if mod(a(k), v)==0
p=k; m=a(k);
return; %si restituisce il primo multiplo incontrato
% evita ulteriori inutili calcoli
end;
end;
p=0; m=0; %eseguite solo se non trovato alcun multiplo


−
−
−
−


![Version Control with Git - Politecnico di Milanohome.deib.polimi.it/...media=teaching:aos:2017:aos_l2_version_control_with_git.pdf · [--git-dir=] [--work-tree=]](https://img.dokumen.tips/doc/110x75/5dd098dcd6be591ccb61c348/version-control-with-git-politecnico-di-teachingaos2017aosl2versioncontrolwithgitpdf.jpg)


![An Effective Just-in-Time Adaptive Classifier for Gradual ...home.deib.polimi.it/boracchi/docs/2011_01_IJCNN_Drift_Alippi_Bora… · [14] suggests a method for identifying a suitable](https://img.dokumen.tips/doc/110x75/5ea7a357aab24158431658f6/an-effective-just-in-time-adaptive-classifier-for-gradual-homedeib-14-suggests.jpg)