Embed Size (px)
Citation preview
INFOMAR: An Introduction and Invitation to INFOMAR 2012
Koen Verbruggen
Presented by Janine Guinan
Geological Survey of Ireland 10th October, 2012
GEOSEAS Seminar
Cork
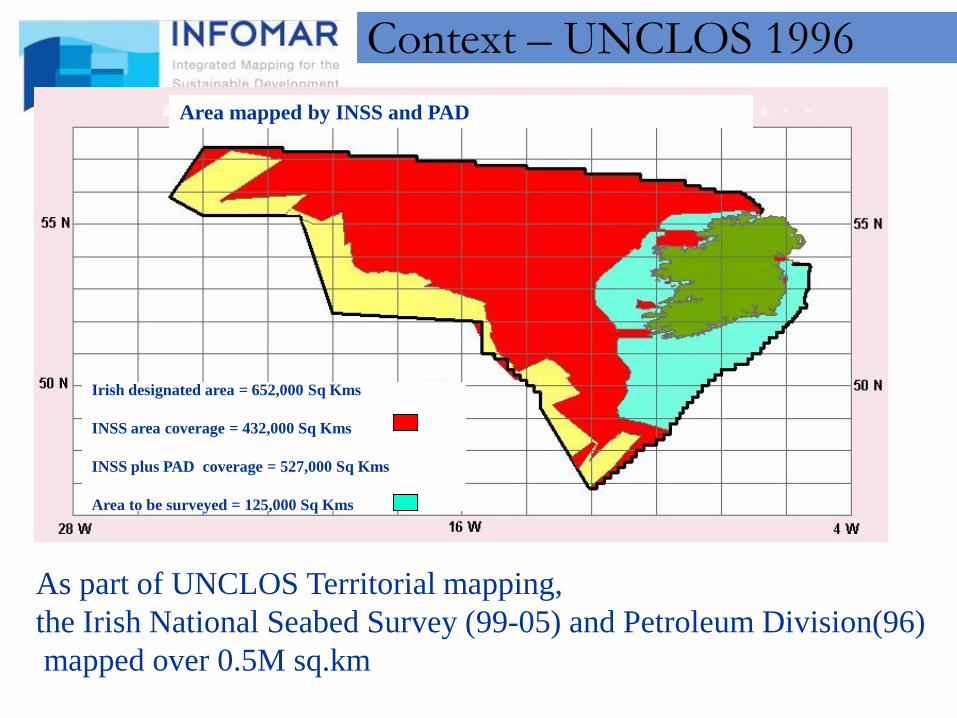
As part of UNCLOS Territorial mapping, the Irish National Seabed Survey (99-05) and Petroleum Division(96) mapped over 0.5M sq.km
Area mapped by INSS and PAD
Irish designated area = 652,000 Sq Kms INSS area coverage = 432,000 Sq Kms INSS plus PAD coverage = 527,000 Sq Kms Area to be surveyed = 125,000 Sq Kms
Context – UNCLOS 1996

A1
Zone A1 = 147,375km2
B1
Zone B1 = 56,470km2
C1
Zone C1 =27,590km2
Making Ireland bigger!
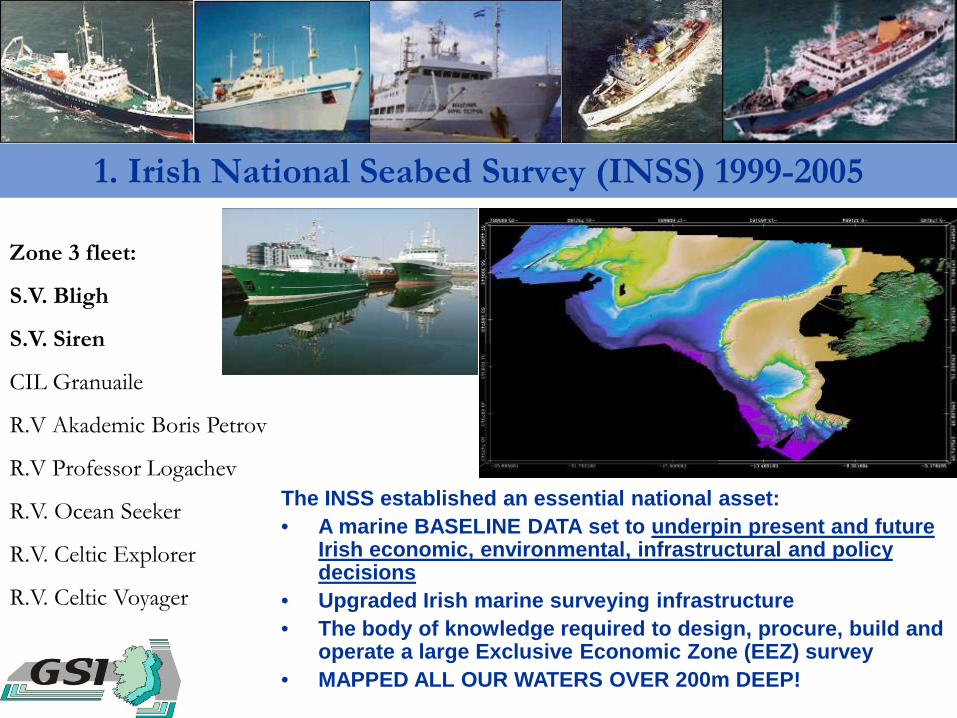
1. Irish National Seabed Survey (INSS) 1999-2005
Zone 3 fleet:
S.V. Bligh
S.V. Siren
CIL Granuaile
R.V Akademic Boris Petrov
R.V Professor Logachev
R.V. Ocean Seeker
R.V. Celtic Explorer
R.V. Celtic Voyager
The INSS established an essential national asset: • A marine BASELINE DATA set to underpin present and future
Irish economic, environmental, infrastructural and policy decisions
• Upgraded Irish marine surveying infrastructure • The body of knowledge required to design, procure, build and
operate a large Exclusive Economic Zone (EEZ) survey • MAPPED ALL OUR WATERS OVER 200m DEEP!
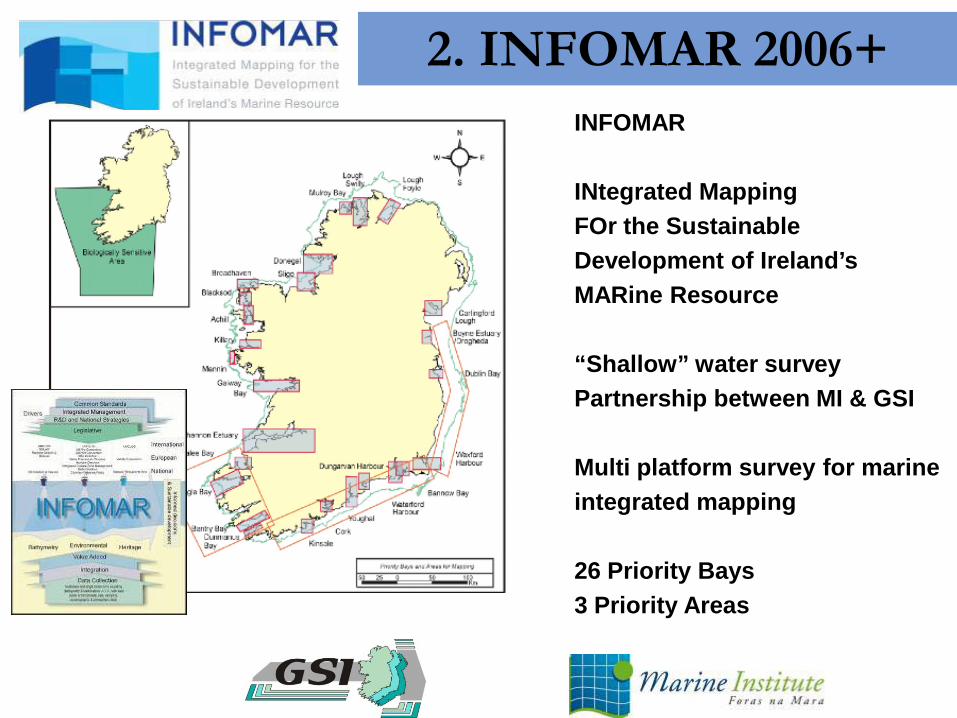
2. INFOMAR 2006+ INFOMAR INtegrated Mapping FOr the Sustainable Development of Ireland’s MARine Resource “Shallow” water survey Partnership between MI & GSI Multi platform survey for marine integrated mapping 26 Priority Bays 3 Priority Areas

Why Government mapping? Not profitable for private sector to map all areas
Long term commitment required
Needs to be done to a high standard
Data can then be shared to all users
Can leverage expertise across several Depts/Agencies Why DCENR/GSI? Started with UNCLOS/Territorial definition in 1960’s (GSI)
Continued with UNCLOS PAD Mapping 1996
National Seabed Survey concept of Ray Keary, GSI
Have now built up the expertise, equipment & networks NB ALL data freely available over the web
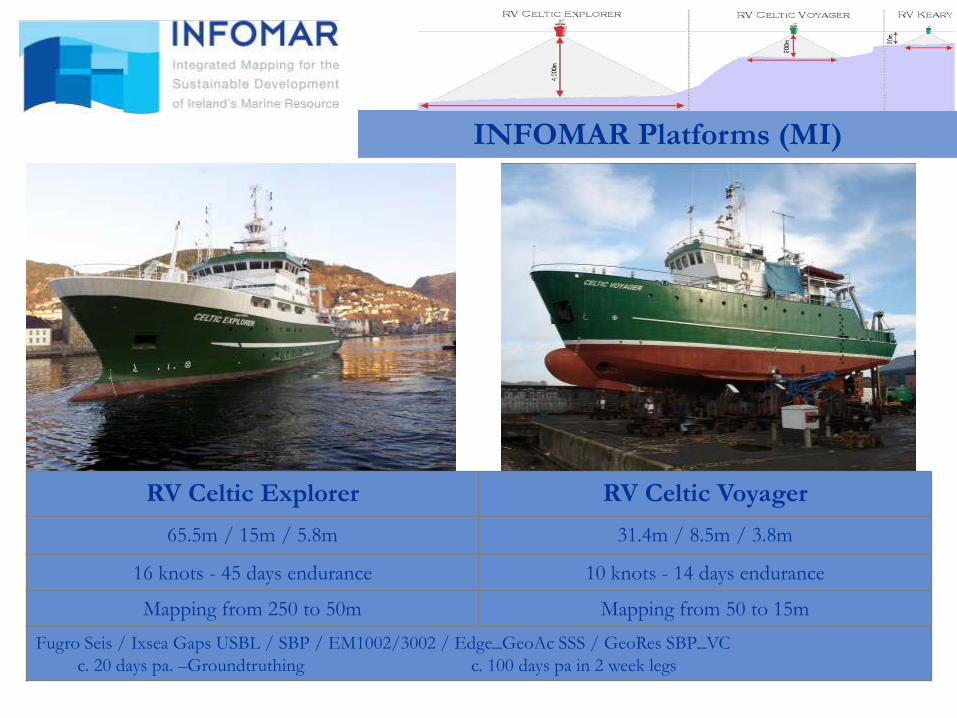
INFOMAR Platforms (MI)
RV Celtic Explorer RV Celtic Voyager 65.5m / 15m / 5.8m 31.4m / 8.5m / 3.8m
16 knots - 45 days endurance 10 knots - 14 days endurance
Mapping from 250 to 50m Mapping from 50 to 15m Fugro Seis / Ixsea Gaps USBL / SBP / EM1002/3002 / Edge_GeoAc SSS / GeoRes SBP_VC c. 20 days pa. –Groundtruthing c. 100 days pa in 2 week legs

RV Keary RV Geo
15.5m / 5.6m / 1.5m 7.4m Redbay Rib
22 knots 30 knots / 300 NM
2-3 days endurance 1 day endurance POS MV inertial navigation systems - Sonardyne USBL - MBES Simrad EA400-EM3002D
Marine Magnetics magnetometer - Edgetech 4200 SSS - SBP Chirp profiler -SBP Geo- Resources 200. GEO : SEA Swath Interferometric Mapping system
c. 180 days p.a. each vessel, daylight ops
INFOMAR Platforms (GSI)

INFOMAR Platforms (GSI)
Cosantóir Bradán •MoU Inshore Fisheries Ireland 17 m mono-hull Shallow draft MBES – Reson7101
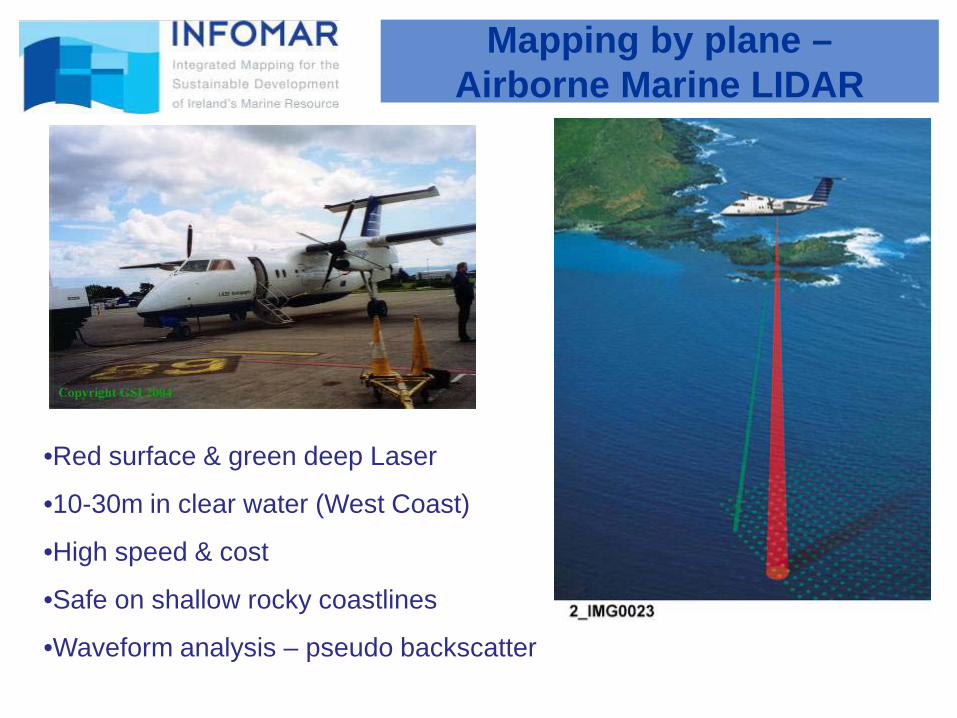
•Red surface & green deep Laser
•10-30m in clear water (West Coast)
•High speed & cost
•Safe on shallow rocky coastlines
•Waveform analysis – pseudo backscatter
Mapping by plane – Airborne Marine LIDAR

Satellite mapping
•WorldView-2 Satellite
•Map of Wexford Harbour derived from satellite Imagery
•Useful overview but not accurate •enough for shipping safety

Marine Safety/Charting
A steep outcrop of rock rising to a chart depth of 12.2 metres in surrounding water depths of 30 to 40 metres (charted as >30m) In an area designated for safe “refuge” for bigger ships
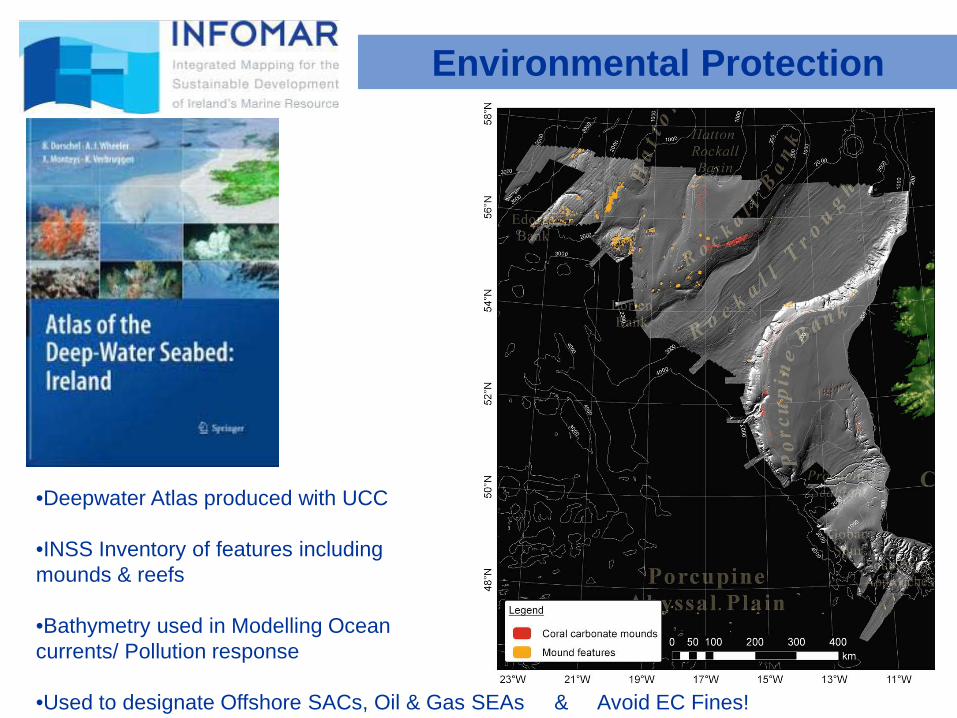
Environmental Protection
•Deepwater Atlas produced with UCC
•INSS Inventory of features including mounds & reefs
•Bathymetry used in Modelling Ocean currents/ Pollution response
•Used to designate Offshore SACs, Oil & Gas SEAs & Avoid EC Fines!


Fishing/Aquaculture
Accurate bathymetry helps modelling and locating of fish farms Collaboration with BIM Recently completed Inishturk & Inishbofin

Ocean Energy – Wind & Wave
Seabed mapping vital to location of Ocean Energy devices - wave & wind. Current modelling & site selection.
INFOMAR Marine Mapping Study Options Appraisal – July 2008
But is it really worth it?
Pricewaterhouse Coopers
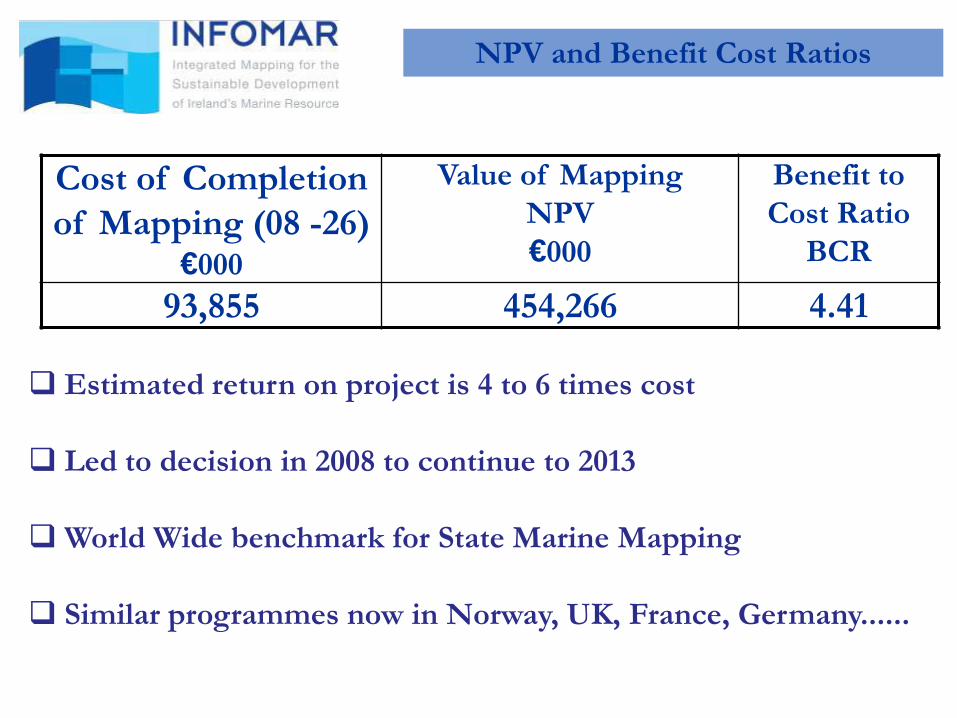
Cost of Completion of Mapping (08 -26)
€000
Value of Mapping NPV €000
Benefit to Cost Ratio
BCR
93,855 454,266 4.41
Estimated return on project is 4 to 6 times cost
Led to decision in 2008 to continue to 2013
World Wide benchmark for State Marine Mapping
Similar programmes now in Norway, UK, France, Germany......
NPV and Benefit Cost Ratios
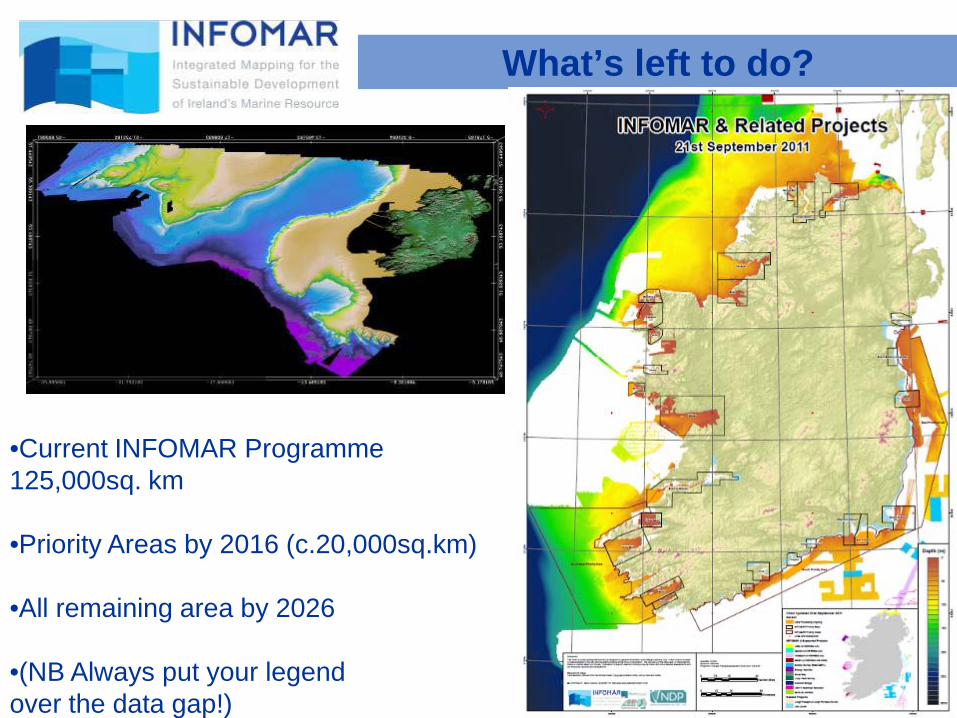
What’s left to do?
•Current INFOMAR Programme 125,000sq. km
•Priority Areas by 2016 (c.20,000sq.km)
•All remaining area by 2026
•(NB Always put your legend over the data gap!)

INFOMAR SEMINAR 2012 October 11 & 12 “Enabling our Ocean Management”
• Survey Progress • Ocean Energy
• Environmental & Habitat Mapping • Aquaculture & Fisheries
• Hydrography & Operations • Heritage Mapping • Applied Research
All
Welcome