Embed Size (px)
Citation preview

Influenza UpdateJanuary 10, 2017

Overview
• Update on influenza-like-illness (ILI) • Update on IHS influenza vaccine coverage• Area Reports
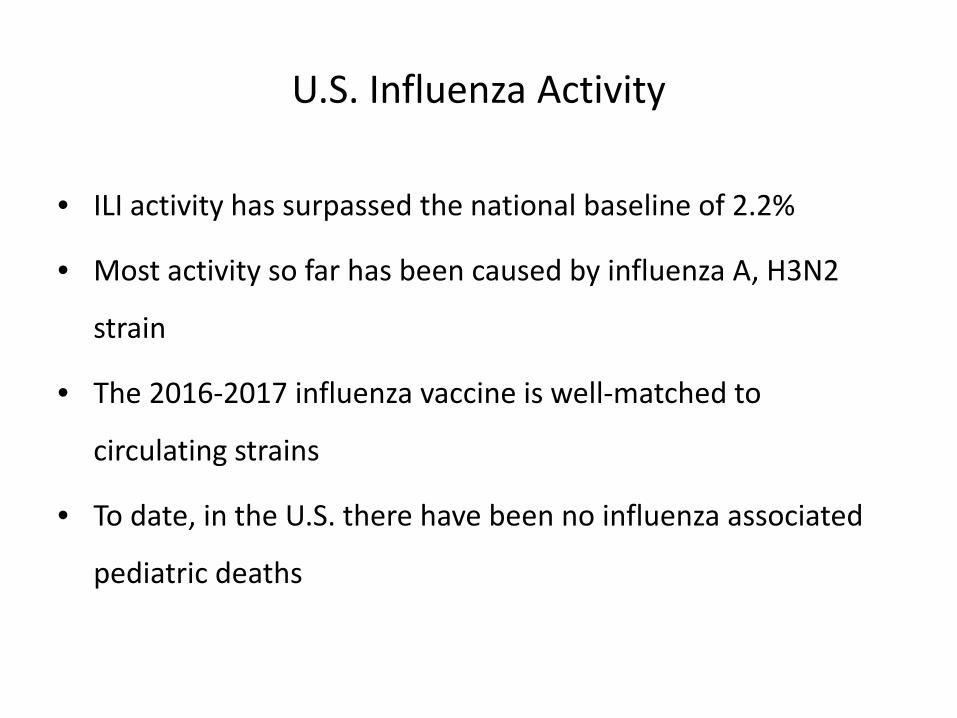
U.S. Influenza Activity
• ILI activity has surpassed the national baseline of 2.2%
• Most activity so far has been caused by influenza A, H3N2
strain
• The 2016-2017 influenza vaccine is well-matched to
circulating strains
• To date, in the U.S. there have been no influenza associated
pediatric deaths


U.S. Influenza Vaccine Supply
• Influenza vaccine supply:– Projected: 157 million - 168 million doses
• Distributed doses as of 12/30/16:– 143.7 million doses
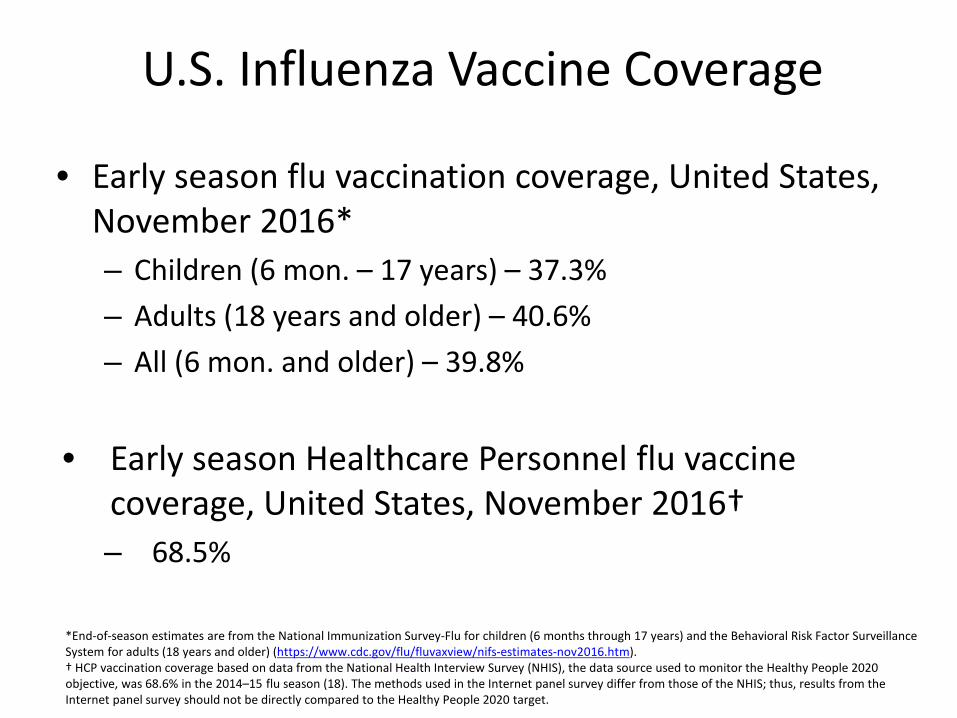
U.S. Influenza Vaccine Coverage
• Early season flu vaccination coverage, United States, November 2016*– Children (6 mon. – 17 years) – 37.3%– Adults (18 years and older) – 40.6%– All (6 mon. and older) – 39.8%
• Early season Healthcare Personnel flu vaccine coverage, United States, November 2016†– 68.5%
*End-of-season estimates are from the National Immunization Survey-Flu for children (6 months through 17 years) and the Behavioral Risk Factor Surveillance System for adults (18 years and older) (https://www.cdc.gov/flu/fluvaxview/nifs-estimates-nov2016.htm).† HCP vaccination coverage based on data from the National Health Interview Survey (NHIS), the data source used to monitor the Healthy People 2020 objective, was 68.6% in the 2014–15 flu season (18). The methods used in the Internet panel survey differ from those of the NHIS; thus, results from the Internet panel survey should not be directly compared to the Healthy People 2020 target.

IHS Influenza Awareness Systemas of 12/31/2016
• Influenza-like-illness (ILI) activity is beginning to increase across a majority of IHS Regions
• ~276,000 doses of influenza vaccine have been administered in IHS
• Weekly IIAS reports now available on the IHS Flu Website– www.ihs.gov/flu
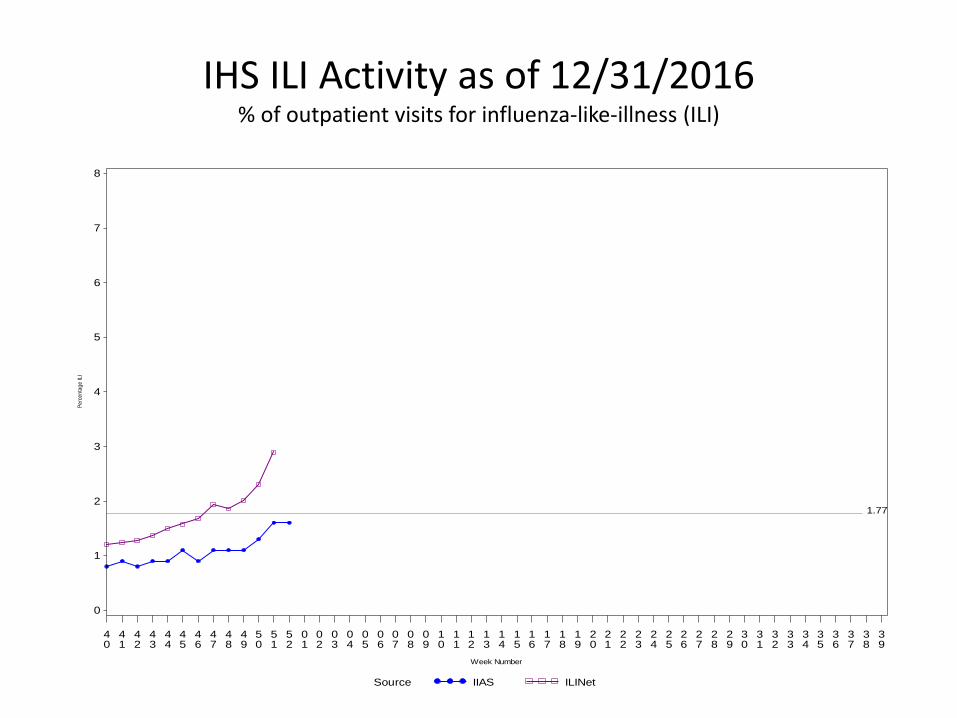
IHS ILI Activity as of 12/31/2016% of outpatient visits for influenza-like-illness (ILI)
1.77
Perc
enta
ge IL
I
0
1
2
3
4
5
6
7
8
Week Number
40
41
42
43
44
45
46
47
48
49
50
51
52
01
02
03
04
05
06
07
08
09
10
11
12
13
14
15
16
17
18
19
20
21
22
23
24
25
26
27
28
29
30
31
32
33
34
35
36
37
38
39
Source IIAS ILINet
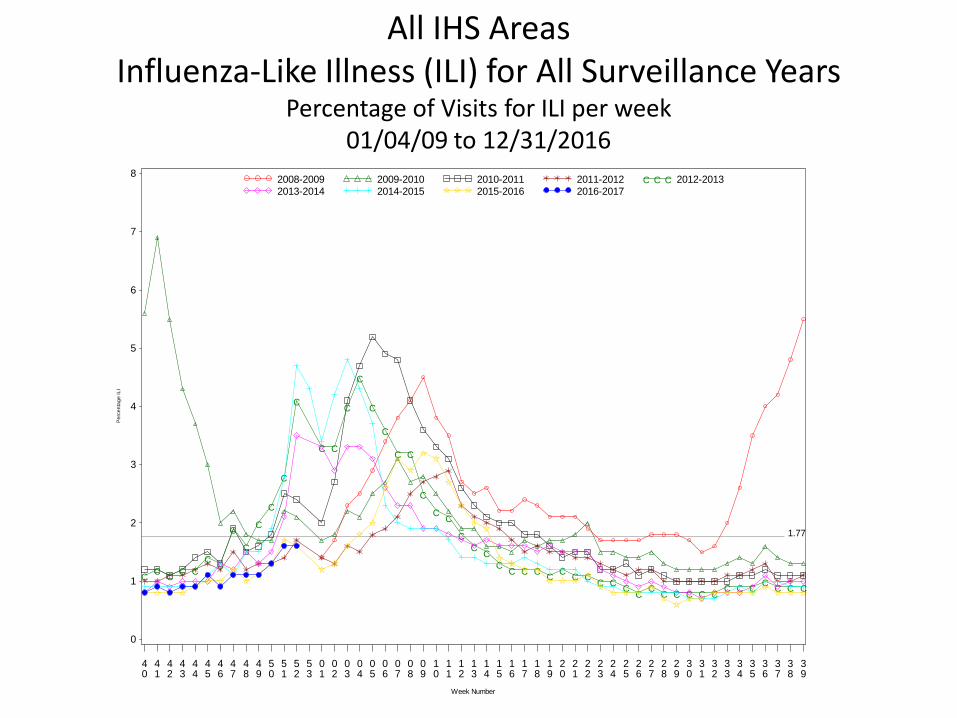
All IHS AreasInfluenza-Like Illness (ILI) for All Surveillance Years
Percentage of Visits for ILI per week01/04/09 to 12/31/2016
1.77
Per
cent
age
ILI
0
1
2
3
4
5
6
7
8
Week Number
40
41
42
43
44
45
46
47
48
49
50
51
52
53
01
02
03
04
05
06
07
08
09
10
11
12
13
14
15
16
17
18
19
20
21
22
23
24
25
26
27
28
29
30
31
32
33
34
35
36
37
38
39
2008-2009 2009-2010 2010-2011 2011-2012 2012-20132013-2014 2014-2015 2015-2016 2016-2017
C C C
C C C C CC C
C
C
C
C
C
C
C C
C
C
C
C
C C
C
C C
CC C
C C C C C C C C C C C C C C C C C C C C C C C C C

Percent of visits for ILI as of 12/31/2016
% ILI
6% - +
5% - 5.9%
4% - 4.9%
3% - 3.9%
2% - 2.9%
1% - 1.9%
0% - 0.9%
No report
Alaska
Albuquerque
BemidjiBillings
California
Great Plains
Nashville
Navajo
Oklahoma
Phoenix
Portland
Tucson
IHS INFLUENZA VACCINE COVERAGE Week 52

Influenza Vaccination Coverage by Age Group*
Age Group Active ClinicalPopulation**
Seasonal Flu Vaccine(At Least 1 Dose)***
% Seasonal Flu(At Least 1 Dose)
Seasonal Flu Vaccine(At Least 2 Doses)
% Seasonal Flu(At Least 2 Doses)
Total #DosesAdministered****
0 - 5 months 4,398 37 0.8 0 0.0 38
6 - 23 months 21,343 9,327 43.7 1,566 7.3 10,951
2 - 4 years 52,466 12,481 23.8 240 0.5 12,815
5 - 17 years 197,398 55,199 28.0 327 0.2 55,911
18 - 49 years 402,484 90,369 22.5 402 0.1 91,549
50 - 64 years 169,096 61,142 36.2 343 0.2 62,053
65 + years 97,000 42,661 44.0 289 0.3 43,394
Children (6 months-17years) 271,207 77,007 28.4 2,133 0.8 79,677
Adults (18 + years) 668,580 194,172 29.0 1,034 0.2 196,996
All (6 months +) 939,787 271,179 28.9 3,167 0.3 276,673
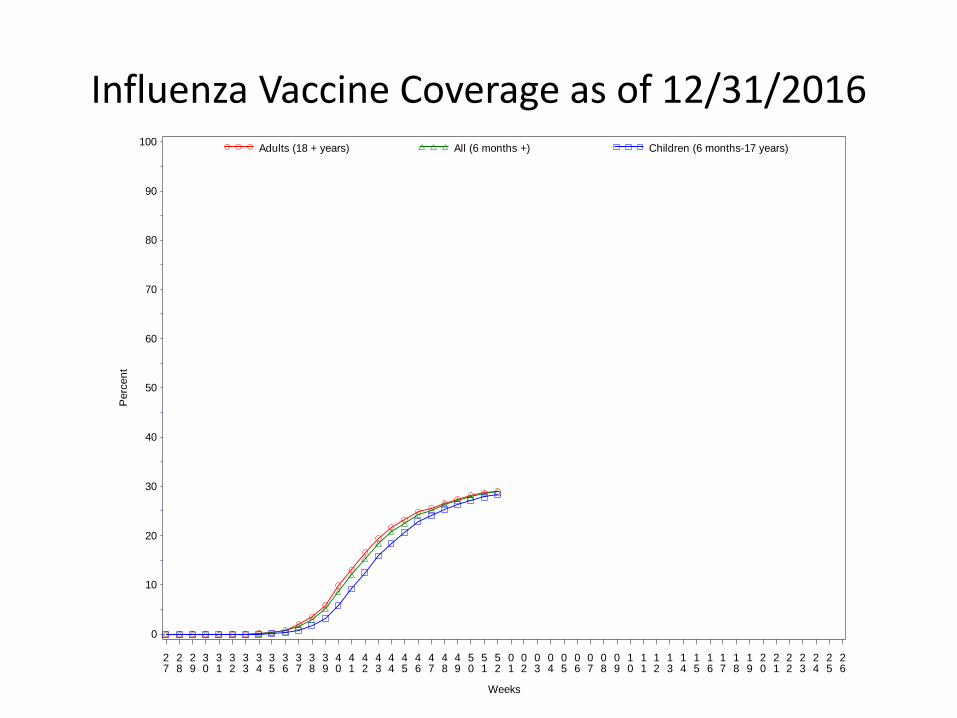
Influenza Vaccine Coverage as of 12/31/2016 P
erce
nt
0
10
20
30
40
50
60
70
80
90
100
Weeks
27
28
29
30
31
32
33
34
35
36
37
38
39
40
41
42
43
44
45
46
47
48
49
50
51
52
01
02
03
04
05
06
07
08
09
10
11
12
13
14
15
16
17
18
19
20
21
22
23
24
25
26
Adults (18 + years) All (6 months +) Children (6 months-17 years)
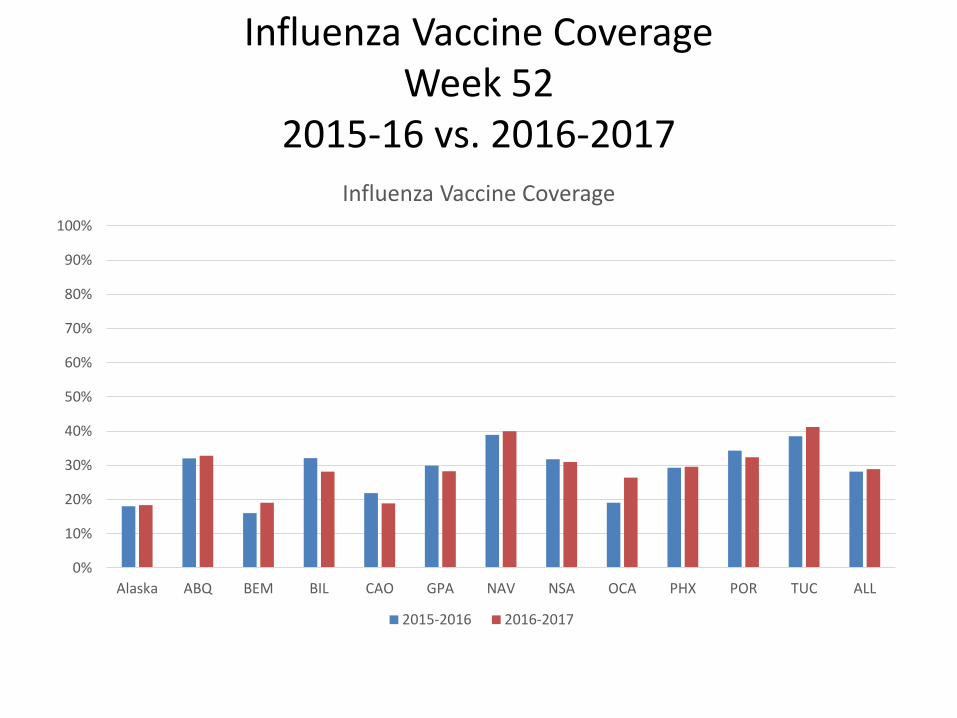
Influenza Vaccine CoverageWeek 52
2015-16 vs. 2016-2017
0%
10%
20%
30%
40%
50%
60%
70%
80%
90%
100%
Alaska ABQ BEM BIL CAO GPA NAV NSA OCA PHX POR TUC ALL
Influenza Vaccine Coverage
2015-2016 2016-2017

Influenza Vaccine Doses Administered by Influenza Vaccine Type*
Area
INACTIVE
CVXCODES*
CVX88
FLU-NOS**
CVX111FLU-
LAIV3
CVX135FLU-HIGH
CVX140FLU-
IIV3pf
CVX141FLU-IIV3
CVX144FLU-
DERMAL
CVX149FLU-LAIV
4
CVX150FLU-
IIV4pf
CVX153FLU-
ccIIV3
CVX155FLU-RIV3
CVX158IIV4
CVX161
IIV4pf-ped
CVX166
Proc99.52VacInf
ICD-9V04.8
1VacInf
CPTBilling
Codes+
Cumulative
# of Doses
SeasonalFlu
AKA 3 238 0 394 39 548 1 0 5152 0 2 3120 375 19 0 0 47 9938
ALB 1 158 0 1256 521 9358 1 0 4274 0 6 1907 583 1 0 0 80 18146
BEM 264 82 0 374 9 2020 0 1 3479 5 4 3272 229 41 0 1 158 9939
BIL 5 231 0 882 12 2090 0 0 9647 0 0 1631 848 141 0 0 110 15597
CAO 12 176 0 1320 20 2548 1 7 7692 0 2 4490 1296 59 0 2 111 17736
GPA 3 391 0 1029 137 11670 0 0 11386 12 26 5150 963 9 0 0 87 30863
NSA 200 329 0 349 115 5181 213 0 3816 4 18 340 131 316 0 0 113 11125
NAV 24 299 1 1720 20 9367 9 0 11829 0 1 39134 2369 1023 0 0 167 65963
OKC 254 1761 0 2361 11 25198 7 1 8175 1 13 2189 1281 531 0 0 215 41998
PHX 2 451 0 1142 27 8261 12 0 18014 0 19 404 1861 1 0 0 232 30426
POR 8 351 1 709 1142 7562 10 1 4632 28 19 2942 305 1106 0 0 756 19572
TUC 0 46 0 28 24 8 0 0 5788 1 0 34 369 0 0 0 36 6334
HQ 0 2 0 0 0 0 0 0 0 0 0 0 0 0 0 0 0 2
776 4515 2 11564 2077 83811 254 10 93884 51 110 64613 10610 3247 0 3 2112 277639
* Inactive CVX Codes 15 (FLU-TIVhx), 16 (FLU-WHOLE), 123 (FLU-H5N1), and 151 (FLU-NasNOS) should not be used to document flu vaccines given this flu season. Doses are NOT deduplicated.** CVX Code 88 (FLU-NOS) should only be used to document flu vaccines given elsewhere when flu vaccine type is unknown.+ CPT Flu codes include: 90654-90662, 90672-90673, 90685-90686, 90724, G0008, G8108. ̂ICD9 codes V04.8 and V06.6 are not displayed on this report and are not used in any of the influenza vaccine coverage calculations.

Summary
• Influenza is increasing across the country• Seasonal influenza vaccine appears to be well
matched to circulating strains• It’s not too late to get vaccinated
– Less than 1/3 of the IHS patient population has received an influenza vaccine