Embed Size (px)
Citation preview

Influenza and Other Respiratory Viruses:Surveillance in the Americas 2019
p

Washington, D.C., 2020

Washington, D.C., 2020
p
Influenza and Other Respiratory Viruses:Surveillance in the Americas 2019

Influenza and Other Respiratory Viruses: Surveillance in the Americas 2019
© Pan American Health Organization, 2020
ISBN: 978-92-75-12278-5eISBN: 978-92-75-12279-2
Some rights reserved. This work is available under the Creative Commons Attribution-NonCommercial-ShareAlike 3.0 IGO license (CC BY-NC-SA 3.0 IGO; https://creativecommons.org/licenses/by-nc-sa/3.0/igo).
Under the terms of this license, this work may be copied, redistributed, and adapted for non-commercial purposes, provided the new work is issued using the same or equivalent Creative Commons license and it is appropriately cited, as indicated below. In any use of this work, there should be no suggestion that the Pan American Health Organization (PAHO) endorses any specific organization, product, or service. Use of the PAHO logo is not permitted.
Adaptations: If this work is adapted, the following disclaimer should be added along with the suggested citation: “This is an adaptation of an original work by the Pan American Health Organization (PAHO). Views and opinions expressed in the adaptation are the sole responsi-bility of the author(s) of the adaptation and are not endorsed by PAHO.”
Translation: If this work is translated, the following disclaimer should be added along with the suggested citation: “This translation was not created by the Pan American Health Organization (PAHO). PAHO is not responsible for the content or accuracy of this translation.”
Suggested citation. Influenza and Other Respiratory Viruses: Surveillance in the Americas 2019. Washington, D.C.: Pan American Health Organization; 2020. License: CC BY-NC-SA 3.0 IGO.
Cataloguing-in-Publication (CIP) data. CIP data are available at http://iris.paho.org.
Sales, rights, and licensing. To purchase PAHO publications, visit http://publications.paho.org. To submit requests for commercial use and queries on rights and licensing, visit http://www.paho.org/permissions.
Third-party materials. If material that is attributed to a third party, such as tables, figures, or images, is reused from this work, it is the user’s responsibility to determine whether permission is needed for that reuse and to obtain permission from the copyright holder. The risk of claims resulting from infringement of any third-party-owned material or component from this work rests solely with the user.
General disclaimers. The designations employed and the presentation of the material in this publication do not imply the expression of any opinion whatsoever on the part of PAHO concerning the legal status of any country, territory, city, or area or of its authorities, or con-cerning the delimitation of its frontiers or boundaries. Dotted and dashed lines on maps represent approximate border lines for which there may not yet be full agreement.
The mention of specific companies or of certain manufacturers’ products does not imply that they are endorsed or recommended by PAHO in preference to others of a similar nature that are not mentioned. Errors and omissions excepted, the names of proprietary products are distinguished by initial capital letters.
All reasonable precautions have been taken by PAHO to verify the information contained in this publication. However, the published ma-terial is being distributed without warranty of any kind, either expressed or implied. The responsibility for the interpretation and use of the material lies with the reader. In no event shall PAHO be liable for damages arising from its use.
PHE/IHM/2020

Influenza and Other Respiratory Viruses: Surveillance in the Americas 2019 / 3
Contents
Acronyms 4
Case Definitions 4
Background 5
Regional Data 7
Country Indicators Table 8
PCR Influenza Surveillance 9
RSV Surveillance 10
SARI/ILI Surveillance 11
Frequency of Reporting 12
Shipments to WHO Collaborating Center at U.S. CDC 13
Influenza Vaccine 14
World Bank Income Groups 16
Virologic Surveillance Data 17
SARI Surveillance Data 18
Country Data 19
Anguilla 21
Antigua and Barbuda 24
Argentina 27
Aruba 30
Bahamas 33
Barbados 36
Belize 39
Bolivia (Plurinational State of) 42
Brazil 45
British Virgin Islands 48
Canada 51
Cayman Islands 54
Chile 57
Colombia 60
Costa Rica 63
Cuba 66
Dominica 69
Dominican Republic 72
Ecuador 75
El Salvador 78
Grenada 81
Guatemala 84
Haiti 87
Honduras 90
Jamaica 93
Mexico 96
Nicaragua 99
Panama 102
Paraguay 105
Peru 108
Saint Lucia 111
Saint Vincent and the Grenadines 114
Suriname 117
Trinidad and Tobago 120
United States of America 123
Uruguay 126
Venezuela (Bolivarian Republic of) 129
Survey Questionnaire

4 / Influenza and Other Respiratory Viruses: Surveillance in the Americas 2019
Acronyms
ARI acute respiratory infectionEQAP External Quality Assessment ProjectFluID flu-informed decisionsHAI hemagglutination inhibitionICD-10 International Classification of Diseases, 10th revisionIF immunofluorescence assayILI influenza-like illnessORV other respiratory virusesPISA pandemic influenza severity assessmentRSV respiratory syncytial virusRT-PCR reverse transcription polymerase chain reactionSARI severe acute respiratory infection
Severe Acute Respiratory Infection (SARI)
An acute respiratory infection with: history of fever or measured
fever ≥ 38 °C; and cough; with onset within the last 10 days; and
requires hospitalization. (WHO, 2014)
Influenza-Like Illness (ILI)
An acute respiratory infection with: measured fever ≥ 38 °C and
cough; with onset within the last 10 days. (WHO, 2014)
Case Definitions

Influenza and Other Respiratory Viruses: Surveillance in the Americas 2019 / 5
Since 2009, pandemic surveillance systems in the countries of the Americas have improved both their laboratory capacity to detect influenza and other respiratory viruses and their ability to characterize those viruses genetically, clinically, and epidemiologically. More recently, countries of the Region have also improved their ability to assess the severity of seasonal influenza epidemics and potential pandemics. In most of the Region, the first surveillance systems developed were laboratory-based; they made it possible to detect a novel influenza sub-type if clinical samples were collected and tested in the laboratory. Since then, several other systems have been developed that complement and integrate with the laboratory surveillance platforms. These systems make it possible to monitor influenza and detect new subtypes of influ-enza virus that have the potential to become a pandemic, pneumonia, or clinical influenza proxy syndromes—e.g., an influenza-like illness (ILI) or severe acute respiratory infection (SARI) in ambulatory and hospitalized settings. By using automated and integrated systems such as PAHOFlu to collect, process, analyze, and generate reports, it is possible to obtain information and monitor events under surveillance in real time. These developments mean there are now a variety of surveillance systems that contribute to understanding influenza and other respiratory viruses na-tionally, regionally, and globally. This report is a compilation of the respiratory virus surveillance systems in countries throughout the Americas, and is an update to the publication Influenza and Other Respiratory Virus Surveillance Systems in the Americas, 2017. The 2019 inventory includes two sections: regional analyses and country-by-country analyses. The first section includes regional data, maps showing surveillance capacities in the Region, and the frequency with which data are reported to FluID and FluNet. The country-by-country section includes information about epidemiological and laboratory surveillance, and focuses on four areas:
Area 1• Sociodemographic indicatorsArea 2• Surveillance systems• Surveillance mapsArea 3• Country epidemiologic and laboratory dataArea 4• FluNet/FluID reporting profile• Influenza vaccine profile• Pandemic influenza preparedness planning profile• Human-animal interface for influenza profile• Laboratory capacity profile• Influenza disease burden profile The data were obtained by PAHO/WHO directly from the countries and territories from one or more sources: online surveys administered by PAHO/WHO and completed by epidemiologists and/or national labora-tory coordinators; influenza bulletins published online and distributed by the countries; and through consultation with influenza surveillance co-ordinators in the countries. Each country’s document was submitted to the corresponding national counterpart for revision and approval before publication.
Profiles are organized in alphabetical order and include all countries that responded to requests for data and approval in a timely manner; in the case of a country that was non-responsive, if data had been provided for the 2017 publication, those data are included here.
Background


Influenza and Other Respiratory Viruses: Surveillance in the Americas 2019 / 7
Regional Data2019

8 / Influenza and Other Respiratory Viruses: Surveillance in the Americas 2019
Note on SARI/ILI Surveillance
Country Indicators Table
CountrySARI
Surveillance*ILI
Surveillance*
National Influenza
Center
RT-PCR Surveillance for Influenza
2018 EQAP Participation
FluID Reporting
FluNet Reporting
Anguilla3,3 No No No No NA In progress YesAntigua and Barbuda3,3 Yes No No No Yes In progress YesArgentina1,1 Yes Yes Yes Yes Yes Yes YesAruba1,2 Yes No No No NA Yes YesBahamas1,2 Yes No No No NA Yes YesBelize3,3 No No No No Yes In progress YesBolivia (Plurinational State of)1,1 Yes Yes Yes Yes Yes Yes YesBrazil1,1 Yes Yes Yes Yes Yes In progress YesBritish Virgin Islands3,3 No No No No No Yes YesCanada4,1 Yes Yes Yes Yes Yes Yes YesCayman Islands1,2 Yes No No No No Yes YesChile1,1 Yes Yes Yes Yes Yes Yes YesColombia1,1 Yes Yes Yes Yes Yes Yes YesCosta Rica1,1 Yes Yes Yes Yes Yes Yes YesCuba1,1 Yes Yes Yes Yes Yes Yes YesDominica2,3 Yes No No No No Yes YesDominican Republic1,2 Yes No Yes Yes Yes Yes YesEcuador1,2 Yes No Yes Yes Yes Yes YesEl Salvador1,1 Yes Yes Yes Yes Yes Yes YesGrenada3,3 No No No No No In progress YesGuatemala1,1 Yes Yes Yes Yes Yes Yes YesGuyana3,1 No No No Yes Yes In progress YesHaiti1,1 Yes Yes Yes Yes Yes Yes YesHonduras1,1 Yes Yes Yes Yes Yes Yes YesJamaica1,1 Yes Yes Yes Yes Yes Yes YesMexico1,1 Yes Yes Yes Yes Yes In progress YesNicaragua1,1 Yes Yes Yes Yes Yes Yes YesPanama1,1 Yes Yes Yes Yes Yes Yes YesParaguay1,1 Yes Yes Yes Yes Yes Yes YesPeru1,1 Yes Yes Yes Yes Yes Yes YesSaint Lucia1,1 Yes Yes No Yes Yes Yes YesSaint Vincent and the Grenadines1,2 Yes Yes No No No In progress YesSuriname1,1 Yes Yes Yes Yes Yes Yes YesTrinidad and Tobago1,2 Yes No Yes Yes Yes Yes YesUnited States of America4,1 Yes Yes Yes Yes Yes Yes YesUruguay1,1 Yes Yes Yes Yes Yes Yes YesVenezuela (Bolivarian Republic of)3,3 No No Yes Yes No Yes Yes
*SARI/ILI Surveillance1 = SARI/ILI surveillance established: Frequent reporting during January-December 20192 = SARI/ILI surveillance being established: Infrequent reporting and PAHO verification of SARI/ILI sites3 = SARI/ILI surveillance not established: No reporting and no verification of SARI/ILI sites4 = Hospital-based active surveillance but not using WHO SARI case definition

Influenza and Other Respiratory Viruses: Surveillance in the Americas 2019 / 9
PCR Surveillancen PCR Surveillancen No PCR Surveillance
Caribbean and Central America
In 2018, 78% (n=29) of
participating labs attained a score of
90% or greater on the WHO EQAP for
influenza
Countries Conducting Influenza Surveillance by RT-PCR
©Mapbox ©OSM
10 / Influenza and Other Respiratory Viruses: Surveillance in the Americas 2019
Countries Conducting Respiratory Syncytial Virus (RSV) Surveillance
RSV Surveillancen PCR Surveillancen No PCR Surveillance
Caribbean and Central America
Most countries use their SARI and ILI
systems to identify possible RSV cases.
©Mapbox ©OSM

Influenza and Other Respiratory Viruses: Surveillance in the Americas 2019 / 11
Countries Conducting SARI and ILI Surveillance
SARI Surveillancen SARI Surveillancen No SARI Surveillancen SARI Surveillance being established
ILI Surveillancen ILI Surveillancen No ILI Surveillance
Caribbean and Central America
Caribbean and Central America
SARI case definition:An acute respiratory
infection with: history of fever or measured fever of ≥ 38 °C; and cough;
with onset within the last 10 days; and requires
hospitalization.
ILI case definition:An acute respiratory
infection with: measured fever of ≥ 38 °C; and
cough; with onset within the last 10 days.
Severe Acute Respiratory Infection (SARI) Surveillance by Country
Influenza-Like Illness (ILI) Surveillance by Country
©Mapbox ©OSM
©Mapbox ©OSM

12 / Influenza and Other Respiratory Viruses: Surveillance in the Americas 2019
FluNet and FluID Reporting Frequency
Percentage of the epidemiological weeks for which data were reported to PAHO/WHOn < 25% n 25–49% n 50–74% n ≥ 75%
Percentage of the epidemiological weeks for which data were reported to PAHO/WHOn < 25% n 25–49% n 50–74% n ≥ 75%
Caribbean and Central America
Caribbean and Central America
FluNet is a global web-based tool for influenza virological surveillance first launched
in 1997. The virological data entered into FluNet, e.g. number of influenza viruses detected by subtype, are critical for tracking
the movement of viruses globally and interpreting the
epidemiological data.
FluID is a global platform for data-sharing that
links regional influenza epidemiological data into a single global database. The
platform accommodates both qualitative and quantitative data, which facilitates the tracking of global trends,
spread, intensity, and impact of influenza.
FluNet percentage of weeks reported in 2019
FluID percentage of weeks reported in 2019
©Mapbox ©OSM
©Mapbox ©OSM

Influenza and Other Respiratory Viruses: Surveillance in the Americas 2019 / 13
Shipment to WHO Collaborating Center at CDC
Number of Shipmentsn 1 shipmentn 2 shipmentsn 3 shipmentsn ≥ 4 shipments
No shipments
Caribbean and Central America
The WHO collaborating centers do additional
antigenic characterization and antiviral resistance
testing on samples sent to them from the countries.
©Mapbox ©OSM

14 / Influenza and Other Respiratory Viruses: Surveillance in the Americas 2019
Influenza Vaccine
n Northern hemispheren Southern hemisphere
Vaccine timingn April n September n November n May n October n December
Caribbean and Central America
Caribbean and Central America
Vaccine formulation
Vaccine timing during 2017–2018
©Mapbox ©OSM
©Mapbox ©OSM

Influenza and Other Respiratory Viruses: Surveillance in the Americas 2019 / 15
Influenza Vaccine
Children vaccine %
Elderly adult vaccine %
Caribbean and Central America
Caribbean and Central America
Percentage of children vaccinated during 2018
Percentage of elderly adults vaccinated during 2018
0.0 100.0
1.70 94.0
©Mapbox ©OSM
©Mapbox ©OSM

16 / Influenza and Other Respiratory Viruses: Surveillance in the Americas 2019
World Bank Income Classification
Income groupn High incomen Upper middle incomen Lower middle incomen Low income
Caribbean and Central America
The World Bank uses four income
groups to categorize countries
(as of June 2020).
©Mapbox ©OSM
Influenza and Other Respiratory Viruses: Surveillance in the Americas 2019 / 17
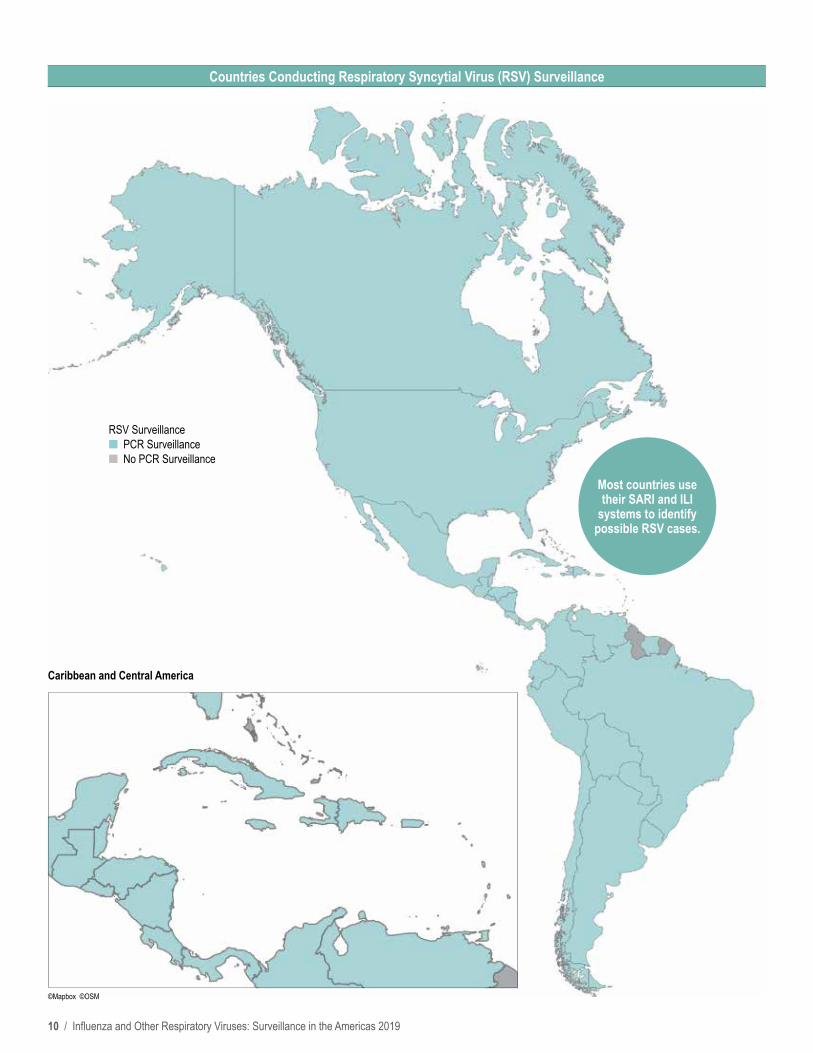
Regional Graphs
Distribution of Respiratory Syncytial Virus by Subregion, 2015–19
Distribution of Influenza Viruses by Subregion, 2015–19
2015 2016 2017 2018 2019
50474441383532292623201714118525047444138353229262320171411852504744413835322926232017141185250474441383532292623201714118525047444138353229262320171411852
Caribbean
Central America
Andean
Brazil andSouthern Cone
0%
10%
20%
30%
40%
% F
lu (+
) / %
RSV
(+)
0%
10%
20%
30%
40%
% F
lu (+
) / %
RSV
(+)
0%
10%
20%
30%
40%
% F
lu (+
) / %
RSV
(+)
0%
10%
20%
30%
40%
% F
lu (+
) / %
RSV
(+)
Influenza virusesn Influenza A(H1N1)pdm09 n Influenza A not subtyped n B Victoria n B lineage not determined n Influenza A(H3N2) n Influenza A not subtypeable n B Yamagata n % Flu (+)
Respiratory virusesn % RSV (+) n % Flu (+)
Epidemiological weeks
Epidemiological weeks

18 / Influenza and Other Respiratory Viruses: Surveillance in the Americas 2019
Regional Graphs
Percent positivity for influenza and RSV among SARI cases, 2015–19*
Percent of SARI cases among all hospitalizations and percent positivity for influenza among SARI cases, 2015–19*
n Flu (+) % n SARI (+) %
n RSV (+) % n % Flu (+)Epidemiological weeks
Epidemiological weeks
* Countries included in the above analyses: Caribbean: Barbados, Cuba, Dominica, Dominican Republic, Haiti, Jamaica, Saint Lucia, Suriname, Trinidad and Tobago; Central America: Costa Rica, El Salvador, Guatemala, Honduras, Nicaragua; Andean: Bolivia (Plurinational State of), Colombia, Ecuador, Peru; Brazil & Southern Cone: Argentina, Brazil, Chile, Paraguay, Uruguay.

Influenza and Other Respiratory Viruses: Surveillance in the Americas 2019 / 19
2019
Country and Territory Data2019

20 / Influenza and Other Respiratory Viruses: Surveillance in the Americas 2019

Influenza and Other Respiratory Viruses: Surveillance in the Americas 2019 / 21
POPULATIONPopulation (thousands)2: 15.0
Population density (per km2)3: 163.8Percentage of population < 5 years4: 7.8%
Percentage of population ≥ 65 years4: 7.5%
MORTALITYGross mortality rate (per 1,000 population)5: 4.8Mortality rate from all causes at < 5 years of age
(per 1,000 live births)5: 20.7Mortality rate due to communicable diseases
(per 100,000 population)5: 18.4
PUBLIC HEALTHNumber of medical doctors working in the public system
(per 10,000 population)5: NACurrent health expenditure per capita, PPP*
(current international $)6: NANational health expenditure as % of GDP 20165: NA
*PPP – Purchasing Power Parity
Anguilla
SURVEILLANCE SYSTEM CHARACTERISTICS INFORMATION SYSTEM
EventWHO case
definition used Surveillance
strategy
Clinical samples collected
from cases
Shipment of samples to NIC (or
laboratory)
Evaluation of surveillance
sites Number of sites Name
Laboratory and epidemiology
integrationOnline report
ARI No* Sentinel No Varies NA 5 NA NA No
PNEUMONIA No; ICD-10 codes (J12-J18) National 100% NA NA 1 NA NA Yes
INFLUENZA NA Sentinel NA NA NA 5 NA NA YesINFLUENZA MORTALITY NA National NA NA NA 1 NA NA NA
* ARI: Acute (sudden) febrile illness in a previously healthy person, presenting with cough or sore throat with or without respiratory distress.
Sociodemographic Indicators
Surveillance Systems
Surveillance Map
100+95 - 9990 - 9485 - 8980 - 8475 - 7970 - 7465 - 6960 - 6455 - 5950 - 5445 - 4940 - 4435 - 3930 - 3425 - 2920 - 2415 - 1910 - 14
5 - 90.-4
Population (in hundreds)
Male
Age Group Population (in hundreds)
Female
8 04.8 3.21.6 6.46.4 1.63.2 4.80 8
Anguilla, 20191
* The data in the sentinel surveillance map are updated as of January 2019. Population based on Core Indicators 2019: Health Trends in the Americas. Washington, D.C.: PAHO; 2019.
● SARI Hospitals (N=1)1. Princess Alexandra Hospital (Stoney Ground)
● ILI Centers (N=4)1. Welches Polyclinic (Welches)2. South Hill Clinic (South Hill)3. West End Clinic (West End)4. Her Majesty’s Prison (The Valley)
Pop.0 13,555

22 / Influenza and Other Respiratory Viruses: Surveillance in the Americas 2019
Influenza and Respiratory Syncytial Virus
Influenza-Like Illness (ILI)
Virologic data
Data from ambulatory cases8
Anguilla: Distribution of influenza viruses by epidemiological week
0 10 20 30Week
ILI C
ases
40
40
30
20
10
50
2013 2012 Threshold
Influenza virusesn Influenza A(H1N1)pdm09
n Influenza A(H3N2)
n Influenza A not subtyped
n Flu A Non subtypable
n Influenza B/Victoria
n Influenza B/Yamagata
n Influenza B/Lineage non-determined
n Influenza % positivity
Virus Percentages
n Influenza % positivity
n RSV (+) %
Anguilla: Cumulative percent positivity for influenza and respiratory syncytial virus
Severe Acute Respiratory Infection (SARI)
Data from severe cases
Not applicable
Influenza and Other Respiratory Viruses: Surveillance in the Americas 2019 / 23
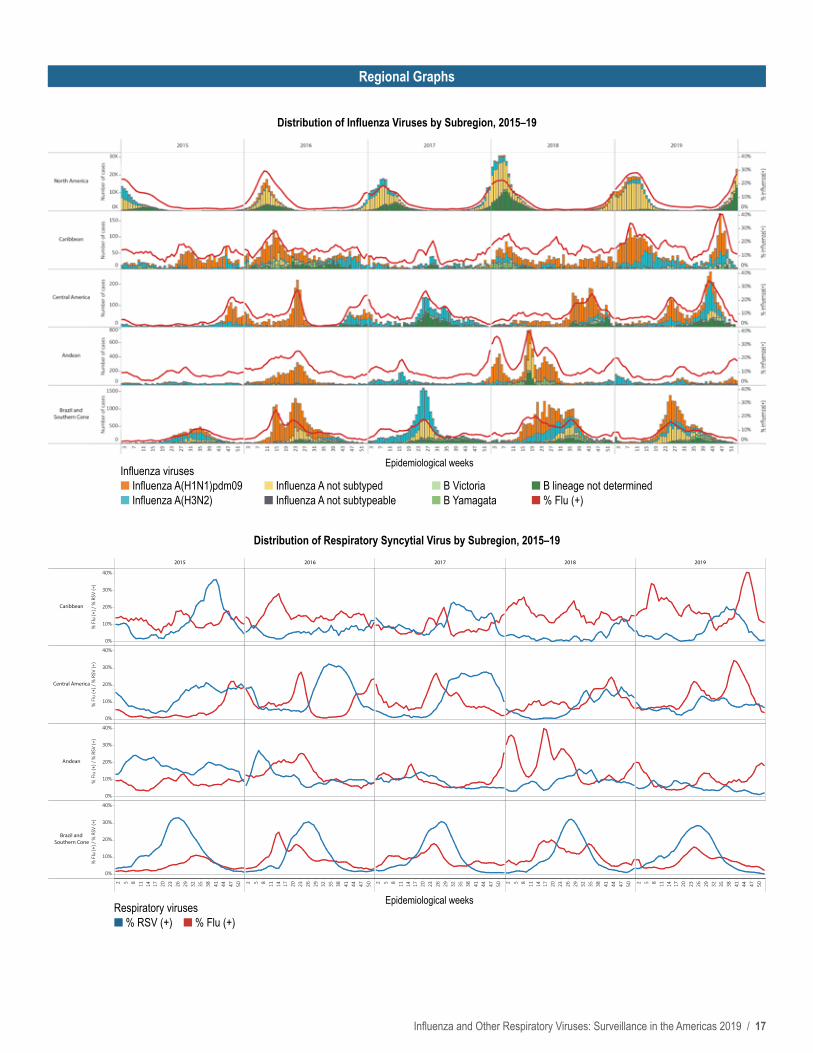
FluID/FluNet/PISA
FluIDReport: In progressReported > 33%: NAReported to WHO in 2018: NA
FluNetReport: YesReported > 33%: YesReported to WHO in 2018: Yes
PISA Parameters
Transmissibility: In progress Seriousness of disease: In progress Impact: In progress
Human-Animal Interface for Influenza
Intersectoral meetings No
Information sharing between sectors No
Surveillance of unusual respiratory cases with exposure to animals No
Influenza Disease Burden
Estimation of medical burden for influenza No
Estimation of economic burden for influenza No
Publication of influenza burden of disease NA
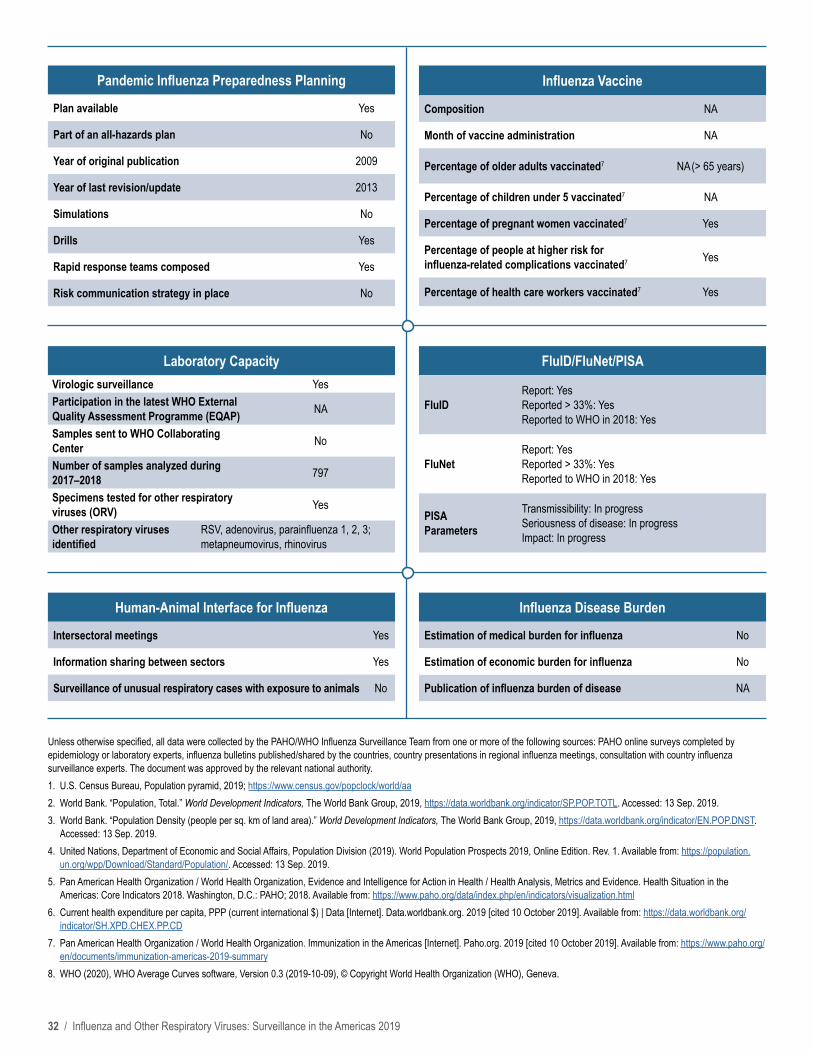
Pandemic Influenza Preparedness Planning
Plan available No
Part of an all-hazards plan NA
Year of original publication NA
Year of last revision/update NA
Simulations NA
Drills NA
Rapid response teams composed NA
Risk communication strategy in place NA
Laboratory Capacity
Virologic surveillance No
Participation in the latest WHO External Quality Assessment Programme (EQAP) NA
Samples sent to WHO Collaborating Center NA
Number of samples analyzed during 2017–2018 NA
Specimens tested for other respiratory viruses (ORV) NA
Other respiratory viruses identified NA
Influenza Vaccine
Composition NA
Month of vaccine administration NA
Percentage of older adults vaccinated7 NA (≥ 65 years, no denominators defined)
Percentage of children under 5 vaccinated7 NA
Percentage of pregnant women vaccinated7 NA
Percentage of people at higher risk for influenza-related complications vaccinated7 Yes
Percentage of health care workers vaccinated7 Yes
Unless otherwise specified, all data were collected by the PAHO/WHO Influenza Surveillance Team from one or more of the following sources: PAHO online surveys completed by epidemiology or laboratory experts, influenza bulletins published/shared by the countries, country presentations in regional influenza meetings, consultation with country influenza surveillance experts. The document was approved by the relevant national authority.1. U.S. Census Bureau, Population pyramid, 2019; https://www.census.gov/popclock/world/av2. Ministry of Economic Development, Statistics Department (Anguilla). Anguilla population and housing census 2011: preliminary findings #5 [news release]. The Valley: Ministry of
Economic Development; 2014. Available from: http://gov.ai/statistics/images/Press%20Release%20Census%20Findings%20no5%20-%20Preliminary%20Results%20-%20Nov%202014.pdf. Accessed: 13 Sep. 2019.
3. United Nations, Department of Economic and Social Affairs, Population Division (2019). World Population Prospects 2019, Online Edition. Rev. 1. Available from: https://population.un.org/wpp/Download/Standard/Population/. Accessed: 13 Sep. 2019.
4. Ministry of Economic Development, Statistics Department (Anguilla). Anguilla population and housing census 2011: preliminary findings #7 [news release]. The Valley: Ministry of Economic Development; 2014. Available from: http://gov.ai/statistics/images/Press%20Release%20Census%20Findings%20no7%20Preliminary%20Results%20-%20Dec%202014.pdf. Accessed: 13 Sep. 2019.
5. Pan American Health Organization. Core Indicators 2019: Health Trends in the Americas. Washington, D.C.: PAHO; 2019. https://iris.paho.org Accessed: 9 Oct. 2019.6. Current health expenditure per capita, PPP (current international $) | Data [Internet]. Data.worldbank.org. 2019 [cited 10 October 2019]. Available from: https://data.worldbank.org/
indicator/SH.XPD.CHEX.PP.CD 7. Pan American Health Organization / World Health Organization. Immunization in the Americas [Internet]. Paho.org. 2019 [cited 10 October 2019]. Available from: https://www.paho.org/
en/documents/immunization-americas-2019-summary8. WHO (2020), WHO Average Curves software, Version 0.3 (2019-10-09), © Copyright World Health Organization (WHO), Geneva.

24 / Influenza and Other Respiratory Viruses: Surveillance in the Americas 2019
POPULATIONPopulation (thousands)2: 97.0
Population density (per km2)3: 219Percentage of population < 5 years4: 7.7%
Percentage of population ≥ 65 years4: 9.3%
MORTALITYGross mortality rate (per 1,000 population)5: 5.8Mortality rate from all causes at < 5 years of age
(per 1,000 live births)5: 20.7Mortality rate due to communicable diseases
(per 100,000 population)5: 78.2
PUBLIC HEALTHNumber of medical doctors working in the public system
(per 10,000 population)5: 27.7Current health expenditure per capita, PPP*
(current international $)6: 1,070.7National health expenditure as % of GDP 20165: 2.6
*PPP – Purchasing Power Parity
Antigua and Barbuda
SURVEILLANCE SYSTEM CHARACTERISTICS INFORMATION SYSTEM
EventWHO case
definition used Surveillance
strategy
Clinical samples collected
from cases
Shipment of samples to NIC (or
laboratory)
Evaluation of surveillance
sites Number of sites Name
Laboratory and epidemiology
integrationOnline report
ILI Yes Sentinel No Varies No 9
NA NA NoARI No; ICD-9 codes
(519.8) Sentinel No Varies NA 9
PNEUMONIA No; ICD-9 codes (599.0) Sentinel Yes Varies NA 9
INFLUENZA NA Sentinel NA Varies NA 9
Socio
dem
ogra
phic
Indi
cato
rsSu
rveil
lance
Sys
tem
sSu
rveil
lance
Map
* The data in the sentinel surveillance map are updated as of January 2019. The population is a projection, as of 2019, by the Antigua and Barbuda Statistics Division, Ministry of Finance and Corporate Governance.
● ILI Centers (N=9)1. All Saints Health Centre (All Saints)2. Jennings Health Centre (Jennings)3. Eastern Area (Parham)4. Clare Hall Health Centre (Clare Hall)5. Browns Avenue Health Centre (Browns Avenue)6. Gray’s Farm Health Centre (Gray’s Farm)7. Bishop Gate Health Centre (Upper Gambles)8. Mount St. John’s Medical Centre (St. John)9. Hannah Thomas Hospital (Barbuda)
100+95 - 9990 - 9485 - 8980 - 8475 - 7970 - 7465 - 6960 - 6455 - 5950 - 5445 - 4940 - 4435 - 3930 - 3425 - 2920 - 2415 - 1910 - 14
5 - 90.-4
Population (in thousands)
Male
Age Group Population (in thousands)
Female
5 03 21 44 12 30 5
Antigua and Barbuda, 20191
Pop.0 53,640

Influenza and Other Respiratory Viruses: Surveillance in the Americas 2019 / 25
Influenza and Respiratory Syncytial Virus
Virologic data Antigua and Barbuda: Distribution of influenza viruses by epidemiological week
Antigua and Barbuda: Cumulative percent positivity for influenza and respiratory syncytial virus
Influenza-Like Illness (ILI)
Severe Acute Respiratory Infection (SARI)
Data from ambulatory cases8
Data from severe cases
Not applicable
0 10 20 30Week
ILI C
ases
160
120
80
40
2012 Threshold
Influenza virusesn Influenza A(H1N1)pdm09
n Influenza A(H3N2)
n Influenza A not subtyped
n Flu A Non subtypable
n Influenza B/Victoria
n Influenza B/Yamagata
n Influenza B/Lineage non-determined
n Influenza % positivity
Virus Percentages
n Influenza % positivity
n RSV (+) %

26 / Influenza and Other Respiratory Viruses: Surveillance in the Americas 2019
FluID/FluNet/PISA
FluIDReport: In progressReported > 33%: NAReported to WHO in 2018: NA
FluNetReport: In progressReported > 33%: YesReported to WHO in 2018: Yes
PISA Parameters
Transmissibility: In progress Seriousness of disease: In progress Impact: In progress
Human-Animal Interface for Influenza
Intersectoral meetings Yes
Information sharing between sectors Yes
Surveillance of unusual respiratory cases with exposure to animals In progress
Influenza Disease Burden
Estimation of medical burden for influenza No
Estimation of economic burden for influenza No
Publication of influenza burden of disease NA
Pandemic Influenza Preparedness Planning
Plan available Yes
Part of an all-hazards plan Yes
Year of original publication 2007
Year of last revision/update 2007
Simulations No
Drills No
Rapid response teams composed Yes
Risk communication strategy in place Yes
Laboratory Capacity
Virologic surveillance No
Participation in the latest WHO External Quality Assessment Programme (EQAP) NA
Samples sent to WHO Collaborating Center NA
Number of samples analyzed during 2017–2018 NA
Specimens tested for other respiratory viruses (ORV) NA
Other respiratory viruses identified NA
Influenza Vaccine
Composition NA
Month of vaccine administration NA
Percentage of older adults vaccinated7 NA (> 60 years, no denominators defined)
Percentage of children under 5 vaccinated7 NA
Percentage of pregnant women vaccinated7 NA
Percentage of people at higher risk for influenza-related complications vaccinated7 Yes
Percentage of health care workers vaccinated7 Yes
Unless otherwise specified, all data were collected by the PAHO/WHO Influenza Surveillance Team from one or more of the following sources: PAHO online surveys completed by epidemiology or laboratory experts, influenza bulletins published/shared by the countries, country presentations in regional influenza meetings, consultation with country influenza surveillance experts. The document was approved by the relevant national authority. 1. U.S. Census Bureau, Population pyramid, 2019; https://www.census.gov/popclock/world/ac2. World Bank. “Population, Total.” World Development Indicators, The World Bank Group, 2019, https://data.worldbank.org/indicator/SP.POP.TOTL. Accessed: 13 Sep. 2019.3. World Bank. “Population Density (people per sq. km of land area).” World Development Indicators, The World Bank Group, 2019, https://data.worldbank.org/indicator/EN.POP.DNST.
Accessed: 13 Sep. 2019.4. United Nations, Department of Economic and Social Affairs, Population Division (2019). World Population Prospects 2019, Online Edition. Rev. 1. Available from: https://population.
un.org/wpp/Download/Standard/Population/. Accessed: 13 Sep. 2019.5. Pan American Health Organization. Core Indicators 2019: Health Trends in the Americas. Washington, D.C.: PAHO; 2019. https://iris.paho.org. Accessed: 9 Oct. 2019.6. Current health expenditure per capita, PPP (current international $) | Data [Internet]. Data.worldbank.org. 2019 [cited 10 October 2019]. Available from: https://data.worldbank.org/
indicator/SH.XPD.CHEX.PP.CD 7. Pan American Health Organization / World Health Organization. Immunization in the Americas [Internet]. Paho.org. 2019 [cited 10 October 2019]. Available from: https://www.paho.org/
en/documents/immunization-americas-2019-summary8. WHO (2020), WHO Average Curves software, Version 0.3 (2019-10-09), © Copyright World Health Organization (WHO), Geneva.

Influenza and Other Respiratory Viruses: Surveillance in the Americas 2019 / 27
POPULATIONPopulation (thousands)2: 44,495
Population density (per km2)3: 16.0Percentage of population < 5 years4: 8.4%
Percentage of population ≥ 65 years4: 11.1%
MORTALITYGross mortality rate (per 1,000 population)5: 5.6Mortality rate from all causes at < 5 years of age
(per 1,000 live births)5: 11.0Mortality rate due to communicable diseases
(per 100,000 population)5: 85.2
PUBLIC HEALTHNumber of medical doctors working in the public system
(per 10,000 population)5: 39.9Current health expenditure per capita, PPP*
(current international $)6: 1,916.5National health expenditure as % of GDP 20165: 5.6
*PPP – Purchasing Power Parity
Argentina
SURVEILLANCE SYSTEM CHARACTERISTICS INFORMATION SYSTEM
EventWHO case
definition used Surveillance
strategy
Clinical samples collected
from cases
Shipment of samples to NIC (or
laboratory)
Evaluation of surveillance
sites Number of sites Name
Laboratory and epidemiology
integrationOnline report
SARI Yes National 100% Weekly Yes 400
Sistema Nacional de Vigilancia
de la Salud (SNVS)
Yes Yes
ILI Yes National 100% Weekly Yes 2,000 Yes No
PNEUMONIA No; ICD-10 codes (J10-J18) National Quota Weekly NA 1,000 Yes Yes
INFLUENZA NA National 100% Weekly NA 100 Yes YesINFLUENZA MORTALITY NA National 100% NA NA NA Yes Online
Sociodemographic Indicators
Surveillance Systems
Surveillance Map
* The data in the sentinel surveillance map are updated as of January 2019. The population is a projection, as of 2018, by the National Institute of Statistics and Census (INDEC), Argentina.
● SARI Hospitals (N=3)1. RVIII – General Pueyrredón2. Soc. Italiana de Benef – Hospital Italiano3. Hospital Teodoro Schestakow
▲ Laboratories with PCR capacity (N=38)The total number of regional laboratories, including those with immunofluorescence capacity, is greater than 100 (only those with PCR capacity are shown in map)
● ILI Centers (N=3)1. RVIII – General Pueyrredón2. UC Influenza – CONI3. UC Influenza Tucumán
100+95 - 9990 - 9485 - 8980 - 8475 - 7970 - 7465 - 6960 - 6455 - 5950 - 5445 - 4940 - 4435 - 3930 - 3425 - 2920 - 2415 - 1910 - 14
5 - 90.-4
Population (in millions)
Male
Age Group Population (in millions)
Female
2 01.2 0.80.4 1.61.6 0.40.8 1.20 2
Argentina, 20191
Pop.164,944 17,196,396
◆ National Influenza Centers (N=3)1. National Institute of Infectious Diseases (Buenos Aires City) National Reference Laboratory for influenza and respiratory viruses and coordinator of the
National Network of influenza and respiratory viruses.– Technical capacity: IF, RT-PCR, viral isolation (VI), hemagglutination inhibition (HAI),
sequencing, antiviral susceptibility, serology.– Average samples processed/year: 4,905
2. Influenza and Other Respiratory Virus Laboratory, Virology Institute - InViV (Córdoba)– Technical capacity: IF, RT-PCR, VI, HAI, sequencing, serology.
3. National Institute of Epidemiology (Mar del Plata)– Technical capacity: IF, RT-PCR, VI, HAI, sequencing, antiviral susceptibility.

28 / Influenza and Other Respiratory Viruses: Surveillance in the Americas 2019
Influenza and Respiratory Syncytial Virus
Data from ambulatory cases
Data from severe cases
Virologic data
Influenza-Like Illness (ILI)
Severe Acute Respiratory Infection (SARI)
Argentina: Distribution of influenza viruses by epidemiological week
Argentina: Cumulative percent positivity for influenza and respiratory syncytial virus
Influenza virusesn Influenza A(H1N1)pdm09
n Influenza A(H3N2)
n Influenza A not subtyped
n Flu A Non subtypable
n Influenza B/Victoria
n Influenza B/Yamagata
n Influenza B/Lineage non-determined
n Influenza % positivity
Virus Percentages
n Influenza % positivity
n RSV (+) %
Data from ambulatory cases8
Data from severe cases8

Influenza and Other Respiratory Viruses: Surveillance in the Americas 2019 / 29
Unless otherwise specified, all data were collected by the PAHO/WHO Influenza Surveillance Team from one or more of the following sources: PAHO online surveys completed by epidemiology or laboratory experts, influenza bulletins published/shared by the countries, country presentations in regional influenza meetings, consultation with country influenza surveillance experts. The document was approved by the relevant national authority.1. U.S. Census Bureau, Population pyramid, 2019; https://www.census.gov/popclock/world/ar2. World Bank. “Population, Total.” World Development Indicators, The World Bank Group, 2019, https://data.worldbank.org/indicator/SP.POP.TOTL. Accessed: 13 Sep. 2019.3. World Bank. “Population Density (people per sq. km of land area).” World Development Indicators, The World Bank Group, 2019, https://data.worldbank.org/indicator/EN.POP.DNST.
Accessed: 13 Sep. 2019.4. United Nations, Department of Economic and Social Affairs, Population Division (2019). World Population Prospects 2019, Online Edition. Rev. 1. Available from: https://population.
un.org/wpp/Download/Standard/Population/. Accessed: 13 Sep. 2019.5. Pan American Health Organization. Core Indicators 2019: Health Trends in the Americas. Washington, D.C.: PAHO; 2019. https://iris.paho.org Accessed: 9 Oct. 2019.6. Current health expenditure per capita, PPP (current international $) | Data [Internet]. Data.worldbank.org. 2019 [cited 10 October 2019]. Available from: https://data.worldbank.org/
indicator/SH.XPD.CHEX.PP.CD 7. Pan American Health Organization / World Health Organization. Immunization in the Americas [Internet]. Paho.org. 2019 [cited 10 October 2019]. Available from: https://www.paho.org/
en/documents/immunization-americas-2019-summary8. WHO (2020), WHO Average Curves software, Version 0.3 (2019-10-09), © Copyright World Health Organization (WHO), Geneva.
FluID/FluNet/PISA
FluIDReport: YesReported > 33%: YesReported to WHO in 2018: Yes
FluNetReport: YesReported > 33%: YesReported to WHO in 2018: Yes
PISA Parameters
Transmissibility: Yes Seriousness of disease: Yes Impact: No
Human-Animal Interface for Influenza
Intersectoral meetings In progress
Information sharing between sectors In progress
Surveillance of unusual respiratory cases with exposure to animals No
Influenza Disease Burden
Estimation of medical burden for influenza No
Estimation of economic burden for influenza NA
Publication of influenza burden of disease NA
Pandemic Influenza Preparedness Planning
Plan available Yes
Part of an all-hazards plan Yes
Year of original publication 2009
Year of last revision/update 2009
Simulations Yes
Drills NA
Rapid response teams composed Yes
Risk communication strategy in place Yes
Laboratory CapacityVirologic surveillance YesParticipation in the latest WHO External Quality Assessment Programme (EQAP) Yes
Samples sent to WHO Collaborating Center Yes
Number of samples analyzed during 2017–2018 4,905
Specimens tested for other respiratory viruses (ORV) Yes
Other respiratory viruses identified
RSV, adenovirus, parainfluenza 1, 2, 3; metapneumovirus, bocavirus, rhinovirus, SARSCoV; MERSCoV; NL63Cov; HKU1Cov; 229ECov; OC43Cov; coronavirus (OC43, 229E NL63, HQU1)
Influenza Vaccine
Composition Southern hemisphere(*since 1993)
Month of vaccine administration April (since 2016)
Percentage of older adults vaccinated7 100% (reported coverage, > 65 years)
Percentage of children under 5 vaccinated7 70% (age of vaccinated chil-dren is 6-24 months. 2018)
Percentage of pregnant women vaccinated7 72% (2018)Percentage of people at higher risk for influenza-related complications vaccinated7
Yes (2018)
Percentage of health care workers vaccinated7 98% (2018)

30 / Influenza and Other Respiratory Viruses: Surveillance in the Americas 2019
POPULATIONPopulation (thousands)2: 105.8
Population density (per km2)3: 588.0Percentage of population < 5 years4: 5.4%
Percentage of population ≥ 65 years4: 13.6%
MORTALITYGross mortality rate (per 1,000 population)5: 5.2Mortality rate from all causes at < 5 years of age
(per 1,000 live births)5: 3.3Mortality rate due to communicable diseases
(per 100,000 population)5: 39.4
PUBLIC HEALTHNumber of medical doctors working in the public system
(per 10,000 population)5: 19.0Current health expenditure per capita, PPP*
(current international $)6: NANational health expenditure as % of GDP 20165: NA
*PPP – Purchasing Power Parity
SURVEILLANCE SYSTEM CHARACTERISTICS INFORMATION SYSTEM
Event
WHO case definition
used Surveillance
strategy
Clinical samples collected
from cases
Shipment of samples to NIC (or
laboratory)
Evaluation of surveillance
sites Number of sites Name
Laboratory and epidemiology
integrationOnline report
SARI Yes Sentinel NA NA No 2 SPSS ARI-SARI data base
Yes NoARI No* Sentinel NA NA NA 7 SPSS ARI-SARI data base
INFLUENZA MORTALITY NA National NA No NA NA SPSS Mortality
data base* ARI: Acute (sudden) febrile illness (> 38.0 °C); Previously healthy person; With cough and/or sore throat; With or without respiratory distress
Socio
dem
ogra
phic
Indi
cato
rsSu
rveil
lance
Sys
tem
sSu
rveil
lance
Map
* The data in the sentinel surveillance map are updated as of January 2019. Population according to the Quarterly Demographic Bulletin 2018, Aruba. Central Bureau of Statistics.
Pop.0 13,555
100+95 - 9990 - 9485 - 8980 - 8475 - 7970 - 7465 - 6960 - 6455 - 5950 - 5445 - 4940 - 4435 - 3930 - 3425 - 2920 - 2415 - 1910 - 14
5 - 90.-4
Population (in thousands)
Male
Age Group Population (in thousands)
Female
5 03 21 44 12 30 5
Aruba, 20191
Aruba
● SARI Hospitals (N=1)
1. Dr. Horacio Oduber Hospital
● ILI Centers (N=7)(Not displayed on map)

Influenza and Other Respiratory Viruses: Surveillance in the Americas 2019 / 31
Data from severe cases
Influenza-Like Illness (ILI)
Severe Acute Respiratory Infection (SARI)
Not applicable
Influenza and Respiratory Syncytial Virus
Virologic data
Aruba: Cumulative percent positivity for influenza and respiratory syncytial virus
Influenza virusesn Influenza A(H1N1)pdm09
n Influenza A(H3N2)
n Influenza A not subtyped
n Flu A Non subtypable
n Influenza B/Victoria
n Influenza B/Yamagata
n Influenza B/Lineage non-determined
n Influenza % positivity
Virus Percentages
n Influenza % positivity
n RSV (+) %
Data from ambulatory cases
Data from severe cases8
Aruba: Distribution of influenza viruses by epidemiological week
32 / Influenza and Other Respiratory Viruses: Surveillance in the Americas 2019
FluID/FluNet/PISA
FluIDReport: YesReported > 33%: YesReported to WHO in 2018: Yes
FluNetReport: YesReported > 33%: YesReported to WHO in 2018: Yes
PISA Parameters
Transmissibility: In progress Seriousness of disease: In progress Impact: In progress
Human-Animal Interface for Influenza
Intersectoral meetings Yes
Information sharing between sectors Yes
Surveillance of unusual respiratory cases with exposure to animals No
Influenza Disease Burden
Estimation of medical burden for influenza No
Estimation of economic burden for influenza No
Publication of influenza burden of disease NA
Pandemic Influenza Preparedness Planning
Plan available Yes
Part of an all-hazards plan No
Year of original publication 2009
Year of last revision/update 2013
Simulations No
Drills Yes
Rapid response teams composed Yes
Risk communication strategy in place No
Influenza Vaccine
Composition NA
Month of vaccine administration NA
Percentage of older adults vaccinated7 NA (> 65 years)
Percentage of children under 5 vaccinated7 NA
Percentage of pregnant women vaccinated7 Yes
Percentage of people at higher risk for influenza-related complications vaccinated7 Yes
Percentage of health care workers vaccinated7 Yes
Unless otherwise specified, all data were collected by the PAHO/WHO Influenza Surveillance Team from one or more of the following sources: PAHO online surveys completed by epidemiology or laboratory experts, influenza bulletins published/shared by the countries, country presentations in regional influenza meetings, consultation with country influenza surveillance experts. The document was approved by the relevant national authority.1. U.S. Census Bureau, Population pyramid, 2019; https://www.census.gov/popclock/world/aa2. World Bank. “Population, Total.” World Development Indicators, The World Bank Group, 2019, https://data.worldbank.org/indicator/SP.POP.TOTL. Accessed: 13 Sep. 2019.3. World Bank. “Population Density (people per sq. km of land area).” World Development Indicators, The World Bank Group, 2019, https://data.worldbank.org/indicator/EN.POP.DNST.
Accessed: 13 Sep. 2019.4. United Nations, Department of Economic and Social Affairs, Population Division (2019). World Population Prospects 2019, Online Edition. Rev. 1. Available from: https://population.
un.org/wpp/Download/Standard/Population/. Accessed: 13 Sep. 2019.5. Pan American Health Organization / World Health Organization, Evidence and Intelligence for Action in Health / Health Analysis, Metrics and Evidence. Health Situation in the
Americas: Core Indicators 2018. Washington, D.C.: PAHO; 2018. Available from: https://www.paho.org/data/index.php/en/indicators/visualization.html 6. Current health expenditure per capita, PPP (current international $) | Data [Internet]. Data.worldbank.org. 2019 [cited 10 October 2019]. Available from: https://data.worldbank.org/
indicator/SH.XPD.CHEX.PP.CD 7. Pan American Health Organization / World Health Organization. Immunization in the Americas [Internet]. Paho.org. 2019 [cited 10 October 2019]. Available from: https://www.paho.org/
en/documents/immunization-americas-2019-summary8. WHO (2020), WHO Average Curves software, Version 0.3 (2019-10-09), © Copyright World Health Organization (WHO), Geneva.
Laboratory CapacityVirologic surveillance YesParticipation in the latest WHO External Quality Assessment Programme (EQAP) NA
Samples sent to WHO Collaborating Center No
Number of samples analyzed during 2017–2018 797
Specimens tested for other respiratory viruses (ORV) Yes
Other respiratory viruses identified
RSV, adenovirus, parainfluenza 1, 2, 3; metapneumovirus, rhinovirus
Influenza and Other Respiratory Viruses: Surveillance in the Americas 2019 / 33
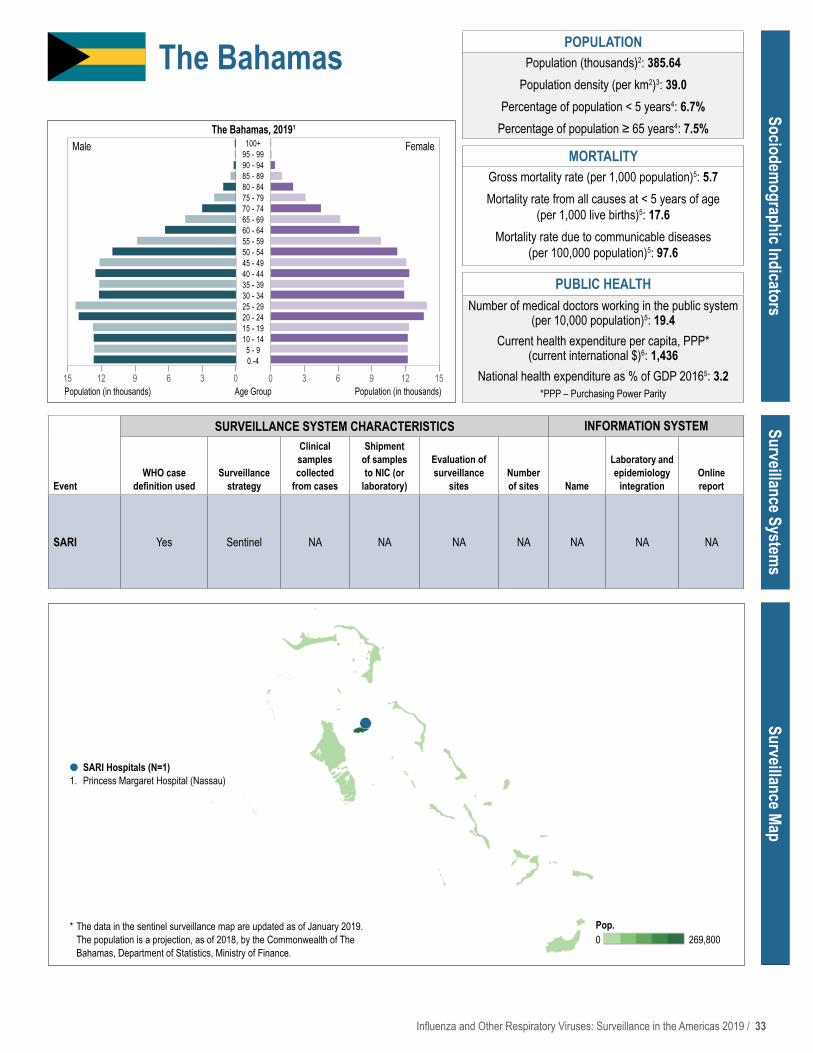
POPULATIONPopulation (thousands)2: 385.64
Population density (per km2)3: 39.0Percentage of population < 5 years4: 6.7%
Percentage of population ≥ 65 years4: 7.5%
MORTALITYGross mortality rate (per 1,000 population)5: 5.7Mortality rate from all causes at < 5 years of age
(per 1,000 live births)5: 17.6Mortality rate due to communicable diseases
(per 100,000 population)5: 97.6
PUBLIC HEALTHNumber of medical doctors working in the public system
(per 10,000 population)5: 19.4Current health expenditure per capita, PPP*
(current international $)6: 1,436National health expenditure as % of GDP 20165: 3.2
*PPP – Purchasing Power Parity
SURVEILLANCE SYSTEM CHARACTERISTICS INFORMATION SYSTEM
EventWHO case
definition used Surveillance
strategy
Clinical samples collected
from cases
Shipment of samples to NIC (or
laboratory)
Evaluation of surveillance
sites Number of sites Name
Laboratory and epidemiology
integrationOnline report
SARI Yes Sentinel NA NA NA NA NA NA NA
Sociodemographic Indicators
Surveillance Systems
Surveillance Map
* The data in the sentinel surveillance map are updated as of January 2019. The population is a projection, as of 2018, by the Commonwealth of The Bahamas, Department of Statistics, Ministry of Finance.
● SARI Hospitals (N=1)1. Princess Margaret Hospital (Nassau)
Pop.0 269,800
100+95 - 9990 - 9485 - 8980 - 8475 - 7970 - 7465 - 6960 - 6455 - 5950 - 5445 - 4940 - 4435 - 3930 - 3425 - 2920 - 2415 - 1910 - 14
5 - 90.-4
Population (in thousands)
Male
Age Group Population (in thousands)
Female
15 09 63 1212 36 90 15
The Bahamas, 20191
The Bahamas

34 / Influenza and Other Respiratory Viruses: Surveillance in the Americas 2019
Data from severe cases
Influenza and Respiratory Syncytial Virus
Virologic data Bahamas: Distribution of influenza viruses by epidemiological week
Severe Acute Respiratory Infection (SARI)
Bahamas: Cumulative percent positivity for influenza and respiratory syncytial virus
Influenza virusesn Influenza A(H1N1)pdm09
n Influenza A(H3N2)
n Influenza A not subtyped
n Flu A Non subtypable
n Influenza B/Victoria
n Influenza B/Yamagata
n Influenza B/Lineage non-determined
n Influenza % positivity
Virus Percentages
n Influenza % positivity
n RSV (+) %
Data from severe cases8
Influenza-Like Illness (ILI)
Not applicable
Data from ambulatory cases

Influenza and Other Respiratory Viruses: Surveillance in the Americas 2019 / 35
FluID/FluNet/PISA
FluIDReport: In progressReported > 33%: NAReported to WHO in 2018: NA
FluNetReport: YesReported > 33%: YesReported to WHO in 2018: Yes
PISA Parameters
Transmissibility: In progress Seriousness of disease: In progress Impact: In progress
Human-Animal Interface for Influenza
Intersectoral meetings NA
Information sharing between sectors NA
Surveillance of unusual respiratory cases with exposure to animals NA
Influenza Disease Burden
Estimation of medical burden for influenza NA
Estimation of economic burden for influenza NA
Publication of influenza burden of disease NA
Pandemic Influenza Preparedness Planning
Plan available NA
Part of an all-hazards plan NA
Year of original publication NA
Year of last revision/update NA
Simulations NA
Drills NA
Rapid response teams composed NA
Risk communication strategy in place NA
Laboratory Capacity
Virologic surveillance NA
Participation in the latest WHO External Quality Assessment Programme (EQAP) NA
Samples sent to WHO Collaborating Center NA
Number of samples analyzed during 2017–2018 NA
Specimens tested for other respiratory viruses (ORV) NA
Other respiratory viruses identified NA
Influenza Vaccine
Composition NA
Month of vaccine administration NA
Percentage of older adults vaccinated7 NA ( ≥ 65 years)
Percentage of children under 5 vaccinated7 NA
Percentage of pregnant women vaccinated7 Yes
Percentage of people at higher risk for influenza-related complications vaccinated7 Yes
Percentage of health care workers vaccinated7 Yes
Unless otherwise specified, all data were collected by the PAHO/WHO Influenza Surveillance Team from one or more of the following sources: PAHO online surveys completed by epidemiology or laboratory experts, influenza bulletins published/shared by the countries, country presentations in regional influenza meetings, consultation with country influenza surveillance experts. The document was approved by the relevant national authority.1. U.S. Census Bureau, Population pyramid, 2019; https://www.census.gov/popclock/world/bf2. World Bank. “Population, Total.” World Development Indicators, The World Bank Group, 2019, https://data.worldbank.org/indicator/SP.POP.TOTL. Accessed: 13 Sep. 2019.3. World Bank. “Population Density (people per sq. km of land area).” World Development Indicators, The World Bank Group, 2019, https://data.worldbank.org/indicator/EN.POP.DNST.
Accessed: 13 Sep. 2019.4. United Nations, Department of Economic and Social Affairs, Population Division (2019). World Population Prospects 2019, Online Edition. Rev. 1. Available from: https://population.
un.org/wpp/Download/Standard/Population/. Accessed: 13 Sep. 2019.5. Pan American Health Organization. Core Indicators 2019: Health Trends in the Americas. Washington, D.C.: PAHO; 2019. https://iris.paho.org Accessed: 9 Oct. 2019.6. Current health expenditure per capita, PPP (current international $) | Data [Internet]. Data.worldbank.org. 2019 [cited 10 October 2019]. Available from: https://data.worldbank.org/
indicator/SH.XPD.CHEX.PP.CD 7. Pan American Health Organization / World Health Organization. Immunization in the Americas [Internet]. Paho.org. 2019 [cited 10 October 2019]. Available from: https://www.paho.org/
en/documents/immunization-americas-2019-summary8. WHO (2020), WHO Average Curves software, Version 0.3 (2019-10-09), © Copyright World Health Organization (WHO), Geneva.

36 / Influenza and Other Respiratory Viruses: Surveillance in the Americas 2019
POPULATIONPopulation (thousands)2: 286.6
Population density (per km2)3: 666.6Percentage of population < 5 years4: 5.3%
Percentage of population ≥ 65 years4: 15.8%
MORTALITYGross mortality rate (per 1,000 population)5: 6.5Mortality rate from all causes at < 5 years of age
(per 1,000 live births)5: 14.9Mortality rate due to communicable diseases
(per 100,000 population)5: 92.6
PUBLIC HEALTHNumber of medical doctors working in the public system
(per 10,000 population)5: 24.9Current health expenditure per capita, PPP*
(current international $)6: 1,322.9National health expenditure as % of GDP 20165: 3.2
*PPP – Purchasing Power Parity
SURVEILLANCE SYSTEM CHARACTERISTICS INFORMATION SYSTEM
EventWHO case
definition used Surveillance
strategy
Clinical samples collected
from cases
Shipment of samples to NIC (or
laboratory)
Evaluation of surveillance
sites Number of sites Name
Laboratory and epidemiology
integrationOnline report
SARI No Sentinel 100% Daily Daily 1 AccessDatabase Yes No
ARI No SentinelQuota (6
samples/site/week)
No NA 13 ExcelDatabase Yes No
INFLUENZA No SentinelAll SARI
cases/Quota of ARI cases
No NA 2 ExcelDatabase Yes No
Socio
dem
ogra
phic
Indi
cato
rsSu
rveil
lance
Sys
tem
sSu
rveil
lance
Map
* The data in the sentinel surveillance map are updated as of January 2019. The population is a projection, as of 2019, according to the Barbados Statistical Service: 2010 Population and Housing Census.
● SARI Hospitals (N=1)1. Queen Elizabeth Hospital (St. Michael)
▲ Laboratories with IF capacity (N=2)1. Public Health Laboratory (St. Michael) – Technical capacity: IF2. Ladymeade Reference Unit (St. Michael) – Technical capacity: IF
Barbados
Pop.5,139 88,529
100+95 - 9990 - 9485 - 8980 - 8475 - 7970 - 7465 - 6960 - 6455 - 5950 - 5445 - 4940 - 4435 - 3930 - 3425 - 2920 - 2415 - 1910 - 14
5 - 90.-4
Population (in thousands)
Male
Age Group Population (in thousands)
Female
15 09 63 1212 36 90 15
Barbados, 20191

Influenza and Other Respiratory Viruses: Surveillance in the Americas 2019 / 37
Data from ambulatory cases
Influenza and Respiratory Syncytial Virus
Acute Respiratory Infection (ARI)
Severe Acute Respiratory Infection (SARI)
Virologic data
Not applicable
Influenza virusesn Influenza A(H1N1)pdm09
n Influenza A(H3N2)
n Influenza A not subtyped
n Flu A Non subtypable
n Influenza B/Victoria
n Influenza B/Yamagata
n Influenza B/Lineage non-determined
n Influenza % positivity
Virus Percentages
n Influenza % positivity
n RSV (+) %
Average curve Interseasonal 2018/2019 Epidemic Extraordinary High Moderate
2018 2019 Threshold
Data from ambulatory cases8
Data from severe cases8
Barbados: Cumulative percent positivity for influenza and respiratory syncytial virus
Barbados: Distribution of influenza viruses by epidemiological week

38 / Influenza and Other Respiratory Viruses: Surveillance in the Americas 2019
Unless otherwise specified, all data were collected by the PAHO/WHO Influenza Surveillance Team from one or more of the following sources: PAHO online surveys completed by epidemiology or laboratory experts, influenza bulletins published/shared by the countries, country presentations in regional influenza meetings, consultation with country influenza surveillance experts. The document was approved by the relevant national authority.1. U.S. Census Bureau, Population pyramid, 2019; https://www.census.gov/popclock/world/bb2. World Bank. “Population, Total.” World Development Indicators, The World Bank Group, 2019, https://data.worldbank.org/indicator/SP.POP.TOTL. Accessed: 13 Sep. 2019.3. World Bank. “Population Density (people per sq. km of land area).” World Development Indicators, The World Bank Group, 2019, https://data.worldbank.org/indicator/EN.POP.DNST.
Accessed: 13 Sep. 2019.4. United Nations, Department of Economic and Social Affairs, Population Division (2019). World Population Prospects 2019, Online Edition. Rev. 1. Available from: https://population.
un.org/wpp/Download/Standard/Population/. Accessed: 13 Sep. 2019.5. Pan American Health Organization / World Health Organization, Evidence and Intelligence for Action in Health / Health Analysis, Metrics and Evidence. Health Situation in the
Americas: Core Indicators 2018. Washington, D.C.: PAHO; 2018. Available from: https://www.paho.org/data/index.php/en/indicators/visualization.html6. Current health expenditure per capita, PPP (current international $) | Data [Internet]. Data.worldbank.org. 2019 [cited 10 October 2019]. Available from: https://data.worldbank.org/
indicator/SH.XPD.CHEX.PP.CD 7. Pan American Health Organization / World Health Organization. Immunization in the Americas [Internet]. Paho.org. 2019 [cited 10 October 2019]. Available from: https://www.paho.org/
en/documents/immunization-americas-2019-summary8. WHO (2020), WHO Average Curves software, Version 0.3 (2019-10-09), © Copyright World Health Organization (WHO), Geneva.
FluID/FluNet/PISA
FluIDReport: In progressReported > 33%: NAReported to WHO in 2018: NA
FluNetReport: YesReported > 33%: YesReported to WHO in 2018: Yes
PISA Parameters
Transmissibility: In progress Seriousness of disease: In progress Impact: In progress
Human-Animal Interface for Influenza
Intersectoral meetings NA
Information sharing between sectors NA
Surveillance of unusual respiratory cases with exposure to animals NA
Influenza Disease Burden
Estimation of medical burden for influenza No
Estimation of economic burden for influenza No
Publication of influenza burden of disease No
Pandemic Influenza Preparedness Planning
Plan available Yes (printed document)
Part of an all-hazards plan Yes
Year of original publication 2009
Year of last revision/update In progress
Simulations NA
Drills NA
Rapid response teams composed NA
Risk communication strategy in place NA
Laboratory Capacity
Virologic surveillance Yes
Participation in the latest WHO External Quality Assessment Programme (EQAP) NA
Samples sent to WHO Collaborating Center NA
Number of samples analyzed during 2017–2018 NA
Specimens tested for other respiratory viruses (ORV) NA
Other respiratory viruses identified NA
Influenza Vaccine
Composition Southern hemisphere
Month of vaccine administration April (In 2016)
Percentage of older adults vaccinated7 NA ( > 65 years, no denominators defined)
Percentage of children under 5 vaccinated7 NA
Percentage of pregnant women vaccinated7 NA
Percentage of people at higher risk for influenza-related complications vaccinated7 No
Percentage of health care workers vaccinated7 Yes

Influenza and Other Respiratory Viruses: Surveillance in the Americas 2019 / 39
POPULATIONPopulation (thousands)2: 383.0
Population density (per km2)3: 17.0Percentage of population < 5 years4: 10.3%Percentage of population ≥ 65 years4: 4.7%
MORTALITYGross mortality rate (per 1,000 population)5: 9.5Mortality rate from all causes at < 5 years of age
(per 1,000 live births)5: 14.8Mortality rate due to communicable diseases
(per 100,000 population)5: 142.7
PUBLIC HEALTHNumber of medical doctors working in the public system
(per 10,000 population)5: 10.8Current health expenditure per capita, PPP*
(current international $)6: 541.4National health expenditure as % of GDP 20165: 4.1
*PPP – Purchasing Power Parity
SURVEILLANCE SYSTEM CHARACTERISTICS INFORMATION SYSTEM
EventWHO case
definition used Surveillance
strategy
Clinical samples collected
from cases
Shipment of samples to NIC (or
laboratory)
Evaluation of surveillance
sites Number of sites Name
Laboratory and epidemiology
integrationOnline report
ARINo; ICD-10
codes (J09-J18 and J20-J22)
National 100% NA NA 8
Belize Health
Information System
Yes
No
PNEUMONIA No; ICD-10 codes (J09-J18) National 100% NA NA 8 No
INFLUENZA NA National 100% NA NA 8 YesINFLUENZA MORTALITY NA National 100% No NA 8 No
Sociodemographic Indicators
Surveillance Systems
Surveillance Map
* The data in the surveillance map are updated as of January 2019. The population is a projection, as of 2018, by the Statistical Institute of Belize.
● SARI Hospitals (N=1)1. Karl Heusner Memorial Hospital (Belize City)
▲ Laboratories with PCR capacity (N=1)1. Central Medical Laboratory (Belize City)
● ILI Centers (N=7)1. Cleopatra White Polyclinic2. Corozal Community Hospital (Corozal)3. Northern Region Hospital (Orange Walk)4. San Ignacio Hospital (San Ignacio)5. Western Regional Hospital (Belmopan)6. Southern Regional Hospital (Dangriga)7. Punta Gorda Hospital (Punta Gorda)
Pop.37,614 120,602
100+95 - 9990 - 9485 - 8980 - 8475 - 7970 - 7465 - 6960 - 6455 - 5950 - 5445 - 4940 - 4435 - 3930 - 3425 - 2920 - 2415 - 1910 - 14
5 - 90.-4
Population (in thousands)
Male
Age Group Population (in thousands)
Female
25 015 105 2020 510 150 25
Belize 20191
Belize

40 / Influenza and Other Respiratory Viruses: Surveillance in the Americas 2019
Influenza and Respiratory Syncytial Virus
Virologic data
Influenza-Like Illness (ILI)
Not applicable
Belize: Distribution of influenza viruses by epidemiological week
0 10 20 30
ILI C
ases
40
1,750
1,500
1,250
1,000
1,000
2012 Threshold
Week
Belize: Cumulative percent positivity for influenza and respiratory syncytial virus
Influenza virusesn Influenza A(H1N1)pdm09
n Influenza A(H3N2)
n Influenza A not subtyped
n Flu A Non subtypable
n Influenza B/Victoria
n Influenza B/Yamagata
n Influenza B/Lineage non-determined
n Influenza % positivity
Virus Percentages
n Influenza % positivity
n RSV (+) %
Severe Acute Respiratory Infection (SARI)
Data from ambulatory cases8
Data from severe cases

Influenza and Other Respiratory Viruses: Surveillance in the Americas 2019 / 41
Unless otherwise specified, all data were collected by the PAHO/WHO Influenza Surveillance Team from one or more of the following sources: PAHO online surveys completed by epidemiology or laboratory experts, influenza bulletins published/shared by the countries, country presentations in regional influenza meetings, consultation with country influenza surveillance experts. The document was approved by the relevant national authority.1. U.S. Census Bureau, Population pyramid, 2019; https://www.census.gov/popclock/world/bh2. World Bank. “Population, Total.” World Development Indicators, The World Bank Group, 2019, https://data.worldbank.org/indicator/SP.POP.TOTL. Accessed: 13 Sep. 2019.3. World Bank. “Population Density (people per sq. km of land area).” World Development Indicators, The World Bank Group, 2019, https://data.worldbank.org/indicator/EN.POP.DNST
Accessed: 13 Sep. 2019.4. United Nations, Department of Economic and Social Affairs, Population Division (2019). World Population Prospects 2019, Online Edition. Rev. 1. Available from: https://population.
un.org/wpp/Download/Standard/Population/. Accessed: 13 Sep. 2019.5. Pan American Health Organization / World Health Organization, Evidence and Intelligence for Action in Health / Health Analysis, Metrics and Evidence. Health Situation in the
Americas: Core Indicators 2018. Washington, D.C.: PAHO; 2018. Available from: https://www.paho.org/data/index.php/en/indicators/visualization.html6. Current health expenditure per capita, PPP (current international $) | Data [Internet]. Data.worldbank.org. 2019 [cited 10 October 2019]. Available from: https://data.worldbank.org/
indicator/SH.XPD.CHEX.PP.CD 7. Pan American Health Organization / World Health Organization. Immunization in the Americas [Internet]. Paho.org. 2019 [cited 10 October 2019]. Available from: https://www.paho.org/
en/documents/immunization-americas-2019-summary8. WHO (2020), WHO Average Curves software, Version 0.3 (2019-10-09), © Copyright World Health Organization (WHO), Geneva.
FluID/FluNet/PISA
FluID In progress
FluNetReport: YesReported > 33%: YesReported to WHO in 2018: Yes
PISA Parameters
Transmissibility: In progress Seriousness of disease: In progress Impact: In progress
Human-Animal Interface for Influenza
Intersectoral meetings Yes
Information sharing between sectors In progress
Surveillance of unusual respiratory cases with exposure to animals No
Influenza Disease Burden
Estimation of medical burden for influenza No
Estimation of economic burden for influenza No
Publication of influenza burden of disease No
Pandemic Influenza Preparedness Planning
Plan available Yes
Part of an all-hazards plan No
Year of original publication NA
Year of last revision/update 2014
Simulations NA
Drills NA
Rapid response teams composed Yes
Risk communication strategy in place No
Laboratory Capacity
Virologic surveillance No
Participation in the latest WHO External Quality Assessment Programme (EQAP) NA
Samples sent to WHO Collaborating Center NA
Number of samples analyzed during 2017–2018 NA
Specimens tested for other respiratory viruses (ORV) NA
Other respiratory viruses identified NA
Influenza VaccineComposition Northern hemisphereMonth of vaccine administration NA
Percentage of older adults vaccinated 41%
(≥ 65 years)Percentage of children under 5 vaccinated
71% (age of vaccinated children is 6–23 months. 2018)
Percentage of pregnant women vaccinated 48%
Percentage of people at higher risk for influenza-related complications vaccinated
Yes
Percentage of health care workers vaccinated7 78%

42 / Influenza and Other Respiratory Viruses: Surveillance in the Americas 2019
POPULATIONPopulation (thousands)2: 11,353
Population density (per km2)3: 10.5Percentage of population < 5 years4: 10.5%Percentage of population ≥ 65 years4: 7.2%
MORTALITYGross mortality rate (per 1,000 population)5: 7.3Mortality rate from all causes at < 5 years of age
(per 1,000 live births)5: 29.0Mortality rate due to communicable diseases
(per 100,000 population)5: 145.9
PUBLIC HEALTHNumber of medical doctors working in the public system
(per 10,000 population)5: 10.3Current health expenditure per capita, PPP*
(current international $)6: 496.0National health expenditure as % of GDP 20165: 4.5
*PPP – Purchasing Power Parity
SURVEILLANCE SYSTEM CHARACTERISTICS INFORMATION SYSTEM
EventWHO case
definition used Surveillance
strategy
Clinical samples
collected from cases
Shipment of samples to NIC (or
laboratory)
Evaluation of surveillance
sites Number of sites Name
Laboratory and epidemiology
integrationOnline report
SARI Yes Sentinel NA NA NA 9
PAHOFlu Yes YesILI Yes Sentinel All cases/ (3 times/week) Varies Annually 1
INFLUENZA NA NA NA NA NA NA
Socio
dem
ogra
phic
Indi
cato
rsSu
rveil
lance
Sys
tem
sSu
rveil
lance
Map
* The data in the sentinel surveillance map are updated as of January 2019. The population is a projection, as of 2018, by the Bolivia National Institute of Statistics
Pop.128,000 3,253,000
● SARI Hospitals (N=9)1. Hospital del Niño Mario Ortiz Suárez (Santa Cruz)2 Hospital Obrero No. 3 (Santa Cruz)3. Hospital Universitario San Juan de Dios (Santa Cruz)4. Hospital Materno Infantil CNS (Santa Cruz)5. Hospital del Niño (La Paz)6. Instituto Nacional del Torax (La Paz) 7. Hospital Arco Iris (La Paz)8. Hospital Materno Infantil CNS (La Paz)9. Hospital Boliviano Holandés (La Paz)
▲ Laboratories with PCR capacity (N=1)1. Instituto Nacional de Laboratorios de Salud (La Paz)
– Technical capacity: IF, RT-PCR, viral isolation
◆ National Influenza Centers (N=1)
1. Centro de Enfermedades Tropicales (Center for Tropical Diseases) (Santa Cruz, Bolivia)
– Technical capacity: IF, RT-PCR, viral isolation – Average samples processed/year: 3,717
100+95 - 9990 - 9485 - 8980 - 8475 - 7970 - 7465 - 6960 - 6455 - 5950 - 5445 - 4940 - 4435 - 3930 - 3425 - 2920 - 2415 - 1910 - 14
5 - 90.-4
Population (in thousands)
Male
Age Group Population (in thousands)
Female
605 0363 242121 484484 121242 3630 605
Bolivia (Plurinational State of), 20191
Bolivia (Plurinational State of)

Influenza and Other Respiratory Viruses: Surveillance in the Americas 2019 / 43
Influenza and Respiratory Syncytial Virus
Virologic data
Acute Respiratory Infection (ARI)
Severe Acute Respiratory Infection (SARI)
Bolivia (Plurinational State of): Distribution of influenza viruses by epidemiological week
0 10 20 30 40
210,000
180,000
150,000
90,000
120,000
50
2014 Threshold
Week
Bolivia (Plurinational State of): Cumulative percent positivity for influenza and respiratory syncytial virus
Influenza virusesn Influenza A(H1N1)pdm09
n Influenza A(H3N2)
n Influenza A not subtyped
n Flu A Non subtypable
n Influenza B/Victoria
n Influenza B/Yamagata
n Influenza B/Lineage non-determined
n Influenza % positivity
Virus Percentages
n Influenza % positivity
n RSV (+) %
Average epidemic curve Alert threshold Lower limit Seasonal threshold 2019
Data from ambulatory cases8
Data from severe cases8
ARI C
ases

44 / Influenza and Other Respiratory Viruses: Surveillance in the Americas 2019
Unless otherwise specified, all data were collected by the PAHO/WHO Influenza Surveillance Team from one or more of the following sources: PAHO online surveys completed by epidemiology or laboratory experts, influenza bulletins published/shared by the countries, country presentations in regional influenza meetings, consultation with country influenza surveillance experts. The document was approved by the relevant national authority.1. U.S. Census Bureau, Population pyramid, 2019; https://www.census.gov/popclock/world/bl2. World Bank. “Population, Total.” World Development Indicators, The World Bank Group, 2019, https://data.worldbank.org/indicator/SP.POP.TOTL. Accessed: 13 Sep. 2019.3. World Bank. “Population Density (people per sq. km of land area).” World Development Indicators, The World Bank Group, 2019, https://data.worldbank.org/indicator/EN.POP.DNST
Accessed: 13 Sep. 2019.4. United Nations, Department of Economic and Social Affairs, Population Division (2019). World Population Prospects 2019, Online Edition. Rev. 1. Available from: https://population.
un.org/wpp/Download/Standard/Population/. Accessed: 13 Sep. 2019.5. Pan American Health Organization / World Health Organization, Evidence and Intelligence for Action in Health / Health Analysis, Metrics and Evidence. Health Situation in the
Americas: Core Indicators 2018. Washington, D.C.: PAHO; 2018. Available from: https://www.paho.org/data/index.php/en/indicators/visualization.html6. Current health expenditure per capita, PPP (current international $) | Data [Internet]. Data.worldbank.org. 2019 [cited 10 October 2019]. Available from: https://data.worldbank.org/
indicator/SH.XPD.CHEX.PP.CD 7. Pan American Health Organization / World Health Organization. Immunization in the Americas [Internet]. Paho.org. 2019 [cited 10 October 2019]. Available from: https://www.paho.org/
en/documents/immunization-americas-2019-summary8. WHO (2020), WHO Average Curves software, Version 0.3 (2019-10-09), © Copyright World Health Organization (WHO), Geneva.
FluID/FluNet/PISA
FluIDReport: YesReported > 33%: YesReported to WHO in 2018: Yes
FluNetReport: YesReported > 33%: YesReported to WHO in 2018: Yes
PISA Parameters
Transmissibility: Yes Seriousness of disease: Yes Impact: No
Human-Animal Interface for Influenza
Intersectoral meetings In progress
Information sharing between sectors In progress (2017)
Surveillance of unusual respiratory cases with exposure to animals Yes (2017)
Influenza Disease Burden
Estimation of medical burden for influenza Yes
Estimation of economic burden for influenza No
Publication of influenza burden of disease Online
Pandemic Influenza Preparedness Planning
Plan available Yes
Part of an all-hazards plan Yes
Year of original publication 2005
Year of last revision/update 2009
Simulations NA
Drills NA
Rapid response teams composed Yes
Risk communication strategy in place Yes
Laboratory CapacityVirologic surveillance YesParticipation in the latest WHO External Quality Assessment Programme (EQAP) Yes
Samples sent to WHO Collaborating Center YesNumber of samples analyzed during 2017–2018 3,913Specimens tested for other respiratory viruses (ORV) Yes
Other respiratory viruses identifiedRSV, adenovirus,
coronavirus, parainfluenza
Influenza VaccineComposition Southern hemisphere
Month of vaccine administration April/May
Percentage of older adults vaccinated7 72%
Percentage of children under 5 vaccinated7 84%
(age of vaccinated children is 6–23 months. 2018)
Percentage of pregnant women vaccinated7 87% (2017)
Percentage of people at higher risk for influenza-related complications vaccinated7 Yes
Percentage of health care workers vaccinated7 Yes

Influenza and Other Respiratory Viruses: Surveillance in the Americas 2019 / 45
POPULATIONPopulation (thousands)2: 209,469Population density (per km2)3: 25.0
Percentage of population < 5 years4: 6.9%Percentage of population ≥ 65 years4: 8.9%
MORTALITYGross mortality rate (per 1,000 population)5: 6.1Mortality rate from all causes at < 5 years of age
(per 1,000 live births)5: 15.6Mortality rate due to communicable diseases
(per 100,000 population)5: 87.5
PUBLIC HEALTHNumber of medical doctors working in the public system
(per 10,000 population)5: 18.9Current health expenditure per capita, PPP*
(current international $)6: 1,777National health expenditure as % of GDP 20165: 3.9
*PPP – Purchasing Power Parity
SURVEILLANCE SYSTEM CHARACTERISTICS INFORMATION SYSTEM
EventWHO case
definition used Surveillance
strategy
Clinical samples collected
from cases
Shipment of samples to NIC (or
laboratory)
Evaluation of surveillance
sites Number of sites Name
Laboratory and epidemiology
integrationOnline report
SARI No* National 100% Daily Annually 3,500
Sivep-gripe
Yes
OnlineILI No** Sentinel
Quota/5 samples per
weekWeekly Annually 131 Yes
INFLUENZA NA National 100% Varies NA NA Yes Yes* SARI: Individual hospitalized with fever, history of fever, accompanied by cough, or sore throat with dyspnea or O2 saturation < 95% or respiratory distress that evolved due to SARI independent of hospitalization.** Individual with fever, who was referred, with fever, history of fever, accompanied by cough or sore throat, and presented these two symptoms in the last 7 days.
Sociodemographic Indicators
Surveillance Systems
Surveillance Map
* The data in the sentinel surveillance map are updated as of January 2019. The population is a projection, as of 2018, by the Instituto Brasileiro de Geografía e Estatística.
Brazil
100+95 - 9990 - 9485 - 8980 - 8475 - 7970 - 7465 - 6960 - 6455 - 5950 - 5445 - 4940 - 4435 - 3930 - 3425 - 2920 - 2415 - 1910 - 14
5 - 90.-4
Population (in millions)
Male
Age Group Population (in millions)
Female
9 05.4 3.61.8 7.27.2 1.83.6 5.40 9
Brazil, 20191
Pop.576,568 45,538,936
● SARI Hospitals (N=3,500) (Not displayed on map)
● ILI Centers (N=131) (Not displayed on map)
◆ National Influenza Centers (N=3)1. Evandro Chagas Institute (Belém) – Technical capacity: IF, RT-PCR, viral isolation – Average samples processed/year: 1,040
2. Adolfo Lutz Institute (São Paulo) – Technical capacity: IF, RT-PCR, viral isolation – Average samples processed/year: 3,744
3. Oswaldo Cruz Institute (Rio de Janeiro) – Technical capacity: IF, RT-PCR, viral isolation – Average samples processed/year: 1,548
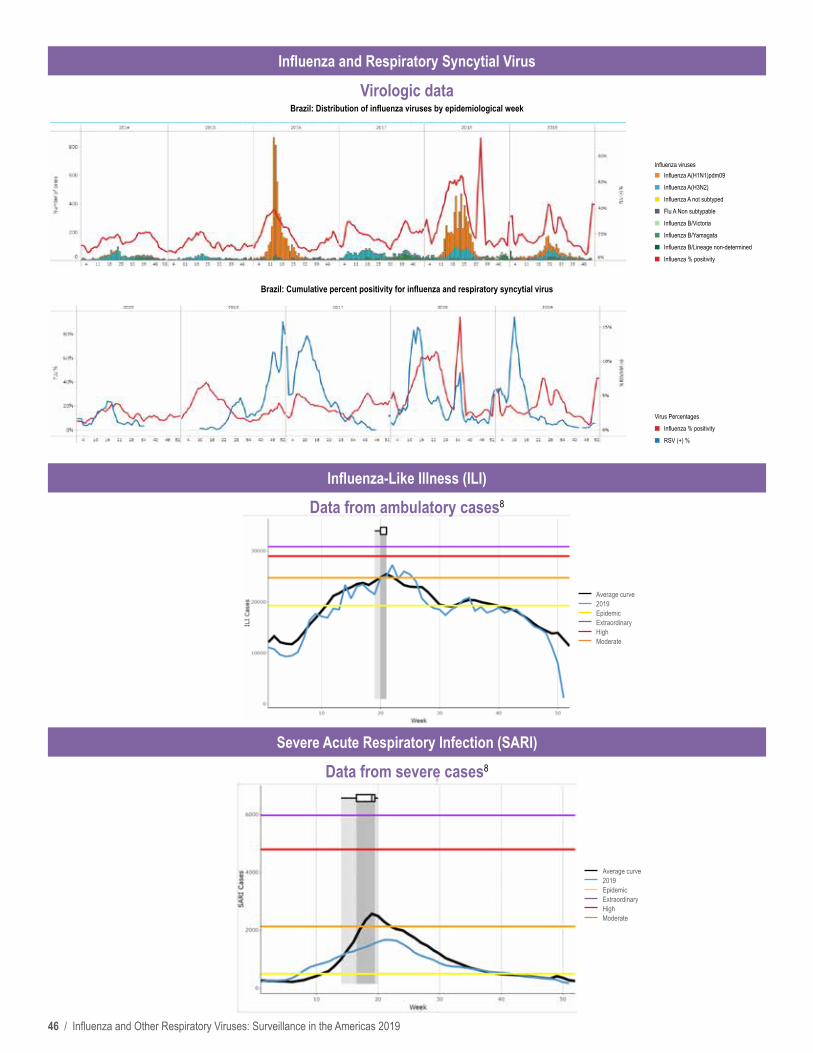
46 / Influenza and Other Respiratory Viruses: Surveillance in the Americas 2019
Data from ambulatory cases
Influenza and Respiratory Syncytial Virus
Influenza-Like Illness (ILI)
Severe Acute Respiratory Infection (SARI)
Virologic data Brazil: Distribution of influenza viruses by epidemiological week
Influenza virusesn Influenza A(H1N1)pdm09
n Influenza A(H3N2)
n Influenza A not subtyped
n Flu A Non subtypable
n Influenza B/Victoria
n Influenza B/Yamagata
n Influenza B/Lineage non-determined
n Influenza % positivity
Virus Percentages
n Influenza % positivity
n RSV (+) %
Brazil: Cumulative percent positivity for influenza and respiratory syncytial virus
Average curve 2019 Epidemic Extraordinary High Moderate
Average curve 2019 Epidemic Extraordinary High Moderate
Data from ambulatory cases8
Data from severe cases8

Influenza and Other Respiratory Viruses: Surveillance in the Americas 2019 / 47
Unless otherwise specified, all data were collected by the PAHO/WHO Influenza Surveillance Team from one or more of the following sources: PAHO online surveys completed by epidemiology or laboratory experts, influenza bulletins published/shared by the countries, country presentations in regional influenza meetings, consultation with country influenza surveillance experts. The document was approved by the relevant national authority.1. U.S. Census Bureau, Population pyramid, 2019; https://www.census.gov/popclock/world/br2. World Bank. “Population, Total.” World Development Indicators, The World Bank Group, 2019, https://data.worldbank.org/indicator/SP.POP.TOTL. Accessed: 13 Sep. 2019.3. World Bank. “Population Density (people per sq. km of land area).” World Development Indicators, The World Bank Group, 2019, https://data.worldbank.org/indicator/EN.POP.DNST
Accessed: 13 Sep. 2019.4. United Nations, Department of Economic and Social Affairs, Population Division (2019). World Population Prospects 2019, Online Edition. Rev. 1. Available from: https://population.
un.org/wpp/Download/Standard/Population/. Accessed: 13 Sep. 2019.5. Pan American Health Organization / World Health Organization, Evidence and Intelligence for Action in Health / Health Analysis, Metrics and Evidence. Health Situation in the
Americas: Core Indicators 2018. Washington, D.C.: PAHO; 2018. Available from: https://www.paho.org/data/index.php/en/indicators/visualization.html6. Current health expenditure per capita, PPP (current international $) | Data [Internet]. Data.worldbank.org. 2019 [cited 10 October 2019]. Available from: https://data.worldbank.org/
indicator/SH.XPD.CHEX.PP.CD 7. Pan American Health Organization / World Health Organization. Immunization in the Americas [Internet]. Paho.org. 2019 [cited 10 October 2019]. Available from: https://www.paho.org/
en/documents/immunization-americas-2019-summary8. WHO (2020), WHO Average Curves software, Version 0.3 (2019-10-09), © Copyright World Health Organization (WHO), Geneva.
FluID/FluNet/PISA
FluIDReport: YesReported > 33%: YesReported to WHO in 2018: Yes
FluNetReport: YesReported > 33%: YesReported to WHO in 2018: Yes
PISA Parameters
Transmissibility: In progress Seriousness of disease: In progress Impact: In progress
Human-Animal Interface for Influenza
Intersectoral meetings Yes
Information-sharing between sectors In progress
Surveillance of unusual respiratory cases with exposure to animals Yes
Influenza Disease Burden
Estimation of medical burden for influenza Yes
Estimation of economic burden for influenza No
Publication of influenza burden of disease NA
Pandemic Influenza Preparedness Planning
Plan available Yes
Part of an all-hazards plan Yes
Year of original publication 2010
Year of last revision/update 2010
Simulations Yes
Drills Yes
Rapid response teams composed Yes
Risk communication strategy in place Yes
Laboratory Capacity
Virologic surveillance Yes
Participation in the latest WHO External Quality Assessment Programme (EQAP) Yes
Samples sent to WHO Collaborating Center YesNumber of samples analyzed during 2017–2018 60,000Specimens tested for other respiratory viruses (ORV) Yes
Other respiratory viruses identified
RSV, adenovirus, parainfluenza 1, 2,
3; metapneumovirus, bocavirus, rhinovirus
Influenza VaccineComposition Southern hemisphereMonth of vaccine administration April
Percentage of older adults vaccinated7 97% (adults over 60 years. 2018)
Percentage of children under 5 vaccinated7 88% (age of vaccinated
children is 6 m – < 5 years. 2018)
Percentage of pregnant women vaccinated7 81% (2018)Percentage of people at higher risk for influenza-related complications vaccinated7 Yes
Percentage of health care workers vaccinated7 95% (2018)

48 / Influenza and Other Respiratory Viruses: Surveillance in the Americas 2019
POPULATIONPopulation (thousands)2: 29.8
Population density (per km2)3: 199.0Percentage of population < 5 years4: NA
Percentage of population ≥ 65 years4: NA
MORTALITYGross mortality rate (per 1,000 population)5: NAMortality rate from all causes at < 5 years of age
(per 1,000 live births)5: 20.3Mortality rate due to communicable diseases
(per 100,000 population)5: NA
PUBLIC HEALTHNumber of medical doctors working in the public system
(per 10,000 population)5: 18.6Current health expenditure per capita, PPP*
(current international $)6: NANational health expenditure as % of GDP 20165: NA
*PPP – Purchasing Power Parity
SURVEILLANCE SYSTEM CHARACTERISTICS INFORMATION SYSTEM
EventWHO case
definition used Surveillance
strategy
Clinical samples collected
from cases
Shipment of samples to NIC (or
laboratory)
Evaluation of surveillance
sites Number of sites Name
Laboratory and epidemiology
integrationOnline report
INFLUENZA NA Sentinel NA 3 times/week NA 14 NA NA Yes
Socio
dem
ogra
phic
Indi
cato
rsSu
rveil
lance
Sys
tem
sSu
rveil
lance
Map
* The data in the sentinel surveillance map are updated as of January 2019. The population is a projection, as of 2018, by the BVI Central Statistics Office.
● SARI Hospitasl (N=1)1. Tortola
▲Laboratories with IF capacity (N=1)1. Tortola
● ILI Centers (N=13)1. Road Town Clinic (Road Town)2. Eureka (Road Town)3. BNF (Road Town)4. Penn Medical (Road Town)5. Pic-Smith Medical (Road Town)6. Bain Medical (Road Town)7. Appex Medical (Virgin Gorda)8. Iris O’Neal (Virgin Gorda-The Valley)9. North Sound Clinic (North Sound-Virgin Gorda)10. Iris Penn (East End)11. Theresa Smith-Blyden (Capoons Bay)12. Jost Van Dyke13. Romalia Smith (Anegada)
Pop.122 23,419
British Virgin Islands
100+95 - 9990 - 9485 - 8980 - 8475 - 7970 - 7465 - 6960 - 6455 - 5950 - 5445 - 4940 - 4435 - 3930 - 3425 - 2920 - 2415 - 1910 - 14
5 - 90.-4
Population (in thousands)
Male
Age Group Population (in thousands)
Female
9 05.4 3.61.8 7.27.2 1.83.6 5.40 9
British Virgin Islands, 20191

Influenza and Other Respiratory Viruses: Surveillance in the Americas 2019 / 49
Influenza and Respiratory Syncytial Virus
Influenza-Like Illness (ILI)
Severe Acute Respiratory Infection (SARI)
Virologic data British Virgin Islands: Distribution of influenza viruses by epidemiological week
British Virgin Islands: Cumulative percent positivity for influenza and respiratory syncytial virus
Not applicable
0 10 20 30
ILI C
ases
40
30
20
10
2012 Threshold
Week
Influenza virusesn Influenza A(H1N1)pdm09
n Influenza A(H3N2)
n Influenza A not subtyped
n Flu A Non subtypable
n Influenza B/Victoria
n Influenza B/Yamagata
n Influenza B/Lineage non-determined
n Influenza % positivity
Virus Percentages
n Influenza % positivity
n RSV (+) %
Data from ambulatory cases8
Data from severe cases

50 / Influenza and Other Respiratory Viruses: Surveillance in the Americas 2019
Unless otherwise specified, all data were collected by the PAHO/WHO Influenza Surveillance Team from one or more of the following sources: PAHO online surveys completed by epidemiology or laboratory experts, influenza bulletins published/shared by the countries, country presentations in regional influenza meetings, consultation with country influenza surveillance experts. The document was approved by the relevant national authority.1. U.S. Census Bureau, Population pyramid, 2019; https://www.census.gov/popclock/world/vi2. World Bank. “Population, Total.” World Development Indicators, The World Bank Group, 2019, https://data.worldbank.org/indicator/SP.POP.TOTL. Accessed: 13 Sep. 2019.3. World Bank. “Population Density (people per sq. km of land area).” World Development Indicators, The World Bank Group, 2019, https://data.worldbank.org/indicator/EN.POP.DNST
Accessed: 13 Sep. 2019.4. United Nations, Department of Economic and Social Affairs, Population Division (2019). World Population Prospects 2019, Online Edition. Rev. 1. Available from: https://population.
un.org/wpp/Download/Standard/Population/. Accessed: 13 Sep. 2019.5. Pan American Health Organization / World Health Organization, Evidence and Intelligence for Action in Health / Health Analysis, Metrics and Evidence. Health Situation in the
Americas: Core Indicators 2018. Washington, D.C.: PAHO; 2018. Available from: https://www.paho.org/data/index.php/en/indicators/visualization.html6. Current health expenditure per capita, PPP (current international $) | Data [Internet]. Data.worldbank.org. 2019 [cited 10 October 2019]. Available from: https://data.worldbank.org/
indicator/SH.XPD.CHEX.PP.CD 7. Pan American Health Organization / World Health Organization. Immunization in the Americas [Internet]. Paho.org. 2019 [cited 10 October 2019]. Available from: https://www.paho.org/
en/documents/immunization-americas-2019-summary8. WHO (2020), WHO Average Curves software, Version 0.3 (2019-10-09), © Copyright World Health Organization (WHO), Geneva.
FluID/FluNet/PISA
FluIDReport: In progressReported > 33%: In progressReported to WHO in 2018: In progress
FluNetReport: YesReported > 33%: YesReported to WHO in 2018: Yes
PISA Parameters
Transmissibility: In progress Seriousness of disease: In progress Impact: In progress
Human-Animal Interface for Influenza
Intersectoral meetings In progress
Information sharing between sectors In progress
Surveillance of unusual respiratory cases with exposure to animals In progress
Influenza Disease Burden
Estimation of medical burden for influenza No
Estimation of economic burden for influenza No
Publication of influenza burden of disease NA
Pandemic Influenza Preparedness Planning
Plan available Yes
Part of an all-hazards plan No
Year of original publication 2010
Year of last revision/update In progress
Simulations Yes
Drills No
Rapid response teams composed Yes
Risk communication strategy in place Yes
Laboratory Capacity
Virologic surveillance No
Participation in the latest WHO External Quality Assessment Programme (EQAP) NA
Samples sent to WHO Collaborating Center NA
Number of samples analyzed during 2017–2018 NA
Specimens tested for other respiratory viruses (ORV) NA
Other respiratory viruses identified NA
Influenza Vaccine
Composition Northern hemisphere
Month of vaccine administration November
Percentage of older adults vaccinated7 82.6% (≥ 65 years)
Percentage of children under 5 vaccinated7 NA
Percentage of pregnant women vaccinated7 NA
Percentage of people at higher risk for influenza-related complications vaccinated7 96%
Percentage of health care workers vaccinated7 6.8%

Influenza and Other Respiratory Viruses: Surveillance in the Americas 2019 / 51
POPULATIONPopulation (thousands)2: 37,059Population density (per km2)3: 4.0
Percentage of population < 5 years4: 5.3%Percentage of population ≥ 65 years4: 17.0%
MORTALITYGross mortality rate (per 1,000 population)5: 3.4Mortality rate from all causes at < 5 years of age
(per 1,000 live births)5: 5.2Mortality rate due to communicable diseases
(per 100,000 population)5: 20.4
PUBLIC HEALTHNumber of medical doctors working in the public system
(per 10,000 population)5: 27.2Current health expenditure per capita, PPP*
(current international $)6: 4,718National health expenditure as % of GDP 20165: 7.7
*PPP – Purchasing Power Parity
Canada
SURVEILLANCE SYSTEM CHARACTERISTICS INFORMATION SYSTEM
EventWHO case
definition used Surveillance
strategy
Clinical samples collected
from cases
Shipment of samples to NIC (or
laboratory)
Evaluation of surveillance
sites Number of
sites Name
Laboratory and
epidemiology integration
Online report
SARI No* Sentinel Quota Varies Varies20 sentinel
hospital sites9 jurisdictions
FluWatch Yes
Online
ILI No** Sentinel NA NA No 120FluWatch - Sentinel
Physician ILI Reporting System
No
ARINo; ICD-10
codes (J00-J22, J144.0)
National Quota NA NA NA Canadian Institute for Health Information - Discharge Abstract
Database
Yes
Online
PNEUMONIA No; ICD-10 codes (J10-J18) National Quota NA NA 578
INFLUENZA NA National Quota
(6,000 tests/week)
Weekly/monthly NA
Participating hospitals & provincial
public health laboratories
FluWatch Online
INFLUENZA MORTALITY NA Sentinel Quota Varies NA 29
* SARI: Hospitalizations with influenza – Any person admitted to hospital with laboratory-confirmed influenza. Intensive care unit admissions with influenza – Any person with laborato-ry-confirmed influenza admitted to an intensive care unit or requiring mechanical ventilation. Deaths with influenza – A death of any person with laboratory-confirmed influenza with no period of complete recovery between illness and death.**ILI: Sudden onset of respiratory symptoms with fever and cough and with one or more of the following: sore throat, joint pain, muscle aches, or fatigue which is likely due to influenza. In children under 5 years of age, symptoms such as nausea, vomiting, and diarrhea may also be present. In patients under 5 years of age or 65 years and older, fever may not be present.
Sociodemographic Indicators
Surveillance Systems
Surveillance Map
◆ National Influenza Centers (N=1)1. National Microbiology Laboratory (Winnipeg)
– Technical capacity: RT-PCR, viral isolation, phenotypic antiviral sensitivity, genotyping, antigenic characterization by HAI, micro-neutralization, whole-genome sequencing
– Average samples processed during 2017–18: 4,278
Pop.38,400 14,322,800
100+95 - 9990 - 9485 - 8980 - 8475 - 7970 - 7465 - 6960 - 6455 - 5950 - 5445 - 4940 - 4435 - 3930 - 3425 - 2920 - 2415 - 1910 - 14
5 - 90.-4
Population (in millions)
Male
Age Group Population (in millions)
Female
2 01.2 0.80.4 1.61.6 0.40.8 1.20 2
Canada, 20191
* The data in the sentinel surveillance map are updated as of January 2019. The population is a projection, as of 2018, by Canada’s National Statistical Agency-Statistics Canada.

52 / Influenza and Other Respiratory Viruses: Surveillance in the Americas 2019
Influenza and Respiratory Syncytial Virus
Influenza-Like Illness (ILI)
Severe Acute Respiratory Infection (SARI)
Virologic data Canada: Distribution of influenza viruses by epidemiological week
Canada: Cumulative percent positivity for influenza and respiratory syncytial virus
Influenza virusesn Influenza A(H1N1)pdm09
n Influenza A(H3N2)
n Influenza A not subtyped
n Flu A Non subtypable
n Influenza B/Victoria
n Influenza B/Yamagata
n Influenza B/Lineage non-determined
n Influenza % positivity
Virus Percentages
n Influenza % positivity
n RSV (+) %
Average curve* 2018/2019 Epidemic Extraordinary High Moderate
2017/2018 2018/2019 2019/2020 Threshold
Data from ambulatory cases8
Data from severe cases8
*The data in the average curve were extracted from the number of pediatric (≤16 years of age) influenza hospitalizations reported by the IMPACT network, by week, Canada. Influenza weekly reports 2015-19 seasons. Available at: https://www.canada.ca/en/public-health/services/diseases/flu-influenza/influenza-surveillance/weekly-influenza-reports.html

Influenza and Other Respiratory Viruses: Surveillance in the Americas 2019 / 53
FluID/FluNet/PISA
FluIDReport: YesReported > 33%: YesReported to WHO in 2018: Yes
FluNetReport: YesReported > 33%: YesReported to WHO in 2018: Yes
PISA Parameters
Transmissibility: Yes Seriousness of disease: No Impact: No
Human-Animal Interface for Influenza
Intersectoral meetings In progress
Information sharing between sectors In progress
Surveillance of unusual respiratory cases with exposure to animals
RSV, adenovirus, parainfluenza 1, 2, 3; metapneumovirus,
bocavirus, rhinovirus, coronavirus (MERS-CoV and HCoV-NL63)
Influenza Disease Burden
Estimation of medical burden for influenza Yes
Estimation of economic burden for influenza Yes
Publication of influenza burden of disease Online
Pandemic Influenza Preparedness PlanningPlan available Yes Part of an all-hazards plan NoYear of original publication 2004Year of last revision/update 2014Simulations NoDrills YesRapid response teams composed NoRisk communication strategy in place Yes
Laboratory Capacity
Virologic surveillance Yes
Participation in the latest WHO External Quality Assessment Programme (EQAP) Yes
Samples sent to WHO Collaborating Center Yes
Number of samples analyzed during 2017–2018 319,851
Specimens tested for other respiratory viruses (ORV) Yes
Other respiratory viruses identified NA
Influenza VaccineComposition Northern hemisphere
Month of vaccine administration October
Percentage of older adults vaccinated7 70% (≥ 65 years)
Percentage of children under 5 vaccinated8 NA
Percentage of pregnant women vaccinated7 NA
Percentage of people at higher risk for influenza-related complications vaccinated7 43%
Percentage of health care workers vaccinated8 NA
Unless otherwise specified, all data were collected by the PAHO/WHO Influenza Surveillance Team from one or more of the following sources: PAHO online surveys completed by epidemiology or laboratory experts, influenza bulletins published/shared by the countries, country presentations in regional influenza meetings, consultation with country influenza surveillance experts. The document was approved by the relevant national authority.1. U.S. Census Bureau, Population pyramid, 2019; https://www.census.gov/popclock/world/ca2. World Bank. “Population, Total.” World Development Indicators, The World Bank Group, 2019, https://data.worldbank.org/indicator/SP.POP.TOTL. Accessed: 13 Sep. 2019.3. World Bank. “Population Density (people per sq. km of land area).” World Development Indicators, The World Bank Group, 2019, https://data.worldbank.org/indicator/EN.POP.DNST
Accessed: 13 Sep. 2019.4. United Nations, Department of Economic and Social Affairs, Population Division (2019). World Population Prospects 2019, Online Edition. Rev. 1. Available from: https://population.
un.org/wpp/Download/Standard/Population/. Accessed: 13 Sep. 2019.5. Pan American Health Organization / World Health Organization, Evidence and Intelligence for Action in Health / Health Analysis, Metrics and Evidence. Health Situation in the
Americas: Core Indicators 2018. Washington, D.C.: PAHO; 2018. Available from: https://www.paho.org/data/index.php/en/indicators/visualization.html6. Current health expenditure per capita, PPP (current international $) | Data [Internet]. Data.worldbank.org. 2019 [cited 10 October 2019]. Available from: https://data.worldbank.org/
indicator/SH.XPD.CHEX.PP.CD 7. Pan American Health Organization / World Health Organization. Immunization in the Americas [Internet]. Paho.org. 2019 [cited 10 October 2019]. Available from: https://www.paho.org/
en/documents/immunization-americas-2019-summary8. Vaccine uptake in Canadian Adults 2019 https://www.canada.ca/en/public-health/services/publications/healthy-living/2018-2019-influenza-flu-vaccine-coverage-survey-results.html9. WHO (2020), WHO Average Curves software, Version 0.3 (2019-10-09), © Copyright World Health Organization (WHO), Geneva.

POPULATIONPopulation (thousands)2: 64.0
Population density (per km2)3: 4.0Percentage of population < 5 years4: NA
Percentage of population ≥ 65 years4: NA
MORTALITYGross mortality rate (per 1,000 population)5: 3.4Mortality rate from all causes at < 5 years of age
(per 1,000 live births)5: 11.0Mortality rate due to communicable diseases
(per 100,000 population)5: NA
PUBLIC HEALTHNumber of medical doctors working in the public system
(per 10,000 population)5: 36.6Current health expenditure per capita, PPP*
(current international $)6: NANational health expenditure as % of GDP 20165: NA
*PPP – Purchasing Power Parity
SURVEILLANCE SYSTEM CHARACTERISTICS INFORMATION SYSTEM
EventWHO case
definition used Surveillance
strategyClinical samples
collected from cases
Shipment of samples to NIC (or
laboratory)
Evaluation of surveillance
sites Number of sites Name
Laboratory and epidemiology
integrationOnline report
ARI Yes Sentinel 100% 2/week No 9
CERNER No NoPNEUMONIA Yes Sentinel Quota
(1-6 samples/week) 2/week No 9
INFLUENZA No; ICD-10 codes used Sentinel Quota (1-6 samples/
week) 2/week NA 9
INFLUENZA MORTALITY NA Sentinel NA 2/week NA 9
Socio
dem
ogra
phic
Indi
cato
rsSu
rveil
lance
Sys
tem
sSu
rveil
lance
Map
* The data in the surveillance map are updated as of January 2019. The population is a projection, as of 2018, by the Cayman Islands Economic and Statistics Office.
● SARI Hospitals (N=1)1. Georgetown
▲ Laboratories with IF capacity (N=1)1. Georgetown
Pop.198 34,878
54 / Influenza and Other Respiratory Viruses: Surveillance in the Americas 2019
Cayman Islands
100+95 - 9990 - 9485 - 8980 - 8475 - 7970 - 7465 - 6960 - 6455 - 5950 - 5445 - 4940 - 4435 - 3930 - 3425 - 2920 - 2415 - 1910 - 14
5 - 90.-4
Population (in thousands)
Male
Age Group Population (in thousands)
Female
3 01.8 1.20.6 2.42.4 0.61.2 1.80 3
Cayman Islands, 20191
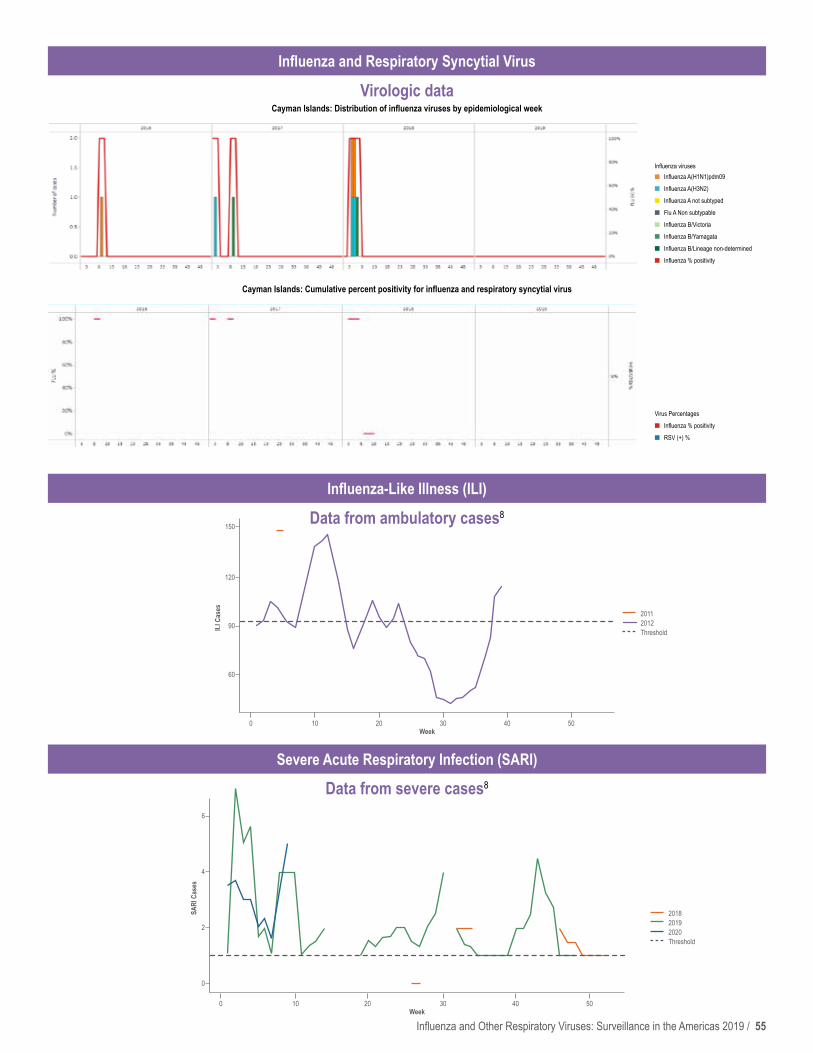
Influenza and Other Respiratory Viruses: Surveillance in the Americas 2019 / 55
Influenza and Respiratory Syncytial Virus
Influenza-Like Illness (ILI)
Severe Acute Respiratory Infection (SARI)
Virologic data Cayman Islands: Distribution of influenza viruses by epidemiological week
Cayman Islands: Cumulative percent positivity for influenza and respiratory syncytial virus
Influenza virusesn Influenza A(H1N1)pdm09
n Influenza A(H3N2)
n Influenza A not subtyped
n Flu A Non subtypable
n Influenza B/Victoria
n Influenza B/Yamagata
n Influenza B/Lineage non-determined
n Influenza % positivity
Virus Percentages
n Influenza % positivity
n RSV (+) %
2018 2019 2020 Threshold
0
0
10
10
20
20
30
30
40
40
50
50
ILI C
ases
SARI
Cas
es
150
6
120
4
90
2
60
0
2011 2012 Threshold
Week
Week
Data from ambulatory cases8
Data from severe cases8

56 / Influenza and Other Respiratory Viruses: Surveillance in the Americas 2019
FluID/FluNet/PISA
FluIDReport: YesReported > 33%: YesReported to WHO in 2018: Yes
FluNetReport: YesReported > 33%: YesReported to WHO in 2018: Yes
PISA Parameters
Transmissibility: In progress Seriousness of disease: In progress Impact: In progress
Human-Animal Interface for Influenza
Intersectoral meetings Yes
Information-sharing between sectors Yes
Surveillance of unusual respiratory cases with exposure to animals No
Influenza Disease Burden
Estimation of medical burden for influenza No
Estimation of economic burden for influenza No
Publication of influenza burden of disease No
Pandemic Influenza Preparedness Planning
Plan available Yes
Part of an all-hazards plan Yes
Year of original publication 2007
Year of last revision/update 2009
Simulations Yes
Drills No
Rapid response teams composed No
Risk communication strategy in place Yes
Laboratory CapacityVirologic surveillance YesParticipation in the latest WHO External Quality Assessment Programme (EQAP) No
Samples sent to WHO Collaborating Center NoNumber of samples analyzed during 2017–2018 NA Specimens tested for other respiratory viruses (ORV) Yes
Other respiratory viruses identifiedRSV, adenovirus,
parainfluenza 1, 2, 3; rhinovirus
Influenza Vaccine
Composition Northern hemisphere
Month of vaccine administration October
Percentage of older adults vaccinated7 NA
Percentage of children under 5 vaccinated7 NA
Percentage of pregnant women vaccinated7 Yes
Percentage of people at higher risk for influenza-related complications vaccinated7 Yes
Percentage of health care workers vaccinated7 Yes
Unless otherwise specified, all data were collected by the PAHO/WHO Influenza Surveillance Team from one or more of the following sources: PAHO online surveys completed by epidemiology or laboratory experts, influenza bulletins published/shared by the countries, country presentations in regional influenza meetings, consultation with country influenza surveillance experts. The document was approved by the relevant national authority. 1. U.S. Census Bureau, Population pyramid, 2019; https://www.census.gov/popclock/world/cj2. World Bank. “Population, Total.” World Development Indicators, The World Bank Group, 2019, https://data.worldbank.org/indicator/SP.POP.TOTL. Accessed: 13 Sep. 2019.3. World Bank. “Population Density (people per sq. km of land area).” World Development Indicators, The World Bank Group, 2019, https://data.worldbank.org/indicator/EN.POP.DNST.
Accessed: 13 Sep. 2019.4. United Nations, Department of Economic and Social Affairs, Population Division (2019). World Population Prospects 2019, Online Edition. Rev. 1. Available from: https://population.
un.org/wpp/Download/Standard/Population/. Accessed: 13 Sep. 2019.5. Pan American Health Organization / World Health Organization, Evidence and Intelligence for Action in Health / Health Analysis, Metrics and Evidence. Health Situation in the
Americas: Core Indicators 2018. Washington, D.C.: PAHO; 2018. Available from: https://www.paho.org/data/index.php/en/indicators/visualization.html6. Current health expenditure per capita, PPP (current international $) | Data [Internet]. Data.worldbank.org. 2019 [cited 10 October 2019]. Available from: https://data.worldbank.org/
indicator/SH.XPD.CHEX.PP.CD 7. Pan American Health Organization / World Health Organization. Immunization in the Americas [Internet]. Paho.org. 2019 [cited 10 October 2019]. Available from: https://www.paho.org/
en/documents/immunization-americas-2019-summary8. WHO (2020), WHO Average Curves software, Version 0.3 (2019-10-09), © Copyright World Health Organization (WHO), Geneva.

Influenza and Other Respiratory Viruses: Surveillance in the Americas 2019 / 57
POPULATIONPopulation (thousands)2: 19,107
Population density (per km2)3: 267.4Percentage of population < 5 years4: 6.4%
Percentage of population ≥ 65 years4: 11.5%
MORTALITYGross mortality rate (per 1,000 population)5: 6.2Mortality rate from all causes at < 5 years of age
(per 1,000 live births)5: 8.1Mortality rate due to communicable diseases
(per 100,000 population)5: 38.0
PUBLIC HEALTHNumber of medical doctors working in the public system
(per 10,000 population)5: 9.1Current health expenditure per capita, PPP*
(current international $)6: 2,002.0National health expenditure as % of GDP 20165: 5.0
*PPP – Purchasing Power Parity
SURVEILLANCE SYSTEM CHARACTERISTICS INFORMATION SYSTEM
EventWHO case
definition used Surveillance
strategy
Clinical samples collected
from cases
Shipment of samples to NIC (or
laboratory)
Evaluation of surveillance
sites Number of sites Name
Laboratory and epidemiology
integrationOnline report
SARI No Sentinel 100% Weekly Annually 7 PAHOFlu Yes Online
ILI No SentinelQuota (5-10
samples/week)
Weekly Annually 42 Filemaker No Online
INFLUENZA Yes National 100% Weekly NA 31 Filemaker No Online
Sociodemographic Indicators
Surveillance Systems
Surveillance Map
* The data in the surveillance map are updated as of January 2019. The population is a projection, as of 2018, by the National Institute of Statistics.
● SARI Hospitals (N=7)1. Hospital Ernesto Torres Galdamez (Iquique)2. Hospital Gustavo Fricke (Viña del Mar)3. Hospital San Juan de Dios (Santiago)4. Hospital Militar (Santiago)5. Hospital Guillermo Grant Benavente (Concepción)6. Hospital Hernán Henríquez Aravena (Temuco)7. Hospital Eduardo Schütz Schroeder (Puerto Montt)
● ILI Centers (N=42)(Not displayed on map)
◆ National Influenza Centers (N=1)1. Public Health Institute of Chile: Respiratory and Exanthematic Virus Section
(Viral Disease Sub Department)– Technical capacity: IF, RT-PCR, viral isolation, sequencing – Average samples processed during 2017–18: 3,277
▲ Laboratories with IF capacity (N=22)Antofagasta, Arica, Atacama, Biobio (2), Coquimbo, Iquique, Los Lagos (2), Los Ríos, Maule, Región Aisén, Región Magallanes (2), Región Metropolitana de Santiago (4), Región O’Higgins, Valparaíso (3).
▲ Laboratories with PCR capacity (N=6)Antofagasta, Concepción, Puerto Montt, Santiago, San Felipe, Temuco
Pop.106,680 7,915,199
100+95 - 9990 - 9485 - 8980 - 8475 - 7970 - 7465 - 6960 - 6455 - 5950 - 5445 - 4940 - 4435 - 3930 - 3425 - 2920 - 2415 - 1910 - 14
5 - 90.-4
Population (in thousands)
Male
Age Group Population (in thousands)
Female
745 0447 298149 596596 149298 4470 745
Chile, 20191
Chile

58 / Influenza and Other Respiratory Viruses: Surveillance in the Americas 2019
Data from ambulatory cases
Data from severe cases
Influenza and Respiratory Syncytial Virus
Influenza-Like Illness (ILI)
Virologic data Chile: Distribution of influenza viruses by epidemiological week
Chile: Cumulative percent positivity for influenza and respiratory syncytial virus
Influenza virusesn Influenza A(H1N1)pdm09
n Influenza A(H3N2)
n Influenza A not subtyped
n Flu A Non subtypable
n Influenza B/Victoria
n Influenza B/Yamagata
n Influenza B/Lineage non-determined
n Influenza % positivity
Virus Percentages
n Influenza % positivity
n RSV (+) %
Average curve 2019 Epidemic Extraordinary High Moderate
Average curve 2019 Epidemic Extraordinary High Moderate
Severe Acute Respiratory Infection (SARI)
Data from ambulatory cases8
Data from severe cases8

Influenza and Other Respiratory Viruses: Surveillance in the Americas 2019 / 59
FluID/FluNet/PISA
FluIDReport: YesReported > 33%: YesReported to WHO in 2018: Yes
FluNetReport: YesReported > 33%: YesReported to WHO in 2018: Yes
PISA Parameters
Transmissibility: In progress Seriousness of disease: In progress Impact: In progress
Human-Animal Interface for Influenza
Intersectoral meetings Yes
Information sharing between sectors Yes
Surveillance of unusual respiratory cases with exposure to animals Yes
Influenza Disease Burden
Estimation of medical burden for influenza Yes
Estimation of economic burden for influenza Yes
Publication of influenza burden of disease Online
Pandemic Influenza Preparedness Planning
Plan available Yes
Part of an all-hazards plan Yes
Year of original publication 2009
Year of last revision/update 2011
Simulations Yes
Drills Yes
Rapid response teams composed Yes
Risk communication strategy in place Yes
Laboratory CapacityVirologic surveillance YesParticipation in the latest WHO External Quality Assessment Programme (EQAP) Yes
Samples sent to WHO Collaborating Center No
Number of samples analyzed during 2017–2018 3,329
Specimens tested for other respiratory viruses (ORV) Yes
Other respiratory viruses identified
RSV, adenovirus, parainfluenza 1, 2, 3; metapneumovirus,
bocavirus, rhinovirus, enterovi-rus, coronavirus NL63, OC43,
229E, HKU1
Influenza Vaccine
Composition Southern hemisphere
Month of vaccine administration April/May
Percentage of older adults vaccinated7 97% (≥ 75 years)
Percentage of children under 5 vaccinated7 63%
Percentage of pregnant women vaccinated7 88%
Percentage of people at higher risk for influenza-related complications vaccinated 85%
Percentage of health care workers vaccinated7 97%
Unless otherwise specified, all data were collected by the PAHO/WHO Influenza Surveillance Team from one or more of the following sources: PAHO online surveys completed by epidemiology or laboratory experts, influenza bulletins published/shared by the countries, country presentations in regional influenza meetings, consultation with country influenza surveillance experts. The document was approved by the relevant national authority. 1. U.S. Census Bureau, Population pyramid, 2019; https://www.census.gov/popclock/world/ci2. Instituto Nacional de Estadísticas Chile. Estimaciones y proyecciones de la población de Chile 2002-2035 a nivel comunal. Documento metodológico. Nov. 2019.
Available from: INE - Chile3. World Bank. “Population Density (people per sq. km of land area).” World Development Indicators, The World Bank Group, 2019, https://data.worldbank.org/indicator/EN.POP.DNST.
Accessed: 13 Sep. 2019.4. United Nations, Department of Economic and Social Affairs, Population Division (2019). World Population Prospects 2019, Online Edition. Rev. 1. Available from: https://population.
un.org/wpp/Download/Standard/Population/. Accessed: 13 Sep. 2019.5. Pan American Health Organization / World Health Organization, Evidence and Intelligence for Action in Health / Health Analysis, Metrics and Evidence. Health Situation in the
Americas: Core Indicators 2018. Washington, D.C.: PAHO; 2018. Available from: https://www.paho.org/data/index.php/en/indicators/visualization.html6. Current health expenditure per capita, PPP (current international $) | Data [Internet]. Data.worldbank.org. 2019 [cited 10 October 2019]. Available from: https://data.worldbank.org/
indicator/SH.XPD.CHEX.PP.CD 7. Pan American Health Organization / World Health Organization. Immunization in the Americas [Internet]. Paho.org. 2019 [cited 10 October 2019]. Available from: https://www.paho.org/
en/documents/immunization-americas-2019-summary8. WHO (2020), WHO Average Curves software, Version 0.3 (2019-10-09), © Copyright World Health Organization (WHO), Geneva.

60 / Influenza and Other Respiratory Viruses: Surveillance in the Americas 2019
POPULATIONPopulation (thousands)2: 49,649
Population density (per km2)3: 45.0Percentage of population < 5 years4: 7.5%
Percentage of population ≥ 65 years4: 8.4%
MORTALITYGross mortality rate (per 1,000 population)5: 6.1Mortality rate from all causes at < 5 years of age
(per 1,000 live births)5: 18.2Mortality rate due to communicable diseases
(per 100,000 population)5: 62.6
PUBLIC HEALTHNumber of medical doctors working in the public system
(per 10,000 population)5: 21.1Current health expenditure per capita, PPP*
(current international $)6: 830National health expenditure as % of GDP 20165: 3.7
*PPP – Purchasing Power Parity
SURVEILLANCE SYSTEM CHARACTERISTICS INFORMATION SYSTEM
EventWHO case definition
used Surveillance
strategy
Clinical samples collected
from cases
Shipment of samples to NIC (or
laboratory)
Evaluation of surveillance
sites Number of sites Name
Laboratory and epidemiology
integrationOnline report
SARI Yes Sentinel 100% Weekly Annually 11
SIVIGILA
Yes OnlineILI Yes Sentinel 100% Weekly Annually 2
ARI No; ICD-10 codes (J00 to J069) National NA No NA 5,000
No OnlinePNEUMONIA No; ICD-10 codes
(J00 to J22) National No No NA 5,000
INFLUENZA MORTALITY NA National 100% Weekly NA NA Yes Online
Socio
dem
ogra
phic
Indi
cato
rsSu
rveil
lance
Sys
tem
sSu
rveil
lance
Map
* The data in the sentinel surveillance map are updated as of January 2019. The population is a projection, as of 2018, by the Colombia National Administrative Department of Statistics.
● SARI Hospitals (N=11)1. Fundación Hospitalaria San Vicente de Paúl (Antioquia)2. Clínica General del Norte (Barranquilla)3. Hospital el Tunal (Bogotá)4. Fundación Cardioinfantil (Bogotá)5. Laboratorio Departamental de Salud Pública (Guaviare)6. Hospital Departamental de Villavicencio (Meta)7. Fundación Hospital San Pedro (Nariño)8. Hospital Infantil Los Ángeles (Nariño)9. Hospital Universitario Erasmo Meoz, (Norte de Santander)10. Hospital Federico Lleras Acosta (Tolima)11. Fundación Valle del Lili (Valle del Cauca)
● ILI Centers (N=2)1. Laboratorio Departamental de Salud Pública (Guaviare)2. Hospital Infantil Napoleón Franco Pareja (Bolívar)
◆ National Influenza Centers (N=1)1. National Institute of Health (Bogotá)
– Technical capacity: IFI, RT-PCR, viral isolation, sequencing – Average samples processed/year: 17,850
Pop.42,815 7,412,566
Colombia
100+95 - 9990 - 9485 - 8980 - 8475 - 7970 - 7465 - 6960 - 6455 - 5950 - 5445 - 4940 - 4435 - 3930 - 3425 - 2920 - 2415 - 1910 - 14
5 - 90.-4
Population (in millions)
Male
Age Group Population (in millions)
Female
3 01.8 1.20.6 2.42.4 0.61.2 1.80 3
Colombia, 20191
▲ Laboratories with PCR capacity (N=3)Pasto, Bogotá, Medellín
– Technical capacity: IF, RT-PCR
▲ Laboratories with IF capacity (N=10)1. Antioquia2. Atlántico3. Boyacá4. Caldas5. Cundinamarca6. Bogotá7. Nariño8. Norte de Santander9. Meta10. Valle del Cauca
– Technical capacity: IF
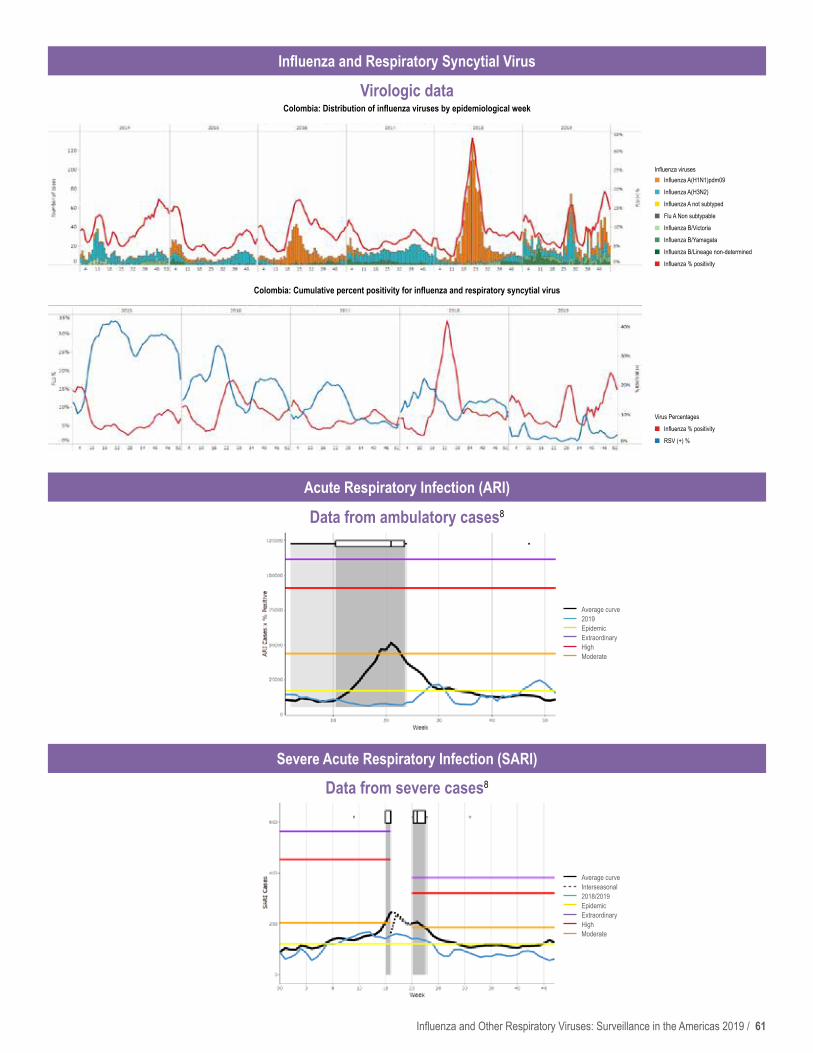
Influenza and Other Respiratory Viruses: Surveillance in the Americas 2019 / 61
Pop.42,815 7,412,566
Data from severe cases8
Data from ambulatory cases8
Influenza and Respiratory Syncytial Virus
Acute Respiratory Infection (ARI)
Severe Acute Respiratory Infection (SARI)
Virologic data Colombia: Distribution of influenza viruses by epidemiological week
Colombia: Cumulative percent positivity for influenza and respiratory syncytial virus
Influenza virusesn Influenza A(H1N1)pdm09
n Influenza A(H3N2)
n Influenza A not subtyped
n Flu A Non subtypable
n Influenza B/Victoria
n Influenza B/Yamagata
n Influenza B/Lineage non-determined
n Influenza % positivity
Virus Percentages
n Influenza % positivity
n RSV (+) %
Average curve 2019 Epidemic Extraordinary High Moderate
Average curve Interseasonal 2018/2019 Epidemic Extraordinary High Moderate

62 / Influenza and Other Respiratory Viruses: Surveillance in the Americas 2019
FluID/FluNet/PISA
FluIDReport: YesReported > 33%: YesReported to WHO in 2018: Yes
FluNetReport: YesReported > 33%: YesReported to WHO in 2018: Yes
PISA Parameters
Transmissibility: Yes Seriousness of disease: YesImpact: Yes
Human-Animal Interface for InfluenzaIntersectoral meetings In progress Information sharing between sectors In progress
Surveillance of unusual respiratory cases with exposure to animals Yes
Influenza Disease Burden
Estimation of medical burden for influenza No
Estimation of economic burden for influenza Yes
Publication of influenza burden of disease In progress
Pandemic Influenza Preparedness Planning
Plan available Yes
Part of an all-hazards plan No
Year of original publication 2006
Year of last revision/update 2010
Simulations Yes
Drills Yes
Rapid response teams composed Yes
Risk communication strategy in place Yes
Laboratory CapacityVirologic surveillance YesParticipation in the latest WHO External Quality Assessment Programme (EQAP)
Yes
Samples sent to WHO Collaborating Center Yes
Number of samples analyzed during 2017–2018 17,850
Specimens tested for other respiratory viruses (ORV) Yes
Other respiratory viruses identified
RSV, adenovirus, parainfluenza 1, 2, 3; metapneumovirus, bocavirus, rhinovirus, enterovirus, coronavirus, RSV subtypes,
adenovirus subtypes, MERSCoV
Influenza Vaccine
Composition Southern hemisphere
Month of vaccine administration May
Percentage of older adults vaccinated 14% (≥ 50 years)
Percentage of children under 5 vaccinated7 66%
Percentage of pregnant women vaccinated7 69%
Percentage of people at higher risk for influenza-related complications vaccinated7 Yes
Percentage of health care workers vaccinated7 NA
Unless otherwise specified, all data were collected by the PAHO/WHO Influenza Surveillance Team from one or more of the following sources: PAHO online surveys completed by epidemiology or laboratory experts, influenza bulletins published/shared by the countries, country presentations in regional influenza meetings, consultation with country influenza surveillance experts. The document was approved by the relevant national authority. 1. U.S. Census Bureau, Population pyramid, 2019; https://www.census.gov/popclock/world/co2. World Bank. “Population, Total.” World Development Indicators, The World Bank Group, 2019, https://data.worldbank.org/indicator/SP.POP.TOTL. Accessed: 13 Sep. 2019.3. World Bank. “Population Density (people per sq. km of land area).” World Development Indicators, The World Bank Group, 2019, https://data.worldbank.org/indicator/EN.POP.DNST.
Accessed: 13 Sep. 2019.4. United Nations, Department of Economic and Social Affairs, Population Division (2019). World Population Prospects 2019, Online Edition. Rev. 1. Available from: https://population.
un.org/wpp/Download/Standard/Population/. Accessed: 13 Sep. 2019.5. Pan American Health Organization / World Health Organization, Evidence and Intelligence for Action in Health / Health Analysis, Metrics and Evidence. Health Situation in the
Americas: Core Indicators 2018. Washington, D.C.: PAHO; 2018. Available from: https://www.paho.org/data/index.php/en/indicators/visualization.html6. Current health expenditure per capita, PPP (current international $) | Data [Internet]. Data.worldbank.org. 2019 [cited 10 October 2019]. Available from: https://data.worldbank.org/
indicator/SH.XPD.CHEX.PP.CD 7. Pan American Health Organization / World Health Organization. Immunization in the Americas [Internet]. Paho.org. 2019 [cited 10 October 2019]. Available from: https://www.paho.org/
en/documents/immunization-americas-2019-summary8. WHO (2020), WHO Average Curves software, Version 0.3 (2019-10-09), © Copyright World Health Organization (WHO), Geneva.

POPULATIONPopulation (thousands)2: 4,999
Population density (per km2)3: 98.0Percentage of population < 5 years4: 7.1%
Percentage of population ≥ 65 years4: 9.5%
MORTALITYGross mortality rate (per 1,000 population)5: 4.4Mortality rate from all causes at < 5 years of age
(per 1,000 live births)5: 9.4Mortality rate due to communicable diseases
(per 100,000 population)5: 30.5
PUBLIC HEALTHNumber of medical doctors working in the public system
(per 10,000 population)5: 30.7Current health expenditure per capita, PPP*
(current international $)6: 1,249National health expenditure as % of GDP 20165: 5.6
*PPP – Purchasing Power Parity
Costa Rica
SURVEILLANCE SYSTEM CHARACTERISTICS INFORMATION SYSTEM
EventWHO case
definition used Surveillance
strategy
Clinical samples collected from
cases
Shipment of samples to NIC (or
laboratory)
Evaluation of
surveillance sites
Number of sites Name
Laboratory and
epidemiology integration
Online report
SARI Yes Sentinel 100% Weekly Quarterly 18PAHOFlu Yes
Online
ILI Yes Sentinel Quota (29 samples/week) Weekly Quarterly 9
ARI No; ICD-10 codes (J000-J006) National No No NA All
facilitiesCompulsory
notification bulletin VE-02 No
PNEUMONIA No; ICD-10 codes (J12) National Quota
(medical criteria) NA NA All facilities
Surveillance bulletin VE-01
INFLUENZA NA Sentinel Quota (29 samples/week) Daily NA 18 PAHOFlu Yes
INFLUENZA MORTALITY NA National Quota
(medical criteria) NA NA All facilities Mortality registry No No
Sociodemographic Indicators
Surveillance Systems
Surveillance Map
* The data in the sentinel surveillance map are updated as of January 2019. The population is a projection, as of 2018, by the Costa Rica National Institute of Statistics and Census.
● SARI Hospitals (N=18)1. Área de Salud (AS de los Santos)2. Hospital Max Peralta (Cartago)3. AS La Cruz4. AS Barranca5. Hospital Monseñor Sanabria (Puntarenas)6. AS Talamaca7. AS La Fortuna8. Hospital de los Chiles9. Hospital de San Carlos10. Hospital de San Vito11. Hospital Escalante Pradilla (Pérez Zeledón)12. AS Alajuela Central13. AS Alajuela Norte14. Hospital de Alajuela15. Coopesalud Pavas16. Hospital Nacional de Niños (San José)17. Hospital San Vicente de Paúl (Heredia)18. AS Grano de Oro
Pop.382,821 1,635,144
Influenza and Other Respiratory Viruses: Surveillance in the Americas 2019 / 63
100+95 - 9990 - 9485 - 8980 - 8475 - 7970 - 7465 - 6960 - 6455 - 5950 - 5445 - 4940 - 4435 - 3930 - 3425 - 2920 - 2415 - 1910 - 14
5 - 90.-4
Population (in thousands)
Male
Age Group Population (in thousands)
Female
220 0132 8844 176176 4488 1320 220
Costa Rica, 20191
● ILI Centers (N=9)1. AS Los Santos2. AS La Cruz3. AS Barranca4. AS Talamanca
5. AS Fortuna6. AS Alajuela Central7. AS Alajuela Norte8. Coopesalud (Pavas)9. Grano de Oro
◆ National Influenza Centers (N=1)1. INCIENSA (Cartago)
– Technical capacity: RT-PCR, viral isolation, hemagglutination, cellular culture
– Average samples processed/year: 5,388
▲ Laboratories with PCR capacity (N=1)1. Hospital Nacional de Niños (San José)
– Technical capacity: RT-PCR, IF
▲ Laboratories with IF capacity (N=1)1. Chacarita, Puntarenas

64 / Influenza and Other Respiratory Viruses: Surveillance in the Americas 2019
Influenza and Respiratory Syncytial Virus
Influenza-Like Illness (ILI)
Severe Acute Respiratory Infection (SARI)
Virologic data Costa Rica: Distribution of influenza viruses by epidemiological week
Costa Rica: Cumulative percent positivity for influenza and respiratory syncytial virus
Data from ambulatory cases8
Data from severe cases8
Influenza virusesn Influenza A(H1N1)pdm09
n Influenza A(H3N2)
n Influenza A not subtyped
n Flu A Non subtypable
n Influenza B/Victoria
n Influenza B/Yamagata
n Influenza B/Lineage non-determined
n Influenza % positivity
Virus Percentages
n Influenza % positivity
n RSV (+) %
2019 2020 Threshold
Average curve Interseasonal 2018/2019 Epidemic Extraordinary High Moderate
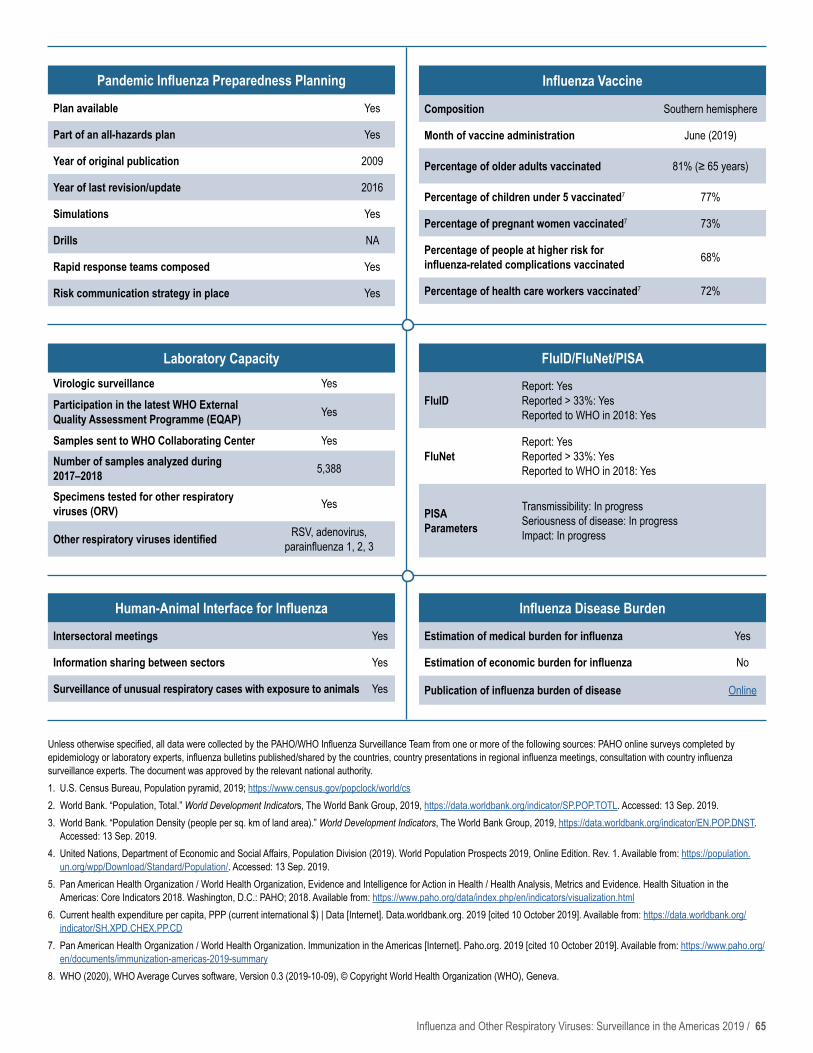
Influenza and Other Respiratory Viruses: Surveillance in the Americas 2019 / 65
FluID/FluNet/PISA
FluIDReport: YesReported > 33%: YesReported to WHO in 2018: Yes
FluNetReport: YesReported > 33%: YesReported to WHO in 2018: Yes
PISA Parameters
Transmissibility: In progress Seriousness of disease: In progress Impact: In progress
Human-Animal Interface for Influenza
Intersectoral meetings Yes
Information sharing between sectors Yes
Surveillance of unusual respiratory cases with exposure to animals Yes
Influenza Disease Burden
Estimation of medical burden for influenza Yes
Estimation of economic burden for influenza No
Publication of influenza burden of disease Online
Pandemic Influenza Preparedness Planning
Plan available Yes
Part of an all-hazards plan Yes
Year of original publication 2009
Year of last revision/update 2016
Simulations Yes
Drills NA
Rapid response teams composed Yes
Risk communication strategy in place Yes
Laboratory CapacityVirologic surveillance Yes
Participation in the latest WHO External Quality Assessment Programme (EQAP) Yes
Samples sent to WHO Collaborating Center YesNumber of samples analyzed during 2017–2018 5,388
Specimens tested for other respiratory viruses (ORV) Yes
Other respiratory viruses identified RSV, adenovirus, parainfluenza 1, 2, 3
Influenza Vaccine
Composition Southern hemisphere
Month of vaccine administration June (2019)
Percentage of older adults vaccinated 81% (≥ 65 years)
Percentage of children under 5 vaccinated7 77%
Percentage of pregnant women vaccinated7 73%
Percentage of people at higher risk for influenza-related complications vaccinated 68%
Percentage of health care workers vaccinated7 72%
Unless otherwise specified, all data were collected by the PAHO/WHO Influenza Surveillance Team from one or more of the following sources: PAHO online surveys completed by epidemiology or laboratory experts, influenza bulletins published/shared by the countries, country presentations in regional influenza meetings, consultation with country influenza surveillance experts. The document was approved by the relevant national authority. 1. U.S. Census Bureau, Population pyramid, 2019; https://www.census.gov/popclock/world/cs2. World Bank. “Population, Total.” World Development Indicators, The World Bank Group, 2019, https://data.worldbank.org/indicator/SP.POP.TOTL. Accessed: 13 Sep. 2019.3. World Bank. “Population Density (people per sq. km of land area).” World Development Indicators, The World Bank Group, 2019, https://data.worldbank.org/indicator/EN.POP.DNST.
Accessed: 13 Sep. 2019.4. United Nations, Department of Economic and Social Affairs, Population Division (2019). World Population Prospects 2019, Online Edition. Rev. 1. Available from: https://population.
un.org/wpp/Download/Standard/Population/. Accessed: 13 Sep. 2019.5. Pan American Health Organization / World Health Organization, Evidence and Intelligence for Action in Health / Health Analysis, Metrics and Evidence. Health Situation in the
Americas: Core Indicators 2018. Washington, D.C.: PAHO; 2018. Available from: https://www.paho.org/data/index.php/en/indicators/visualization.html6. Current health expenditure per capita, PPP (current international $) | Data [Internet]. Data.worldbank.org. 2019 [cited 10 October 2019]. Available from: https://data.worldbank.org/
indicator/SH.XPD.CHEX.PP.CD 7. Pan American Health Organization / World Health Organization. Immunization in the Americas [Internet]. Paho.org. 2019 [cited 10 October 2019]. Available from: https://www.paho.org/
en/documents/immunization-americas-2019-summary8. WHO (2020), WHO Average Curves software, Version 0.3 (2019-10-09), © Copyright World Health Organization (WHO), Geneva.

66 / Influenza and Other Respiratory Viruses: Surveillance in the Americas 2019
POPULATIONPopulation (thousands)2: 11,338
Population density (per km2)3: 109.0Percentage of population < 5 years4: 5.4%
Percentage of population ≥ 65 years4: 15.2%
MORTALITYGross mortality rate (per 1,000 population)5: 4.8Mortality rate from all causes at < 5 years of age
(per 1,000 live births)5: 5.3Mortality rate due to communicable diseases
(per 100,000 population)5: 41.1
PUBLIC HEALTHNumber of medical doctors working in the public system
(per 10,000 population)5: 84.2Current health expenditure per capita, PPP*
(current international $)6: 2,458National health expenditure as % of GDP 20165: 10.9
*PPP – Purchasing Power Parity
Cuba
SURVEILLANCE SYSTEM CHARACTERISTICS INFORMATION SYSTEM
EventWHO case
definition used Surveillance
strategy
Clinical samples collected
from cases
Shipment of samples to NIC (or
laboratory)
Evaluation of surveillance
sites Number of sites Name
Laboratory and epidemiology
integrationOnline report
SARI Yes National 100% Daily Monthly 1,201
EDO
NA
Online
ILI Yes National 100% Daily Monthly 1,201
No
ARI No; ICD-10 codes (J00-J22) National 100% Daily NA 1,201
PNEUMONIA No; ICD-10 codes (J09-J18) National 100% NA NA 1,201
INFLUENZA NA National 100% NA NA 150
INFLUENZA MORTALITY NA National 100% Daily NA 1,201 Yes
Socio
dem
ogra
phic
Indi
cato
rsSu
rveil
lance
Sys
tem
sSu
rveil
lance
Map
* The data in the sentinel surveillance map are updated as of January 2019. The population is a projection, as of 2018, by the Cuba National Statistics and Information Office
Pop.86,300 2,142,000
100+95 - 9990 - 9485 - 8980 - 8475 - 7970 - 7465 - 6960 - 6455 - 5950 - 5445 - 4940 - 4435 - 3930 - 3425 - 2920 - 2415 - 1910 - 14
5 - 90.-4
Population (in thousands)
Male
Age Group Population (in thousands)
Female
515 0309 206103 412412 103206 3090 515
Cuba, 20191
▲ Laboratories with PCR capacity (N=1)1. Havana
– Technical capacity: IF, RT-PCR
▲ Laboratories with IF capacity (N=2)1. Villa Clara2. Santiago de Cuba
– Technical capacity: IF
● SARI Surveillance1. Policlinics 4352. Hospitals 1503. Others 616(Not shown on map)
● ILI Surveillance1. Policlinics 4352. Hospitals 1503. Others 616)(Not shown on map)
◆ National Influenza Centers (N=1)1. Havana
– Technical capacity: RT-PCR, viral isolation, hemagglutination, cellular culture – Average samples processed/year: 3,329

Influenza and Other Respiratory Viruses: Surveillance in the Americas 2019 / 67
Pop.86,300 2,142,000
Influenza and Respiratory Syncytial Virus
Influenza-Like Illness (ILI)
Severe Acute Respiratory Infection (SARI)
Virologic data Cuba: Distribution of influenza viruses by epidemiological week
Cuba: Cumulative percent positivity for influenza and respiratory syncytial virus
Data from ambulatory cases8
Data from severe cases8
Influenza virusesn Influenza A(H1N1)pdm09
n Influenza A(H3N2)
n Influenza A not subtyped
n Flu A Non subtypable
n Influenza B/Victoria
n Influenza B/Yamagata
n Influenza B/Lineage non-determined
n Influenza % positivity
Virus Percentages
n Influenza % positivity
n RSV (+) %
Average curve 2019 Epidemic Extraordinary High Moderate
Average curve Interseasonal 2018/2019 Epidemic Extraordinary High Moderate

68 / Influenza and Other Respiratory Viruses: Surveillance in the Americas 2019
FluID/FluNet/PISA
FluIDReport: YesReported > 33%: YesReported to WHO in 2018: Yes
FluNetReport: YesReported > 33%: YesReported to WHO in 2018: Yes
PISA Parameters
Transmissibility: In progress Seriousness of disease: In progress Impact: In progress
Human-Animal Interface for Influenza
Intersectoral meetings Yes
Information sharing between sectors Yes
Surveillance of unusual respiratory cases with exposure to animals Yes
Influenza Disease Burden
Estimation of medical burden for influenza No
Estimation of economic burden for influenza NA
Publication of influenza burden of disease NA
Pandemic Influenza Preparedness Planning
Plan available Yes
Part of an all-hazards plan Yes
Year of original publication 2009
Year of last revision/update 2011
Simulations Yes
Drills Yes
Rapid response teams composed Yes
Risk communication strategy in place Yes
Laboratory CapacityVirologic surveillance YesParticipation in the latest WHO External Quality Assessment Programme (EQAP) Yes
Samples sent to WHO Collaborating Center No
Number of samples analyzed during 2017–2018 3,329
Specimens tested for other respiratory viruses (ORV) Yes
Other respiratory viruses identified
RSV, adenovirus, parainfluenza 1, 2, 3; metapneumovirus,
bocavirus, rhinovirus, enterovirus, coronavirus NL63,
OC43, 229E, HKU1
Influenza Vaccine
Composition Southern hemisphere
Month of vaccine administration April/May
Percentage of older adults vaccinated7 97% (≥ 75 years)
Percentage of children under 5 vaccinated7 63%
Percentage of pregnant women vaccinated7 88%
Percentage of people at higher risk for influenza-related complications vaccinated 85%
Percentage of health care workers vaccinated7 97%
Unless otherwise specified, all data were collected by the PAHO/WHO Influenza Surveillance Team from one or more of the following sources: PAHO online surveys completed by epidemiology or laboratory experts, influenza bulletins published/shared by the countries, country presentations in regional influenza meetings, consultation with country influenza surveillance experts. The document was approved by the relevant national authority. 1. U.S. Census Bureau, Population pyramid, 2019; https://www.census.gov/popclock/world/cu2. World Bank. “Population, Total.” World Development Indicators, The World Bank Group, 2019, https://data.worldbank.org/indicator/SP.POP.TOTL. Accessed: 13 Sep. 2019.3. World Bank. “Population Density (people per sq. km of land area).” World Development Indicators, The World Bank Group, 2019, https://data.worldbank.org/indicator/EN.POP.DNST.
Accessed: 13 Sep. 2019.4. United Nations, Department of Economic and Social Affairs, Population Division (2019). World Population Prospects 2019, Online Edition. Rev. 1. Available from: https://population.
un.org/wpp/Download/Standard/Population/. Accessed: 13 Sep. 2019.5. Pan American Health Organization / World Health Organization, Evidence and Intelligence for Action in Health / Health Analysis, Metrics and Evidence. Health Situation in the
Americas: Core Indicators 2018. Washington, D.C.: PAHO; 2018. Available from: https://www.paho.org/data/index.php/en/indicators/visualization.html6. Current health expenditure per capita, PPP (current international $) | Data [Internet]. Data.worldbank.org. 2019 [cited 10 October 2019]. Available from: https://data.worldbank.org/
indicator/SH.XPD.CHEX.PP.CD 7. Pan American Health Organization / World Health Organization. Immunization in the Americas [Internet]. Paho.org. 2019 [cited 10 October 2019]. Available from: https://www.paho.org/
en/documents/immunization-americas-2019-summary8. WHO (2020), WHO Average Curves software, Version 0.3 (2019-10-09), © Copyright World Health Organization (WHO), Geneva.

Influenza and Other Respiratory Viruses: Surveillance in the Americas 2019 / 69
POPULATIONPopulation (thousands)2: 72
Population density (per km2)3: 96Percentage of population < 5 years4: NA
Percentage of population ≥ 65 years4: 13.0%
MORTALITYGross mortality rate (per 1,000 population)5: 6.8Mortality rate from all causes at < 5 years of age
(per 1,000 live births)5: 13.8Mortality rate due to communicable diseases
(per 100,000 population)5: 94.1
PUBLIC HEALTHNumber of medical doctors working in the public system
(per 10,000 population)5: 11.1Current health expenditure per capita, PPP*
(current international $)6: 581.0National health expenditure as % of GDP 20165: 3.4
*PPP – Purchasing Power Parity
Dominica
SURVEILLANCE SYSTEM CHARACTERISTICS INFORMATION SYSTEM
Event
WHO case definition
used Surveillance
strategy
Clinical samples collected
from cases
Shipment of samples to NIC (or
laboratory)
Evaluation of surveillance
sites Number of sites Name
Laboratory and epidemiology
integrationOnline report
SARI Yes Sentinel 100% Weekly Weekly 1 PAHOFlu Yes No
INFLUENZA MORTALITY NA National No No NA All public health
facilitiesMORT-BASE No No
Sociodemographic Indicators
Surveillance Systems
Surveillance Map
* The data in the sentinel surveillance map are updated as of January 2019. The population is a projection, as of 2018, by the Central Statistics Office, Commonwealth of Dominica.
● SARI Hospitals (N=1)1. Princess Margaret Hospital (Goodwill/Roseau)
Pop.1,430 21,241
100+95 - 9990 - 9485 - 8980 - 8475 - 7970 - 7465 - 6960 - 6455 - 5950 - 5445 - 4940 - 4435 - 3930 - 3425 - 2920 - 2415 - 1910 - 14
5 - 90.-4
Population (in thousands)
Male
Age Group Population (in thousands)
Female
4 02.4 1.60.8 3.23.2 0.81.6 2.40 4
Dominica, 20191

70 / Influenza and Other Respiratory Viruses: Surveillance in the Americas 2019
Influenza and Respiratory Syncytial Virus
Influenza-Like Illness (ILI)
Severe Acute Respiratory Infection (SARI)
Virologic data Dominica: Distribution of influenza viruses by epidemiological week
Not applicable
Data from ambulatory cases
Data from severe cases8
Influenza virusesn Influenza A(H1N1)pdm09
n Influenza A(H3N2)
n Influenza A not subtyped
n Flu A Non subtypable
n Influenza B/Victoria
n Influenza B/Yamagata
n Influenza B/Lineage non-determined
n Influenza % positivity
Virus Percentages
n Influenza % positivity
n RSV (+) %
Average curve Interseasonal 2018/2019 Epidemic Extraordinary High Moderate
Dominica: Cumulative percent positivity for influenza and respiratory syncytial virus

Influenza and Other Respiratory Viruses: Surveillance in the Americas 2019 / 71
FluID/FluNet/PISA
FluIDReport: YesReported > 33%: YesReported to WHO in 2018: Yes
FluNetReport: YesReported > 33%: YesReported to WHO in 2018: Yes
PISA Parameters
Transmissibility: In progress Seriousness of disease: In progress Impact: In progress
Human-Animal Interface for Influenza
Intersectoral meetings Yes
Information sharing between sectors Yes
Surveillance of unusual respiratory cases with exposure to animals Yes
Influenza Disease Burden
Estimation of medical burden for influenza No
Estimation of economic burden for influenza No
Publication of influenza burden of disease No
Pandemic Influenza Preparedness Planning
Plan available Yes
Part of an all-hazards plan No
Year of original publication 2013
Year of last revision/update 2013
Simulations Yes
Drills No
Rapid response teams composed No
Risk communication strategy in place Yes
Laboratory CapacityVirologic surveillance YesParticipation in the latest WHO External Quality Assessment Programme (EQAP) No
Samples sent to WHO Collaborating Center NoNumber of samples analyzed during 2017–2018 NA
Specimens tested for other respiratory viruses (ORV) Yes
Other respiratory viruses identified RSV, adenovirus, parainflu-enza 1, 2, 3; rhinovirus
Influenza Vaccine
Composition Northern hemisphere
Month of vaccine administration September
Percentage of older adults vaccinated7 29% (≥ 65 years)
Percentage of children under 5 vaccinated7 NA
Percentage of pregnant women vaccinated7 Yes
Percentage of people at higher risk for influenza-related complications vaccinated7 Yes
Percentage of health care workers vaccinated7 19%
Unless otherwise specified, all data were collected by the PAHO/WHO Influenza Surveillance Team from one or more of the following sources: PAHO online surveys completed by epidemiology or laboratory experts, influenza bulletins published/shared by the countries, country presentations in regional influenza meetings, consultation with country influenza surveillance experts. The document was approved by the relevant national authority. 1. U.S. Census Bureau, Population pyramid, 2019; https://www.census.gov/popclock/world/do2. World Bank. “Population, Total.” World Development Indicators, The World Bank Group, 2019, https://data.worldbank.org/indicator/SP.POP.TOTL. Accessed: 13 Sep. 2019.3. World Bank. “Population Density (people per sq. km of land area).” World Development Indicators, The World Bank Group, 2019, https://data.worldbank.org/indicator/EN.POP.DNST.
Accessed: 13 Sep. 2019.4. United Nations, Department of Economic and Social Affairs, Population Division (2019). World Population Prospects 2019, Online Edition. Rev. 1. Available from: https://population.
un.org/wpp/Download/Standard/Population/. Accessed: 13 Sep. 2019.5. Pan American Health Organization / World Health Organization, Evidence and Intelligence for Action in Health / Health Analysis, Metrics and Evidence. Health Situation in the
Americas: Core Indicators 2018. Washington, D.C.: PAHO; 2018. Available from: https://www.paho.org/data/index.php/en/indicators/visualization.html6. Current health expenditure per capita, PPP (current international $) | Data [Internet]. Data.worldbank.org. 2019 [cited 10 October 2019]. Available from: https://data.worldbank.org/
indicator/SH.XPD.CHEX.PP.CD 7. Pan American Health Organization / World Health Organization. Immunization in the Americas [Internet]. Paho.org. 2019 [cited 10 October 2019]. Available from: https://www.paho.org/
en/documents/immunization-americas-2019-summary8. WHO (2020), WHO Average Curves software, Version 0.3 (2019-10-09), © Copyright World Health Organization (WHO), Geneva.

72 / Influenza and Other Respiratory Viruses: Surveillance in the Americas 2019
POPULATIONPopulation (thousands)2: 10,627
Population density (per km2)3: 220.0Percentage of population < 5 years4: 9.5%
Percentage of population ≥ 65 years4: 7.1%
MORTALITYGross mortality rate (per 1,000 population)5: 6.6Mortality rate from all causes at < 5 years of age
(per 1,000 live births)5: 24.5Mortality rate due to communicable diseases
(per 100,000 population)6: 96.2
PUBLIC HEALTHNumber of medical doctors working in the public system
(per 10,000 population)5: 14.1Current health expenditure per capita, PPP*
(current international $)6: 937National health expenditure as % of GDP 20165: 2.8
*PPP – Purchasing Power Parity
SURVEILLANCE SYSTEM CHARACTERISTICS INFORMATION SYSTEM
EventWHO case
definition used Surveillance
strategy
Clinical samples collected
from cases
Shipment of samples to NIC (or
laboratory)
Evaluation of surveillance
sites Number of sites Name
Laboratory and epidemiology
integrationOnline report
SARI Yes SentinelQuota (5 samples/
week)Weekly Annually 7
Sistema Nacional de Vigilancia
Epidemiológica (SINAVE)
Yes Online
ILI Yes SentinelQuota (5 samples/
week)Weekly 1-2 each year 1 NA NA
ARINo; ICD-10
codes (J00/J02, A36/A37/J10/J18/J20/J21)
National No No NA 2,566 NA Online
Socio
dem
ogra
phic
Indi
cato
rsSu
rveil
lance
Sys
tem
sSu
rveil
lance
Map
Dominican Republic
100+95 - 9990 - 9485 - 8980 - 8475 - 7970 - 7465 - 6960 - 6455 - 5950 - 5445 - 4940 - 4435 - 3930 - 3425 - 2920 - 2415 - 1910 - 14
5 - 90.-4
Population (in thousands)
Male
Age Group Population (in thousands)
Female
495 0297 19899 396396 99198 2970 495
Dominican Republic, 20191
* The data in the sentinel surveillance map are updated as of January 2019. The population is a projection, as of 2018, by the Dominican Republic National Statistics Office.
Pop.34,391 2,805,228
● SARI Hospitals (N=7)1. Hospital Regional Taiwan (Azua)2. Hospital Infantil Robert Reid Cabral (Distrito Nacional)3. Hospital Dr. Antonio Musa (San Pedro de Macoris)4. Hospital Infantil Dr. Arturo Grullón (Santiago)5. Hospital José María Cabral y Báez (Santiago)6. Hospital Santo Domingo (Distrito Nacional)7. Centro Médico Punta Cana (La Altagracia)
● ILI Centers (N=1)1. Hospital Municipal José Contreras (Espaillat)
◆ National Influenza Centers (N=1)1. Laboratorio Nacional de Salud Pública Dr. Defilló (Distrito Nacional)
– Technical capacity: IF, RT-PCR– Average samples processed/year: 2,041
▲ Laboratories with IF capacity (N=1)1. José María Cabral y Báez (Santiago)
– Technical capacity: IF

Influenza and Other Respiratory Viruses: Surveillance in the Americas 2019 / 73
Influenza and Respiratory Syncytial Virus
Acute Respiratory Infection (ARI)
Severe Acute Respiratory Infection (SARI)
Virologic data Dominican Republic: Distribution of influenza viruses by epidemiological week
Dominican Republic: Cumulative percent positivity for influenza and respiratory syncytial virus
Data from ambulatory cases8
Data from severe cases8
Influenza virusesn Influenza A(H1N1)pdm09
n Influenza A(H3N2)
n Influenza A not subtyped
n Flu A Non subtypable
n Influenza B/Victoria
n Influenza B/Yamagata
n Influenza B/Lineage non-determined
n Influenza % positivity
Virus Percentages
n Influenza % positivity
n RSV (+) %
2020 Threshold
2020 2019 Threshold

74 / Influenza and Other Respiratory Viruses: Surveillance in the Americas 2019
Unless otherwise specified, all data were collected by the PAHO/WHO Influenza Surveillance Team from one or more of the following sources: PAHO online surveys completed by epidemiology or laboratory experts, influenza bulletins published/shared by the countries, country presentations in regional influenza meetings, consultation with country influenza surveillance experts. The document was approved by the relevant national authority. 1. U.S. Census Bureau, Population pyramid, 2019; https://www.census.gov/popclock/world/dr2. World Bank. “Population, Total.” World Development Indicators, The World Bank Group, 2019, https://data.worldbank.org/indicator/SP.POP.TOTL. Accessed: 13 Sep. 2019.3. World Bank. “Population Density (people per sq. km of land area).” World Development Indicators, The World Bank Group, 2019, https://data.worldbank.org/indicator/EN.POP.DNST.
Accessed: 13 Sep. 2019.4. United Nations, Department of Economic and Social Affairs, Population Division (2019). World Population Prospects 2019, Online Edition. Rev. 1. Available from: https://population.
un.org/wpp/Download/Standard/Population/. Accessed: 13 Sep. 2019.5. Pan American Health Organization / World Health Organization, Evidence and Intelligence for Action in Health / Health Analysis, Metrics and Evidence. Health Situation in the
Americas: Core Indicators 2018. Washington, D.C.: PAHO; 2018. Available from: https://www.paho.org/data/index.php/en/indicators/visualization.html6. Current health expenditure per capita, PPP (current international $) | Data [Internet]. Data.worldbank.org. 2019 [cited 10 October 2019]. Available from: https://data.worldbank.org/
indicator/SH.XPD.CHEX.PP.CD 7. Pan American Health Organization / World Health Organization. Immunization in the Americas [Internet]. Paho.org. 2019 [cited 10 October 2019]. Available from: https://www.paho.org/
en/documents/immunization-americas-2019-summary8. WHO (2020), WHO Average Curves software, Version 0.3 (2019-10-09), © Copyright World Health Organization (WHO), Geneva.
FluID/FluNet/PISA
FluIDReport: YesReported > 33%: YesReported to WHO in 2018: Yes
FluNetReport: YesReported > 33%: YesReported to WHO in 2018: Yes
PISA Parameters
Transmissibility: In progress Seriousness of disease: In progress Impact: In progress
Human-Animal Interface for Influenza
Intersectoral meetings In progress
Information sharing between sectors In progress
Surveillance of unusual respiratory cases with exposure to animals Yes
Influenza Disease Burden
Estimation of medical burden for influenza No
Estimation of economic burden for influenza No
Publication of influenza burden of disease NA
Pandemic Influenza Preparedness Planning
Plan available Yes
Part of an all-hazards plan Yes
Year of original publication 2007
Year of last revision/update 2007
Simulations Yes
Drills No
Rapid response teams composed Yes
Risk communication strategy in place Yes
Laboratory CapacityVirologic surveillance YesParticipation in the latest WHO External Quality Assessment Programme (EQAP) Yes
Samples sent to WHO Collaborating Center Yes
Number of samples analyzed during 2017–2018 1,688
Specimens tested for other respiratory viruses (ORV) Yes
Other respiratory viruses identified RSV, adenovirus, parainfluenza 1, 2, 3
Influenza VaccineComposition Northern hemisphereMonth of vaccine administration October Percentage of older adults vaccinated 4% (≥ 65 years)
Percentage of children under 5 vaccinated7
19% (age of vaccinated children is 6-23 months. November to December
of 2018)Percentage of pregnant women vaccinated7 87%Percentage of people at higher risk for influenza-related complications vaccinated Yes
Percentage of health care workers vaccinated7 Yes

Influenza and Other Respiratory Viruses: Surveillance in the Americas 2019 / 75
POPULATIONPopulation (thousands)2: 17,084.3Population density (per km2)3: 69.0
Percentage of population < 5 years4: 9.7%Percentage of population ≥ 65 years4: 7.2%
MORTALITYGross mortality rate (per 1,000 population)5: 5.5Mortality rate from all causes at < 5 years of age
(per 1,000 live births)5: 13.8Mortality rate due to communicable diseases
(per 100,000 population)6: 78.0
PUBLIC HEALTHNumber of medical doctors working in the public system
(per 10,000 population)5: 22.2Current health expenditure per capita, PPP*
(current international $)6: 943National health expenditure as % of GDP 20165: 4.3
*PPP – Purchasing Power Parity
SURVEILLANCE SYSTEM CHARACTERISTICS INFORMATION SYSTEM
EventWHO case
definition used Surveillance
strategy
Clinical samples collected
from cases
Shipment of samples to NIC (or
laboratory)
Evaluation of surveillance
sites Number of sites Name
Laboratory and
epidemiology integration
Online report
SARI Yes Sentinel 100% 3 times a week Annually 16
hospitals Sistema de Vigilancia de Infecciones Respiratorias
Agudas Graves
Yes
Online
PNEUMONIANo; ICD-10
codes (J09-J18, J20-J22X)
National No No NA 2,969Sistema Nacional de Vigilancia en Salud
PúblicaOnline
INFLUENZA NA National 100% 3 times a week NA 2,969
Sistema de Vigilancia de Infecciones Respiratorias
Agudas GravesOnline
Sociodemographic Indicators
Surveillance Systems
Surveillance Map
* The data in the sentinel surveillance map are updated as of January 2019. The population is a projection, as of 2018, by the Ecuador National Institute of Statistics and Census.
Pop.25,124 3,645,483
Ecuador
100+95 - 9990 - 9485 - 8980 - 8475 - 7970 - 7465 - 6960 - 6455 - 5950 - 5445 - 4940 - 4435 - 3930 - 3425 - 2920 - 2415 - 1910 - 14
5 - 90.-4
Population (in thousands)
Male
Age Group Population (in thousands)
Female
770 0462 308154 616616 154308 4620 770
Ecuador, 20191
● SARI Hospitals (N=16)1. Hospital Carlos Andrade Marín (Quito)2. Hospital de Niños Baca Ortiz (Quito)3. Hospital del Sur Enrique Garcés (Quito)4. Hospital Eugenio Espejo (Quito)5. Hospital Voz Andes (Quito)6. Hospital Pablo Arturo Suárez (Quito)7. Hospital de Infectología y Dermatológico (Guayaquil)8. Hospital del Niño Francisco Icaza Bustamante (Guayaquil)9. Hospital Luis Vernaza (Guayaquil)10. Hospital Naval (Guayaquil)11. Hospital Pediátrico Roberto Gilbert (Guayaquil)12. Hospital General Marco Vinicio Iza (Lago Agrio)13. Hospital General Docente Riobamba (Riobamba)14. Hospital General San Vicente de Paúl (Ibarra)15. Hospital Homero Castañer (Azogues)16. Hospital Vicente Corral Moscoso (Cuenca)
◆ National Influenza Centers (N=1)1. Instituto Nacional de Salud Pública e Investigación (INSPI), Guayaquil
– Technical capacity: IF, RT-PCR, viral isolation– Average samples processed/year: 6,156
▲ Laboratories with PCR capacity (N=2)1. INSPI (Cuenca)
– Technical capacity: IF, RT-PCR
2. INSPI (Quito)– Technical capacity: IF, RT-PCR
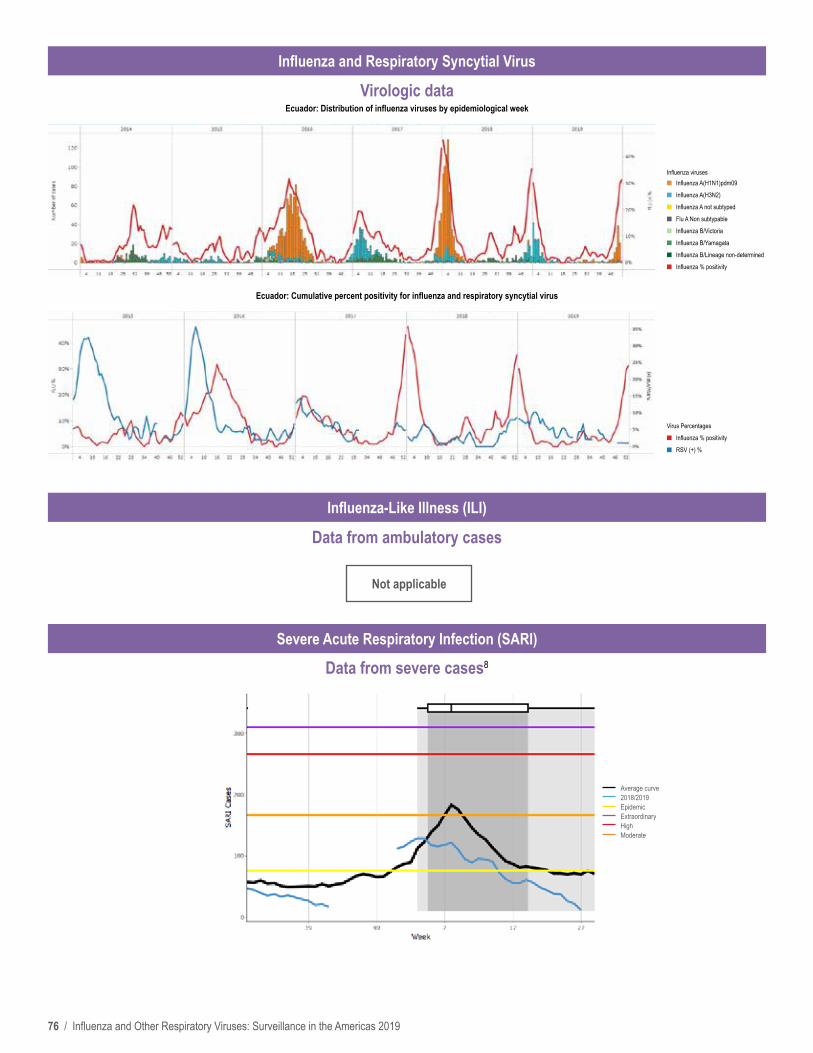
76 / Influenza and Other Respiratory Viruses: Surveillance in the Americas 2019
Influenza and Respiratory Syncytial Virus
Influenza-Like Illness (ILI)
Severe Acute Respiratory Infection (SARI)
Virologic data Ecuador: Distribution of influenza viruses by epidemiological week
Ecuador: Cumulative percent positivity for influenza and respiratory syncytial virus
Not applicable
Data from ambulatory cases
Data from severe cases8
Influenza virusesn Influenza A(H1N1)pdm09
n Influenza A(H3N2)
n Influenza A not subtyped
n Flu A Non subtypable
n Influenza B/Victoria
n Influenza B/Yamagata
n Influenza B/Lineage non-determined
n Influenza % positivity
Virus Percentages
n Influenza % positivity
n RSV (+) %
Average curve 2018/2019 Epidemic Extraordinary High Moderate
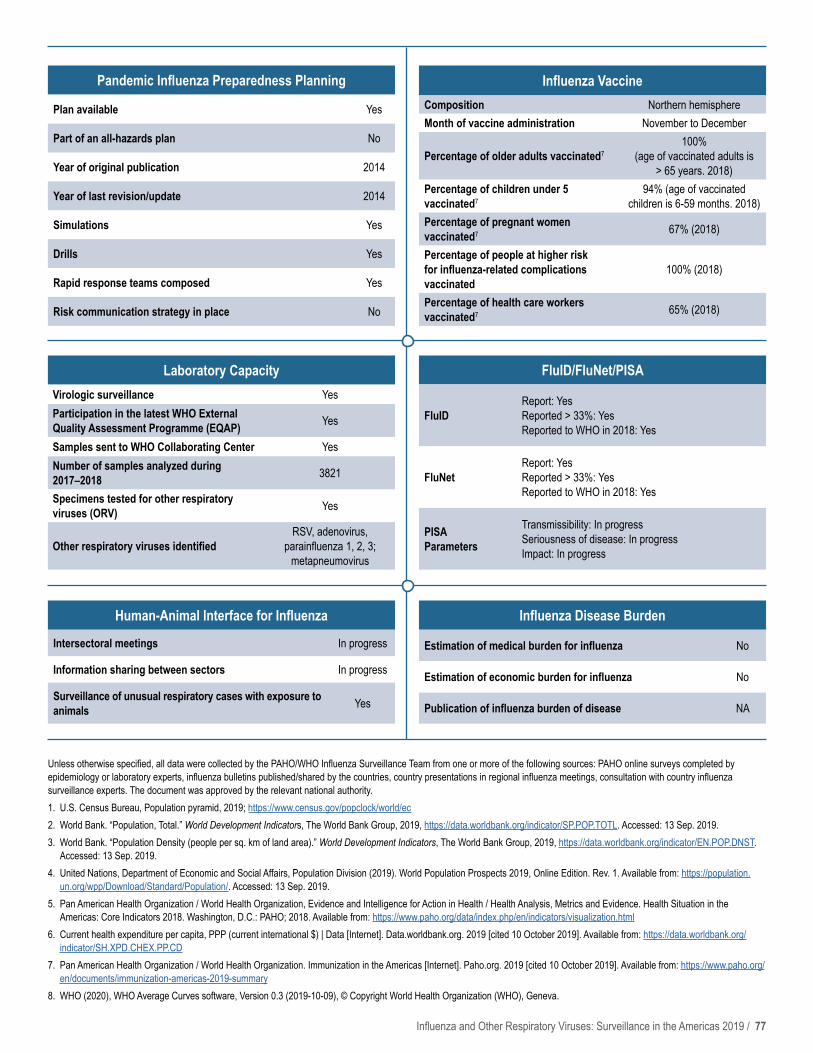
Influenza and Other Respiratory Viruses: Surveillance in the Americas 2019 / 77
Unless otherwise specified, all data were collected by the PAHO/WHO Influenza Surveillance Team from one or more of the following sources: PAHO online surveys completed by epidemiology or laboratory experts, influenza bulletins published/shared by the countries, country presentations in regional influenza meetings, consultation with country influenza surveillance experts. The document was approved by the relevant national authority. 1. U.S. Census Bureau, Population pyramid, 2019; https://www.census.gov/popclock/world/ec2. World Bank. “Population, Total.” World Development Indicators, The World Bank Group, 2019, https://data.worldbank.org/indicator/SP.POP.TOTL. Accessed: 13 Sep. 2019.3. World Bank. “Population Density (people per sq. km of land area).” World Development Indicators, The World Bank Group, 2019, https://data.worldbank.org/indicator/EN.POP.DNST.
Accessed: 13 Sep. 2019.4. United Nations, Department of Economic and Social Affairs, Population Division (2019). World Population Prospects 2019, Online Edition. Rev. 1. Available from: https://population.
un.org/wpp/Download/Standard/Population/. Accessed: 13 Sep. 2019.5. Pan American Health Organization / World Health Organization, Evidence and Intelligence for Action in Health / Health Analysis, Metrics and Evidence. Health Situation in the
Americas: Core Indicators 2018. Washington, D.C.: PAHO; 2018. Available from: https://www.paho.org/data/index.php/en/indicators/visualization.html6. Current health expenditure per capita, PPP (current international $) | Data [Internet]. Data.worldbank.org. 2019 [cited 10 October 2019]. Available from: https://data.worldbank.org/
indicator/SH.XPD.CHEX.PP.CD 7. Pan American Health Organization / World Health Organization. Immunization in the Americas [Internet]. Paho.org. 2019 [cited 10 October 2019]. Available from: https://www.paho.org/
en/documents/immunization-americas-2019-summary8. WHO (2020), WHO Average Curves software, Version 0.3 (2019-10-09), © Copyright World Health Organization (WHO), Geneva.
FluID/FluNet/PISA
FluIDReport: YesReported > 33%: YesReported to WHO in 2018: Yes
FluNetReport: YesReported > 33%: YesReported to WHO in 2018: Yes
PISA Parameters
Transmissibility: In progress Seriousness of disease: In progress Impact: In progress
Human-Animal Interface for Influenza
Intersectoral meetings In progress
Information sharing between sectors In progress
Surveillance of unusual respiratory cases with exposure to animals Yes
Influenza Disease Burden
Estimation of medical burden for influenza No
Estimation of economic burden for influenza No
Publication of influenza burden of disease NA
Pandemic Influenza Preparedness Planning
Plan available Yes
Part of an all-hazards plan No
Year of original publication 2014
Year of last revision/update 2014
Simulations Yes
Drills Yes
Rapid response teams composed Yes
Risk communication strategy in place No
Laboratory CapacityVirologic surveillance YesParticipation in the latest WHO External Quality Assessment Programme (EQAP) Yes
Samples sent to WHO Collaborating Center YesNumber of samples analyzed during 2017–2018 3821
Specimens tested for other respiratory viruses (ORV) Yes
Other respiratory viruses identifiedRSV, adenovirus,
parainfluenza 1, 2, 3; metapneumovirus
Influenza VaccineComposition Northern hemisphereMonth of vaccine administration November to December
Percentage of older adults vaccinated7100%
(age of vaccinated adults is > 65 years. 2018)
Percentage of children under 5 vaccinated7
94% (age of vaccinated children is 6-59 months. 2018)
Percentage of pregnant women vaccinated7 67% (2018)
Percentage of people at higher risk for influenza-related complications vaccinated
100% (2018)
Percentage of health care workers vaccinated7 65% (2018)

78 / Influenza and Other Respiratory Viruses: Surveillance in the Americas 2019
POPULATIONPopulation (thousands)2: 6,421
Population density (per km2)3: 310.0Percentage of population < 5 years4: 9.0%
Percentage of population ≥ 65 years4: 8.3%
MORTALITYGross mortality rate (per 1,000 population)5: 6.7Mortality rate from all causes at < 5 years of age
(per 1,000 live births)5: 10.9Mortality rate due to communicable diseases
(per 100,000 population)5: 71.9
PUBLIC HEALTHNumber of medical doctors working in the public system
(per 10,000 population)5: 28.7Current health expenditure per capita, PPP*
(current international $)6: 600National health expenditure as % of GDP 20165: 4.5
*PPP – Purchasing Power Parity
El Salvador
SURVEILLANCE SYSTEM CHARACTERISTICS INFORMATION SYSTEM
EventWHO case
definition used Surveillance
strategy
Clinical samples
collected from cases
Shipment of samples to NIC (or
laboratory)
Evaluation of surveillance
sites Number of sites Name
Laboratory and
epidemiology integration
Online report
SARI Yes Sentinel Quota (12 samples/week) Weekly 2/year 4
Vigepes centinelaYes
OnlineILI Yes Sentinel Quota (40
samples/week) Weekly 2/year 8
ARI No; ICD-10 codes (J.00-J06) National No No NA 1,238
Vigepes
No
PNEUMONIANo; ICD-10
codes (J12.0-J18.9)
National No No NA 1,238 NoOnline
INFLUENZA NA Sentinel Quota Weekly NA 12 Yes
INFLUENZA MORTALITY NA National Quota Varies NA 38
Sistema de morbimortalidad en
línea (SIMMOW)No NA
Socio
dem
ogra
phic
Indi
cato
rsSu
rveil
lance
Sys
tem
sSu
rveil
lance
Map
* The data in the sentinel surveillance map are updated as of January 2019. The population is a projection, as of 2018, by the El Salvador Directorate of Statistics and Census.
100+95 - 9990 - 9485 - 8980 - 8475 - 7970 - 7465 - 6960 - 6455 - 5950 - 5445 - 4940 - 4435 - 3930 - 3425 - 2920 - 2415 - 1910 - 14
5 - 90.-4
Population (in thousands)
Male
Age Group Population (in thousands)
Female
310 0186 12462 248248 62124 1860 330
El Salvador, 20191
● SARI Hospitals (N=4)1. Hospital San Juan de Dios de San Miguel2. Hospital Nuestra Señora de Fátima de Cojutepeque3. Hospital San Juan de Dios de Santa Ana4. Hospital Nacional de Niños de Benjamín Bloom
● ILI Centers (N=8)1. UCSF La Presita (San Miguel)2. UCSF Díaz del Pinal (La Libertad)3. UCSF Barrios (San Salvador)4. UCSF Unicentro (San Salvador)5. UCSF Zacamil (San Salvador)6. UCSF Periférica de Cojutepeque (Cuscatlán)7. UCSF San Rafael (Santa Ana)8. UCSF Tomás Pineda (Santa Ana)
◆ National Influenza Centers (N=1)1. Laboratorio Nacional de Referencia
Doctor Max Bloch– Technical capacity: IF, RT-PCR,
viral isolation– Average samples processed/year:
4,529
▲ Laboratories with IF capacity (N=3)1. Hospital regional de San Miguel
– Technical capacity: IF2. Hospital de niños Benjamin Bloom
– Technical capacity: IF3. Hospital regional de Santa Ana
– Technical capacity: IF
Pop.149,326 1,567,156

Influenza and Other Respiratory Viruses: Surveillance in the Americas 2019 / 79
Influenza and Respiratory Syncytial Virus
Pneumonia Data
Severe Acute Respiratory Infection (SARI)
Virologic data El Salvador: Distribution of influenza viruses by epidemiological week
El Salvador: Cumulative percent positivity for influenza and respiratory syncytial virus
Data from ambulatory cases8
Data from severe cases8
Influenza virusesn Influenza A(H1N1)pdm09
n Influenza A(H3N2)
n Influenza A not subtyped
n Flu A Non subtypable
n Influenza B/Victoria
n Influenza B/Yamagata
n Influenza B/Lineage non-determined
n Influenza % positivity
Virus Percentages
n Influenza % positivity
n RSV (+) %
Average curve 2019 Epidemic Extraordinary High Moderate
Average curve 2019 Epidemic Extraordinary High Moderate

80 / Influenza and Other Respiratory Viruses: Surveillance in the Americas 2019
Unless otherwise specified, all data were collected by the PAHO/WHO Influenza Surveillance Team from one or more of the following sources: PAHO online surveys completed by epidemiology or laboratory experts, influenza bulletins published/shared by the countries, country presentations in regional influenza meetings, consultation with country influenza surveillance experts. The document was approved by the relevant national authority. 1. U.S. Census Bureau, Population pyramid, 2019; https://www.census.gov/popclock/world/es2. World Bank. “Population, Total.” World Development Indicators, The World Bank Group, 2019, https://data.worldbank.org/indicator/SP.POP.TOTL. Accessed: 13 Sep. 2019.3. World Bank. “Population Density (people per sq. km of land area).” World Development Indicators, The World Bank Group, 2019, https://data.worldbank.org/indicator/EN.POP.DNST.
Accessed: 13 Sep. 2019.4. United Nations, Department of Economic and Social Affairs, Population Division (2019). World Population Prospects 2019, Online Edition. Rev. 1. Available from: https://population.
un.org/wpp/Download/Standard/Population/. Accessed: 13 Sep. 2019.5. Pan American Health Organization / World Health Organization, Evidence and Intelligence for Action in Health / Health Analysis, Metrics and Evidence. Health Situation in the
Americas: Core Indicators 2018. Washington, D.C.: PAHO; 2018. Available from: https://www.paho.org/data/index.php/en/indicators/visualization.html6. Current health expenditure per capita, PPP (current international $) | Data [Internet]. Data.worldbank.org. 2019 [cited 10 October 2019]. Available from: https://data.worldbank.org/
indicator/SH.XPD.CHEX.PP.CD 7. Pan American Health Organization / World Health Organization. Immunization in the Americas [Internet]. Paho.org. 2019 [cited 10 October 2019]. Available from: https://www.paho.org/
en/documents/immunization-americas-2019-summary8. WHO (2020), WHO Average Curves software, Version 0.3 (2019-10-09), © Copyright World Health Organization (WHO), Geneva.
FluID/FluNet/PISA
FluIDReport: YesReported > 33%: YesReported to WHO in 2018: Yes
FluNetReport: YesReported > 33%: YesReported to WHO in 2018: Yes
PISA Parameters
Transmissibility: In progressSeriousness of disease: In progressImpact: In progress
Human-Animal Interface for Influenza
Intersectoral meetings In progress
Information sharing between sectors No
Surveillance of unusual respiratory cases with exposure to animals No
Influenza Disease Burden
Estimation of medical burden for influenza No
Estimation of economic burden for influenza NA
Publication of influenza burden of disease NA
Pandemic Influenza Preparedness Planning
Plan available Yes
Part of an all-hazards plan No
Year of original publication 2009
Year of last revision/update 2013
Simulations NA
Drills NA
Rapid response teams composed Yes
Risk communication strategy in place Yes
Laboratory Capacity
Virologic surveillance Yes
Participation in the latest WHO External Quality Assessment Programme (EQAP) Yes
Samples sent to WHO Collaborating Center Yes
Number of samples analyzed during 2017–2018 4,259
Specimens tested for other respiratory viruses (ORV) Yes
Other respiratory viruses identified RSV, adenovirus, parainfluenza 1, 2, 3
Influenza VaccineComposition Southern hemisphereMonth of vaccine administration May
Percentage of older adults vaccinated727% (age of vaccinated
older adults is ≥ 65 years, 2018)
Percentage of children under 5 vaccinated764% (age of vaccinated children is 6-48 months,
2018)Percentage of pregnant women vaccinated7 78%Percentage of people at higher risk for influenza-related complications vaccinated7 Yes
Percentage of health care workers vaccinated7 84%

Influenza and Other Respiratory Viruses: Surveillance in the Americas 2019 / 81
POPULATIONPopulation (thousands)2: 111
Population density (per km2)3: 328.0Percentage of population < 5 years4: 8.0%
Percentage of population ≥ 65 years4: 9.6%
MORTALITYGross mortality rate (per 1,000 population)5: 7.4Mortality rate from all causes at < 5 years of age
(per 1,000 live births)5: 15.1Mortality rate due to communicable diseases
(per 100,000 population)5: 83.5
PUBLIC HEALTHNumber of medical doctors working in the public system
(per 10,000 population)5: 14.4Current health expenditure per capita, PPP*
(current international $)6: 745.0National health expenditure as % of GDP 20165: 2.2
*PPP – Purchasing Power Parity
SURVEILLANCE SYSTEM CHARACTERISTICS INFORMATION SYSTEM
EventWHO case
definition used Surveillance
strategy
Clinical samples collected
from cases
Shipment of samples to NIC (or
laboratory)
Evaluation of surveillance
sites Number of sites Name
Laboratory and epidemiology
integrationOnline report
SARI Yes Sentinel Quota Varies No 4
NA NA NoILI Yes National No Varies No 60
ARI No National No NA NA NA
Sociodemographic Indicators
Surveillance Systems
Surveillance Map
* The data in the sentinel surveillance map are updated as of January 2019. The population is a projection, as of 2018, by the Grenada Central Statistical Office.
Pop.3,994 37,057
Grenada
100+95 - 9990 - 9485 - 8980 - 8475 - 7970 - 7465 - 6960 - 6455 - 5950 - 5445 - 4940 - 4435 - 3930 - 3425 - 2920 - 2415 - 1910 - 14
5 - 90.-4
Population (in thousands)
Male
Age Group Population (in thousands)
Female
5 03 21 44 12 30 5
Grenada, 20191
● SARI Hospitals (N=4)1. General Hospital2. Princess Alice Hospital3. Princess Royal Hospital4. Saint Augustine Medical Services

82 / Influenza and Other Respiratory Viruses: Surveillance in the Americas 2019
Influenza and Respiratory Syncytial Virus
Influenza-Like Illness (ILI)
Severe Acute Respiratory Infection (SARI)
Virologic data Grenada: Distribution of influenza viruses by epidemiological week
Grenada: Cumulative percent positivity for influenza and respiratory syncytial virus
Not applicable
Data from ambulatory cases8
Data from severe cases
Influenza virusesn Influenza A(H1N1)pdm09
n Influenza A(H3N2)
n Influenza A not subtyped
n Flu A Non subtypable
n Influenza B/Victoria
n Influenza B/Yamagata
n Influenza B/Lineage non-determined
n Influenza % positivity
Virus Percentages
n Influenza % positivity
n RSV (+) %
2011 2012 Threshold

Influenza and Other Respiratory Viruses: Surveillance in the Americas 2019 / 83
Unless otherwise specified, all data were collected by the PAHO/WHO Influenza Surveillance Team from one or more of the following sources: PAHO online surveys completed by epidemiology or laboratory experts, influenza bulletins published/shared by the countries, country presentations in regional influenza meetings, consultation with country influenza surveillance experts. The document was approved by the relevant national authority. 1. U.S. Census Bureau, Population pyramid, 2019; https://www.census.gov/popclock/world/gj2. World Bank. “Population, Total.” World Development Indicators, The World Bank Group, 2019, https://data.worldbank.org/indicator/SP.POP.TOTL. Accessed: 13 Sep. 2019.3. World Bank. “Population Density (people per sq. km of land area).” World Development Indicators, The World Bank Group, 2019, https://data.worldbank.org/indicator/EN.POP.DNST.
Accessed: 13 Sep. 2019.4. United Nations, Department of Economic and Social Affairs, Population Division (2019). World Population Prospects 2019, Online Edition. Rev. 1. Available from: https://population.
un.org/wpp/Download/Standard/Population/. Accessed: 13 Sep. 2019.5. Pan American Health Organization / World Health Organization, Evidence and Intelligence for Action in Health / Health Analysis, Metrics and Evidence. Health Situation in the
Americas: Core Indicators 2018. Washington, D.C.: PAHO; 2018. Available from: https://www.paho.org/data/index.php/en/indicators/visualization.html6. Current health expenditure per capita, PPP (current international $) | Data [Internet]. Data.worldbank.org. 2019 [cited 10 October 2019]. Available from: https://data.worldbank.org/
indicator/SH.XPD.CHEX.PP.CD 7. Pan American Health Organization / World Health Organization. Immunization in the Americas [Internet]. Paho.org. 2019 [cited 10 October 2019]. Available from: https://www.paho.org/
en/documents/immunization-americas-2019-summary8. WHO (2020), WHO Average Curves software, Version 0.3 (2019-10-09), © Copyright World Health Organization (WHO), Geneva.
FluID/FluNet/PISA
FluIDReport: YesReported > 33%: YesReported to WHO in 2018: No
FluNetReport: YesReported > 33%: YesReported to WHO in 2018: No
PISA Parameters
Transmissibility: In progress Seriousness of disease: In progress Impact: In progress
Human-Animal Interface for Influenza
Intersectoral meetings Yes
Information sharing between sectors In progress
Surveillance of unusual respiratory cases with exposure to animals No
Influenza Disease Burden
Estimation of medical burden for influenza No
Estimation of economic burden for influenza No
Publication of influenza burden of disease No
Pandemic Influenza Preparedness Planning
Plan available Yes
Part of an all-hazards plan Yes
Year of original publication 2009
Year of last revision/update 2009
Simulations Yes
Drills No
Rapid response teams composed No
Risk communication strategy in place Yes
Laboratory Capacity
Virologic surveillance No
Participation in the latest WHO External Quality Assessment Programme (EQAP) NA
Samples sent to WHO Collaborating Center No
Number of samples analyzed during 2017–2018 NA
Specimens tested for other respiratory viruses (ORV) No
Other respiratory viruses identified NA
Influenza Vaccine
Composition Northern hemisphere
Month of vaccine administration October
Percentage of older adults vaccinated7 NA ( ≥ 65 years)
Percentage of children under 5 vaccinated7 NA
Percentage of pregnant women vaccinated7 Yes
Percentage of people at higher risk for influenza-related complications vaccinated7 Yes
Percentage of health care workers vaccinated7 Yes

84 / Influenza and Other Respiratory Viruses: Surveillance in the Americas 2019
POPULATIONPopulation (thousands)2: 17,248
Population density (per km2)3: 161.0Percentage of population < 5 years4: 11.9%Percentage of population ≥ 65 years4: 4.8%
MORTALITYGross mortality rate (per 1,000 population)5: 6.8Mortality rate from all causes at < 5 years of age
(per 1,000 live births)5: 26.0Mortality rate due to communicable diseases
(per 100,000 population)5: 141.1
PUBLIC HEALTHNumber of medical doctors working in the public system
(per 10,000 population)5: 2.8Current health expenditure per capita, PPP*
(current international $)6: 462.0National health expenditure as % of GDP 20165: 2.2
*PPP – Purchasing Power Parity
SURVEILLANCE SYSTEM CHARACTERISTICS INFORMATION SYSTEM
EventWHO case
definition used Surveillance
strategy
Clinical samples collected from
cases
Shipment of samples to NIC (or
laboratory)
Evaluation of surveillance
sites Number of sites Name
Laboratory and epidemiology
integrationOnline report
SARI Yes Sentinel Quota (24 samples/week) Varies Annually 4
Epiweb YesOnline
ILI Yes Sentinel Quota (24 samples/week) Varies Annually 4
INFLUENZA NA Sentinel Quota (48 samples/week) Varies NA 8 Online
Socio
dem
ogra
phic
Indi
cato
rsSu
rveil
lance
Sys
tem
sSu
rveil
lance
Map
* The data in the sentinel surveillance map are updated as of January 2019. The population is a projection, as of 2018, by the Guatemala National Institute of Statistics.
Pop.178,387 3,489,142
Guatemala
100+95 - 9990 - 9485 - 8980 - 8475 - 7970 - 7465 - 6960 - 6455 - 5950 - 5445 - 4940 - 4435 - 3930 - 3425 - 2920 - 2415 - 1910 - 14
5 - 90.-4
Population (in millions)
Male
Age Group Population (in millions)
Female
2 01.2 0.80.4 1.61.6 0.40.8 1.20 2
Guatemala, 20191
● SARI Hospitals (N=4)1. Hospital General San Juan de Dios (Guatemala)2. Hospital Infantil de Infectología y Rehabilitación (Guatemala)3. Hospital Nacional de San Marcos (San Marcos)4. Hospital Nacional de Cobán (Alta Verapaz)
● ILI Centers (N=4)1. Clínica Periférica Primero de Julio (Mixco Guatemala)2. Centro de Salud San Marcos (San Marcos)3. Centro de Salud San Pedro Sacatepéquez (San Marcos)4. Centro de Salud de Cobán (Alta Verapaz)
◆ National Influenza Centers (N=1)1. Laboratorio Nacional de Salud (Barcenas)
– Technical capacity: IF, RT-PCR, viral isolation– Average samples processed/year: 3,609
▲ Laboratories with IF capacity (N=3)1. Guatemala City2. San Marcos3. Cobán

Influenza and Other Respiratory Viruses: Surveillance in the Americas 2019 / 85
Influenza and Respiratory Syncytial Virus
Influenza-Like Illness (ILI)
Severe Acute Respiratory Infection (SARI)
Virologic data Guatemala: Distribution of influenza viruses by epidemiological week
Guatemala: Cumulative percent positivity for influenza and respiratory syncytial virus
Data from ambulatory cases8
Data from severe cases8
Influenza virusesn Influenza A(H1N1)pdm09
n Influenza A(H3N2)
n Influenza A not subtyped
n Flu A Non subtypable
n Influenza B/Victoria
n Influenza B/Yamagata
n Influenza B/Lineage non-determined
n Influenza % positivity
Virus Percentages
n Influenza % positivity
n RSV (+) %
2017 2018 2019 Threshold
2017 2018 2019 Threshold

86 / Influenza and Other Respiratory Viruses: Surveillance in the Americas 2019
Unless otherwise specified, all data were collected by the PAHO/WHO Influenza Surveillance Team from one or more of the following sources: PAHO online surveys completed by epidemiology or laboratory experts, influenza bulletins published/shared by the countries, country presentations in regional influenza meetings, consultation with country influenza surveillance experts. The document was approved by the relevant national authority. 1. U.S. Census Bureau, Population pyramid, 2019; https://www.census.gov/popclock/world/gt2. World Bank. “Population, Total.” World Development Indicators, The World Bank Group, 2019, https://data.worldbank.org/indicator/SP.POP.TOTL. Accessed: 13 Sep. 2019.3. World Bank. “Population Density (people per sq. km of land area).” World Development Indicators, The World Bank Group, 2019, https://data.worldbank.org/indicator/EN.POP.DNST.
Accessed: 13 Sep. 2019.4. United Nations, Department of Economic and Social Affairs, Population Division (2019). World Population Prospects 2019, Online Edition. Rev. 1. Available from: https://population.
un.org/wpp/Download/Standard/Population/. Accessed: 13 Sep. 2019.5. Pan American Health Organization / World Health Organization, Evidence and Intelligence for Action in Health / Health Analysis, Metrics and Evidence. Health Situation in the
Americas: Core Indicators 2018. Washington, D.C.: PAHO; 2018. Available from: https://www.paho.org/data/index.php/en/indicators/visualization.html6. Current health expenditure per capita, PPP (current international $) | Data [Internet]. Data.worldbank.org. 2019 [cited 10 October 2019]. Available from: https://data.worldbank.org/
indicator/SH.XPD.CHEX.PP.CD 7. Pan American Health Organization / World Health Organization. Immunization in the Americas [Internet]. Paho.org. 2019 [cited 10 October 2019]. Available from: https://www.paho.org/
en/documents/immunization-americas-2019-summary8. WHO (2020), WHO Average Curves software, Version 0.3 (2019-10-09), © Copyright World Health Organization (WHO), Geneva.
FluID/FluNet/PISA
FluIDReport: YesReported > 33%: YesReported to WHO in 2018: Yes
FluNetReport: YesReported > 33%: YesReported to WHO in 2018: Yes
PISA Parameters
Transmissibility: Yes Seriousness of disease: NoImpact: No
Human-Animal Interface for Influenza
Intersectoral meetings In progress
Information sharing between sectors No
Surveillance of unusual respiratory cases with exposure to animals In progress
Influenza Disease Burden
Estimation of medical burden for influenza Yes
Estimation of economic burden for influenza Yes
Publication of influenza burden of disease Online
Pandemic Influenza Preparedness Planning
Plan available Yes
Part of an all-hazards plan Yes
Year of original publication 2007
Year of last revision/update 2007
Simulations No
Drills No
Rapid response teams composed Yes
Risk communication strategy in place Yes
Laboratory Capacity
Virologic surveillance Yes
Participation in the latest WHO External Quality Assessment Programme (EQAP) Yes
Samples sent to WHO Collaborating Center Yes
Number of samples analyzed during 2017–2018 3,609
Specimens tested for other respiratory viruses (ORV) Yes
Other respiratory viruses identifiedRSV, adenovirus,
parainfluenza 1, 2, 3; metapneumovirus
Influenza Vaccine
Composition Northern hemisphere
Month of vaccine administration October
Percentage of older adults vaccinated7 NA
Percentage of children under 5 vaccinated7 NA
Percentage of pregnant women vaccinated7 Yes
Percentage of people at higher risk for influenza-related complications vaccinated Yes
Percentage of health care workers vaccinated7 90%

Sociodemographic Indicators
Influenza and Other Respiratory Viruses: Surveillance in the Americas 2019 / 87
● SARI Hospitals (N=6)1. Hôpital St Michel (Jacmel)2. Hôpital St Nicolas (St Marc)3. Hôpital Universitaire La Paix (Delmas)4. Hôpital St Damien (Tabarre)5. Hôpital St Camille ( Croix-des-Bouquets)6. Hôpital de l’Université d’Etat d’Haïti (Port-au-Prince)
◆ National Influenza Centers (N=1)1. Laboratoire National de Santé Publique (LNSP) (Port-au-Prince)
– Technical capacity: RT-PCR– Average samples processed/year: 965
Surveillance MapSurveillance System
sPOPULATION
Population (thousands)2: 11,263Population density (per km2)3: 404.0
Percentage of population < 5 years4: 11.4%Percentage of population ≥ 65 years4: 4.9%
MORTALITYGross mortality rate (per 1,000 population)5: 11.2Mortality rate from all causes at < 5 years of age
(per 1,000 live births)5: 81.0Mortality rate due to communicable diseases
(per 100,000 population)5: 263.7
PUBLIC HEALTHNumber of medical doctors working in the public system
(per 10,000 population)5: 2.3Current health expenditure per capita, PPP*
(current international $)6: 95National health expenditure as % of GDP 20165: 0.8
*PPP – Purchasing Power Parity
SURVEILLANCE SYSTEM CHARACTERISTICS INFORMATION SYSTEM
EventWHO case
definition used Surveillance
strategyClinical samples
collected from cases
Shipment of samples to NIC (or
laboratory)
Evaluation of surveillance
sites Number of sites Name
Laboratory and epidemiology
integrationOnline report
SARI Yes Sentinel 100% Weekly Quarterly 6 EXCELL, DHIS2Yes Yes
ILI Yes Sentinel Quota (10 samples/week) Weekly Quarterly 10 EXCELL, DHIS3
ARI No* National 100% No NA NAMonitoring
Evaluation System Integrated (MESI)
No Online
Pop.342,525 4,029,705
100+95 - 9990 - 9485 - 8980 - 8475 - 7970 - 7465 - 6960 - 6455 - 5950 - 5445 - 4940 - 4435 - 3930 - 3425 - 2920 - 2415 - 1910 - 14
5 - 90.-4
Population (in thousands)
Male
Age Group Population (in thousands)
Female
590 0354 236118 472472 118236 3540 590
Haiti, 20191
Haiti
* ARI: Fever > 38 °C and at least one of the following symptoms: rhinitis, cough, redness in throat, throat pain; or Fever > 38 °C and rapid breathing with either a cough or difficulty breathing.
* The data in the sentinel surveillance map are updated as of January 2019. The population is a projection, as of 2018, by the Haitian Institute of Statistics and Informatics.

88 / Influenza and Other Respiratory Viruses: Surveillance in the Americas 2019
Influenza and Respiratory Syncytial Virus
Influenza-Like Illness (ILI)
Severe Acute Respiratory Infection (SARI)
Virologic data Haiti: Distribution of influenza viruses by epidemiological week
Haiti: Cumulative percent positivity for influenza and respiratory syncytial virus
Not applicable
Data from ambulatory cases
Data from severe cases8
Influenza virusesn Influenza A(H1N1)pdm09
n Influenza A(H3N2)
n Influenza A not subtyped
n Flu A Non subtypable
n Influenza B/Victoria
n Influenza B/Yamagata
n Influenza B/Lineage non-determined
n Influenza % positivity
Virus Percentages
n Influenza % positivity
n RSV (+) %
2017 2018 2019 Threshold

Influenza and Other Respiratory Viruses: Surveillance in the Americas 2019 / 89
Unless otherwise specified, all data were collected by the PAHO/WHO Influenza Surveillance Team from one or more of the following sources: PAHO online surveys completed by epidemiology or laboratory experts, influenza bulletins published/shared by the countries, country presentations in regional influenza meetings, consultation with country influenza surveillance experts. The document was approved by the relevant national authority. 1. U.S. Census Bureau, Population pyramid, 2019; https://www.census.gov/popclock/world/ha2. World Bank. “Population, Total.” World Development Indicators, The World Bank Group, 2019, https://data.worldbank.org/indicator/SP.POP.TOTL. Accessed: 13 Sep. 2019.3. World Bank. “Population Density (people per sq. km of land area).” World Development Indicators, The World Bank Group, 2019, https://data.worldbank.org/indicator/EN.POP.DNST.
Accessed: 13 Sep. 2019.4. United Nations, Department of Economic and Social Affairs, Population Division (2019). World Population Prospects 2019, Online Edition. Rev. 1. Available from: https://population.
un.org/wpp/Download/Standard/Population/. Accessed: 13 Sep. 2019.5. Pan American Health Organization / World Health Organization, Evidence and Intelligence for Action in Health / Health Analysis, Metrics and Evidence. Health Situation in the
Americas: Core Indicators 2018. Washington, D.C.: PAHO; 2018. Available from: https://www.paho.org/data/index.php/en/indicators/visualization.html6. Current health expenditure per capita, PPP (current international $) | Data [Internet]. Data.worldbank.org. 2019 [cited 10 October 2019]. Available from: https://data.worldbank.org/
indicator/SH.XPD.CHEX.PP.CD 7. Pan American Health Organization / World Health Organization. Immunization in the Americas [Internet]. Paho.org. 2019 [cited 10 October 2019]. Available from: https://www.paho.org/
en/documents/immunization-americas-2019-summary8. WHO (2020), WHO Average Curves software, Version 0.3 (2019-10-09), © Copyright World Health Organization (WHO), Geneva.
FluID/FluNet/PISA
FluIDReport: YesReported > 33%: YesReported to WHO in 2018: Yes
FluNetReport: YesReported > 33%: YesReported to WHO in 2018: Yes
PISA Parameters
Transmissibility: In progress Seriousness of disease: In progress Impact: In progress
Human-Animal Interface for Influenza
Intersectoral meetings In progress
Information sharing between sectors In progress
Surveillance of unusual respiratory cases with exposure to animals In progress
Influenza Disease Burden
Estimation of medical burden for influenza No
Estimation of economic burden for influenza No
Publication of influenza burden of disease NA
Pandemic Influenza Preparedness Planning
Plan available Yes
Part of an all-hazards plan Yes
Year of original publication 2009
Year of last revision/update 2019
Simulations Yes
Drills No
Rapid response teams composed No
Risk communication strategy in place Yes
Laboratory Capacity
Virologic surveillance Yes
Participation in the latest WHO External Quality Assessment Programme (EQAP) Yes
Samples sent to WHO Collaborating Center Yes
Number of samples analyzed during 2017–2018 965
Specimens tested for other respiratory viruses (ORV) Yes
Other respiratory viruses identified RSV, adenovirus, parainfluenza 1, 2, 3
Influenza Vaccine
Composition In transition from one composition to another
Month of vaccine administration NA
Percentage of older adults vaccinated7 NA
Percentage of children under 5 vaccinated7 NA
Percentage of pregnant women vaccinated7 NA
Percentage of people at higher risk for influenza-related complications vaccinated NA
Percentage of health care workers vaccinated7 NA

90 / Influenza and Other Respiratory Viruses: Surveillance in the Americas 2019
POPULATIONPopulation (thousands)2: 9,588
Population density (per km2)3: 86.0Percentage of population < 5 years4: 10.5%Percentage of population ≥ 65 years4: 4.7%
MORTALITYGross mortality rate (per 1,000 population)5: 6.0Mortality rate from all causes at < 5 years of age
(per 1,000 live births)5: NAMortality rate due to communicable diseases
(per 100,000 population)5: 67.3
PUBLIC HEALTHNumber of medical doctors working in the public system
(per 10,000 population)5: 10.0Current health expenditure per capita, PPP*
(current international $)6: 400.0National health expenditure as % of GDP 20165: 3.9
*PPP – Purchasing Power Parity
SURVEILLANCE SYSTEM CHARACTERISTICS INFORMATION SYSTEM
EventWHO case
definition used Surveillance
strategy
Clinical samples collected
from cases
Shipment of samples to NIC (or
laboratory)
Evaluation of surveillance
sites Number of sites Name
Laboratory and epidemiology
integrationOnline report
ARI Yes Sentinel 100% Weekly Quarterly 5
PAHOFlu Yes OnlinePNEUMONIA Yes SentinelQuota (21 samples/
week)Weekly Quarterly 3
INFLUENZA NA Sentinel 100% Weekly NA 8
Socio
dem
ogra
phic
Indi
cato
rsSu
rveil
lance
Sys
tem
sSu
rveil
lance
Map
* The data in the sentinel surveillance map are updated as of January 2019. The population is a projection, as of 2018, by the Honduran National Institute of Statistics.
Pop.71,296 1,718,881
100+95 - 9990 - 9485 - 8980 - 8475 - 7970 - 7465 - 6960 - 6455 - 5950 - 5445 - 4940 - 4435 - 3930 - 3425 - 2920 - 2415 - 1910 - 14
5 - 90.-4
Population (in thousands)
Male
Age Group Population (in thousands)
Female
510 0306 204102 408408 102204 3060 510
Honduras, 20191
● SARI Hospitals (N=5)1. Instituto Nacional Cardiopulmonar (Tegucigalpa)2. IHSS de Especialidades (Tegucigalpa)3. Hospital Militar (Tegucigalpa)4. Hospital Mario Catarino Rivas (San Pedro Sula)5. IHSS Regional del Norte (San Pedro Sula)
● ILI Centers (N=3)1. Establecimiento de Salud Alonso Suazo (Tegucigalpa)2. Establecimiento de Salud San Miguel Paz Barahona (San Pedro Sula)3. Consulta Externa del IHSS Regional del Norte (San Pedro Sula)
◆ National Influenza Centers (N=1)1. Laboratorio Nacional de Virología (Tegucigalpa)
– Technical capacity: IF, viral isolation– Average samples processed/year: 1,899
▲ Laboratories with IF capacity (N=2)1. Regional Laboratory of Tegucigalpa2. Regional Laboratory of San Pedro Sula
– Technical capacity: IF
Honduras

Influenza and Other Respiratory Viruses: Surveillance in the Americas 2019 / 91
Influenza and Respiratory Syncytial Virus
Influenza-Like Illness (ILI)
Severe Acute Respiratory Infection (SARI)
Virologic data Honduras: Distribution of influenza viruses by epidemiological week
Honduras: Cumulative percent positivity for influenza and respiratory syncytial virus
Not applicable
Data from ambulatory cases7
Data from severe cases7
Influenza virusesn Influenza A(H1N1)pdm09
n Influenza A(H3N2)
n Influenza A not subtyped
n Flu A Non subtypable
n Influenza B/Victoria
n Influenza B/Yamagata
n Influenza B/Lineage non-determined
n Influenza % positivity
Virus Percentages
n Influenza % positivity
n RSV (+) %
Average curve Interseasonal 2018/2019 Epidemic Extraordinary High Moderate
Average curve 2019 Epidemic Extraordinary High Moderate

92 / Influenza and Other Respiratory Viruses: Surveillance in the Americas 2019
Unless otherwise specified, all data were collected by the PAHO/WHO Influenza Surveillance Team from one or more of the following sources: PAHO online surveys completed by epidemiology or laboratory experts, influenza bulletins published/shared by the countries, country presentations in regional influenza meetings, consultation with country influenza surveillance experts. The document was approved by the relevant national authority. 1. U.S. Census Bureau, Population pyramid, 2019; https://www.census.gov/popclock/world/ho2. World Bank. “Population, Total.” World Development Indicators, The World Bank Group, 2019, https://data.worldbank.org/indicator/SP.POP.TOTL. Accessed: 13 Sep. 2019.3. World Bank. “Population Density (people per sq. km of land area).” World Development Indicators, The World Bank Group, 2019, https://data.worldbank.org/indicator/EN.POP.DNST.
Accessed: 13 Sep. 2019.4. United Nations, Department of Economic and Social Affairs, Population Division (2019). World Population Prospects 2019, Online Edition. Rev. 1. Available from: https://population.
un.org/wpp/Download/Standard/Population/. Accessed: 13 Sep. 2019.5. Pan American Health Organization / World Health Organization, Evidence and Intelligence for Action in Health / Health Analysis, Metrics and Evidence. Health Situation in the
Americas: Core Indicators 2018. Washington, D.C.: PAHO; 2018. Available from: https://www.paho.org/data/index.php/en/indicators/visualization.html6. Current health expenditure per capita, PPP (current international $) | Data [Internet]. Data.worldbank.org. 2019 [cited 10 October 2019]. Available from: https://data.worldbank.org/
indicator/SH.XPD.CHEX.PP.CD 7. WHO (2020), WHO Average Curves software, Version 0.3 (2019-10-09), © Copyright World Health Organization (WHO), Geneva.
FluID/FluNet/PISA
FluIDReport: YesReported > 33%: YesReported to WHO in 2018: Yes
FluNetReport: YesReported > 33%: YesReported to WHO in 2018: Yes
PISA Parameters
Transmissibility: In progress Seriousness of disease: In progressImpact: In progress
Human-Animal Interface for Influenza
Intersectoral meetings In progress
Information sharing between sectors No
Surveillance of unusual respiratory cases with exposure to animals Yes
Influenza Disease Burden
Estimation of medical burden for influenza Yes
Estimation of economic burden for influenza Yes
Publication of influenza burden of disease In progress
Pandemic Influenza Preparedness Planning
Plan available Yes
Part of an all-hazards plan Yes
Year of original publication 2011
Year of last revision/update 2013
Simulations No
Drills No
Rapid response teams composed Yes
Risk communication strategy in place Yes
Laboratory Capacity
Virologic surveillance Yes
Participation in the latest WHO External Quality Assessment Programme (EQAP) Yes
Samples sent to WHO Collaborating Center Yes
Number of samples analyzed during 2017–2018 3,777
Specimens tested for other respiratory viruses (ORV) Yes
Other respiratory viruses identified RSV, adenovirus, parainfluenza 1, 2, 3
Influenza VaccineComposition Southern hemisphere
Month of vaccine administration May
Percentage of older adults vaccinated 79% (> 68.5 years)
Percentage of children under 5 vaccinated 57.3% (age of vaccinated children is 6-23 months)
Percentage of pregnant women vaccinated 85%
Percentage of people at higher risk for influenza-related complications vaccinated
100% (persons 3 to 59 years with underlying
conditions)
Percentage of health care workers vaccinated 84.6%

Influenza and Other Respiratory Viruses: Surveillance in the Americas 2019 / 93
POPULATIONPopulation (thousands)2: 2,935
Population density (per km2)3: 271.0Percentage of population < 5 years4: 8.1%
Percentage of population ≥ 65 years4: 8.8%
MORTALITYGross mortality rate (per 1,000 population)5: 5.7Mortality rate from all causes at < 5 years of age
(per 1,000 live births)5: 22.0Mortality rate due to communicable diseases
(per 100,000 population)5: 75.0
PUBLIC HEALTHNumber of medical doctors working in the public system
(per 10,000 population)5: 13.2Current health expenditure per capita, PPP*
(current international $)5: 536.0National health expenditure as % of GDP 20165: 3.7
*PPP – Purchasing Power Parity
SURVEILLANCE SYSTEM CHARACTERISTICS INFORMATION SYSTEM
Event
WHO case definition
used Surveillance
strategy
Clinical samples collected
from cases
Shipment of samples to NIC (or
laboratory)
Evaluation of surveillance
sites Number of sites Name
Laboratory and epidemiology
integrationOnline report
SARI Yes Sentinel 100% 5 days/week Annually 6 PAHO/WHO Online System for Sentinel
Surveillance of Severe Acute Respiratory Infection
Yes
OnlineILI Yes Sentinel Quota 5 days/week Annually 78 No
INFLUENZA NA National 100% Daily NA NA Yes
Sociodemographic Indicators
Surveillance Systems
Surveillance Map
* The data in the sentinel surveillance map are updated as of January 2019. The population is a projection, as of 2018, by the Statistical Institute of Jamaica.
Pop.70,265 669,773
100+95 - 9990 - 9485 - 8980 - 8475 - 7970 - 7465 - 6960 - 6455 - 5950 - 5445 - 4940 - 4435 - 3930 - 3425 - 2920 - 2415 - 1910 - 14
5 - 90.-4
Population (in thousands)
Male
Age Group Population (in thousands)
Female
135 081 5427 108108 2754 810 135
Jamaica, 20191
Jamaica
● SARI Hospitals (N=6)1. Kingston Public Hospital2. Bustamante Children’s Hospital3. Mandeville Regional Hospital4. St. Ann’s Bay Hospital5. Cornwall Regional Hospital6. University Hospital of the West Indies
◆ National Influenza Centers (N=1)1. University of the West Indies
– Technical capacity: IF, RT-PCR, viral isolation– Average samples processed/year: 189

94 / Influenza and Other Respiratory Viruses: Surveillance in the Americas 2019
Influenza and Respiratory Syncytial Virus
Influenza-Like Illness (ILI)
Severe Acute Respiratory Infection (SARI)
Virologic data Jamaica: Distribution of influenza viruses by epidemiological week
Jamaica: Cumulative percent positivity for influenza and respiratory syncytial virus
Data from ambulatory cases8
Data from severe cases8
Influenza virusesn Influenza A(H1N1)pdm09
n Influenza A(H3N2)
n Influenza A not subtyped
n Flu A Non subtypable
n Influenza B/Victoria
n Influenza B/Yamagata
n Influenza B/Lineage non-determined
n Influenza % positivity
Virus Percentages
n Influenza % positivity
n RSV (+) %
Average curve Interseasonal 2018/2019 Epidemic Extraordinary High Moderate
Average curve Interseasonal 2018/2019 Epidemic Extraordinary High Moderate
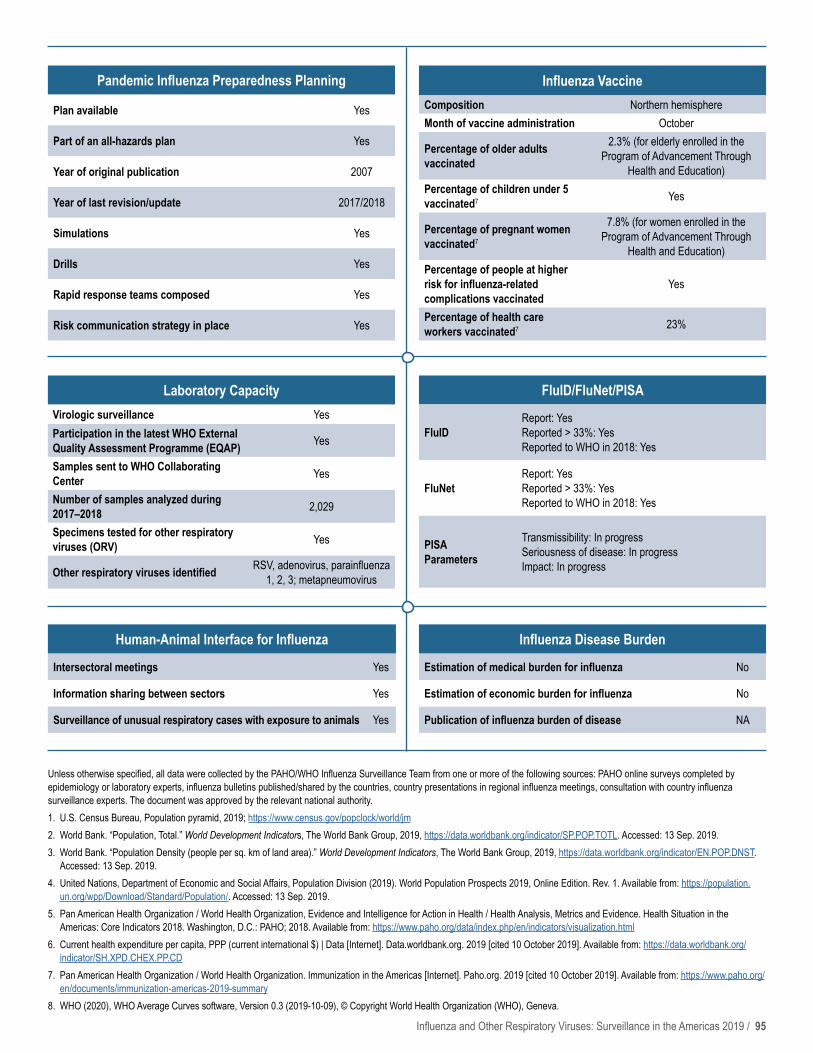
Influenza and Other Respiratory Viruses: Surveillance in the Americas 2019 / 95
FluID/FluNet/PISA
FluIDReport: YesReported > 33%: YesReported to WHO in 2018: Yes
FluNetReport: YesReported > 33%: YesReported to WHO in 2018: Yes
PISA Parameters
Transmissibility: In progress Seriousness of disease: In progress Impact: In progress
Human-Animal Interface for Influenza
Intersectoral meetings Yes
Information sharing between sectors Yes
Surveillance of unusual respiratory cases with exposure to animals Yes
Influenza Disease Burden
Estimation of medical burden for influenza No
Estimation of economic burden for influenza No
Publication of influenza burden of disease NA
Pandemic Influenza Preparedness Planning
Plan available Yes
Part of an all-hazards plan Yes
Year of original publication 2007
Year of last revision/update 2017/2018
Simulations Yes
Drills Yes
Rapid response teams composed Yes
Risk communication strategy in place Yes
Laboratory CapacityVirologic surveillance YesParticipation in the latest WHO External Quality Assessment Programme (EQAP) Yes
Samples sent to WHO Collaborating Center Yes
Number of samples analyzed during 2017–2018 2,029
Specimens tested for other respiratory viruses (ORV) Yes
Other respiratory viruses identified RSV, adenovirus, parainfluenza 1, 2, 3; metapneumovirus
Influenza VaccineComposition Northern hemisphereMonth of vaccine administration October
Percentage of older adults vaccinated
2.3% (for elderly enrolled in the Program of Advancement Through
Health and Education)Percentage of children under 5 vaccinated7 Yes
Percentage of pregnant women vaccinated7
7.8% (for women enrolled in the Program of Advancement Through
Health and Education)Percentage of people at higher risk for influenza-related complications vaccinated
Yes
Percentage of health care workers vaccinated7 23%
Unless otherwise specified, all data were collected by the PAHO/WHO Influenza Surveillance Team from one or more of the following sources: PAHO online surveys completed by epidemiology or laboratory experts, influenza bulletins published/shared by the countries, country presentations in regional influenza meetings, consultation with country influenza surveillance experts. The document was approved by the relevant national authority. 1. U.S. Census Bureau, Population pyramid, 2019; https://www.census.gov/popclock/world/jm2. World Bank. “Population, Total.” World Development Indicators, The World Bank Group, 2019, https://data.worldbank.org/indicator/SP.POP.TOTL. Accessed: 13 Sep. 2019.3. World Bank. “Population Density (people per sq. km of land area).” World Development Indicators, The World Bank Group, 2019, https://data.worldbank.org/indicator/EN.POP.DNST.
Accessed: 13 Sep. 2019.4. United Nations, Department of Economic and Social Affairs, Population Division (2019). World Population Prospects 2019, Online Edition. Rev. 1. Available from: https://population.
un.org/wpp/Download/Standard/Population/. Accessed: 13 Sep. 2019.5. Pan American Health Organization / World Health Organization, Evidence and Intelligence for Action in Health / Health Analysis, Metrics and Evidence. Health Situation in the
Americas: Core Indicators 2018. Washington, D.C.: PAHO; 2018. Available from: https://www.paho.org/data/index.php/en/indicators/visualization.html6. Current health expenditure per capita, PPP (current international $) | Data [Internet]. Data.worldbank.org. 2019 [cited 10 October 2019]. Available from: https://data.worldbank.org/
indicator/SH.XPD.CHEX.PP.CD 7. Pan American Health Organization / World Health Organization. Immunization in the Americas [Internet]. Paho.org. 2019 [cited 10 October 2019]. Available from: https://www.paho.org/
en/documents/immunization-americas-2019-summary8. WHO (2020), WHO Average Curves software, Version 0.3 (2019-10-09), © Copyright World Health Organization (WHO), Geneva.

96 / Influenza and Other Respiratory Viruses: Surveillance in the Americas 2019
POPULATIONPopulation (thousands)2: 126,000Population density (per km2)3: 65.0
Percentage of population < 5 years4: 9.0%Percentage of population ≥ 65 years4: 7.2%
MORTALITYGross mortality rate (per 1,000 population)5: 5.6Mortality rate from all causes at < 5 years of age
(per 1,000 live births)5: 14.5Mortality rate due to communicable diseases
(per 100,000 population)5: 52.0
PUBLIC HEALTHNumber of medical doctors working in the public system
(per 10,000 population)5: 25.5Current health expenditure per capita, PPP*
(current international $)6: 972.0National health expenditure as % of GDP 20165: 2.9
*PPP – Purchasing Power Parity
SURVEILLANCE SYSTEM CHARACTERISTICS INFORMATION SYSTEM
EventWHO case
definition used Surveillance
strategy
Clinical samples collected
from cases
Shipment of samples to NIC (or
laboratory)
Evaluation of surveillance
sites Number of sites Name
Laboratory and epidemiology
integrationOnline report
ARI Yes Sentinel 100% No Semiannually 363 Sistema de Vigilancia
Epidemiológica de Influenza-SISVEFLU
Yes OnlinePNEUMONIA Yes SentinelQuota (323 samples/
week)Daily Semiannually 115
INFLUENZA NA Sentinel NA Daily NA 478
Socio
dem
ogra
phic
Indi
cato
rsSu
rveil
lance
Sys
tem
sSu
rveil
lance
Map
* The data in the sentinel surveillance map are updated as of January 2019. Population according to the Mexico National Population Council.
Pop.649,616 15,571,679
Mexico
100+95 - 9990 - 9485 - 8980 - 8475 - 7970 - 7465 - 6960 - 6455 - 5950 - 5445 - 4940 - 4435 - 3930 - 3425 - 2920 - 2415 - 1910 - 14
5 - 90.-4
Population (in millions)
Male
Age Group Population (in millions)
Female
6 03.6 2.41.2 4.84.8 1.22.4 3.60 6
Mexico, 20191
● SARI Hospitals (N=366)(Not displayed on map)Aguascalientes (8), Baja California (5), Baja California Sur (10), Campeche (6), Cohahuila (14), Colima (5), Chiapas (10), Chihuahua (11), Distrito Federal (27), Durango (5), Guanajuato (11), Guerrero (9), Hidalgo (17), Jalisco (9), Mexico (21), Michoacán (15), Morelos (7), Nayarit (10), Nuevo León (15), Oaxaca (12), Puebla (20), Querétaro (8), Quintana Roo (13), San Luis Potosí (10), Sinaloa (10), Sonora (16), Tabasco (11), Tamaulipas (6), Tlaxcala (14), Veracruz (16), Yucatán (6), Zacatecas (9).
● ILI Centers (N=115)(Not displayed on map)Aguascalientes (5), Baja California (2), Baja California Sur (1), Campeche (1), Cohahuila (1), Colima (4), Chiapas (2), Chihuahua (4), Distrito Federal (12), Durango (4), Guanajuato (4), Hidalgo (10), Jalisco (7), Mexico (1), Morelos (2), Nayarit (2), Nuevo León (7), Puebla (9), Querétaro (6), Quintana Roo (1), Sinaloa (3), Sonora (1), Tlaxcala (3), Veracruz (7), Yucatán (11), Zacatecas (4).
◆ National Influenza Centers (N=1)1. Instituto Nacional de Diagnóstico y Referencia Epidemiológicos
– Technical capacity: IF, RT-PCR, viral isolation, sequencing– Average samples processed/year: 16,974
▲ Laboratories with PCR capacity (N=37)Aguascalientes, Baja California, Baja California Sur, Campeche, Chiapas, Chihuahua, Cohahuila, Colima, Durango, Estado de México, Guanajuato, Guerrero, Hidalgo, Jalisco, Michoacán, Morelos, Nayarit, Nuevo León, Oaxaca, Puebla, Querétaro, Quintana Roo, San Luis Potosí, Sinaloa, Sonora, Tabasco, Tamaulipas, Tlaxcala, Veracruz, Yucatán, Zacatecas, Ciudad de México (6).
– Technical capacity: IF, RT-PCR

Influenza and Other Respiratory Viruses: Surveillance in the Americas 2019 / 97
Influenza and Respiratory Syncytial Virus
Acute Respiratory Infection (ARI)
Severe Acute Respiratory Infection (SARI)
Virologic data Mexico: Distribution of influenza viruses by epidemiological week
Mexico: Cumulative percent positivity for influenza and respiratory syncytial virus
Data from ambulatory cases8
Data from severe cases8
Influenza virusesn Influenza A(H1N1)pdm09
n Influenza A(H3N2)
n Influenza A not subtyped
n Flu A Non subtypable
n Influenza B/Victoria
n Influenza B/Yamagata
n Influenza B/Lineage non-determined
n Influenza % positivity
Virus Percentages
n Influenza % positivity
n RSV (+) %
Average curve 2017/2018 Epidemic Extraordinary High Moderate
Average curve 2017/2018 Epidemic Extraordinary High Moderate

98 / Influenza and Other Respiratory Viruses: Surveillance in the Americas 2019
Unless otherwise specified, all data were collected by the PAHO/WHO Influenza Surveillance Team from one or more of the following sources: PAHO online surveys completed by epidemiology or laboratory experts, influenza bulletins published/shared by the countries, country presentations in regional influenza meetings, consultation with country influenza surveillance experts. The document was approved by the relevant national authority. 1. U.S. Census Bureau, Population pyramid, 2019; https://www.census.gov/popclock/world/mx2. World Bank. “Population, Total.” World Development Indicators, The World Bank Group, 2019, https://data.worldbank.org/indicator/SP.POP.TOTL. Accessed: 13 Sep. 2019.3. World Bank. “Population Density (people per sq. km of land area).” World Development Indicators, The World Bank Group, 2019, https://data.worldbank.org/indicator/EN.POP.DNST.
Accessed: 13 Sep. 2019.4. United Nations, Department of Economic and Social Affairs, Population Division (2019). World Population Prospects 2019, Online Edition. Rev. 1. Available from: https://population.
un.org/wpp/Download/Standard/Population/. Accessed: 13 Sep. 2019.5. Pan American Health Organization / World Health Organization, Evidence and Intelligence for Action in Health / Health Analysis, Metrics and Evidence. Health Situation in the
Americas: Core Indicators 2018. Washington, D.C.: PAHO; 2018. Available from: https://www.paho.org/data/index.php/en/indicators/visualization.html6. Current health expenditure per capita, PPP (current international $) | Data [Internet]. Data.worldbank.org. 2019 [cited 10 October 2019]. Available from: https://data.worldbank.org/
indicator/SH.XPD.CHEX.PP.CD 7. Pan American Health Organization / World Health Organization. Immunization in the Americas [Internet]. Paho.org. 2019 [cited 10 October 2019]. Available from: https://www.paho.org/
en/documents/immunization-americas-2019-summary8. WHO (2020), WHO Average Curves software, Version 0.3 (2019-10-09), © Copyright World Health Organization (WHO), Geneva.
FluID/FluNet/PISA
FluIDReport: YesReported > 33%: YesReported to WHO in 2018: Yes
FluNetReport: YesReported > 33%: YesReported to WHO in 2018: Yes
PISA Parameters
Transmissibility: YesSeriousness of disease: YesImpact: Yes
Human-Animal Interface for InfluenzaIntersectoral meetings YesInformation sharing between sectors In progressSurveillance of unusual respiratory cases with exposure to animals In progress
Influenza Disease Burden
Estimation of medical burden for influenza No
Estimation of economic burden for influenza No
Publication of influenza burden of disease NA
Pandemic Influenza Preparedness Planning
Plan available Yes
Part of an all-hazards plan Yes
Year of original publication 2006
Year of last revision/update 2018
Simulations Yes
Drills No
Rapid response teams composed Yes
Risk communication strategy in place Yes
Laboratory CapacityVirologic surveillance YesParticipation in the latest WHO External Quality Assessment Programme (EQAP)
Yes
Samples sent to WHO Collaborating Center Yes
Number of samples analyzed during 2017–2018 16,974
Specimens tested for other respiratory viruses (ORV) Yes
Other respiratory viruses identified
RSV, adenovirus, parainfluenza 1, 2, 3; metapneumovirus, bocavirus, rhinovirus, coronavirus NL63, OC43, HKU1, 229E, parainfluenza 4, enterovirus, enterovirus
D68, MERS-CoV
Influenza VaccineComposition Northern hemisphere
Month of vaccine administration October
Percentage of older adults vaccinated7 94%* (* ≥ 60 years)
Percentage of children under 5 vaccinated788%* (*age of
vaccinated children is 6-59 months)
Percentage of pregnant women vaccinated7 81%Percentage of people at higher risk for influenza-related complications vaccinated 100%
Percentage of health care workers vaccinated7 100%

Influenza and Other Respiratory Viruses: Surveillance in the Americas 2019 / 99
POPULATIONPopulation (thousands)2: 6,466
Population density (per km2)3: 54.0Percentage of population < 5 years4: 10.3%Percentage of population ≥ 65 years4: 5.2%
MORTALITYGross mortality rate (per 1,000 population)5: 5.9Mortality rate from all causes at < 5 years of age
(per 1,000 live births)5: 13.9Mortality rate due to communicable diseases
(per 100,000 population)5: 53.6
PUBLIC HEALTHNumber of medical doctors working in the public system
(per 10,000 population)5: 9.9Current health expenditure per capita, PPP*
(current international $)6: 485.0National health expenditure as % of GDP 20165: 5.4
*PPP – Purchasing Power Parity
SURVEILLANCE SYSTEM CHARACTERISTICS INFORMATION SYSTEM
EventWHO case definition
used Surveillance
strategy
Clinical samples collected from
cases
Shipment of samples to NIC (or laboratory)
Evaluation of surveillance
sites Number of sites Name
Laboratory and
epidemiology integration
Online report
SARI No* Sentinel 100% 3 times/week Weekly 6ALERTA Yes
Online
ILI No** Sentinel Quota (18 samples/week) 3 times/week Weekly 6
ARI No; ICD-10 codes (J00-J06) National No No NA 1,698
SIVE NoPNEUMONIA No; ICD-10 codes
(J09-J18) National No No NA 1,698
Sociodemographic Indicators
Surveillance Systems
Surveillance Map
Nicaragua
100+95 - 9990 - 9485 - 8980 - 8475 - 7970 - 7465 - 6960 - 6455 - 5950 - 5445 - 4940 - 4435 - 3930 - 3425 - 2920 - 2415 - 1910 - 14
5 - 90.-4
Population (in thousands)
Male
Age Group Population (in thousands)
Female
320 0192 12864 256256 64128 1920 320
Nicaragua, 20191
* The data in the sentinel surveillance map are updated as of January 2019. The population is a projection, as of 2018, by the Nicaragua National Institute of Development Information.
● SARI Hospitals (N=6)1. Hospital Infantil Manuel de Jesús Rivera La Mascota (Managua)2. Hospital Alemán Nicaragüense (Managua)3. Hospital Manolo Morales (Managua)4. Hospital Humberto Alvarado (Masaya)5. Hospital San Juan de Dios (Esteli)6. Hospital Pedro Altamirano (Esteli)
● ILI Centers (N=6)1. Centro de Salud Villa Libertad (Managua)2. Centro de Salud Sócrates Flores (Managua)3. Centro de Salud Monimbo (Masaya)4. Centro de Salud Tisma (Masaya)5. Centro de Salud Alejandro Dávila Bolaños (Masaya)6. Centro de Salud Leonel Rugama (Estelí)
◆ National Influenza Centers (N=1)1. Centro Nacional de Diagnóstico y Referencia (Managua)
– Technical capacity: IF, RT-PCR, viral isolation– Average samples processed/year: 8,673
▲ Laboratories with IF capacity (N=8)
1. Managua (5)2. Masaya (3)
Pop.0 1,262,978
* SARI: All patients of any age with a history of sudden onset of fever greater than 38 °C within the last 10 days, cough or sore throat or respiratory distress and in need of hospital-ization.
** ILI: All patients of any age with a history of sudden onset of fever above 38 °C, cough or sore throat in the last 10 days and absence of other diagnoses.
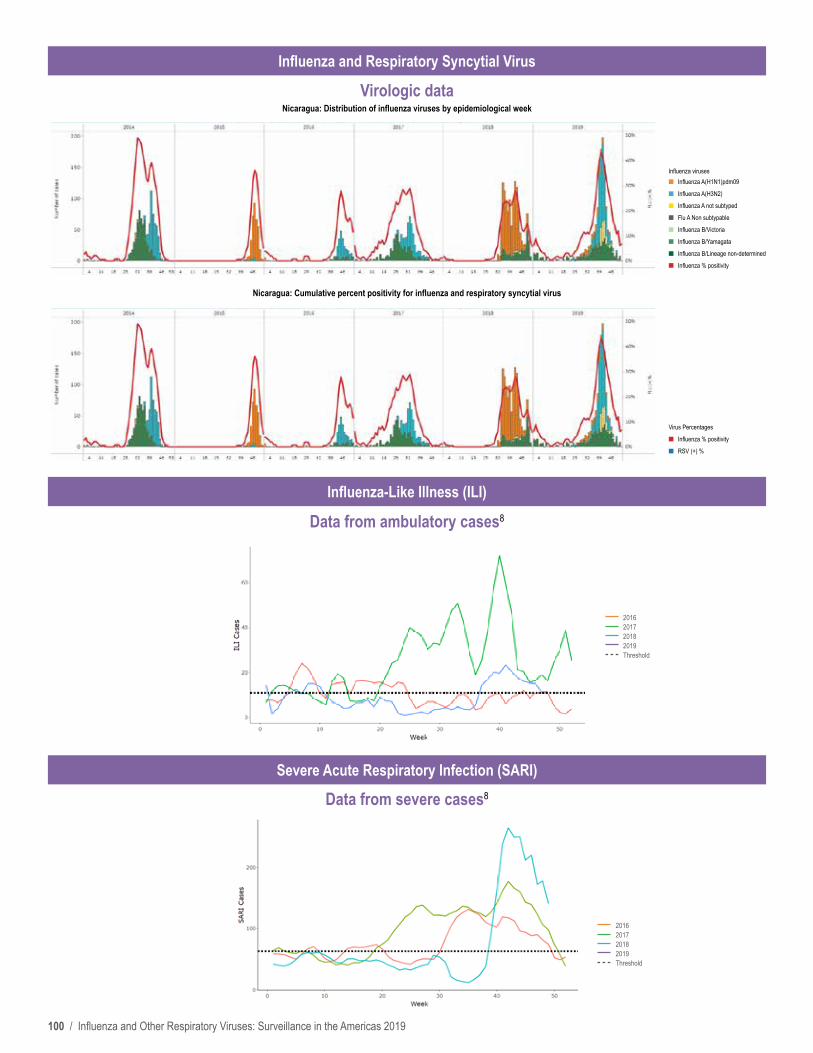
100 / Influenza and Other Respiratory Viruses: Surveillance in the Americas 2019
Influenza and Respiratory Syncytial Virus
Influenza-Like Illness (ILI)
Severe Acute Respiratory Infection (SARI)
Virologic data Nicaragua: Distribution of influenza viruses by epidemiological week
Nicaragua: Cumulative percent positivity for influenza and respiratory syncytial virus
Data from ambulatory cases8
Data from severe cases8
Influenza virusesn Influenza A(H1N1)pdm09
n Influenza A(H3N2)
n Influenza A not subtyped
n Flu A Non subtypable
n Influenza B/Victoria
n Influenza B/Yamagata
n Influenza B/Lineage non-determined
n Influenza % positivity
Virus Percentages
n Influenza % positivity
n RSV (+) %
2016 2017 2018 2019 Threshold
2016 2017 2018 2019 Threshold

Influenza and Other Respiratory Viruses: Surveillance in the Americas 2019 / 101
FluID/FluNet/PISA
FluIDReport: YesReported > 33%: YesReported to WHO in 2018: Yes
FluNetReport: YesReported > 33%: YesReported to WHO in 2018: Yes
PISA Parameters
Transmissibility: In progress Seriousness of disease: In progress Impact: In progress
Human-Animal Interface for InfluenzaIntersectoral meetings YesInformation sharing between sectors In progress
Surveillance of unusual respiratory cases with exposure to animals Yes
Influenza Disease Burden
Estimation of medical burden for influenza No
Estimation of economic burden for influenza No
Publication of influenza burden of disease NA
Pandemic Influenza Preparedness Planning
Plan available Yes
Part of an all-hazards plan Yes
Year of original publication 2009
Year of last revision/update 2019
Simulations Yes
Drills Yes
Rapid response teams composed No
Risk communication strategy in place Yes
Laboratory CapacityVirologic surveillance YesParticipation in the latest WHO External Quality Assessment Programme (EQAP) Yes
Samples sent to WHO Collaborating Center Yes
Number of samples analyzed during 2017–2018 8,673
Specimens tested for other respiratory viruses (ORV) Yes
Other respiratory viruses identified
RSV, adenovirus, parainfluenza 1, 2, 3; metapneumovirus,
bocavirus, rhinovirus, enterovirus, parainfluenza 4
Influenza Vaccine
Composition Southern hemisphere
Month of vaccine administration May/June
Percentage of older adults vaccinated 20% (≥ 65 years)
Percentage of children under 5 vaccinated 51% (age of vaccinated children is 6-23 months)
Percentage of pregnant women vaccinated7 91%
Percentage of people at higher risk for influenza-related complications vaccinated 20%
Percentage of health care workers vaccinated7 100%
Unless otherwise specified, all data were collected by the PAHO/WHO Influenza Surveillance Team from one or more of the following sources: PAHO online surveys completed by epidemiology or laboratory experts, influenza bulletins published/shared by the countries, country presentations in regional influenza meetings, consultation with country influenza surveillance experts. The document was approved by the relevant national authority. 1. U.S. Census Bureau, Population pyramid, 2019; https://www.census.gov/popclock/world/nu2. World Bank. “Population, Total.” World Development Indicators, The World Bank Group, 2019, https://data.worldbank.org/indicator/SP.POP.TOTL. Accessed: 13 Sep. 2019.3. World Bank. “Population Density (people per sq. km of land area).” World Development Indicators, The World Bank Group, 2019, https://data.worldbank.org/indicator/EN.POP.DNST.
Accessed: 13 Sep. 2019.4. United Nations, Department of Economic and Social Affairs, Population Division (2019). World Population Prospects 2019, Online Edition. Rev. 1. Available from: https://population.
un.org/wpp/Download/Standard/Population/. Accessed: 13 Sep. 2019.5. Pan American Health Organization / World Health Organization, Evidence and Intelligence for Action in Health / Health Analysis, Metrics and Evidence. Health Situation in the
Americas: Core Indicators 2018. Washington, D.C.: PAHO; 2018. Available from: https://www.paho.org/data/index.php/en/indicators/visualization.html6. Current health expenditure per capita, PPP (current international $) | Data [Internet]. Data.worldbank.org. 2019 [cited 10 October 2019]. Available from: https://data.worldbank.org/
indicator/SH.XPD.CHEX.PP.CD 7. Pan American Health Organization / World Health Organization. Immunization in the Americas [Internet]. Paho.org. 2019 [cited 10 October 2019]. Available from: https://www.paho.org/
en/documents/immunization-americas-2019-summary8. WHO (2020), WHO Average Curves software, Version 0.3 (2019-10-09), © Copyright World Health Organization (WHO), Geneva.

102 / Influenza and Other Respiratory Viruses: Surveillance in the Americas 2019
POPULATIONPopulation (thousands)2: 4,177
Population density (per km2)3: 56.0Percentage of population < 5 years4: 9.3%
Percentage of population ≥ 65 years4: 8.1%
MORTALITYGross mortality rate (per 1,000 population)5: 4.9Mortality rate from all causes at < 5 years of age
(per 1,000 live births)5: 17.4Mortality rate due to communicable diseases
(per 100,000 population)5: 75.8
PUBLIC HEALTHNumber of medical doctors working in the public system
(per 10,000 population)5: 15.9Current health expenditure per capita, PPP*
(current international $)6: 1,750National health expenditure as % of GDP 20165: 4.8
*PPP – Purchasing Power Parity
SURVEILLANCE SYSTEM CHARACTERISTICS INFORMATION SYSTEM
EventWHO case definition
used Surveillance
strategy
Clinical samples collected from
cases
Shipment of samples to NIC (or
laboratory)
Evaluation of surveillance
sites Number of sites Name
Laboratory and epidemiology
integrationOnline report
SARI Yes Sentinel Quota (50 samples/week) Weekly Annually 10
SISVIGYes Online
ILI Yes National Quota (25 samples/week) Weekly Annually 317
PNEUMONIA No; ICD-10 codes (J09.X-J18.9) National No Weekly NA 317
INFLUENZA NA Sentinel Quota (5 samples/week) Weekly NA 16
INFLUENZA MORTALITY NA National 100% Weekly NA 317 SISVIG-
VIGMOR
Socio
dem
ogra
phic
Indi
cato
rsSu
rveil
lance
Sys
tem
sSu
rveil
lance
Map
* The data in the sentinel surveillance map are updated as of January 2019. The population is a projection, as of 2018, by the Panama National Institute of Statistics and Census.
Pop.12,528 2,186,747
Panama
100+95 - 9990 - 9485 - 8980 - 8475 - 7970 - 7465 - 6960 - 6455 - 5950 - 5445 - 4940 - 4435 - 3930 - 3425 - 2920 - 2415 - 1910 - 14
5 - 90.-4
Population (in thousands)
Male
Age Group Population (in thousands)
Female
175 0105 7035 140140 3570 1050 175
Panama, 20191
◆ National Influenza Centers (N=1)1. Laboratorio de Virología (Instituto Conmemorativo
Gorgas de Estudios de la Salud)– Technical capacity: IF, RT-PCR, viral isolation– Average samples processed/year: 3,771
● SARI Hospitals (N=10)1. Hospital del Niño (Ciudad de Panamá)2. Hospital de Especialidades Pediátrica (Ciudad de Panamá)3. Hospital Regional de Chepo (Chepo)4. Hospital Manuel Amador Guerrero (Ciudad de Colón)5. Hospital Nicolás Solano (La Chorrera)
6. Hospital San Miguel Arcángel (San Miguelito)7. Hospital Rafael Estévez (Ciudad de Aguadulce)8. Hospital Luis Chicho Fábrega (Ciudad de Santiago)9. Hospital Joaquín Pablo Franco (Ciudad de las Tablas)10. Hospital José Domingo de Obaldía
● ILI Centers (N=12)Panama City (5), Chiriquí (2), Veraguas (2), Colón, San Miguelito, Los Santos
▲ Laboratories with PCR capacity (N=1)
1. Hospital José Domingo de Obaldía
▲ Laboratories with IF capacity (N=1)
1. Hospital Luis Chicho Fábrega

Influenza and Other Respiratory Viruses: Surveillance in the Americas 2019 / 103
Influenza and Respiratory Syncytial Virus
Influenza-Like Illness (ILI)
Severe Acute Respiratory Infection (SARI)
Virologic data Panama: Distribution of influenza viruses by epidemiological week
Panama: Cumulative percent positivity for influenza and respiratory syncytial virus
Data from ambulatory cases8
Data from severe cases8
Influenza virusesn Influenza A(H1N1)pdm09
n Influenza A(H3N2)
n Influenza A not subtyped
n Flu A Non subtypable
n Influenza B/Victoria
n Influenza B/Yamagata
n Influenza B/Lineage non-determined
n Influenza % positivity
Virus Percentages
n Influenza % positivity
n RSV (+) %
2017 2018 Threshold
2017 2018 Threshold
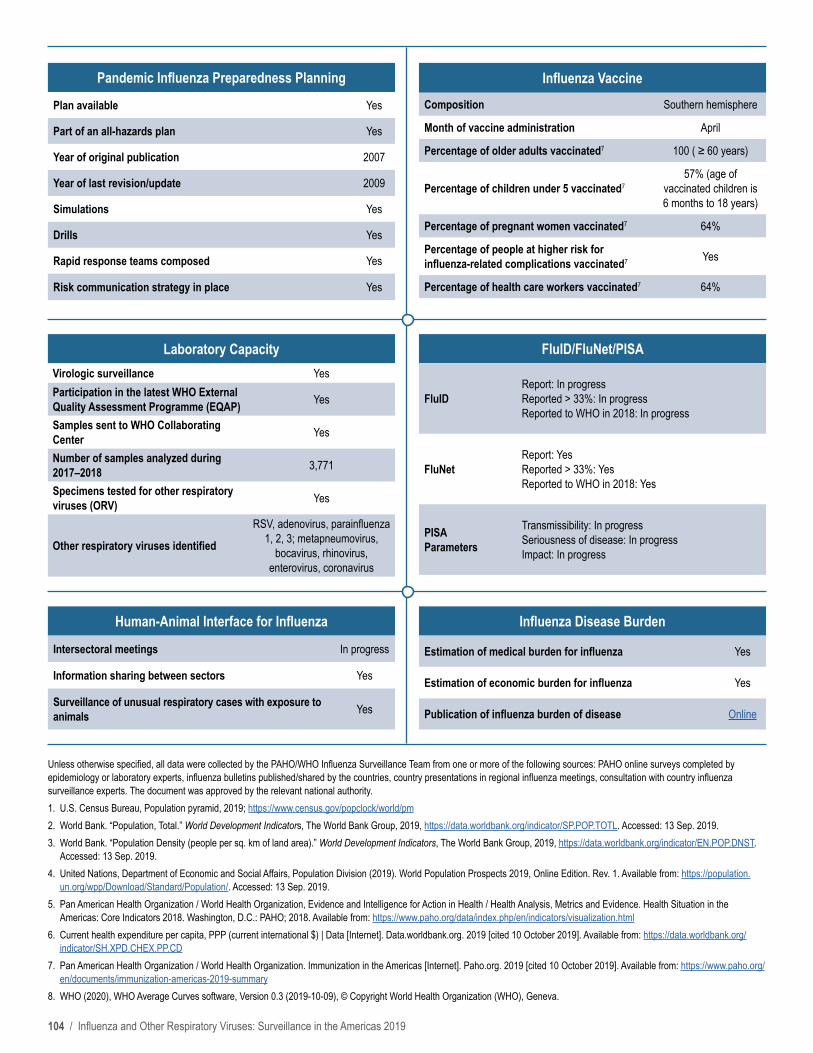
104 / Influenza and Other Respiratory Viruses: Surveillance in the Americas 2019
FluID/FluNet/PISA
FluIDReport: In progressReported > 33%: In progressReported to WHO in 2018: In progress
FluNetReport: YesReported > 33%: YesReported to WHO in 2018: Yes
PISA Parameters
Transmissibility: In progress Seriousness of disease: In progress Impact: In progress
Human-Animal Interface for Influenza
Intersectoral meetings In progress
Information sharing between sectors Yes
Surveillance of unusual respiratory cases with exposure to animals Yes
Influenza Disease Burden
Estimation of medical burden for influenza Yes
Estimation of economic burden for influenza Yes
Publication of influenza burden of disease Online
Pandemic Influenza Preparedness Planning
Plan available Yes
Part of an all-hazards plan Yes
Year of original publication 2007
Year of last revision/update 2009
Simulations Yes
Drills Yes
Rapid response teams composed Yes
Risk communication strategy in place Yes
Laboratory CapacityVirologic surveillance YesParticipation in the latest WHO External Quality Assessment Programme (EQAP) Yes
Samples sent to WHO Collaborating Center Yes
Number of samples analyzed during 2017–2018 3,771
Specimens tested for other respiratory viruses (ORV) Yes
Other respiratory viruses identified
RSV, adenovirus, parainfluenza 1, 2, 3; metapneumovirus,
bocavirus, rhinovirus, enterovirus, coronavirus
Influenza VaccineComposition Southern hemisphere
Month of vaccine administration April
Percentage of older adults vaccinated7 100 ( ≥ 60 years)
Percentage of children under 5 vaccinated757% (age of
vaccinated children is 6 months to 18 years)
Percentage of pregnant women vaccinated7 64%
Percentage of people at higher risk for influenza-related complications vaccinated7 Yes
Percentage of health care workers vaccinated7 64%
Unless otherwise specified, all data were collected by the PAHO/WHO Influenza Surveillance Team from one or more of the following sources: PAHO online surveys completed by epidemiology or laboratory experts, influenza bulletins published/shared by the countries, country presentations in regional influenza meetings, consultation with country influenza surveillance experts. The document was approved by the relevant national authority. 1. U.S. Census Bureau, Population pyramid, 2019; https://www.census.gov/popclock/world/pm2. World Bank. “Population, Total.” World Development Indicators, The World Bank Group, 2019, https://data.worldbank.org/indicator/SP.POP.TOTL. Accessed: 13 Sep. 2019.3. World Bank. “Population Density (people per sq. km of land area).” World Development Indicators, The World Bank Group, 2019, https://data.worldbank.org/indicator/EN.POP.DNST.
Accessed: 13 Sep. 2019.4. United Nations, Department of Economic and Social Affairs, Population Division (2019). World Population Prospects 2019, Online Edition. Rev. 1. Available from: https://population.
un.org/wpp/Download/Standard/Population/. Accessed: 13 Sep. 2019.5. Pan American Health Organization / World Health Organization, Evidence and Intelligence for Action in Health / Health Analysis, Metrics and Evidence. Health Situation in the
Americas: Core Indicators 2018. Washington, D.C.: PAHO; 2018. Available from: https://www.paho.org/data/index.php/en/indicators/visualization.html6. Current health expenditure per capita, PPP (current international $) | Data [Internet]. Data.worldbank.org. 2019 [cited 10 October 2019]. Available from: https://data.worldbank.org/
indicator/SH.XPD.CHEX.PP.CD 7. Pan American Health Organization / World Health Organization. Immunization in the Americas [Internet]. Paho.org. 2019 [cited 10 October 2019]. Available from: https://www.paho.org/
en/documents/immunization-americas-2019-summary8. WHO (2020), WHO Average Curves software, Version 0.3 (2019-10-09), © Copyright World Health Organization (WHO), Geneva.

Influenza and Other Respiratory Viruses: Surveillance in the Americas 2019 / 105
POPULATIONPopulation (thousands)2: 6,956
Population density (per km2)3: 18.0Percentage of population < 5 years4: 10.0%Percentage of population ≥ 65 years4: 6.4%
MORTALITYGross mortality rate (per 1,000 population)5: 6.5Mortality rate from all causes at < 5 years of age
(per 1,000 live births)5: 14.5Mortality rate due to communicable diseases
(per 100,000 population)5: 78.8
PUBLIC HEALTHNumber of medical doctors working in the public system
(per 10,000 population)5: 14.0Current health expenditure per capita, PPP*
(current international $)6: 768.0National health expenditure as % of GDP 20165: 4.1
*PPP – Purchasing Power Parity
SURVEILLANCE SYSTEM CHARACTERISTICS INFORMATION SYSTEM
EventWHO case definition
used Surveillance
strategy
Clinical samples
collected from cases
Shipment of samples to NIC (or
laboratory)
Evaluation of surveillance
sites Number of sites Name
Laboratory and
epidemiology integration
Online report
SARI Yes Sentinel 100% 2-3 times/week Annually 10 ILI and SARI sentinel
surveillanceYes Online
ILI Yes Sentinel Quota (3-5 samples/week) 2-3 times/week Annually 5
ARINo; ICD-10 codes (J00, J02, J04, J06, J12, J15,
J18, J20, J21, J22)National No No NA NA NA NA NA
PNEUMONIA No; ICD-10 codes (J15, J18, J22) National No No NA 1,253 NA No NA
INFLUENZA NA Sentinel 100% No NA 10ILI and SARI
sentinel surveillance
Yes NA
Sociodemographic Indicators
Surveillance Systems
Surveillance Map
Pop.0 13,555
Paraguay
100+95 - 9990 - 9485 - 8980 - 8475 - 7970 - 7465 - 6960 - 6455 - 5950 - 5445 - 4940 - 4435 - 3930 - 3425 - 2920 - 2415 - 1910 - 14
5 - 90.-4
Population (in thousands)
Male
Age Group Population (in thousands)
Female
345 0207 13869 276276 69138 2070 345
Paraguay, 20191
● SARI Hospitals (N=10)1. Hospital Central Instituto Previsión Social (Asunción)2. Hospital General de Barrio Obrero (Asunción)3. Instituto Nacional de Enfermedades Respiratorias y del
Ambiente (Asunción)4. Instituto de Medicina Tropical (Asunción)5. Hospital Nacional de Itaguá (Itaguá)6. Hospital General Pediátrico Niños de Acosta Ñú (San Lorenzo)7. Hospital Regional de Coronel Oviedo (Coronel Oviedo)8. Hospital Regional de Encarnación (Encarnación)9. Hospital Regional de la Ciudad del Este (Ciudad del Este)10. Hospital Regional de Pedro Juan Caballero (Pedro Juan Caballero)
● ILI Centers (N=5)1. Hospital General de Barrio Obrero (Asunción – Capital)2. Hospital Regional Coronel Oviedo (Coronel Oviedo)3. Hospital Regional de Encarnación (Encarnación – Itapúa)4. Hospital Regional de Ciudad del Este (Ciudad del Este – Alto Paraná)5. Hospital Regional de Pedro Juan Caballero (Pedro Juan Caballero – Amambay)
* The data in the sentinel surveillance map are updated as of January 2019. The population is a projection, as of 2018, by the Paraguayan Directorate of Statistics, Surveys and Censuses.
◆ National Influenza Centers (N=1)1. Laboratorio Central de la Salud Pública (LCSP)
– Technical capacity: IF, RT-PCR, viral isolation– Average samples processed/year: 6,876 (2018)
▲ Laboratories with IF capacity (N=2)1. Laboratorio Hospital Pediátrico
de San Lorenzo2. Laboratorio Hospital Ciudad del Este
– Technical capacity: IF

106 / Influenza and Other Respiratory Viruses: Surveillance in the Americas 2019
Influenza and Respiratory Syncytial Virus
Influenza-Like Illness (ILI)
Severe Acute Respiratory Infection (SARI)
Virologic data Paraguay: Distribution of influenza viruses by epidemiological week
Paraguay: Cumulative percent positivity for influenza and respiratory syncytial virus
Data from ambulatory cases8
Data from severe cases8
Influenza virusesn Influenza A(H1N1)pdm09
n Influenza A(H3N2)
n Influenza A not subtyped
n Flu A Non subtypable
n Influenza B/Victoria
n Influenza B/Yamagata
n Influenza B/Lineage non-determined
n Influenza % positivity
Virus Percentages
n Influenza % positivity
n RSV (+) %
Average curve 2019 Epidemic Extraordinary High Moderate
Average curve 2019 Epidemic Extraordinary High Moderate

Influenza and Other Respiratory Viruses: Surveillance in the Americas 2019 / 107
FluID/FluNet/PISA
FluIDReport: YesReported > 33%: YesReported to WHO in 2018: Yes
FluNetReport: YesReported > 33%: YesReported to WHO in 2018: Yes
PISA Parameters
Transmissibility: Yes Seriousness of disease: Yes Impact: Yes
Human-Animal Interface for Influenza
Intersectoral meetings No
Information sharing between sectors Yes
Surveillance of unusual respiratory cases with exposure to animals Yes
Influenza Disease Burden
Estimation of medical burden for influenza Yes
Estimation of economic burden for influenza No
Publication of influenza burden of disease NA
Pandemic Influenza Preparedness Planning
Plan available Yes
Part of an all-hazards plan No
Year of original publication 2009
Year of last revision/update 2011
Simulations Yes
Drills Yes
Rapid response teams composed Yes
Risk communication strategy in place Yes
Laboratory CapacityVirologic surveillance YesParticipation in the latest WHO External Quality Assessment Programme (EQAP) Yes
Samples sent to WHO Collaborating Center Yes
Number of samples analyzed during 2017–2018 6,876 (2018 only)
Specimens tested for other respiratory viruses (ORV) Yes
Other respiratory viruses identified RSV, adenovirus, parainfluenza 1, 2, 3; metapneumovirus
Influenza Vaccine
Composition Southern hemisphere
Month of vaccine administration April or May
Percentage of older adults vaccinated7 34% (≥ 60 years)
Percentage of children under 5 vaccinated724% (age of
vaccinated children is 6 to 23 months)
Percentage of pregnant women vaccinated7 28%Percentage of people at higher risk for influenza-related complications vaccinated7 Yes
Percentage of health care workers vaccinated7 54%
Unless otherwise specified, all data were collected by the PAHO/WHO Influenza Surveillance Team from one or more of the following sources: PAHO online surveys completed by epidemiology or laboratory experts, influenza bulletins published/shared by the countries, country presentations in regional influenza meetings, consultation with country influenza surveillance experts. The document was approved by the relevant national authority. 1. U.S. Census Bureau, Population pyramid, 2019; https://www.census.gov/popclock/world/pa2. World Bank. “Population, Total.” World Development Indicators, The World Bank Group, 2019, https://data.worldbank.org/indicator/SP.POP.TOTL. Accessed: 13 Sep. 2019.3. World Bank. “Population Density (people per sq. km of land area).” World Development Indicators, The World Bank Group, 2019, https://data.worldbank.org/indicator/EN.POP.DNST.
Accessed: 13 Sep. 2019.4. United Nations, Department of Economic and Social Affairs, Population Division (2019). World Population Prospects 2019, Online Edition. Rev. 1. Available from: https://population.
un.org/wpp/Download/Standard/Population/. Accessed: 13 Sep. 2019.5. Pan American Health Organization / World Health Organization, Evidence and Intelligence for Action in Health / Health Analysis, Metrics and Evidence. Health Situation in the
Americas: Core Indicators 2018. Washington, D.C.: PAHO; 2018. Available from: https://www.paho.org/data/index.php/en/indicators/visualization.html6. World Bank. 2018. World Development Indicators | DataBank https://data.worldbank.org/indicator/SH.MED.PHYS.ZS?locations=PY. Accessed: 9 Oct. 2019.7. Pan American Health Organization / World Health Organization. Immunization in the Americas [Internet]. Paho.org. 2019 [cited 10 October 2019]. Available from: https://www.paho.org/
en/documents/immunization-americas-2019-summary8. WHO (2020), WHO Average Curves software, Version 0.3 (2019-10-09), © Copyright World Health Organization (WHO), Geneva.

108 / Influenza and Other Respiratory Viruses: Surveillance in the Americas 2019
* The data in the sentinel surveillance map are updated as of January 2019. The population is a projection, as of 2018, by the Peru National Institute of Statistics and Informatics.
Pop.146,856 10,298,159
POPULATIONPopulation (thousands)2: 31,989
Population density (per km2)3: 25.0Percentage of population < 5 years4: 8.6%
Percentage of population ≥ 65 years4: 8.1%
MORTALITYGross mortality rate (per 1,000 population)5: 5.9Mortality rate from all causes at < 5 years of age
(per 1,000 live births)5: 19.0Mortality rate due to communicable diseases
(per 100,000 population)5: 116.9
PUBLIC HEALTHNumber of medical doctors working in the public system
(per 10,000 population)5: 8.2Current health expenditure per capita, PPP*
(current international $)6: 681.0National health expenditure as % of GDP 20165: 3.3
*PPP – Purchasing Power Parity
SURVEILLANCE SYSTEM CHARACTERISTICS INFORMATION SYSTEM
EventWHO case
definition used Surveillance
strategy
Clinical samples collected from
cases
Shipment of samples to NIC (or
laboratory)
Evaluation of surveillance
sites Number of sites Name
Laboratory and epidemiology
integrationOnline report
SARI Yes Sentinel 100% Varies Yes 7 SIEPI-FLU
NoNo
ILI Yes Sentinel Quota (14 samples/week)
1-2 times/week No 20
ARI No; ICD-10 codes (J00-J11) National No No NA 7,884 NOTIWEB
INFLUENZA MORTALITY NA NA Yes NA NA NA SIEPI-FLU NA
Socio
dem
ogra
phic
Indi
cato
rsSu
rveil
lance
Sys
tem
sSu
rveil
lance
Map
Peru
100+95 - 9990 - 9485 - 8980 - 8475 - 7970 - 7465 - 6960 - 6455 - 5950 - 5445 - 4940 - 4435 - 3930 - 3425 - 2920 - 2415 - 1910 - 14
5 - 90.-4
Population (in millions)
Male
Age Group Population (in millions)
Female
2 01.2 0.80.4 1.61.6 0.40.8 1.20 2
Peru, 20191
● SARI Hospitals (N=7)1. Hospital Regional de Cusco (Cusco)2. Hospital Docente Las Mercedes (Lambayeque)3. Hospital Nacional Arzobispo Loayza (Lima)4. Hospital Nacional Cayetano Heredia (Lima)5. Hospital Iquitos César Garayar García (Loreto)6. Hospital Carlos Monge Medrano de Juliaca (Puno)7. Hospital de Apoyo Departamental Hipólito Unanue de Tacna (Tacna)
● ILI Centers (N=20)1. H.A. Carhuaz (Ancash)2. C.S. Maritza Campos,
Zamacola (Ayacucho)3. Hospital Regional Ayacucho
(Ayacucho)4. C.S. Ttio (Cusco)5. Hospital Departamental
Huancavelica (Huancavelica)6. Hospital El Carmen (Junín)7. C.S. José Olaya (Lambayeque)8. C.S.M.I. Manuel Barreto (Lima)9. Hospital María Auxiliadora
(Lima)10. Hospital de Chancay (Lima)
11. José Agurto Tello (Lima)12. Dos de Mayo (Lima)13. Emergencias Pediátricas
(Lima)14. Hospital Regional Cajamarca
(Cajamarca)15. Manuel Bonilla (Callao)16. E.S.I-3 San José (Piura)17. C.S. Simón Bolivar (Puno)18. C.S. San Francisco (Tacna)19. C.S. Zarumilla (Tumbes)20. Hospital Apoyo Yaranicocha
(Ucayali)
◆ National Influenza Centers (N=1)1. National Center for Public Health, National
Institute (Lima)– Technical capacity: IF, RT-PCR, viral
isolation– Average samples processed/year: 4,084
▲ Laboratories with IF capacity (N=16)Ancash, Arequipa, Ayacucho, Cajamarca, Huancavelica, Junín, Lambayeque, Piura, Puno, Tacna, Tumbes, Ucayali
– Technical capacity: IF
▲ Laboratories with PCR capacity (N=2)1. Cusco2. Loreto
– Technical capacity: IF, RT-PCR

Influenza and Other Respiratory Viruses: Surveillance in the Americas 2019 / 109
Influenza and Respiratory Syncytial Virus
Acute Respiratory Infection (ARI)
Severe Acute Respiratory Infection (SARI)
Virologic data Peru: Distribution of influenza viruses by epidemiological week
Peru: Cumulative percent positivity for influenza and respiratory syncytial virus
Data from ambulatory cases8
Data from severe cases8
Influenza virusesn Influenza A(H1N1)pdm09
n Influenza A(H3N2)
n Influenza A not subtyped
n Flu A Non subtypable
n Influenza B/Victoria
n Influenza B/Yamagata
n Influenza B/Lineage non-determined
n Influenza % positivity
Virus Percentages
n Influenza % positivity
n RSV (+) %
2014 2015 2016 2017 2018 2019
4 11 18 25 32 39 46 53 4 11 18 25 32 39 46 4 11 18 25 32 39 46 4 11 18 25 32 39 46 4 11 18 25 32 39 46 4 11 18 25 32 39 46
0
20
40
60
80
100
120
Num
ber o
f cas
es
0%
10%
20%
30%
40%
FLU
(+) %
2015 2016 2017 2018 Threshold
2015 2016 2017 2018 Threshold
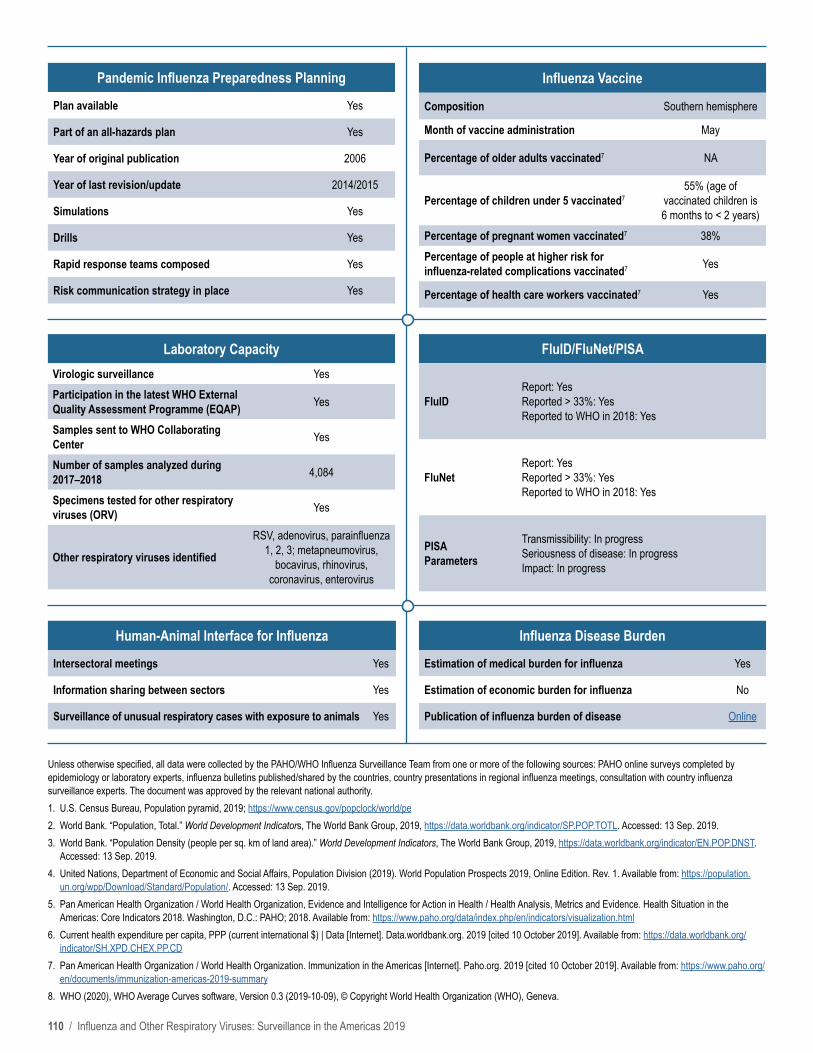
110 / Influenza and Other Respiratory Viruses: Surveillance in the Americas 2019
FluID/FluNet/PISA
FluIDReport: YesReported > 33%: YesReported to WHO in 2018: Yes
FluNetReport: YesReported > 33%: YesReported to WHO in 2018: Yes
PISA Parameters
Transmissibility: In progress Seriousness of disease: In progress Impact: In progress
Human-Animal Interface for Influenza
Intersectoral meetings Yes
Information sharing between sectors Yes
Surveillance of unusual respiratory cases with exposure to animals Yes
Influenza Disease Burden
Estimation of medical burden for influenza Yes
Estimation of economic burden for influenza No
Publication of influenza burden of disease Online
Pandemic Influenza Preparedness Planning
Plan available Yes
Part of an all-hazards plan Yes
Year of original publication 2006
Year of last revision/update 2014/2015
Simulations Yes
Drills Yes
Rapid response teams composed Yes
Risk communication strategy in place Yes
Laboratory CapacityVirologic surveillance YesParticipation in the latest WHO External Quality Assessment Programme (EQAP) Yes
Samples sent to WHO Collaborating Center Yes
Number of samples analyzed during 2017–2018 4,084
Specimens tested for other respiratory viruses (ORV) Yes
Other respiratory viruses identified
RSV, adenovirus, parainfluenza 1, 2, 3; metapneumovirus,
bocavirus, rhinovirus, coronavirus, enterovirus
Influenza Vaccine
Composition Southern hemisphere
Month of vaccine administration May
Percentage of older adults vaccinated7 NA
Percentage of children under 5 vaccinated755% (age of
vaccinated children is 6 months to < 2 years)
Percentage of pregnant women vaccinated7 38%Percentage of people at higher risk for influenza-related complications vaccinated7 Yes
Percentage of health care workers vaccinated7 Yes
Unless otherwise specified, all data were collected by the PAHO/WHO Influenza Surveillance Team from one or more of the following sources: PAHO online surveys completed by epidemiology or laboratory experts, influenza bulletins published/shared by the countries, country presentations in regional influenza meetings, consultation with country influenza surveillance experts. The document was approved by the relevant national authority. 1. U.S. Census Bureau, Population pyramid, 2019; https://www.census.gov/popclock/world/pe2. World Bank. “Population, Total.” World Development Indicators, The World Bank Group, 2019, https://data.worldbank.org/indicator/SP.POP.TOTL. Accessed: 13 Sep. 2019.3. World Bank. “Population Density (people per sq. km of land area).” World Development Indicators, The World Bank Group, 2019, https://data.worldbank.org/indicator/EN.POP.DNST.
Accessed: 13 Sep. 2019.4. United Nations, Department of Economic and Social Affairs, Population Division (2019). World Population Prospects 2019, Online Edition. Rev. 1. Available from: https://population.
un.org/wpp/Download/Standard/Population/. Accessed: 13 Sep. 2019.5. Pan American Health Organization / World Health Organization, Evidence and Intelligence for Action in Health / Health Analysis, Metrics and Evidence. Health Situation in the
Americas: Core Indicators 2018. Washington, D.C.: PAHO; 2018. Available from: https://www.paho.org/data/index.php/en/indicators/visualization.html6. Current health expenditure per capita, PPP (current international $) | Data [Internet]. Data.worldbank.org. 2019 [cited 10 October 2019]. Available from: https://data.worldbank.org/
indicator/SH.XPD.CHEX.PP.CD 7. Pan American Health Organization / World Health Organization. Immunization in the Americas [Internet]. Paho.org. 2019 [cited 10 October 2019]. Available from: https://www.paho.org/
en/documents/immunization-americas-2019-summary8. WHO (2020), WHO Average Curves software, Version 0.3 (2019-10-09), © Copyright World Health Organization (WHO), Geneva.

Influenza and Other Respiratory Viruses: Surveillance in the Americas 2019 / 111
Sociodemographic Indicators
Surveillance Systems
Surveillance MapPOPULATION
Population (thousands)2: 182.0Population density (per km2)3: 298.0
Percentage of population < 5 years4: 6.1%Percentage of population ≥ 65 years4: 9.8%
MORTALITYGross mortality rate (per 1,000 population)5: 6.1Mortality rate from all causes at < 5 years of age
(per 1,000 live births)5: NAMortality rate due to communicable diseases
(per 100,000 population)5: 62.4
PUBLIC HEALTHNumber of medical doctors working in the public system
(per 10,000 population)5: 18.6Current health expenditure per capita, PPP*
(current international $)6: 677.0National health expenditure as % of GDP 20165: 2.2
*PPP – Purchasing Power Parity
Saint Lucia
SURVEILLANCE SYSTEM CHARACTERISTICS INFORMATION SYSTEM
Event
WHO case definition
used Surveillance
strategy
Clinical samples collected
from cases
Shipment of samples to NIC (or
laboratory)
Evaluation of surveillance
sites Number of sites Name
Laboratory and epidemiology
integrationOnline report
SARI Yes Sentinel 100% Weekly No 2 PAHOFlu
YesNo
ILI Yes National Varies Weekly No 39 Health Management Information System
INFLUENZA NA Sentinel NA Weekly NA 2 PAHOFlu No
100+95 - 9990 - 9485 - 8980 - 8475 - 7970 - 7465 - 6960 - 6455 - 5950 - 5445 - 4940 - 4435 - 3930 - 3425 - 2920 - 2415 - 1910 - 14
5 - 90.-4
Population (in thousands)
Male
Age Group Population (in thousands)
Female
7 04.2 2.81.4 5.65.6 1.42.8 4.20 7
Saint Lucia, 20191
Pop.2,245 72,117
● SARI Hospitals (N=2)1. Victoria Hospital (Castries)2. St. Jude Hospital (Vieux-Fort)
● ILI Centers (N=39)(Not displayed on map)
▲ Laboratories with IF capacity (N=1)1. Ezra Long National Laboratory (Castries)
– Technical capacity: IF
* The data in the sentinel surveillance map are updated as of January 2019. The population is a projection, as of 2018, by The Central Statistical Office of Saint Lucia.

112 / Influenza and Other Respiratory Viruses: Surveillance in the Americas 2019
Influenza and Respiratory Syncytial Virus
Influenza-Like Illness (ILI)
Severe Acute Respiratory Infection (SARI)
Virologic data Saint Lucia: Distribution of influenza viruses by epidemiological week
Saint Lucia: Cumulative percent positivity for influenza and respiratory syncytial virus
Not applicable
Data from ambulatory cases
Data from severe cases8
Influenza virusesn Influenza A(H1N1)pdm09
n Influenza A(H3N2)
n Influenza A not subtyped
n Flu A Non subtypable
n Influenza B/Victoria
n Influenza B/Yamagata
n Influenza B/Lineage non-determined
n Influenza % positivity
Virus Percentages
n Influenza % positivity
n RSV (+) %
2016 2017 2018 2010 Threshold

Influenza and Other Respiratory Viruses: Surveillance in the Americas 2019 / 113
FluID/FluNet/PISA
FluIDReport: YesReported > 33%: YesReported to WHO in 2018: Yes
FluNetReport: YesReported > 33%: YesReported to WHO in 2018: Yes
PISA Parameters
Transmissibility: In progress Seriousness of disease: In progress Impact: In progress
Human-Animal Interface for Influenza
Intersectoral meetings Yes
Information sharing between sectors Yes
Surveillance of unusual respiratory cases with exposure to animals Yes
Influenza Disease Burden
Estimation of medical burden for influenza No
Estimation of economic burden for influenza No
Publication of influenza burden of disease NA
Pandemic Influenza Preparedness Planning
Plan available Yes
Part of an all-hazards plan Yes
Year of original publication 2009
Year of last revision/update 2009
Simulations No
Drills No
Rapid response teams composed Yes
Risk communication strategy in place Yes
Laboratory CapacityVirologic surveillance YesParticipation in the latest WHO External Quality Assessment Programme (EQAP) No
Samples sent to WHO Collaborating Center No
Number of samples analyzed during 2017–2018 365
Specimens tested for other respiratory viruses (ORV) Yes
Other respiratory viruses identified RSV, adenovirus, parainfluenza 1, 2, 3; rhinovirus
Influenza Vaccine
Composition Northern hemisphere
Month of vaccine administration October
Percentage of older adults vaccinated7 NA
Percentage of children under 5 vaccinated7 NA
Percentage of pregnant women vaccinated7 73%
Percentage of people at higher risk for influenza-related complications vaccinated7 Yes
Percentage of health care workers vaccinated7 Yes
Unless otherwise specified, all data were collected by the PAHO/WHO Influenza Surveillance Team from one or more of the following sources: PAHO online surveys completed by epidemiology or laboratory experts, influenza bulletins published/shared by the countries, country presentations in regional influenza meetings, consultation with country influenza surveillance experts. The document was approved by the relevant national authority. 1. U.S. Census Bureau, Population pyramid, 2019; https://www.census.gov/popclock/world/st2. World Bank. “Population, Total.” World Development Indicators, The World Bank Group, 2019, https://data.worldbank.org/indicator/SP.POP.TOTL. Accessed: 13 Sep. 2019.3. World Bank. “Population Density (people per sq. km of land area).” World Development Indicators, The World Bank Group, 2019, https://data.worldbank.org/indicator/EN.POP.DNST.
Accessed: 13 Sep. 2019.4. United Nations, Department of Economic and Social Affairs, Population Division (2019). World Population Prospects 2019, Online Edition. Rev. 1. Available from: https://population.
un.org/wpp/Download/Standard/Population/. Accessed: 13 Sep. 2019.5. Pan American Health Organization / World Health Organization, Evidence and Intelligence for Action in Health / Health Analysis, Metrics and Evidence. Health Situation in the
Americas: Core Indicators 2018. Washington, D.C.: PAHO; 2018. Available from: https://www.paho.org/data/index.php/en/indicators/visualization.html6. Current health expenditure per capita, PPP (current international $) | Data [Internet]. Data.worldbank.org. 2019 [cited 10 October 2019]. Available from: https://data.worldbank.org/
indicator/SH.XPD.CHEX.PP.CD 7. Pan American Health Organization / World Health Organization. Immunization in the Americas [Internet]. Paho.org. 2019 [cited 10 October 2019]. Available from: https://www.paho.org/
en/documents/immunization-americas-2019-summary8. WHO (2020), WHO Average Curves software, Version 0.3 (2019-10-09), © Copyright World Health Organization (WHO), Geneva.

114 / Influenza and Other Respiratory Viruses: Surveillance in the Americas 2019
POPULATIONPopulation (thousands)2: 110
Population density (per km2)3: 283.0Percentage of population < 5 years4: 7.2%
Percentage of population ≥ 65 years4: 9.6%
MORTALITYGross mortality rate (per 1,000 population)5: 8.1Mortality rate from all causes at < 5 years of age
(per 1,000 live births)5: 17.8Mortality rate due to communicable diseases
(per 100,000 population)5: 110.5
PUBLIC HEALTHNumber of medical doctors working in the public system
(per 10,000 population)5: 9.5Current health expenditure per capita, PPP*
(current international $)6: 409.0National health expenditure as % of GDP 20165: 2.7
*PPP – Purchasing Power Parity
SURVEILLANCE SYSTEM CHARACTERISTICS INFORMATION SYSTEM
Event
WHO case definition
used Surveillance
strategy
Clinical samples
collected from cases
Shipment of samples to NIC (or
laboratory)
Evaluation of surveillance
sites Number of sites Name
Laboratory and epidemiology
integrationOnline report
SARI Yes Sentinel 100% Varies Weekly 2 NA NA
NoILI Yes SentinelQuota
(6 samples/week)
Varies Annually 2Lab Information
System and Health Information System
(HIS)No
INFLUENZA NA Sentinel NA Varies NA 2 NA NA
Sociodemographic Indicators
Surveillance Systems
Surveillance Map
* The data in the sentinel surveillance map are updated as of January 2019. The population is a projection, as of 2018, by the Saint Vincent and the Grenadines Statistical Office.
Pop.5,800 51,400
Saint Vincent and the Grenadines
100+95 - 9990 - 9485 - 8980 - 8475 - 7970 - 7465 - 6960 - 6455 - 5950 - 5445 - 4940 - 4435 - 3930 - 3425 - 2920 - 2415 - 1910 - 14
5 - 90.-4
Population (in thousands)
Male
Age Group Population (in thousands)
Female
4 02.4 1.60.8 3.23.2 0.81.6 2.40 4
Saint Vincent and the Grenadines, 20191
● SARI Hospitals (N=2)1. Milton Kato Memorial Hospital (Kingstown)2. Modern Medical Complex (Georgetown)

Influenza and Other Respiratory Viruses: Surveillance in the Americas 2019 / 115
Influenza and Respiratory Syncytial Virus
Acute Respiratory Infection (ARI)
Severe Acute Respiratory Infection (SARI)
Virologic data Saint Vincent and the Grenadines: Distribution of influenza viruses by epidemiological week
Saint Vincent and the Grenadines: Cumulative percent positivity for influenza and respiratory syncytial virus
Data from ambulatory cases8
Data from severe cases8
Influenza virusesn Influenza A(H1N1)pdm09
n Influenza A(H3N2)
n Influenza A not subtyped
n Flu A Non subtypable
n Influenza B/Victoria
n Influenza B/Yamagata
n Influenza B/Lineage non-determined
n Influenza % positivity
Virus Percentages
n Influenza % positivity
n RSV (+) %
2018 2019 Threshold
2018 2019 Threshold

116 / Influenza and Other Respiratory Viruses: Surveillance in the Americas 2019
Unless otherwise specified, all data were collected by the PAHO/WHO Influenza Surveillance Team from one or more of the following sources: PAHO online surveys completed by epidemiology or laboratory experts, influenza bulletins published/shared by the countries, country presentations in regional influenza meetings, consultation with country influenza surveillance experts. The document was approved by the relevant national authority. 1. U.S. Census Bureau, Population pyramid, 2019; https://www.census.gov/popclock/world/vc2. World Bank. “Population, Total.” World Development Indicators, The World Bank Group, 2019, https://data.worldbank.org/indicator/SP.POP.TOTL. Accessed: 13 Sep. 2019.3. World Bank. “Population Density (people per sq. km of land area).” World Development Indicators, The World Bank Group, 2019, https://data.worldbank.org/indicator/EN.POP.DNST.
Accessed: 13 Sep. 2019.4. United Nations, Department of Economic and Social Affairs, Population Division (2019). World Population Prospects 2019, Online Edition. Rev. 1. Available from: https://population.
un.org/wpp/Download/Standard/Population/. Accessed: 13 Sep. 2019.5. Pan American Health Organization / World Health Organization, Evidence and Intelligence for Action in Health / Health Analysis, Metrics and Evidence. Health Situation in the
Americas: Core Indicators 2018. Washington, D.C.: PAHO; 2018. Available from: https://www.paho.org/data/index.php/en/indicators/visualization.html6. Current health expenditure per capita, PPP (current international $) | Data [Internet]. Data.worldbank.org. 2019 [cited 10 October 2019]. Available from: https://data.worldbank.org/
indicator/SH.XPD.CHEX.PP.CD 7. Pan American Health Organization / World Health Organization. Immunization in the Americas [Internet]. Paho.org. 2019 [cited 10 October 2019]. Available from: https://www.paho.org/
en/documents/immunization-americas-2019-summary8. WHO (2020), WHO Average Curves software, Version 0.3 (2019-10-09), © Copyright World Health Organization (WHO), Geneva.
FluID/FluNet/PISA
FluIDReport: YesReported > 33%: YesReported to WHO in 2018: Yes
FluNetReport: YesReported > 33%: YesReported to WHO in 2018: Yes
PISA Parameters
Transmissibility: In progress Seriousness of disease: In progress Impact: In progress
Human-Animal Interface for Influenza
Intersectoral meetings Yes
Information sharing between sectors Yes
Surveillance of unusual respiratory cases with exposure to animals In progress
Influenza Disease Burden
Estimation of medical burden for influenza No
Estimation of economic burden for influenza No
Publication of influenza burden of disease NA
Pandemic Influenza Preparedness Planning
Plan available Yes
Part of an all-hazards plan No
Year of original publication 2009
Year of last revision/update 2009
Simulations No
Drills Yes
Rapid response teams composed No
Risk communication strategy in place Yes
Laboratory CapacityVirologic surveillance YesParticipation in the latest WHO External Quality Assessment Programme (EQAP) No
Samples sent to WHO Collaborating Center YesNumber of samples analyzed during 2017–2018 31
Specimens tested for other respiratory viruses (ORV) Yes
Other respiratory viruses identified RSV, adenovirus, parainfluenza 1, 2, 3
Influenza Vaccine
Composition Southern hemisphere (2017)
Month of vaccine administration April (2017)
Percentage of older adults vaccinated7 NA
Percentage of children under 5 vaccinated7 NA
Percentage of pregnant women vaccinated7 NA
Percentage of people at higher risk for influenza-related complications vaccinated NA
Percentage of health care workers vaccinated7 NA

Influenza and Other Respiratory Viruses: Surveillance in the Americas 2019 / 117
POPULATIONPopulation (thousands)2: 576
Population density (per km2)3: 4.0Percentage of population < 5 years4: 9.2%
Percentage of population ≥ 65 years4: 6.9%
MORTALITYGross mortality rate (per 1,000 population)5: 8.0Mortality rate from all causes at < 5 years of age
(per 1,000 live births)5: 14.9Mortality rate due to communicable diseases
(per 100,000 population)5: 100.6
PUBLIC HEALTHNumber of medical doctors working in the public system
(per 10,000 population)5: 8.2Current health expenditure per capita, PPP*
(current international $)6: 908.0National health expenditure as % of GDP 20165: 4.2
*PPP – Purchasing Power Parity
SURVEILLANCE SYSTEM CHARACTERISTICS INFORMATION SYSTEM
EventWHO case
definition used Surveillance
strategy
Clinical samples collected
from cases
Shipment of samples to NIC (or
laboratory)
Evaluation of surveillance
sites Number of sites Name
Laboratory and epidemiology
integrationOnline report
SARI Yes SentinelQuota (1-10
samples/ week)
LMSZN (2x/ week), other sites (daily)
Annually 5
PAHOFlu Yes NA
INFLUENZA NA SentinelQuota (1-10
samples/ week)
2/week NA 5
Sociodemographic Indicators
Surveillance Systems
Surveillance Map
* The data in the sentinel surveillance map are updated as of January 2019. The population is a projection, as of 2018, by the Suriname General Bureau of Statistics.
Pop.3,391 240,924
Suriname
100+95 - 9990 - 9485 - 8980 - 8475 - 7970 - 7465 - 6960 - 6455 - 5950 - 5445 - 4940 - 4435 - 3930 - 3425 - 2920 - 2415 - 1910 - 14
5 - 90.-4
Population (in thousands)
Male
Age Group Population (in thousands)
Female
30 018 126 2424 612 180 30
Suriname, 20191
● SARI Hospitals (N=3)1. Drs. Lachmipersad Mungra Medical Center (MMC) (Nickerie)2. s’Lands Hospitaal (LH) (Paramaribo)3. Academisch Ziekenhuis Paramaribo (AZP) (Paramaribo)
● ILI Centers (N=2)1. GROPAVO (Paramaribo)
◆ National Influenza Centers (N=1)1. Bureau voor Openbare Gezondheidszorg (BOG Central
Laboratory) (Paramaribo)– Technical capacity: IF, RT-PCR, viral isolation– Average samples processed/year: 384
▲ Laboratories with PCR capacity (N=2)1. Medisch Wetenschappelijk Instituut (MWI) (Paramaribo)2. Academisch Ziekenhuis (AZP) (Paramaribo)
– Technical capacity: IF, RT-PCR

118 / Influenza and Other Respiratory Viruses: Surveillance in the Americas 2019
Influenza and Respiratory Syncytial Virus
Influenza-Like Illness (ILI)
Severe Acute Respiratory Infection (SARI)
Virologic data Suriname: Distribution of influenza viruses by epidemiological week
Suriname: Cumulative percent positivity for influenza and respiratory syncytial virus
Data from ambulatory cases8
Data from severe cases8
Influenza virusesn Influenza A(H1N1)pdm09
n Influenza A(H3N2)
n Influenza A not subtyped
n Flu A Non subtypable
n Influenza B/Victoria
n Influenza B/Yamagata
n Influenza B/Lineage non-determined
n Influenza % positivity
Virus Percentages
n Influenza % positivity
n RSV (+) %
Average curve Interseasonal 2018/2019 Epidemic Extraordinary High Moderate
Average curve Interseasonal 2018/2019 Epidemic Extraordinary High Moderate

Influenza and Other Respiratory Viruses: Surveillance in the Americas 2019 / 119
Unless otherwise specified, all data were collected by the PAHO/WHO Influenza Surveillance Team from one or more of the following sources: PAHO online surveys completed by epidemiology or laboratory experts, influenza bulletins published/shared by the countries, country presentations in regional influenza meetings, consultation with country influenza surveillance experts. The document was approved by the relevant national authority. 1. U.S. Census Bureau, Population pyramid, 2019; https://www.census.gov/popclock/world/ns2. World Bank. “Population, Total.” World Development Indicators, The World Bank Group, 2019, https://data.worldbank.org/indicator/SP.POP.TOTL. Accessed: 13 Sep. 2019.3. World Bank. “Population Density (people per sq. km of land area).” World Development Indicators, The World Bank Group, 2019, https://data.worldbank.org/indicator/EN.POP.DNST.
Accessed: 13 Sep. 2019.4. United Nations, Department of Economic and Social Affairs, Population Division (2019). World Population Prospects 2019, Online Edition. Rev. 1. Available from: https://population.
un.org/wpp/Download/Standard/Population/. Accessed: 13 Sep. 2019.5. Pan American Health Organization / World Health Organization, Evidence and Intelligence for Action in Health / Health Analysis, Metrics and Evidence. Health Situation in the
Americas: Core Indicators 2018. Washington, D.C.: PAHO; 2018. Available from: https://www.paho.org/data/index.php/en/indicators/visualization.html6. Current health expenditure per capita, PPP (current international $) | Data [Internet]. Data.worldbank.org. 2019 [cited 10 October 2019]. Available from: https://data.worldbank.org/
indicator/SH.XPD.CHEX.PP.CD 7. Pan American Health Organization / World Health Organization. Immunization in the Americas [Internet]. Paho.org. 2019 [cited 10 October 2019]. Available from: https://www.paho.org/
en/documents/immunization-americas-2019-summary8. WHO (2020), WHO Average Curves software, Version 0.3 (2019-10-09), © Copyright World Health Organization (WHO), Geneva.
FluID/FluNet/PISA
FluIDReport: YesReported > 33%: YesReported to WHO in 2018: Yes
FluNetReport: YesReported > 33%: YesReported to WHO in 2018: Yes
PISA Parameters
Transmissibility: Yes Seriousness of disease: YesImpact: Yes
Human-Animal Interface for Influenza
Intersectoral meetings Yes
Information sharing between sectors Yes
Surveillance of unusual respiratory cases with exposure to animals NA
Influenza Disease Burden
Estimation of medical burden for influenza No
Estimation of economic burden for influenza NA
Publication of influenza burden of disease NA
Pandemic Influenza Preparedness Planning
Plan available Yes (2017)
Part of an all-hazards plan No (2017)
Year of original publication 2009
Year of last revision/update 2009
Simulations NA
Drills NA
Rapid response teams composed NA
Risk communication strategy in place NA
Laboratory CapacityVirologic surveillance YesParticipation in the latest WHO External Quality Assessment Programme (EQAP) Yes
Samples sent to WHO Collaborating Center Yes
Number of samples analyzed during 2017–2018 384
Specimens tested for other respiratory viruses (ORV) Yes
Other respiratory viruses identified
Parainfluenza 1,2,3, RSV, adenovirus, metapneumovirus,
rhinovirus, coronavirus, bocavirus
Influenza Vaccine
Composition Northern hemisphere (2017)
Month of vaccine administration November (2017)
Percentage of older adults vaccinated7 NA
Percentage of children under 5 vaccinated7 NA
Percentage of pregnant women vaccinated7 Yes
Percentage of people at higher risk for influenza-related complications vaccinated7 Yes
Percentage of health care workers vaccinated7 Yes

120 / Influenza and Other Respiratory Viruses: Surveillance in the Americas 2019
POPULATIONPopulation (thousands)2: 1,390
Population density (per km2)3: 271.0Percentage of population < 5 years4: 6.6%
Percentage of population ≥ 65 years4: 10.7%
MORTALITYGross mortality rate (per 1,000 population)5: 7.9Mortality rate from all causes at < 5 years of age
(per 1,000 live births)5: 13.3Mortality rate due to communicable diseases
(per 100,000 population)5: 77.1
PUBLIC HEALTHNumber of medical doctors working in the public system
(per 10,000 population)5: 12.4Current health expenditure per capita, PPP*
(current international $)6: 2,133.3National health expenditure as % of GDP 20165: 3.4
*PPP – Purchasing Power Parity
Trinidad and TobagoSo
ciode
mog
raph
ic In
dica
tors
Surv
eillan
ce S
yste
ms
Surv
eillan
ce M
ap
* The data in the sentinel surveillance map are updated as of January 2019. The population is a projection, as of 2018, by the Trinidad and Tobago Central Statistics Office.
Pop.20,161 212,825
SURVEILLANCE SYSTEM CHARACTERISTICS INFORMATION SYSTEM
EventWHO case
definition used Surveillance
strategy
Clinical samples collected
from cases
Shipment of samples to NIC (or
laboratory)
Evaluation of surveillance
sites Number of sites Name
Laboratory and epidemiology
integrationOnline report
SARI Yes Sentinel Varies Varies No 3
NA
NA
NoILI Yes National Varies Varies No NA No
ARINo; ICD-10
codes (J00-J06) and (J20-J22)
National Quota No NA NANA
INFLUENZA NA National Varies Varies NA NA
● SARI Hospitals (N=3)1. Eric Williams Medical Sciences Complex (Mt. Hope, Trinidad)2. San Fernando General Hospital (San Fernando)3. Scarborough General Hospital (Signal Hill, Tobago)
◆ National Influenza Centers (N=1)1. The Caribbean Public Health Agency (CARPHA) Laboratory (Port of Spain)
– Technical capacity: IF, RT-PCR, viral isolation– Average samples/year: 37
100+95 - 9990 - 9485 - 8980 - 8475 - 7970 - 7465 - 6960 - 6455 - 5950 - 5445 - 4940 - 4435 - 3930 - 3425 - 2920 - 2415 - 1910 - 14
5 - 90.-4
Population (in thousands)
Male
Age Group Population (in thousands)
Female
30 036 2412 4848 1224 360 60
Trinidad and Tobago, 20191

Influenza and Other Respiratory Viruses: Surveillance in the Americas 2019 / 121
Influenza and Respiratory Syncytial Virus
Severe Acute Respiratory Infection (SARI)
Virologic data Trinidad and Tobago: Distribution of influenza viruses by epidemiological week
Trinidad and Tobago: Cumulative percent positivity for influenza and respiratory syncytial virus
Influenza virusesn Influenza A(H1N1)pdm09
n Influenza A(H3N2)
n Influenza A not subtyped
n Flu A Non subtypable
n Influenza B/Victoria
n Influenza B/Yamagata
n Influenza B/Lineage non-determined
n Influenza % positivity
Virus Percentages
n Influenza % positivity
n RSV (+) %
2016 2017 2018 2010 Threshold
Data from severe cases8
Influenza-Like Illness (ILI)
Not applicable
Data from ambulatory cases
Not applicable

122 / Influenza and Other Respiratory Viruses: Surveillance in the Americas 2019
FluID/FluNet/PISA
FluIDReport: YesReported > 33%: YesReported to WHO in 2018: Yes
FluNetReport: YesReported > 33%: YesReported to WHO in 2018: Yes
PISA Parameters
Transmissibility: In progress Seriousness of disease: In progress Impact: In progress
Human-Animal Interface for InfluenzaIntersectoral meetings YesInformation sharing between sectors Yes
Surveillance of unusual respiratory cases with exposure to animals In progress
Influenza Disease Burden
Estimation of medical burden for influenza No
Estimation of economic burden for influenza NA
Publication of influenza burden of disease NA
Pandemic Influenza Preparedness Planning
Plan available Yes
Part of an all-hazards plan Yes
Year of original publication 2009
Year of last revision/update NA
Simulations Yes
Drills Yes
Rapid response teams composed Yes
Risk communication strategy in place Yes
Laboratory Capacity
Virologic surveillance Yes
Participation in the latest WHO External Quality Assessment Programme (EQAP) No
Samples sent to WHO Collaborating Center Yes
Number of samples analyzed during 2017–2018 303
Specimens tested for other respiratory viruses (ORV) Yes
Other respiratory viruses identified RSV, adenovirus, parainfluenza 1, 2, 3; metapneumovirus
Influenza Vaccine
Composition Northern hemisphere
Month of vaccine administration October
Percentage of older adults vaccinated7 NA
Percentage of children under 5 vaccinated7 NA
Percentage of pregnant women vaccinated7 NA
Percentage of people at higher risk for influenza-related complications vaccinated NA
Percentage of health care workers vaccinated7 17%
Unless otherwise specified, all data were collected by the PAHO/WHO Influenza Surveillance Team from one or more of the following sources: PAHO online surveys completed by epidemiology or laboratory experts, influenza bulletins published/shared by the countries, country presentations in regional influenza meetings, consultation with country influenza surveillance experts. The document was approved by the relevant national authority. 1. U.S. Census Bureau, Population pyramid, 2019; https://www.census.gov/popclock/world/td2. World Bank. “Population, Total.” World Development Indicators, The World Bank Group, 2019, https://data.worldbank.org/indicator/SP.POP.TOTL. Accessed: 13 Sep. 2019.3. World Bank. “Population Density (people per sq. km of land area).” World Development Indicators, The World Bank Group, 2019, https://data.worldbank.org/indicator/EN.POP.DNST.
Accessed: 13 Sep. 2019.4. United Nations, Department of Economic and Social Affairs, Population Division (2019). World Population Prospects 2019, Online Edition. Rev. 1. Available from: https://population.
un.org/wpp/Download/Standard/Population/. Accessed: 13 Sep. 2019.5. Pan American Health Organization / World Health Organization, Evidence and Intelligence for Action in Health / Health Analysis, Metrics and Evidence. Health Situation in the
Americas: Core Indicators 2018. Washington, D.C.: PAHO; 2018. Available from: https://www.paho.org/data/index.php/en/indicators/visualization.html6. Current health expenditure per capita, PPP (current international $) | Data [Internet]. Data.worldbank.org. 2019 [cited 10 October 2019]. Available from: https://data.worldbank.org/
indicator/SH.XPD.CHEX.PP.CD 7. Pan American Health Organization / World Health Organization. Immunization in the Americas [Internet]. Paho.org. 2019 [cited 10 October 2019]. Available from: https://www.paho.org/
en/documents/immunization-americas-2019-summary8. WHO (2020), WHO Average Curves software, Version 0.3 (2019-10-09), © Copyright World Health Organization (WHO), Geneva.

POPULATIONPopulation (thousands)2: 327,167Population density (per km2)3: 36.0
Percentage of population < 5 years4: 6.0%Percentage of population ≥ 65 years4: 15.8%
MORTALITYGross mortality rate (per 1,000 population)5: 4.9Mortality rate from all causes at < 5 years of age
(per 1,000 live births)5: 6.8Mortality rate due to communicable diseases
(per 100,000 population)5: 28.3
PUBLIC HEALTHNumber of medical doctors working in the public system
(per 10,000 population)5: 26.1Current health expenditure per capita, PPP*
(current international $)6: 9,780.0National health expenditure as % of GDP 20165: 14.0
*PPP – Purchasing Power Parity
United States of America
SURVEILLANCE SYSTEM CHARACTERISTICS INFORMATION SYSTEM
EventWHO case
definition used Surveillance
strategy
Clinical samples collected
from cases
Shipment of samples to NIC (or
laboratory)
Evaluation of surveillance
sites Number of sites Name
Laboratory and epidemiology
integrationOnline report
SARI Yes Sentinel 100% Once a week Monthly > 240 NA YesOnline
ILI Yes Sentinel Random sampling Once a week Monthly 2,900 NA NA
Sociodemographic Indicators
Surveillance Systems
Surveillance Map
* The data in the sentinel surveillance map are updated as of January 2019. The population is a projection, as of 2018, by the United States Census Bureau.
● SARI Hospitals (N > 240)
California (3 counties), Connecticut (3 counties), Georgia (8 counties), Maryland (6 counties), Michigan (4 counties), Minnesota (7 counties), New Mexico (7 counties), New York (15 counties), Oregon (3 counties), Tennessee (8 counties), Ohio (10 counties), Utah (6 counties)
● ILI Centers (N=2,900)
(Not displayed on map)
Includes health centers in all 50 states, Puerto Rico, and the District of Columbia.
◆ National Influenza Centers (N=4)1. Centers for Disease Control and Prevention (Atlanta, GA)2. School of Public Health (Ann Arbor, MI)3. Viral and Rickettsial Disease Laboratory (Richmond, CA)4. Virology Diagnostic Services, Laboratory of Zoonotic Diseases
and Virology Proficiency Testing (Slingerlands, NY)– Technical capacity: IF, RT-PCR, viral isolation
Pop.563,626 37,253,956
Influenza and Other Respiratory Viruses: Surveillance in the Americas 2019 / 123
100+95 - 9990 - 9485 - 8980 - 8475 - 7970 - 7465 - 6960 - 6455 - 5950 - 5445 - 4940 - 4435 - 3930 - 3425 - 2920 - 2415 - 1910 - 14
5 - 90.-4
Population (in millions)
Male
Age Group Population (in millions)
Female
15 09 63 1212 36 90 15
United States of America, 20191

124 / Influenza and Other Respiratory Viruses: Surveillance in the Americas 2019
Influenza and Respiratory Syncytial Virus
Virologic Data
Influenza-Like Illness (ILI)
Influenza Hospitalization
Data from ambulatory cases8
Data from severe cases8
United States of America: Cumulative percent positivity for influenza and respiratory syncytial virus
United States of America: Distribution of influenza viruses by epidemiological week
Influenza virusesn Influenza A(H1N1)pdm09
n Influenza A(H3N2)
n Influenza A not subtyped
n Flu A Non subtypable
n Influenza B/Victoria
n Influenza B/Yamagata
n Influenza B/Lineage non-determined
n Influenza % positivity
Virus Percentages
n Influenza % positivity
n RSV (+) %
Average curve 2018/2019 Epidemic Extraordinary High Moderate
Average curve 2018/2019 Epidemic Extraordinary High Moderate

Influenza and Other Respiratory Viruses: Surveillance in the Americas 2019 / 125
FluID/FluNet/PISA
FluIDReport: YesReported > 33%: YesReported to WHO in 2018: Yes
FluNetReport: YesReported > 33%: YesReported to WHO in 2018: Yes
PISA Parameters
Transmissibility: YesSeriousness of disease: No Impact: Yes
Human-Animal Interface for Influenza
Intersectoral meetings In progress
Information sharing between sectors In progress
Surveillance of unusual respiratory cases with exposure to animals In progress
Influenza Disease Burden
Estimation of medical burden for influenza Yes
Estimation of economic burden for influenza Yes
Publication of influenza burden of disease Online
Pandemic Influenza Preparedness Planning
Plan available Yes (2017)
Part of an all-hazards plan Yes (2017)
Year of original publication 1997
Year of last revision/update 2017
Simulations Yes, 2019
Drills Yes, 2019
Rapid response teams composed NA
Risk communication strategy in place NA
Laboratory CapacityVirologic surveillance YesParticipation in the latest WHO External Quality Assessment Programme (EQAP) Yes
Samples sent to WHO Collaborating Center Yes
Number of samples analyzed during 2017–2018
NREVSS Clinical laboratories: 1,413,596
Public Health Laboratories: 106,671
Specimens tested for other respiratory viruses (ORV) Yes
Other respiratory viruses identified
RSV, adenovirus, coronavirus, parainfluenza 1, 2, 3;
metapneumovirus, rhinovirus/enterovirus
Influenza VaccineComposition Northern hemisphereMonth of vaccine administration August-January
Percentage of older adults vaccinated7 65% (≥ 65 years)
Percentage of children under 5 vaccinated758% (age of vaccinated
children is 6 months to 17 years)
Percentage of pregnant women vaccinated7 YesPercentage of people at higher risk for influenza-related complications vaccinated Yes
Percentage of health care workers vaccinated7 Yes
Unless otherwise specified, all data were collected by the PAHO/WHO Influenza Surveillance Team from one or more of the following sources: PAHO online surveys completed by epidemiology or laboratory experts, influenza bulletins published/shared by the countries, country presentations in regional influenza meetings, consultation with country influenza surveillance experts. The document was approved by the relevant national authority. 1. U.S. Census Bureau, Population pyramid, 2019; https://www.census.gov/popclock2. World Bank. “Population, Total.” World Development Indicators, The World Bank Group, 2019, https://data.worldbank.org/indicator/SP.POP.TOTL. Accessed: 13 Sep. 2019.3. World Bank. “Population Density (people per sq. km of land area).” World Development Indicators, The World Bank Group, 2019, https://data.worldbank.org/indicator/EN.POP.DNST.
Accessed: 13 Sep. 2019.4. United Nations, Department of Economic and Social Affairs, Population Division (2019). World Population Prospects 2019, Online Edition. Rev. 1. Available from: https://population.
un.org/wpp/Download/Standard/Population/. Accessed: 13 Sep. 2019.5. Pan American Health Organization / World Health Organization, Evidence and Intelligence for Action in Health / Health Analysis, Metrics and Evidence. Health Situation in the
Americas: Core Indicators 2018. Washington, D.C.: PAHO; 2018. Available from: https://www.paho.org/data/index.php/en/indicators/visualization.html6. Current health expenditure per capita, PPP (current international $) | Data [Internet]. Data.worldbank.org. 2019 [cited 10 October 2019]. Available from: https://data.worldbank.org/
indicator/SH.XPD.CHEX.PP.CD 7. Pan American Health Organization / World Health Organization. Immunization in the Americas [Internet]. Paho.org. 2019 [cited 10 October 2019]. Available from: https://www.paho.org/
en/documents/immunization-americas-2019-summary8. WHO (2020), WHO Average Curves software, Version 0.3 (2019-10-09), © Copyright World Health Organization (WHO), Geneva.

126 / Influenza and Other Respiratory Viruses: Surveillance in the Americas 2019
POPULATIONPopulation (thousands)2: 3,449
Population density (per km2)3: 20.0Percentage of population < 5 years4: 6.9%
Percentage of population ≥ 65 years4: 14.8%
MORTALITYGross mortality rate (per 1,000 population)5: 5.4Mortality rate from all causes at < 5 years of age
(per 1,000 live births)5: 8.4Mortality rate due to communicable diseases
(per 100,000 population)5: 42.6
PUBLIC HEALTHNumber of medical doctors working in the public system
(per 10,000 population)5: 49.4Current health expenditure per capita, PPP*
(current international $)6: 1,959National health expenditure as % of GDP 20165: 6.5
*PPP – Purchasing Power Parity
SURVEILLANCE SYSTEM CHARACTERISTICS INFORMATION SYSTEM
EventWHO case
definition used Surveillance
strategy
Clinical samples collected
from cases
Shipment of samples to NIC (or
laboratory)
Evaluation of surveillance
sites Number of sites Name
Laboratory and epidemiology
integrationOnline report
SARI Yes Sentinel 100% 5 days/week Annually 6
NA
Yes Online
ILI Yes SentinelQuota
(30 samples/week)
6 days/week No 6NA
Yes
INFLUENZA NA Sentinel 100% NA NA 6 Yes
Sociodemographic Indicators
Surveillance Systems
Surveillance Map
Uruguay
100+95 - 9990 - 9485 - 8980 - 8475 - 7970 - 7465 - 6960 - 6455 - 5950 - 5445 - 4940 - 4435 - 3930 - 3425 - 2920 - 2415 - 1910 - 14
5 - 90.-4
Population (in thousands)
Male
Age Group Population (in thousands)
Female
140 084 5628 112112 2856 840 140
Uruguay, 20191
● SARI Hospitals (N=6)1. SEMM Mautone (Maldonado)2. Hospital Policial (Montevideo)3. Hospital Británico (Montevideo)4. Hospital Pediátrico (Montevideo)5. CAMS Mercedes (Soriano)6. Hospital de las Piedras (Canelones)
● ILI Centers (N=6)1. SEMM Mautone (Maldonado)2. Hospital Policial (Montevideo)3. CAMS Mercedes (Soriano)4. Hospital de las Piedras (Canelones)5. Hospital Británico (Montevideo)6. Hospital Pediátrico CHPR (Montevideo)
◆ National Influenza Centers (N=1)1. Departamento de Laboratorio Salud Pública
– Technical capacity: IF, RT-PCR, viral isolation– Average samples processed/year: 2,084
Pop.26,500 1,381,946
* The data in the sentinel surveillance map are updated as of January 2019. The population is a projection, as of 2018, by the Uruguay Institute of Statistics.

Influenza and Other Respiratory Viruses: Surveillance in the Americas 2019 / 127
Influenza and Respiratory Syncytial Virus
Influenza-Like Illness (ILI)
Severe Acute Respiratory Infection (SARI)
Virologic data Uruguay: Distribution of influenza viruses by epidemiological week
Uruguay: Cumulative percent positivity for influenza and respiratory syncytial virus
Data from ambulatory cases8
Data from severe cases8
Influenza virusesn Influenza A(H1N1)pdm09
n Influenza A(H3N2)
n Influenza A not subtyped
n Flu A Non subtypable
n Influenza B/Victoria
n Influenza B/Yamagata
n Influenza B/Lineage non-determined
n Influenza % positivity
Virus Percentages
n Influenza % positivity
n RSV (+) %
2017 2018 2019 Threshold
2017 2018 2019 Threshold
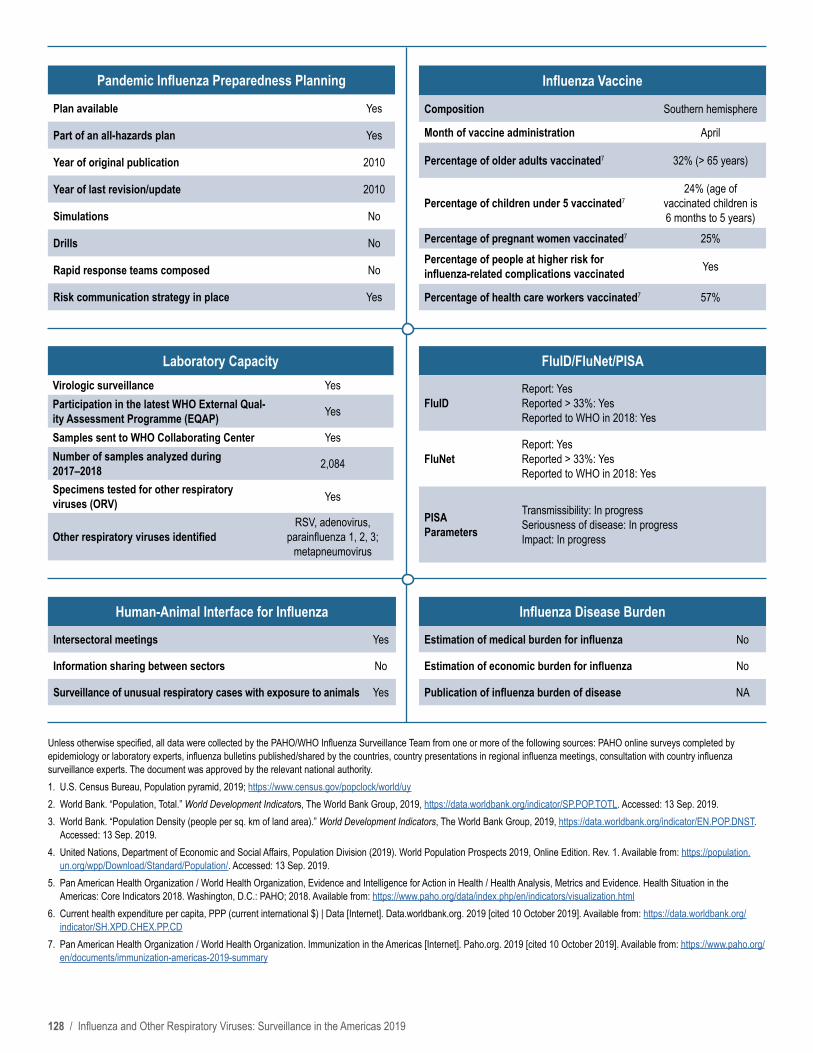
128 / Influenza and Other Respiratory Viruses: Surveillance in the Americas 2019
Unless otherwise specified, all data were collected by the PAHO/WHO Influenza Surveillance Team from one or more of the following sources: PAHO online surveys completed by epidemiology or laboratory experts, influenza bulletins published/shared by the countries, country presentations in regional influenza meetings, consultation with country influenza surveillance experts. The document was approved by the relevant national authority. 1. U.S. Census Bureau, Population pyramid, 2019; https://www.census.gov/popclock/world/uy2. World Bank. “Population, Total.” World Development Indicators, The World Bank Group, 2019, https://data.worldbank.org/indicator/SP.POP.TOTL. Accessed: 13 Sep. 2019.3. World Bank. “Population Density (people per sq. km of land area).” World Development Indicators, The World Bank Group, 2019, https://data.worldbank.org/indicator/EN.POP.DNST.
Accessed: 13 Sep. 2019.4. United Nations, Department of Economic and Social Affairs, Population Division (2019). World Population Prospects 2019, Online Edition. Rev. 1. Available from: https://population.
un.org/wpp/Download/Standard/Population/. Accessed: 13 Sep. 2019.5. Pan American Health Organization / World Health Organization, Evidence and Intelligence for Action in Health / Health Analysis, Metrics and Evidence. Health Situation in the
Americas: Core Indicators 2018. Washington, D.C.: PAHO; 2018. Available from: https://www.paho.org/data/index.php/en/indicators/visualization.html6. Current health expenditure per capita, PPP (current international $) | Data [Internet]. Data.worldbank.org. 2019 [cited 10 October 2019]. Available from: https://data.worldbank.org/
indicator/SH.XPD.CHEX.PP.CD 7. Pan American Health Organization / World Health Organization. Immunization in the Americas [Internet]. Paho.org. 2019 [cited 10 October 2019]. Available from: https://www.paho.org/
en/documents/immunization-americas-2019-summary
FluID/FluNet/PISA
FluIDReport: YesReported > 33%: YesReported to WHO in 2018: Yes
FluNetReport: YesReported > 33%: YesReported to WHO in 2018: Yes
PISA Parameters
Transmissibility: In progress Seriousness of disease: In progress Impact: In progress
Human-Animal Interface for Influenza
Intersectoral meetings Yes
Information sharing between sectors No
Surveillance of unusual respiratory cases with exposure to animals Yes
Influenza Disease Burden
Estimation of medical burden for influenza No
Estimation of economic burden for influenza No
Publication of influenza burden of disease NA
Pandemic Influenza Preparedness Planning
Plan available Yes
Part of an all-hazards plan Yes
Year of original publication 2010
Year of last revision/update 2010
Simulations No
Drills No
Rapid response teams composed No
Risk communication strategy in place Yes
Laboratory CapacityVirologic surveillance YesParticipation in the latest WHO External Qual-ity Assessment Programme (EQAP) Yes
Samples sent to WHO Collaborating Center YesNumber of samples analyzed during 2017–2018 2,084
Specimens tested for other respiratory viruses (ORV) Yes
Other respiratory viruses identifiedRSV, adenovirus,
parainfluenza 1, 2, 3; metapneumovirus
Influenza Vaccine
Composition Southern hemisphere
Month of vaccine administration April
Percentage of older adults vaccinated7 32% (> 65 years)
Percentage of children under 5 vaccinated724% (age of
vaccinated children is 6 months to 5 years)
Percentage of pregnant women vaccinated7 25%Percentage of people at higher risk for influenza-related complications vaccinated Yes
Percentage of health care workers vaccinated7 57%

Sociodemographic Indicators
Surveillance Systems
Surveillance Map
Influenza and Other Respiratory Viruses: Surveillance in the Americas 2019 / 129
POPULATIONPopulation (thousands)2: 28,870
Population density (per km2)3: 33.0Percentage of population < 5 years4: 8.8%
Percentage of population ≥ 65 years4: 7.3%
MORTALITYGross mortality rate (per 1,000 population)5: 6.5Mortality rate from all causes at < 5 years of age
(per 1,000 live births)5: 17.5Mortality rate due to communicable diseases
(per 100,000 population)5: 69.7
PUBLIC HEALTHNumber of medical doctors working in the public system
(per 10,000 population)5: 17.3Current health expenditure per capita, PPP*
(current international $)6: 940.0National health expenditure as % of GDP 20165: 0.8
*PPP – Purchasing Power Parity
SURVEILLANCE SYSTEM CHARACTERISTICS INFORMATION SYSTEM
EventWHO case
definition used Surveillance
strategy
Clinical samples collected
from cases
Shipment of samples to NIC (or
laboratory)
Evaluation of surveillance
sites Number of sites Name
Laboratory and epidemiology
integrationOnline report
SARI Yes NA NA NA NA NA NA NA NA
PNEUMONIANo; ICD-10
codes (J09-J18, J20-J22X)
National NA NA NA NA NA NA NA
* The data in the sentinel surveillance map are updated as of January 2019. The population is a projection, as of 2018, by the Venezuelan National Institute of Statistics.
Pop.192,835 4,255,848
Venezuela (Bolivarian Republic of)
100+95 - 9990 - 9485 - 8980 - 8475 - 7970 - 7465 - 6960 - 6455 - 5950 - 5445 - 4940 - 4435 - 3930 - 3425 - 2920 - 2415 - 1910 - 14
5 - 90.-4
Population (in millions)
Male
Age Group Population (in millions)
Female
2 01.2 0.80.4 1.61.6 0.40.8 1.20 2
Venezuela (Bolivarian Republic of), 20191
◆ National Influenza Centers (N=1)1. Virología del Instituto Nacional de Higiene Rafael Rangel (Caracas)

130 / Influenza and Other Respiratory Viruses: Surveillance in the Americas 2019
Influenza and Respiratory Syncytial Virus
Influenza-Like Illness (ILI)
Severe Acute Respiratory Infection (SARI)
Virologic data Venezuela (Bolivarian Republic of): Distribution of influenza viruses by epidemiological week
Venezuela (Bolivarian Republic of): Cumulative percent positivity for influenza and respiratory syncytial virus
Not applicable
Not applicable
Data from ambulatory cases
Data from severe cases
Influenza virusesn Influenza A(H1N1)pdm09
n Influenza A(H3N2)
n Influenza A not subtyped
n Flu A Non subtypable
n Influenza B/Victoria
n Influenza B/Yamagata
n Influenza B/Lineage non-determined
n Influenza % positivity
Virus Percentages
n Influenza % positivity
n RSV (+) %

Influenza and Other Respiratory Viruses: Surveillance in the Americas 2019 / 131
FluID/FluNet/PISA
FluIDReport: In progressReported > 33%: NAReported to WHO in 2018: NA
FluNetReport: YesReported > 33%: YesReported to WHO in 2018: Yes
PISA Parameters
Transmissibility: In progress Seriousness of disease: In progress Impact: In progress
Human-Animal Interface for Influenza
Intersectoral meetings NA
Information sharing between sectors NA
Surveillance of unusual respiratory cases with exposure to animals NA
Influenza Disease Burden
Estimation of medical burden for influenza NA
Estimation of economic burden for influenza NA
Publication of influenza burden of disease NA
Pandemic Influenza Preparedness Planning
Plan available Yes (2017)
Part of an all-hazards plan No (2017)
Year of original publication NA
Year of last revision/update NA
Simulations NA
Drills NA
Rapid response teams composed NA
Risk communication strategy in place NA
Laboratory Capacity
Virologic surveillance NA
Participation in the latest WHO External Quality Assessment Programme (EQAP) NA
Samples sent to WHO Collaborating Center NA
Number of samples analyzed during 2017–2018 NA
Specimens tested for other respiratory viruses (ORV) NA
Other respiratory viruses identified NA
Influenza Vaccine
Composition Southern hemisphere (2017)
Month of vaccine administration April (2017)
Percentage of older adults vaccinated7 0%
Percentage of children under 5 vaccinated7 0%
Percentage of pregnant women vaccinated7 0%
Percentage of people at higher risk for influenza-related complications vaccinated 0%
Percentage of health care workers vaccinated7 0%
Unless otherwise specified, all data were collected by the PAHO/WHO Influenza Surveillance Team from one or more of the following sources: PAHO online surveys completed by epidemiology or laboratory experts, influenza bulletins published/shared by the countries, country presentations in regional influenza meetings, consultation with country influenza surveillance experts. The document was approved by the relevant national authority. 1. U.S. Census Bureau, Population pyramid, 2019; https://www.census.gov/popclock/world/ve2. World Bank. “Population, Total.” World Development Indicators, The World Bank Group, 2019, https://data.worldbank.org/indicator/SP.POP.TOTL. Accessed: 13 Sep. 2019.3. World Bank. “Population Density (people per sq. km of land area).” World Development Indicators, The World Bank Group, 2019, https://data.worldbank.org/indicator/EN.POP.DNST.
Accessed: 13 Sep. 2019.4. United Nations, Department of Economic and Social Affairs, Population Division (2019). World Population Prospects 2019, Online Edition. Rev. 1. Available from: https://population.
un.org/wpp/Download/Standard/Population/. Accessed: 13 Sep. 2019.5. Pan American Health Organization / World Health Organization, Evidence and Intelligence for Action in Health / Health Analysis, Metrics and Evidence. Health Situation in the
Americas: Core Indicators 2018. Washington, D.C.: PAHO; 2018. Available from: https://www.paho.org/data/index.php/en/indicators/visualization.html6. Current health expenditure per capita, PPP (current international $) | Data [Internet]. Data.worldbank.org. 2019 [cited 10 October 2019]. Available from: https://data.worldbank.org/
indicator/SH.XPD.CHEX.PP.CD 7. Pan American Health Organization / World Health Organization. Immunization in the Americas [Internet]. Paho.org. 2019 [cited 10 October 2019]. Available from: https://www.paho.org/
en/documents/immunization-americas-2019-summary


This third edition of the landscape analysis of Influenza and Other Respiratory Viruses: Surveillance in the Americas provides regional and country-specific data that are used and valued by forums in the Region and beyond.
Data of regional trends include surveillance of severe acute respiratory infection (SARI), influenza-like illness (ILI), influenza vaccine, FluNet/FluID reporting, and participation in WHO’s External Quality Assessment Project (EQAP). The second half of the report pres-ents country-specific data on sociodemographic indicators, surveillance systems, virologic analysis, laboratory capacity, and trends in human-animal interface.
To strengthen the Region’s surveillance abilities, it is important to understand the current capacity of each country and the issues in that country that need attention. Similarly, to assess progress over time, it is necessary to document regional trends. Because several indicators had changed since the last analysis was published, PAHO conducted an extensive survey to collect and compile additional, varied, and detailed data. This report illustrates the complexities in surveillance of influenza and other respiratory viruses and highlights differences in the countries’ preparedness capacities through charts, infographics, tables, and brief narratives.
For more information about influenza surveillance in the Americas, please visit the PAHO influenza page atwww.paho.org/influenza, or the Severe Acute Respiratory Infection network at www.SARInet.org.
p
www.paho.org