Embed Size (px)
Citation preview

1
INFLUENTAL FACTORS ON BRAND CHOICE AND CONSUMPTION BEHAVIORS: AN EXPLORATORY STUDY ON COLLEGE STUDENTS AND BEER
By
DAVE RITTER
A THESIS PRESENTED TO THE GRADUATE SCHOOL OF THE UNIVERSITY OF FLORIDA IN PARTIAL FULLFILLMENT
OF THE REQUIREMENTS FOR THE DEGREE OF MASTER OF ADVERTISING
UNIVERSITY OF FLORIDA
2008

2
© 2008 Dave Ritter
3
To my family, friends, educators, and colleagues, cheers! Without your love, support, and guidance none of this would be possible.

4
ACKNOWLEDGEMENTS
I would like to thank my entire family for supporting my education and research at the
University of Florida. I would like to thank Lakeland College, the University of Illinois, and the
University of Florida for providing me with the skills and education possible to complete this
document. I also would like to express my gratitude to all of my committee members for their
help, guidance, and comments throughout this process. In addition, I would like to give a special
thank-you to my thesis chair, Hyojin Kim. Finally, I would like to thank God for giving me faith,
ability, and opportunity to persevere.

5
TABLE OF CONTENTS page
ACKNOWLEDGEMENTS.............................................................................................................4
LIST OF TABLES...........................................................................................................................7
LIST OF FIGURES .........................................................................................................................8
ABSTRACT.....................................................................................................................................9
CHAPTER
1 INTRODUCTION ..................................................................................................................10
2 LITERATURE REVIEW .......................................................................................................13
Brand Choice ..........................................................................................................................13 Desired Brand Benefits...........................................................................................................19
Performance/Quality........................................................................................................20 Price/Value for Money ....................................................................................................22 Emotions..........................................................................................................................23 Normative/Personal (Social) ...........................................................................................23 Environment (Stewardship).............................................................................................24 Health ..............................................................................................................................25
Situational Factors ..................................................................................................................27 Consumer Factors ...................................................................................................................29
Exploratory Shopping Behaviors ....................................................................................30 Interpersonal Influence....................................................................................................30 Consumption Behaviors ..................................................................................................31 Product Category Involvement........................................................................................32 Demographics..................................................................................................................32
Theory of Reasoned Action ....................................................................................................33 Research Questions.................................................................................................................36
3 METHOD ...............................................................................................................................37
Pretest .....................................................................................................................................37 Subjects............................................................................................................................37 Design and Procedure......................................................................................................38
Measures .................................................................................................................................38 Brand Choice ...................................................................................................................38 Situational Variation........................................................................................................39 Desired Brand Benefits....................................................................................................39 Consumption Behavior....................................................................................................39 Demographics..................................................................................................................40
Main Study..............................................................................................................................40

6
Subjects............................................................................................................................40 Design and Procedure......................................................................................................42
Measures .................................................................................................................................43 Brand Choice ...................................................................................................................43 Situational Variation........................................................................................................43 Desired Brand Benefits....................................................................................................46 Exploratory Shopping Behaviors ....................................................................................46 Interpersonal Influence....................................................................................................47 Consumption Behavior....................................................................................................47 Product Category Involvement........................................................................................49 Demographics..................................................................................................................50
4 RESULTS...............................................................................................................................51
Brand Choice among Situational Variation............................................................................51 Consumption Behavior among Situation Variation................................................................58 Variables Affecting Beer Brand Choice .................................................................................67 Variables Affecting Beer Consumption..................................................................................79
5 DISCUSSION.........................................................................................................................90
6 LIMITATIONS.......................................................................................................................96
APPENDIX
A PRETEST ...............................................................................................................................99
B MAIN STUDY .....................................................................................................................109
REFERENCES ............................................................................................................................120
BIOGRAPHICAL SKETCH .......................................................................................................130

7
LIST OF TABLES
Table page 2-1 Brand Choice Studies.........................................................................................................16
3-1 Beer Brand Choice.............................................................................................................41
3-2 Demographic Frequency Distribution................................................................................42
3-3 Situation Frequency Distribution.......................................................................................45
3-4 Average Beers Consumed and Average Occasions Drinking Beer ...................................48
3-5 Consumption Behavior Frequency ....................................................................................49
4-1 Situational Groups and Brand Choice................................................................................53
4-2 Situational Groups and Consumption Behavior ................................................................61
4-3 Multiple Discriminant Analysis: Beer Brand Choice ........................................................73
4-4 Structure Matrix for Beer Brand Choice............................................................................75
4-5 Group Classification for Beer Brand Choice: Multiple Discriminant Analysis ................75
4-6 Mean and Standard Deviation based on Brand Choice .....................................................76
4-7 Stepwise Discriminant Analysis: Beer Brand Choice .......................................................77
4-8 Group Classification: Beer Brand Choice Stepwise Discriminant Analysis .....................79
4-9 Multiple Discriminant Analysis: Beer Consumption Behavior .........................................84
4-10 Structure Matrix for Beer Consumption Behavior.............................................................86
4-11 Group Classification: Beer Consumption Behavior Multiple Discriminant Analysis.......86
4-12 Mean and Standard Deviation: Beer Consumption Behavior............................................87
4-13 Stepwise Discriminant Analysis: Beer Consumption Behavior ........................................88
4-14 Group Classification: Beer Consumption Behavior Stepwise Discriminant Analysis ......89

8
LIST OF FIGURES
Figure page 2-1 Theory of Reasoned Action: Brand Choice/Consumption of Beer ...................................35

9
Abstract of Thesis Presented to the Graduate School of the University of Florida in Partial Fulfillment of the Requirements for the Degree of Master of Advertising
INFLUENTIAL FACTORS ON BRAND CHOICE AND CONSUMPTION BEHAVIORS: AN
EXPLORATORY STUDY OF COLLEGE STUDENTS AND BEER
By
Dave Ritter
May 2008
Chair: Hyojin Kim Major: Advertising This study examined factors influencing beer brand choice and beer consumption
behavior among college students. It was determined after using six situational groupings that
situational variation did not have a significant impact on brand choice of beer for college
students. Relationships among brand benefits, exploratory shopping behaviors, susceptibility to
interpersonal influence, product category involvement, and demographics were studied in order
to determine what factors had the most significant impact on brand choice. It was determined
that price and risk-taking behaviors had a significant impact on beer brand choice. Consumption
behaviors among college students were influenced by emotions. In addition, an association
between situation and consumption behavior existed among college students consuming their
favorite beer. Bars, clubs, or parties demonstrated heavy to moderate drinking behavior.
Situations where college students are relaxing such as at the pool/beach, at home with friends,
and not a party demonstrated light beer drinking behaviors.

10
CHAPTER 1 INTRODUCTION
Studies have shown that there are vast numbers of heavy users for consumption of alcohol
among college students in the United States. According to a study, 31.5% of 17 to 25 year olds
reported heavy usage once in the past thirty days (Faden, 2006). Over 80% of college students
drink alcohol (Johnston et al. 2004), and more than 43% of these students have been reported as
exhibiting heavy episodic drinking behaviors (Wechsler et al. 2003). Demographically, college
students that have a greater likelihood of being a heavy user are white, around 23 years old or
younger, and are in a fraternity or sorority. Among members of Greek organizations, 75.1% of
fraternity members and 62.4% of sorority members are heavy users. Out of all heavy users, 91%
of women and 78% of men do not consider themselves such. Instead, they classify themselves as
moderate or light drinkers (Boulard 2005).
Beer is the majority of overall consumption for alcoholic beverages involving heavy
consumption with this consumer segment (Coate and Grossman, 1988). According to a Fall 2005
report from MRI data, nearly half (43.9%) of consumers aging from 18 to 24 purchase beer/ale
products. This group is 50% more likely (index of 150) to have purchased beer/ale in the past six
months in comparison to all other age groups. In addition, this age group is 21% more likely
(index of 121) to consume at least 5 beers in the last 7 days, which is also the most for any other
age group (“Fall,” 2006).
There are factors that contribute to the opportunity for beer to be a marketable product in a
college market. First, according to a Student Monitor’s Lifestyle and Media study, college
students consider drinking beer one of the top “in” things on their campuses. This study found
drinking beer rated as the second “in” thing on campuses at 71%, tied with the college
networking website Facebook.com (Snider, 2006). Second, there is a relationship among the

11
availability and consumption of alcoholic beverages. Therefore, as availability increases, then the
consumption of alcoholic beverages increases (Gruenewald et al. 1992; Gruenewald et al. 1993;
Jones-Webb et al. 1997). Third, the college market has a large, disposable income. In addition, as
beer availability often exposes this market to beer brands for the first time, consumers begin
trying brands and formulating their consideration set for this product category. Brand preferences
for beer often begin in college, and college students have plenty of income to spend on it with
$231 billion annually (“Beer,” 2005; Ballantyne et al, 2006).
In efforts to reach the college market, marketers have used many different strategies
(“Beer,” 2005). First, pricing strategies have been used based on the assumption that as the price
decreases, then consumption increases (Levy and Sheflin, 1985). Second, marketers have utilized
advertisements at the point of purchase and happy hours, offering discounts on drinks in bars
during certain allocated periods of time (Kuo et al. 2003; Christie et al. 2001). In addition, some
companies use bar promotions such as theme nights or brand sales representatives in the
establishment of purchase to promote their brands. Third, marketers have utilized college
sporting events for reaching college students with event sponsorships (“Alcohol,” 2005). Finally,
companies have been more aggressive using innovative techniques such as viral marketing
campaigns on popular websites such as www.youtube.com and targeting areas just off campus
for promotions and advertising (“Viral,” 2006; “Domestic,” 2006).
There are some problems involved with the beer market and college students. First of all,
despite high advertising expenditures (advertising spending of $478,000,000 for the first half of
the year), the beer product category has been losing market share (“U.S.,” 2007). There has been
a decrease in the consumption of beer based on increased usage of mixed drinks and other
alcoholic beverages. Second, there are many health concerns associated with beer on college

12
campuses. Companies have a responsibility to promote safe drinking practices based on heavy
usage (Boulard, 2005). As the level of awareness for beer on college campuses increases, this
could potentially lead to negative consequences for sponsorships on or off campuses (Kuo et al.
2003). Third, marketers are currently battling pricing and promotional wars with competitors
based on heavy product proliferation. These promotions have little consistency among a
branding strategy. Therefore, strategies that do not contribute to a brand could lead to increased
brand switching for consumers (“Beer,” 2005; Kuo et al. 2003).
If marketed effectively, there is a tremendous opportunity in the college segment.
According to the 2000 U.S. Census Bureau, this market is comprised of 17,472,000 people (Day
and Jamieson, 2005). It has been said that this group exhibits low brand loyalties. However,
according to Wood (2004), “To suggest that young consumers have low loyalty would be to miss
the richness of their complexity” (p. 13). This study is aimed at helping marketers have a better
understanding of the current beer and college market. It also aids in finding what factors
influence brand choice and consumption behavior for this product category. Information from
this study can help marketer’s position beer brands and help them segment the market for college
students based on the benefit needs of this group (Smith, 1956; Bagozzi, 1986). Marketers can
use information from this study to develop the most cost effective advertising and promotional
messages for this market (Vazquez et al. 2002). From a research perspective, there are few
studies involving brand choice, the college market, and the product category of beer. Therefore,
this study could lead to further research studies in the future. This study tests the validation of the
desired brand benefits and choice model as a predictor of brand choice (Orth, 2005). Finally, this
literature adds to existing studies on brand choice.

13
CHAPTER 2 LITERATURE REVIEW
Brand Choice
Understanding and predicting brand choice decisions by consumers has been a topic of
interest to both marketers and researchers. Brand choice investigation involves understanding
consumer behaviors in their selection of brands among various product categories (Bentz and
Merunka, 2000). In the past, brands have been perceived as products with different attributes;
however, brands are now viewed as personalities, identities, and have special meanings intrinsic
to consumers (Ballantyne et al. 2006). Brand choice research has been investigated for many
years and has intensified as product categories have become more proliferated. For example, 30
years ago there were only a handful of beer brands in grocery stores. Now, there are several
brands of beer with brand extensions featuring light beers, imports, ice beers, as well as many
others. Consumers have more options and many different brands to choose from (Léger and
Scholz, 2004).
Much of brand choice research has been through probability models to test the impact of
marketing mix variables as a predictor of brand choice (Wagner and Taudes, 1986; Chib et al.
2004; Bentz and Merunka, 2000). These variables (referred in most research studies as the 4 P’s)
are elements such as product features, displays (i.e. advertising, sales promotions), availability
(stock of inventory), and price (Chib et al. 2004, May; Bentz and Merunka, 2000; Wager and
Taudes, 1986). When used in probability modeling, marketing mix variables are considered non-
stationary and heterogeneous among the population (Wagner and Taudes, 1986).
There are other areas that have been researched with brand choice as well. Researchers
have examined the casual effects of brand related variables on brand choice. These variables
include situational factors, consumer personality, social benefits, emotions, quality, brand
14
credibility, product attributes, seasonality, and trends. The studies used within brand choice
researches have involved experiments and surveys of key marketing variables to measure impact
on brand choice (Charlton and Ehrenberg, 1973; Simonson et al. 1994; Erdem and Swait, 2004;
Wagner and Taudes, 1986; Orth, 2005). Table 2-1 demonstrates these brand choice studies.
Among specific marketing mix variables, pricing appears to have the most consistent
impact in studies. Promotions such as sales promotions have shown influence on brand choice
which ultimately effect bottom-line prices for consumers. For example, pricing promotions could
involve coupons or simply a reduction of price within the product category (Singh et al. 2005;
Papatla and Krishnamurthi, 1996; Wagner and Taudes, 1986; Orth, 2005). In probability
modeling studies, it has been shown that displays and features have some impact on brand
choice, but this evidence is not as overwhelming or as consistent as other factors among brand
choice research studies (Chib et al. 2004; Papatla and Krishnamurthi, 1996; Alvarez and
Casielles, 2005). Product attributes have high importance on discovering what areas of the
product can be altered in order to make their brand more appealing to the consumer. According
to current research, it has been found that the greater the number of brand attributes for a
product, then the more likely the consumer is to make that particular band choice (Greenwald et
al. 1986; Romaniuk, 2003). Product attributes are important to marketers in order to differentiate
products from their competitors (Aaker et al. 1992; Belch and Belch, 1995).
Non-marketing mix variables have been researched in order to discover external factors
that impact brand choice. Seasonality and trends have been researched with brand choice.
However, their outcomes depend upon the product category. For example, a product such as
laundry detergent will most likely have better sales figures in the summertime when the weather
is more favorable and people are outside more (Wagner and Taudes, 1986). Personality factors

15
have shown an impact based on what brands consumers buy. Brand credibility has shown
significance in determining brand choice as well (Erdem and Swait, 2004; Fry, 1971). Other
areas such as purchase time, purchase order, and product name have been researched but have
not been deemed to be main factors in determining a brand choice decision (Charlton and
Ehrenberg, 1973). These studies allow marketers to understand consumer switching behaviors
and allow for market share penetration, which give marketers a better understanding of what
elements effect a particular brand or product category (Chib et al. 2004; Wagner and Taudes,
1986).
Several product categories have been used in order to study brand choice. The majority of
product categories include low consumer involvement retail products. Some examples of
products studied in the past with brand choice are laundry detergent, soda, athletic shoes,
ketchup, coffee, snack foods, and bar soaps. Table 2-1 provides a listing of the various product
categories used in previous brand choice researches (Wagner and Taudes, 1986; Chib et al. 2004;
Erdem and Swait, 2004; Baumgartner, 2003; Papatla and Krishnamurthi, 1996; Alvarez and
Casielles, 2005; Berné et al. 2004; Singh et al. 2005; Auger et al. 2003).
Among previous brand choice literature, there have been very few studies involving the
product category of beer. Woodside and Fleck Jr. (1979) conducted a qualitative study regarding
brand choice of beer drinkers. The methodology for this study consisted of two in-depth personal
interviews with two beer drinkers. The researchers concluded that involvement, normative,
situational, and product attributes all influenced brand choice in the study. Charlton and
Ehrenberg (1973) conducted an experiment with the product category of beer where variables
manipulated were price, purchase time, purchase order, product name, and brand name. More
recently a study was conducted (Orth et al. 2004) which examined craft beer preference and the

16
relationship of brand benefits with consumer demographics. Brand benefits were considered to
be significant drivers of consumer preferences in this product category. Brand benefits were
shown to be an effective predictor in the product category of beer for brand choice.
Table 2-1 Brand Choice Studies Author Independent
Variables Dependent Variables
Product Categories Studied
Methods
Orth (2005) Situations (Host, Gift, Self) Quality* Social Benefits* Price* Emotional* Health Environment
Brand Choice Wine Electronic Survey
Wagner and Taudes (1986)
Marketing Mix (Advertising, Price)* Seasonality* Trends*
Purchase Rate Brand Choice Probability
Laundry Detergent
Testing of Multivariate Polya Process Model using Consumer Panel Purchase Data
Chib et al. (2004)
Marketing Mix (Price, Feature, Display)†
Brand Choice Soda (Beverage)
Testing of Model of Brand Choice with Scanner-Panel Data
Erdem and Swait (2004)
Brand Credibility* (Expertise, Trustworthiness, Perceived Quality, Perceived Risk, Information Cost Saved)
Brand Consideration, Brand Choice
Athletic Shoes, Cellular Providers, Headache Medication, Personal Computer, Shampoo
Survey
Papatla and Krishnamurthi (1996)
Price* Sales Promotion (Display*, Feature*)
Brand Choice Laundry Detergent
Testing the Utility Model Using Household Scanner Data
Miller and Ginter (1979)
Situation* Attributes*
Brand Choice Fast Food Restaurants
Survey from Mail Panel

17
Table 2-1 Continued Author Independent
Variables Dependent Variables
Product Categories Studied
Methods
Simonson et al. (1994)
Quality Rating Brand Name Price Premiums Product Features†
(Brand Choice) Quality Promotion Consumer Need
Brownie Mix 35 mm Film CD Player
Experiment (Three Studies)
Romaniuk (2003)
Product Attributes* Benefit Attributes* Situation-Based Attributes*
Brand Choice Fast Food Market
Survey
Fry (1971) Personality Variables* (Sex, Social Class, Self-Confidence, etc.)
Brand Preference
Cigarettes Experiment with a Field Study Panel
Alvarez and Casielles (2005)
Sales Promotions (Price*, Reference Price, Losses and Gains, Sales Promotion Techniques)
Brand Choice Soda (Beverage)
Testing of Brand Choice Models using Logit Models from Consumer Panel Data
Berné et al. (2004)
Price Brand Coffee Type (Blend, Natural, Special) Promotional Discount Consumer Type (Regular or Occasional Shopper)†
Brand Choice Ground Coffee Testing of Brand choice Logit Models using Consumer Panel Data

18
Table 2-1 Continued Author Independent
Variables Dependent Variables
Product Categories Studied
Methods
Baumgartner (2003)
Price Promotion Goodwill
Brand Choice Brand Loyalty
Ketchup Coffee
Testing the Multinomial Logit Model for Time Variations with Brand Choice Using Panel Data.
Auger et al. (2003)
Basic Product Features (i.e. Weight, Ankle Support, Price) Ethical Features (Tested on Animals, Child Labor, Biodegradable) Consumer Personality Demographics†
Brand Preference
Bar Soaps Athletic Shoes
Experiment
Singh et al. (2005)
Product Attributes (Price*, Feature, Display, Flavor, No Salt/Light*, Pack Sizes*, Brand Names*)
Brand Choice Pretzels Potato Chips Tortilla Chips Mayonnaise Sliced Cheese
Testing of Multicategory Brand Choice Model using Household Panel Data
Charlton and Ehrenberg (1973)
Price Purchase Time Purchase Order Product Name Brand Name†
Brand Choice Beer Experiment

19
Table 2-1 Continued Author Independent
Variables Dependent Variables
Product Categories Studied
Methods
Orth et al. (2004) Brand Name Functional Benefits Price/Value Social Benefit Positive Emotional Benefit Negative Emotional Benefit†
Consumer Preferences
Craft Beer Online Survey from Consumer Panel Data
Bentz and Merunka (2000)
Marketing Mix Variables (Price per Quantity, Promotional Price Cut as a Percentage of Normal Price) Product Characteristics Household-Specific Variables (Brand and Size Loyalties)†
Brand Choice Instant Coffee Store Purchases Chocolate
Testing of the Multinomial Logit Model in Combination with Neutral Net work Model using Panel Scanner Data
* Indicates variables were found to be significantly associated with brand choice. † Indicates these studies involved interaction effects among dependent variables but had no main effects on individual dependent variables.
Desired Brand Benefits
Researchers do not always account for separation of effects for brand name with product
attributes. Keller (1993) suggests that the brand name creates added benefits separate from the

20
product for consumers. Benefits are personal values that consumers associate with a product or
service. It is what the consumer believes the product or service can do for them (Park et al.
1986). Brand benefits create a value by the brand name (i.e. logo, design), which transcends the
functional value of the product. Brand benefits focus on the needs that the product fulfills for the
consumer (Lancaster, 1971; Haley, 1968; Farquar, 1989, p. 24; Orth et al. 2004). Some
researchers believe that consumers make purchases based on the product benefits and not the
attributes offered. However, consumers evaluate purchase decisions based on product attributes
with the promise of benefits received from product attributes (Haley, 1968; Aaker et al. 1992;
Belch and Belch, 1995; Puth et al. 1999). A recent study has shown that consumers do not
always seek both attributes and benefits in products. Consumers tend to seek benefits when
involved with simple products: low involvement (i.e. food products). Consumers seek attributes
when dealing with a more technical product: high involvement (i.e. television, automobile)
(Bozinoff and Roth, 1984).
More recently research has focused on both brand name and brand benefits that led to a
brand choice by consumers. Brand benefits have been analyzed in terms of dimensions that
impact brand choice. Findings have been discovered by researching brand benefits that brands
outperform and are more actionable than previous research studies in product attributes.
Dimensions that have been researched in the past include performance/quality, value-for-money,
emotion, health, social, and environmental benefits (Orth 2005; Orth et al. 2005). Six brand
benefit measures were shown to be significant in measuring brand choice in a previous study
(Orth 2005).
Performance/Quality
Quality refers to the degree of excellence in a product or service (Xianhua and Germain,
2003). Therefore, quality is one of the most important factors influencing customer satisfaction

21
(Fornell et al. 1996) and is considered the ability of a product or service to perform its specific
task (Ennew et al. 1993). The success of a brand in customer satisfaction is quality. Companies
conform to requirements set by consumers (Berden et al. 2000). Quality is significant on the
performance of a product (Calantone and Knight, 2000). The interaction of a product meeting or
exceeding consumer expectations based on its performance is how quality is evaluated (Fornell
et al. 1996; Reeves and Bednar, 1994). Performance specifications generally define how quality
is judged for products (Ennew et al. 1993). Findings from research indicate that marketing
strategies, differentiation, cost leadership, and focus are drivers of quality (Calantone and
Knight, 2000).
Product quality adds many benefits for a company. Product quality allows companies to
charge higher prices to consumers. In addition, having a higher product quality gives a
competitive advantage which leads to gains in profit margins and market share. However,
research has shown that quality may not equate to success without the proper marketing
techniques in order to reach and communicate with consumers (Calantone and Knight, 2000;
Choi and Coughlan, 2006).
Quality is not defined as a situation of spending money to make money. Often times a
product’s quality can be improved by reducing waste, fewer dissatisfied consumers, and being
more efficient in the production of the product. There has been research to support the theory
that companies do not have to incur costs to make their product superior in order to have superior
quality. Instead, attention to quality as a differentiating approach in dealing with competitors
often can make a larger overall impact on quality (Calantone and Knight, 2000; Berden et al.
2000). Quality is important for impacting brand choice because it is the portion of personal risk

22
that a consumer takes on the decision making processing in evaluating the purchase of a product
(Berden et al. 2000; Hoyer and MacInnis, 2004).
Price/Value for Money
In retail markets, consumers are value driven, where value is considered a tradeoff among
price and value. Price can serve as an indicator of quality for consumers. The higher the price of
a product, the more perceived risk a consumer incurs (Quester and Smart, 1998). In general,
consumers often associate a high-priced retail product with higher quality than those of lower
pricing (Lambert, 1972). However, some researchers believe that this quality and price
relationship is too simplistic (Sweeney and Soutar, 2001). Prices are used by marketers in retail
stores in order to appeal to different consumers on different levels. The consumer uses
comparative judgments in order to evaluate a potential purchasing decision. The consumer
utilizes reference prices in order to make these comparisons (Alvarez and Casielles, 2005).
Reference pricing is a subjective price level that is used by the consumers to determine if the
product is at an acceptable price for purchase (Mayhew and Winer, 1992). Brands in most
product categories have a wide range of different prices. These prices vary for a vast number of
reasons (advertising, lower economies of scale, premium brand positioning, generics, and several
other factors). These prices demonstrate information perceived in many different ways by
consumers. A consumer might perceive a lower priced product to be considered “cheap” or
having low quality, whereas a different consumer could potentially see the low cost as a good
value (Hruschka, 2002; Lambert, 1972).
Therefore, price is a major factor in determining brand choice. First, several studies have
been conducted in order to determine the effect of price on alcohol consumption. Studies have
found an inverse relationship for sales and pricing. For example, as price of alcohol beverages
increase, then sales for these products decrease and vice versa (Österberg 1995; Levy and

23
Sheflin, 1983). Second, the consumer wants the best product at the best price. Therefore, a higher
priced item will have more economic risk, but higher priced goods are more visible to others
socially. For example, some consumers choose to never purchase generic products because they
believe the quality of the product to be inferior. In addition, they have a social fear that others
will perceive that they are not economically well off (Hoyer and MacInnis, 2004).
Emotions
Consumers can develop emotional feelings for products, specifically brands. These
emotions toward brands can have a major influence based on brand choice. Research has shown
that emotions lead to an interaction with the product on a personal level (Bowlby, 1979; Hazan
and Shaver, 1994). These emotions can lead to brand loyalty, paying premiums, and influencing
others to purchase the brand. Therefore, a consumer’s emotional attachment to a brand may be
able to predict their commitment and willingness to make sacrifices to obtain it. Some basic
ideals that are associated with this emotional involvement for brands are a positive brand
attitude, high involvement in the product category, brand loyalty (willingness to pay a premium),
affection, passion, connection, and the overall satisfaction associated from the brand (Thompson
et al. 2005).
Normative/Personal (Social)
Social influences consist of influential factors determined by family and friends. College
students have more of a propensity to drink the brands that their parents and friends consume on
a regular basis. When children leave their parent’s home to join the workforce or go off to
college, then a majority of them are taking their parents’ purchasing behaviors with them. These
behaviors may diminish over time as the young adult is separated from their family, but the
influence is still apparent (Feltham, 1998). In addition, adolescents are exposed to peer-pressure
and group-think mentalities, which lead them to consuming brands that their friends and peers

24
consume (Collins et al. 2003). This social influence stems from persuasion by attitudes and
behaviors of fellow peers (Jessor, 1981; Kandel, 1980). Therefore, normative influences can
have an affect on brand choice for the beer product category. Throughout research on social
behavior, other individuals’ behaviors may serve as cues which could increase the potential for
behavior. In addition, the behavior of others might remind the individual that alternatives to their
own behavior are available (Bandura, 1977).
Social influence has an affect on brands that consumers choose. There is a social risk
associated with every purchase decision a consumer makes. Opinion leaders, family/friend
influence, reference groups, social class, culture, and subculture can affect the brands that a
consumer purchases. This social risk is often associated with what the consumer believes are
acceptable brands based on the brand perceptions in the individual’s social group. For example, a
consumer may purchase a higher priced, upscale brand in order to identify and be accepted by a
higher social class (Hoyer and MacInnis, 2004).
Environment (Stewardship)
Stewardship involves a company or brand taking an active responsibility for the
environmental impact of their product. This can come from the design, manufacturing, usage
from consumers, disposal of the product, and literature of the product to stay within the
boundaries of government law, industry standards, and consumer standards (Bruen, 2002). In
addition, product stewardship involves the environmental concerns involving health and safety in
all phases of the brand’s life cycle (Braglia and Petroni, 2000; Hickle and Stitzhal, 2003; White
and Pomponi, 2003).
Environmental management has become a major issue in today’s business world. New
“green” strategies are making companies rethink the production and waste practices involved
with company operations (Braglia and Petroni, 2000; Hickle and Stitzhal, 2003). Brands that do
25
not exhibit stewardship miss out on “green” marketing opportunities. Results from a study
analyzing the effects of stewardship concluded, firms that are more environmentally aware
derive more benefits from their “green” activities (Braglia and Petroni, 2000).
Consumer benefits that come from implementing stewardship are enhancing brand
reputation and image. In addition, stewardship can gain access to new markets, in some cases
reduction of costs (not paying fines and other environmental liabilities), and comply with
regulations. Firms that do not practice stewardship might have cost and regulatory benefits over
firms that do (Braglia and Petroni, 2000). An example of stewardship involving the product
category of beer would be if the can or bottle is recyclable or was recycled itself before
consumption.
Health
Historically, there has always been debate based on whether alcohol has been considered a
good thing or a bad thing for health purposes. Abraham Lincoln suggested in reference to
alcohol, “Many were greatly injured by it, but none seemed to think the injury arose from the use
of a bad thing but from the abuse of a very good thing” (Basler, 1953, p. 275).
Today, consumers are more health conscious than they have been in previous
generations. This trend has made marketers conform to these health concerns by catering
products and brands to meet consumer criteria. American’s obsession with obesity has reached
the beer market. Low carbohydrate diets are becoming more and more popular, informing
consumers to cut carbohydrates from their diet. Beer marketers have recognized this need and
have begun to follow suit by marketing light beers aggressively (Coxe, 2004; Walker, 2004).
Research studies have shown that drinking alcohol in moderate amounts has consumer
benefits with cardiovascular health through blood thinning properties in alcohol. Also, alcohol
has been proven to ward off conditions such as bone health, cancer, hot flashes, heart attacks and

26
ischemic strokes. In addition, some studies actually determined that it showed protection against
dementia (Woods, 2005; Rhodes, 2005; Klatsky, 2006; Kondo, 2004). In addition, past studies
have shown that alcohol consumption can lower the risk of developing diabetes by improving
insulin sensitivity (“Is,” 2004). The main medical health benefit of alcohol is a lowered risk of
coronary heart disease (Kondo, 2006; Klatsky, 2006).
With these recent consumer benefits, there are also risks associated with heavy
consumption of alcoholic beverages. There has been some evidence that drinking beer and other
alcoholic beverages in moderation (one drink a day) can increase rates of breast cancer in
postmenopausal women by 30% (Helliker and Ellison, 2005; Andorfer, 2005). Drinking beer
does add calories to a diet, and if these calories are not burned off, then the cardiovascular
benefits are void (Tufts University Health and Nutrition Letter, 2004). The beer market has
started a shift toward lower carbohydrate beers in order to try and meet the needs of these
consumers (“Beer’s,” 2006).
Hops, an ingredient in beer products, provide cancer prevention and treatment of
osteoporosis. However, to get these benefits, an individual would have to drink large quantities
of beer, which add separate health risks (Loftus, 2005). Heavy drinking has many consequences
associated with it based on the alcohol content in beer. Heavy consumption can lead to liver
disease, high blood-pressure, increase the risk of cancer, and pancreas damage (Kondo, 2006).
Some beer companies are beginning to mention health benefits through marketing efforts.
However, it is something that is handled very delicately for liability purposes. There is research
that is supporting health benefits from drinking in moderation (Cioletti, 2006). There is a
perception that wine is healthier than beer. The University of Western Ontario found that one
beer has the same antioxidants as a glass of red wine. Therefore, beer companies are making

27
efforts to investigate and change these perceptions (“Is,” 2004). Indicating health benefits to
consumers, such as promotion of drinking in moderation as a health benefit and low
carbohydrate beers, influences a brand choice decision for health conscious consumers (Coxe,
2004; Walker, 2004; Woods, 2005; Kondo, 2002). Many of the research studies involving health
benefits of beer are still in the exploratory stages and have not produced consistent results in
some areas. Therefore, companies and researchers are not suggesting for consumers to begin
beer consumption for health benefits. Instead they are merely pointing out that there are some
health benefits for those that currently consume beer (Klatsky, 2006).
Situational Factors
Benefits sought out by consumers can differ based on the situation that the consumer is in
(Yang et al. 2002). According to Belk (1974), “Situations may be defined as those factors
particular to a time and place of observation which have a demonstrable and systemic effect on
behavior” (p. 157). Consumers evaluate brands in different manners based on the situation
(Vazquez et al. 2002). It is suggested from previous research that situational factors are a better
predictor for consumer behavior than measures involving consumer attitudes. Research has
indicated that consumer preferences change according to their environment (Quester and Smart,
1998; Lai, 1991, Belk, 1974).
According to Lai (1991), there are three types of situations that are used in marketing
strategy among situational factors: communication situation, purchase situation, and
consumption situation. Situational drivers should have a frequent number of customers per
situation. In addition, each situation must be clearly different than the other in order to account
for variance measures. Therefore, effects from environmental factors are not homogenous but
rather heterogeneous (Miller and Ginter, 1979; Yang et al. 2002).

28
A consumer might choose a brand based on being in different situations and will therefore,
be motivated to drink a certain brand (Yang et al. 2002). According to drinking studies, around
80% of young people’s total alcohol consumption occurs at a public place (Knibbe et al. 1991).
The greatest occurrences of drinking are in the home or in bars (Wilks and Callan, 1990). In
addition, heavy and light drinkers tend to drink twice as much during “happy hours” in bars than
they do during times that are not involved in such promotions. Therefore, there are some
interaction effects of brand benefits based on situational factors (Babor et al. 1978; Orth, 2005).
Consumers may face similar environments, but there are several motivating conditions that
play a role on brand choice depending on the consumer (Yang et al. 2002). Several studies have
shown this idea of situational influences proving that individuals prefer to drink different brands
based on different occasions (Bearden and Etzel, 1982). For example, Quester and Smart (1998)
used the purchase of a bottle of red wine for a drink during the week (alone or with one’s family)
over dinner, for a dinner party at a friend’s house on a weekend (with 5 to 6 close friends), and as
a gift for an employer or respected friend. Orth (2005) evaluated three different situations based
on drinking red wine with the same scale from Quester and Smart. Miller and Ginter (1979)
explored situational impacts on brand choice with respect to fast food restaurants. The situation
variations analyzed were lunch on a weekday, snack during a shopping trip, evening meal when
rushed for time, and evening meal with the family when not rushed for time. All of the studies
involving situational factors demonstrated significance based on impacting brand choice (Orth,
2005; Miller and Ginter, 1979).
Areas that have been studied with situational drivers include product involvement, brand
choice, and product attributes. High product involvement was considered a factor that influences
behaviors with the interaction of situational drivers. Product factors have different levels of

29
importance to consumers based on situation. Brand choice has been found to be impacted
significantly by situational factors (Orth, 2005; Quester and Smart, 1998; Miller and Ginter,
1979; Yang et al. 2002).
It is important for marketers to understand where brands are effective in given situations.
This gives marketers insights as to where the brands are being effectively communicated,
purchased, and consumed (Miller and Ginter, 1979; Quester and Smart, 1998). However, one
study has argued with these notions. Results from a research study using a probability models to
determine preferences indicated that marketers do not have to make their brands congruent to
consumers or their environment. It is suggested that the source of brand preferences must be
understood in order to have an impact on situational factors that influence brand choice (Yang, et
al. 2002).
Situation variation depends on the product category used for research (Belk, 1974). Beer is
an important category to use because it is a narrowly defined product category in accordance
with researching situational drivers (Miller and Ginter, 1979). Drinking beer is considered an
activity that may occur in distinct situations. Therefore, there should be a clear variance
according to their changing environment (Yang et al. 2002).
Consumer Factors
Marketers and researchers have studied consumer factors in order to have an understanding
of what characteristics and traits (such as consumer demographics, susceptibility to interpersonal
influence, product category involvement) impact purchasing decisions. In addition, consumer
factors are utilized to target and segment populations (Park and Lessig, 1977; Bearden et al.
1989; Quester and Smart, 1998). Consumer behaviors (such as exploratory behavior, product
usage, and frequency of purchase) have been researched in the past in order to have an
understanding of choice (Raju, 1980, Redman et al. 1987; Uncles and Ehrenberg, 1990). These

30
variables have been linked historically in research as potential drivers of situational variation
based on brand choice with brand benefits (Orth, 2005; Orth et al. 2004)
Exploratory Shopping Behaviors
It is important to understand brand switching and exploratory behaviors in consumer brand
choice decisions. Previous research has indicated a link between situational drivers and
behaviors based on personality traits of a consumer. According to research by Raju (1980),
consumers take a risk, seek variety, and have curiosity in purchase behaviors such as brand
switching. Risk taking involves the consumer’s need for innovation and alternatives in which
they are not familiar with. There is more risk perceived with this behavior. When a consumer is
variety-seeking, they are looking for alternatives that they are familiar with. The final consumer
exploratory tendency is curiosity-motivated behavior, which the consumer seeks out information
about a product or service through shopping or interpersonal communications (Raju, 1980;
Wahlers et al. 1986).
Product Categories such as beer are a good fit for exploratory behaviors based on the
desire for variety and brand-related factors. Consumers begin to have boredom with a brand and
seek alternatives in product categories similar to beer. In extreme cases where consumers have a
high level of involvement, these exploratory behaviors may not exist. For example, if the
consumer has a level of brand loyalty and habitually purchases the same brand irrelevant of
factors influencing choice, then this consumer will most likely not seek alternative brands (Van
Trijp, 1994; Van Trijp et al. 1996).
Interpersonal Influence
Social influence is major driver of brand choice. However, it is important to understand an
individual consumer’s susceptibility to social influence in order to have an understanding of how
much social influence impacts their purchase decisions. If there is a high degree of social

31
influence, then the consumer could potentially change perceptions and purchasing behaviors
(Batra et al. 2001). Interpersonal influence is the individual traits or characteristics that impact
social influence within an individual (McGuire, 1968). Consumer susceptibility to interpersonal
influence has an impact on brand choice behaviors (Witt, 1969; Stafford and Cocanougher,
1977). Previous research indicates that interpersonal influence has a direct effect on personal
behaviors (McGuire, 1968). There are varying degrees of social impact within each individual
consumer. These levels indicate how much social influence an individual is susceptible to in
contrast with other individuals (Bearden and Etzel, 1982).
Consumption Behaviors
There are several behavioral factors that play a role in determining brand choice for
consumers. Product usage is among one of these factors and plays a major influential role in
impacting consumer behavior (Ram and Jung, 1989). Product usage consists of two dimensions:
usage variety and usage frequency (Zaichkowsky, 1985). Variety usage is how the product is
used and depends upon the product category and situation. Market share for product brands
could increase based on an event or situation. For example, sales and volume for specific brands
of beer could fluctuate before and after the super bowl (Ram and Jung, 1989). Therefore, brand
choice measurements should take into account for temporal changes in brand choice behavior
(Wilkie, 1986). There have been studies that have compared the differences in drinking
consumption of males and females. These studies included usage measures consisting of quantity
per occasion, average volume, and frequency of drinking (Green et al. 2004). According to
previous studies, there are three categories of drinkers in order to classify users: heavy,
moderate, and light users (Redman et al. 1987).
Frequency of purchases, the second dimension of product usage, deals with the amount of
a single item purchased during a given time period. According to a study, frequency of purchases

32
can provide insight on brand choice (Ram and Jung, 1989; Uncles and Ehrenberg, 1990). In
addition, expenditures on the product category itself also have some insights based on how
consumer’s select a brand based on a product category (Orth, 2005).
Product Category Involvement
Park and Mittal define involvement as a state of mental readiness that impacts cognitive
resources for an action, object, or decision with consumer consumption (1985). Product category
involvement has a major effect on consumer decision making. If a consumer feels strongly
positive about the product category, then they are more prone to seek increased value, pay more
attention, and try to find the most product benefits among the product category (Quester and
Smart, 1998; Richins and Bloch, 1986). Product category involvement has been shown to
demonstrate considerable influence over consumer decision processing (Laurent and Kapferer,
1985).
Demographics
Demographic variables have been proven to be indicators for brand choice. Factors such as
age and gender play a role in how consumers evaluate and ultimately purchase brands in several
different product categories (Walsh and Mitchell, 2005). Based on studies involving
demographics and drinking behaviors, males tend to drink in larger quantities in same sex
groups, whereas women drink with mixed crowds or with a male (Hartford et al. 1983). Age is
also a variable to be explored for college students because there are those of legal age and others
that are obtaining beer illegally. There are a number of these college students that purchase beers
illegally via a false ID or by having an older peer purchase it for them (Schwartz et al. 1998). In
addition, there is very little known about demographic issues such as gender, age, and education
(year in college) with particular subject matter as it relates to this segment and brand choice.

33
Theory of Reasoned Action
Ajzen and Fishbein’s (1980) Theory of Reasoned Action (TRA) is one of the most
researched models that describes the psychological processes of decision making. It is comprised
of three main components in order to predict behavior. The three components are attitude,
subjective norms, and intention. This model has been applied to many different areas of study
such as alcohol, marijuana, and purchasing consumer products (Eagly and Chaiken, 1993).
In this model, attitude involves the positive or negative associations an individual has on
specific behavior. Subjective norms deal with the normative and social influences that impact an
individual’s behavior. Social influence on an individual and susceptibility to interpersonal
influence are factors that measure subjective norms. In a given population, there may be cases
that lean more towards attitude providing more influence in terms of behavior. However, in other
cases, subjective norms might potentially lead to a different behavior (Trafimow and Fishbein,
2001). Other influential factors could be intrinsic and extrinsic. They result from situational
and/or interpersonal factors (Chatzisarantis and Biddle, 1998; Bagozzi et al. 1992).
The two main factors involved in TRA, attitude and subjective norms, lead to intention.
Intention is the likelihood of completing a certain behavior, and the relative importance of
normative influence and attitudinal considerations. Intention is utilized for understanding
judgment based on how a final decision is made (Ajzen and Fishbein, 1980). Consumer factors
such as demographics and consumption behaviors provide an understanding of intention.
Intention can give marketers an idea of how a consumer will behave toward particular brands
(Bagozzi et al. 1992).
According to previous research studies, other variables aside from attitude and subjective
norm can have an overall impact on behavior (Trafimow and Fishbein, 2001). Susceptibility to
interpersonal influence and social influence lead to subject norms in an individual. Quality, price,

34
emotion, environment, health benefits, and product category involvement deal with the
individual’s attitude toward the brand. In addition, importance of subjective norms and attitudes
can vary depending upon the situation (Bagozzi et al. 1992). All of these components, either
weighing more heavily on subjective norm or attitude, lead to intention. This intention results in
an individual beer brand choice and beer consumption behavior.
There have been several studies involving the TRA model and alcohol research studies.
These studies involved predicting alcohol consumption behavior (O’Callaghan et al. 1997;
Trafimow, 1996; Wall et al. 1998). Most of these particular studies were used in efforts to
understand and predict drinking behaviors prevalent among college students. These studies were
ultimately used in order to curve drinking behaviors.
The TRA model has been utilized in this study to conceptualize research questions
involving beer brand choice and beer consumption behaviors. Figure 2-1 illustrates the TRA
model used for this study. The model has been extended in order to demonstrate all measures
involved in this study. This modified model is exploratory in nature in order to gather a
theoretical understanding among variables used in the study. The model lists the organization of
variables as they relate to the concepts and relationships in the model.

35
Figure 2-1 Theory of Reasoned Action: Brand Choice/Consumption of Beer. [Reprinted with permission from Ajzen and Fishbein
(1980). Theory of Reasoned Action. Master thesis (Page 37, Figure 2-1). University of Florida, Gainesville, Florida
Susceptibility to Interpersonal Influence
Social Brand Benefits
Subjective Norms
Intention
Attitude Price, Quality, Emotion, Environment, Health, and Product Category Involvement
Behavior
Beer Brand Choice
Beer Consumption
Consumer Factors (Demographics, Exploratory Shopping Behaviors and Consumption Behavior)
Situational Variation

36
Research Questions
Based on the previous sections, research questions were developed in order to have a
theoretical understanding of the relationship between brand choice, brand benefits, interpersonal
influence, consumption behaviors, situation, product category involvement, exploratory
behaviors, and demographics.
• RQ1: How does beer brand choice vary by situation?
• RQ2: How does beer consumption behavior vary by situation?
• RQ3: Which factors (perceived brand benefits, exploratory shopping behaviors,
susceptibility to interpersonal influence, product category involvement, and
demographics) have the most significant impact on beer brand choice?
• RQ4: Which factors (perceived brand benefits, exploratory shopping behaviors,
susceptibility to interpersonal influence, product category involvement, and
demographics) have the most significant impact on beer consumption behaviors?

37
CHAPTER 3 METHOD
Pretest
A pretest was administered in order to improve accuracy of measures and to test
reliability of pre-existing measures (Appendix A). Brand choice, consideration set formulation,
situation, and brand benefits were all asked to respondents with a predetermined brand,
Budweiser. This brand was chosen based on its awareness, popularity, and market share in the
beer product category. Beer consumption questions and demographics were asked in order to
gain knowledge in these areas before developing the main study.
Subjects
Participants for the pretest were selected from two Junior/Senior-level courses. These
courses were an advertising course and a health communications course at the University of
Florida. College students in these courses were offered extra credit in exchange for their
participation (N =46). The pretest results provided a profile of college student participants. The
average age of respondents was 21.61 (standard deviation = .95). The minimum age was 20, and
the maximum age was 25 years old. Out of the sample of 46, 30 were female (65.2%) and 16
were male (34.8%). Among students, 27 were employed (58.70%) and 19 were unemployed
(41.30%). The respondents had little Greek membership from this sample. There were 38
students that were not Greek members (82.6%) and 7 students were Greek members (15.2%).
Based on past month beer consumption, the top five brands in the pretest were Bud Light,
Blue Moon, Corona, Coors Light, and Miller Lite. Participants also answered questions
regarding beer brands that they were most likely to consume in the next month. These brands
were ranked, and the top brands were the exact same as the past beer consumption rankings.
These beer brand choice questions created some confusion among respondents. Therefore, it was

38
determined to make beer brand choice an open-ended question for the main survey in order to
account for individual consideration sets. Based on an opened-ended situational question, there
were 20 situation items resulting from this question. Brand benefits scales had satisfactory
reliability and were utilized for the main study. However, two health item questions were added
to the health benefits scale based on exploratory data from an open-ended question. These health
items added were “It is a good way to relieve your stress” and “It glorifies unhealthy drinking
behaviors”. These questions were evaluated based on agreement or disagreement on a 7-point
Likert scale. Beer consumption behavior questions provided accurate and clear results to
measure the construct.
Design and Procedure
A paper questionnaire was used in order to collect data. The survey was administered and
collected during class time. Subjects completed separate forms in order to keep their anonymity.
Subjects were given 15 minutes to complete the survey. Students were asked regarding the
constructs of brand choice, consumption behavior, demographics, situational variation, and brand
benefits.
Measures
Brand Choice
Brand choice questions (Appendix A: Question 1 and 13) were asked with comprehensive
but not exhaustive lists of 31 beer brands. In addition to these choices, the respondent had the
option of choosing an “Other” category and if so, then to specify the brand. A “None of the
Above” option was used to account for non-beer drinkers. In the first question, respondents were
asked to check the brands of beer they have consumed in the past month. This question was used
in order to get a perspective of consideration set for participants. In the second brand choice

39
question (13), respondents were asked to rank order the brands of beer they were most likely to
consume.
Situational Variation
Situations (Appendix A: Question 3) were asked on a 7-point Likert scale based on where
a respondent would consume Budweiser beer (1 being Not Very Likely and 7 being Very
Likely). Eight factors were used, exploratory in nature, to get an idea of discovering strength of
situations among college students. In conjunction with this information, an open-ended question
was asked (Appendix A: Question 4) regarding other occasions or situations that were not listed.
Desired Brand Benefits
Previous brand benefit scales (Appendix A: Questions 6, 8-12) used by Orth (2005) were
tested for their reliability. Measurement for desired brand benefits were based on six dimensions:
quality/performance, price/value for money, social/normative, emotion, environment, and health
benefits (Orth 2005; Vasquez et al. 2002; Sweeney and Soutar, 2001; Orth et al. 2004).
Quality/performance consisted of 6 items. Price/value for money consisted of 4 items. Emotions
were measured with 4 items. Social/normative scales consisted of 11 total items. Environmental
brand benefits were measured with 3 items. Health benefits consisted of 2 items. All of these
items were used on a 7-point Likert scale involving the agreement of disagreement of statements
involving each benefit (1 = Strongly Disagree and 7 = Strongly Agree). Scale items were tested
for reliability and confirmed to be used in the main study based on their results. An open-ended
health benefit question was asked in order to potentially add more items to the health scale in
order to increase reliability (Appendix A: Question 7).
Consumption Behavior
Two questions were used to have an understanding of college student beer consumption
behavior (Appendix A: Question 2 and 5). These two questions were inquiries regarding number

40
of days drinking (per week) and quantity of drinks per occasion. These two values provided
product usage information.
Demographics
Demographic questions (Appendix A: Questions 14-20) were asked in order to have an
understanding of the respondent profile before the main study is conducted. Age, sex,
employment, Greek membership, living situation, academic year as a student, and college major
were asked to gain insight into college student respondents.
Main Study
Subjects
Participants for this study were selected among college students in Public Relations and
Advertising courses at the University of Florida. College students that participated in the study
were rewarded extra credit for their completion of survey materials. A sample of 222 participants
was used to complete the main survey. The total number of brands chosen for this study was 38
different brands of beer (Table 3-1). Among these brands, it was determined that with a 95%
confidence interval (Equation 3-1) only three brands would be used for this study:
95% CI = +/- 1.96 √ (½ ⁄ ½ /N) (3-1)
The three brands extracted from the main study were the following: Blue Moon, Bud
Light, and Corona. Based on participants only choosing the three brands, in conjunction with
subjects that did not have consistent beer consumption behavior (have not consumed a beer in
excess of the last two weeks), the sample size was reduced to 98 participants. Based on these 98
participants, the average age was 20.69 (Minimum = 18, Maximum = 31, and Standard
Deviation = 2.28). A frequency table demonstrates the results from these demographic questions
(Table 3-2). The gender distribution was 75.5% females and 24.5% males. There were 55.1% of
respondents that were not employed and 44.9% were employed. There were 30.6% of Greek

41
membership and 69.4% that were not Greek members. Most of the college students (63.3%)
lived with a roommate or roommates in an apartment or house off campus.
Table 3-1 Beer Brand Choice (N = 222) Beer Brand Frequency Percent Sam Adams 1 .5% Busch Light 1 .5% Bud Light 43 19.4% Michelob Ultra 11 5.0% Stella 3 1.4% Coors Light 7 3.2% Heineken 12 5.4% Budweiser 9 4.1% Corona 28 12.6% Miller Lite 13 5.9% Blue Moon 27 12.2% Yuengling 8 3.6% Heineken Light 1 .5% Natural Light 8 3.6% Amber Boch 4 1.8% Guinness 3 1.4% Bud Select 2 .9% Killians 2 .9% Sapporo 1 .5% Hardcore 1 .5% Shipyard Blueberry Ale 1 .5% Labatt Blue 1 .5% New Castle 2 .9% Red Stripe 8 3.6% Presidente 2 .9% Smirnoff 2 .9% Khalik Gold 1 .5% Pabst Blue Ribbon 1 .5% Michelob Light 1 .5% Milwaukee’s Best 1 .5% Hornsby 1 .5% Miller High Life 1 .5% Grolsch Light 2 .9% Goldwesser 1 .5% Shiner Bock 1 .5% Corona Light 1 .5% Molson 1 .5% Coopers 1 .5% Total 214 96.4%

42
Table 3-2 Demographic Frequency Distribution Frequency PercentageGender Male
Female 24 74
24.5% 75.5%
Age 18 19 20 21 22 23 24 27 29 30 31
5 24 29 19 10 2 5 1 1 1 1
5.1% 24.5% 29.6% 19.4% 10.2% 2.0% 1.0% 1.0% 1.0% 1.0% 1.0%
Employed Yes No
44 54
44.9% 55.1%
Greek Membership
Yes No
30 68
30.6% 69.4%
Academic Year
Freshman Sophomore Junior Senior Master’s Graduate Student
10 39 28 20 1
10.2% 39.8% 28.6% 20.4% 1.0%
Academic Major
Public Relations Advertising Journalism Other
25 27 2 44
25.5% 27.6% 2.0% 44.9%
Living Situation
Live with Parents Live Alone (apt/home) on Campus Live Alone (apt/home) off Campus Live with Roommate(s) (apt/home) on Campus Live with Roommate(s) (apt/home) off Campus Fraternity or Sorority House Live in Dorm Alone Live in Dorm with Roommate(s) Other
1 1 9 8 62 6 2 8 1
1.0% 1.0% 9.2% 8.2% 63.3% 6.1% 2.0% 8.2% 1.0%
N = 98
Design and Procedure
A paper questionnaire was used in order to collect data for the main study. The survey was
administered and collected during class time. Subjects completed separate forms in order to keep
their anonymity. Subjects were given 30 minutes to complete the study. Students were asked

43
brand choice, consumption behavior, demographic, susceptibility to interpersonal influence,
product category involvement, exploratory shopping behaviors, situational variation, and brand
benefit questions.
Measures
Brand Choice
To measure brand choice, respondents were asked a fill in a blank question (Appendix B:
Question 1) asking them to write in their favorite brand of beer. This information allows the
respondent to select their favorite brand among that particular individual’s consideration set
when it comes to the product category of beer.
Situational Variation
Based on pretest results, it was discovered that 20 situations existed (Appendix B:
Question 2) in which college students consume their favorite beer. Modeling for situational
variation was developed from Orth’s study (2005). Consumption situations were varied by the
company of the individual drinking. Situations were varied with three possible scenarios:
drinking beer with a group of friends, drinking with a date, and drinking alone. Among the 20
situations possible, 13 situations were chosen by respondents in the main study (Table 3-3). Six
groupings were created with multiple categories in an attempt to limit the disparity among
situation data. Each grouping dealt with a respondent answering what situation they last
consumed their favorite beer. Groupings were assessed in order to find a significant relationship
based on similarities of the situation, frequencies of situations selected, and social interaction
based on situations. These situational groupings can be seen in left column on Table 4-1.
Group 1 consisted of 5 categories: in a bar or club with friends, at home with friends not a
party, a house/apartment party not in your home with friends, partying at home or pool/beach,
and other. At the University of Florida, most housing for college students has a pool. Therefore,

44
party at home was combined with pool/beach. This combination was utilized in order to
distribute the data more evenly among the categories. The other category contains eight
situations to contrast category size among these categories.
Group 2 consisted of 4 categories: in a bar or club with friends, at home with friends not a
party, a house/apartment party not at home with friends, and other. The first three categories
remained unchanged. However, the other category consists of ten situations combined in order to
contrast with the high numbers selected among the first three situations.
Group 3 was made up of in a bar or club, a restaurant or at home not partying, and
partying/special events. This first category consists of an environment when college students go
out to a bar or club and have the social interactions and situations that go along with the bar/club
scene on a college campus. In addition, the category of restaurant and at home not partying deals
with the college student that wants to relax and have a few drinks in a comfortable situation. The
final category deals with a special event such as a party, beach/pool, or sporting/concert. College
students participate in activities throughout the school year such as tailgating at football games,
music concerts, pool parties, and the occasional house/apartment party. In these environments,
students are attending with the intent of having a good time and enjoying these special events.
Group 4 contains two categories. The first category deals with college students drinking in
a bar, club or party situation. These students are looking to have a good time and social
interaction. The second category involves students not in bars, clubs, or parties. These students
are in a more relaxed, comfortable environment where there may not be as much social
interaction or pressure to consume large quantities of beer.
Group 5 has four categories consisting of social, date, alone, and relax with friends. The
social category contains situations where there is high social interaction. The date situation is

45
when the respondent was drinking beer with a date. The alone category dealt with situations
when the individual drank beer by themselves. Relax with friends was used in order to
demonstrates college students that were just drinking their favorite beer to relax and not
necessarily drinking to have a good time or socially interact.
Group 6 involved the same social, date, and alone categories as listed in group 5. Data
from relax with friends was omitted from this group. The three respondents that chose other on
the main survey were also omitted from groups 5 and 6 based on a lack of frequency for this
selection.
Table 3-3 Situation Frequency Distribution Situation
Frequency
In a bar or club with friends
35
In a bar or club with a date
1
In a bar or club alone
1
In restaurant with friends
4
At home with friends (not a party)
17
At home with a date (not a party)
2
At home alone (not a party)
2
Sporting event/concert with friends
1
Beach/pool with friends (not a party)
8
Party (not at home) with friends
20
Party (not at home) with a date
2
Party at your home
3
Other
3
N = 97
46
Desired Brand Benefits
Measurement for desired brand benefits (Appendix B: Questions 5-10) was consistent
with items in the pretest. However, respondents were answering statements for their favorite beer
and not a forced choice (Budweiser as used in the pretest). Brand benefit index scores were
calculated by using averages for each of the six brand benefit dimensions. Scale items were
tested for reliability. Quality/performance consisted of 6 items (Chronbach’s alpha = 0.89).
Price/value for money consisted of 4 items (Chronbach’s alpha = 0.85). Emotions were measured
with 4 items (Chronbach’s alpha = 0.94). Social/normative scales consisted of 11 total items
(Chronbach’s alpha = .90). Environmental brand benefits were measured with 3 items
(Chronbach’s alpha = 0.86). Health benefits consisted of 4 items (Chronbach’s alpha = .50).
When one item was removed, “It glorifies unhealthy drinking behaviors”, then reliability
improved (Chronbach’s alpha = .66). Finally, another item was removed (“It is a good way to
relieve your stress”) in order to improve reliability scores (Chronbach’s alpha = 0.74).
Exploratory Shopping Behaviors
Exploratory shopping behaviors (Appendix B: Questions 11-13) are a measure that was
adopted from many previous measures (Raju, 1980; Wahlers et al. 1986). The constructs used in
this study for exploratory shopping behavior were risk-taking, variety-seeking, and curiosity-
motivated (Orth, 2005). Items were measured on a 7-point Likert scale based on agree with
statements (1 = Strongly Disagree and 7 = Strongly Agree). Index scores were calculated for
each of the three exploratory shopping behaviors by using averages. Among these measures, risk
taking behavior consisted of 5 items (Chronbach’s alpha = 0.83). Variety-seeking behavior was
made up of 4 items (Chronbach’s alpha = 0.79). Curiosity-motivated behavior was a measure
made up of 3 items (Chronbach’s alpha = .47). However, one item was removed (“When I hear
47
about a new store or restaurant, I take advantage of the first opportunity to find out more about
it”) in order to improve reliability (Chronbach’s alpha = 0.53).
Interpersonal Influence
Interpersonal influence measures were 12 items (Appendix B: Question 14) used from
previous research in order to measure the level of social influence within each individual
(Bearden et al. 1989). Items were measured on a 7-point Likert scale based on agree with
statements (1 = Strongly Disagree and 7 = Strongly Agree). A susceptibility to interpersonal
influence index score was calculated by using an average of the 12 items. These 12 items were
found to be reliable (Chronbach’s alpha = 0.89).
Consumption Behavior
Beer consumption behavior consisted of three questions. The first question (Appendix B:
Question 3) was a question inquiring about basic beer consumption. This question was utilized to
discover respondents that were not ordinarily beer drinkers and remove them from the sample.
Beer consumption behavior was measured by creating a consumption index from two separate
measures (Appendix B: Questions 15 and 16). The first measure was the amount of beer on
average that an individual drinks in one occasion. The second measure consisted of the average
number of days a week in which an individual drinks. These two measures have been illustrated
in a cross tabulation on Table 3-4.
These measures were multiplied in order to create an index score. Index scores were
evaluated and grouped into light, moderate, and heavy beer drinkers based on their consumption
behaviors. These groups were divided equally into 3rds based on the frequency distribution
illustrated on Table 3-5. Light beer drinkers had a drinking index of 0 – 2. This means that a
college student that had a consumption index of 2 drank either 2 twelve ounce beers in one night
on average in a week, or they drank one beer on average for two nights a week. Moderate beer

48
drinkers had consumption indexes from 3 – 8, and heavy beer drinkers had consumption indexes
of 9 – 54. It is important to note that these beer consumption behavior levels differ in contrast to
the general population. Due to high beer consumption levels of this particular college market,
these measures should not be used for direct comparisons involving consumption behavior for
other beer markets.
Table 3-4 Average Beers Consumed and Average Occasions Drinking Beer
Average Number of Occasions per Week Drinking Beer Average Number of Beers Drank per Occasion
0 1 2 2.5 3 4 5 6 Total
0
7 0 0 0 0 0 0 0 7
1
6 4 0 0 0 0 0 0 10
2
4 7 2 0 1 0 0 0 14
3
3 5 10 0 2 0 0 0 20
4
1 7 3 0 5 1 0 0 17
5
0 4 3 1 1 0 1 0 10
6
1 0 3 0 2 1 0 0 7
7
0 1 0 0 3 0 0 0 4
8
1 1 0 0 0 1 0 0 3
9
1 1 0 0 0 0 0 1 3
10
0 0 0 0 0 1 0 0 1
14
0 0 0 0 1 0 0 0 1
17+
0 1 0 0 0 0 0 0 1
Total
24 31 21 1 15 4 1 1 98

49
Table 3-5 Consumption Behavior Frequency Consumption Behavior Frequency Percent (%) Light Beer Drinkers 0 1 2
24 4 7
24.5 4.2 7.1
Total 35 35.7 Moderate Beer Drinker 3 4 5 6 7 8
5 9 4 11 1 4
5.1 9.2 4.1 11.2 1 4.1
Total 34 34.7 Heavy Beer Drinker 9 10 12 12.5 15 16 17 18 21 24 25 32 40 42 54
3 3 8 1 1 1 1 2 3 1 1 1 1 1 1
3.1 3.1 8.2 1 1 1 1 2 3.1 1 1 1 1 1 1
Total 29 29.6% N = 98
Product Category Involvement
Three items (Appendix B: Question 17) used from previous research were used in order
to measure product category involvement (DeWolf, 2001). Items were measured on a 7-point
Likert scale based on agree with statements (1 = Strongly Disagree and 7 = Strongly Agree).
Index scores of the three items resulted in satisfactory reliability (Chronbach’s alpha = 0.94).

50
Demographics
Demographic questions used from the pretest were also utilized in the main study in order
to retrieve information in order to profile and identify respondents (Appendix B: Questions 18-
24).

51
CHAPTER 4 RESULTS
Brand Choice among Situational Variation
Chi-square analysis was used in order to explore the possible association between beer
band choice and the situation in which college students consumed their favorite beer. All data
was tested at level of p ≤ .05. Beer brand choice was a categorical variable consisting of three
brands: Bud Light, Blue Moon, and Corona. Situation was a categorical variable consisting of six
groups with categories for each situation. Table 4-1 illustrates the cross tabulation of these
results for the chi-square value, frequencies among groups with brand choice, and degrees of
freedom.
In grouping one with five situations, 45.71% that chose drank in a bar or club with friends
chose (16 out of 35). Bud Light was also chosen more when at home with friends not at a party
(41.18%, 7 out of 17), party not at home with friends (55%, 11 out of 20), and other (50%, 7 out
of 14). When college students drank beer partying at home or pool/beach area, then Corona was
the highest chosen (63.64%, 7 out of 11). These results were found to not be statistically
significant. Therefore, there is no significant relationship between categories in group one with
brand choice.
Group two with four situations yielded somewhat similar results as group one. College
students drinking in a bar or club chose Bud Light (45.71, 16 out of 35). Bud Light was most
chosen in all categories: bar or club with friends (45.71, 16 out of 35), at home with friends not a
party (42.18%, 7 out of 17), party not at home with friends (55%, 11 out of 20), and other (36%,
9 out of 25). Results were found to not be statistically significant and no relationship for these
four categories and brand choice exists.

52
In grouping three with three situations, results were not statistically significant. College
students that drank in a bar or club preferred Bud Light (45.95%, 17 out of 38). College students
that drank in a restaurant/home not partying preferred Blue Moon (39.29%, 11 out of 28) slightly
over Bud Light (35.71%, 10 out of 28). In a partying/special event, college students chose Bud
Light (50%, 16 out of 32) closer over Corona (37.5%, 12 out of 32).
In grouping four with two situations, college students in a party, bar, or club were more
prone to choose Bud Light (50%, 30 out of 60). College students not in a party, bar, or club
drank Bud Light (35.14%, 13 out of 37), Blue Moon (32.43%, 12 out of 37), and Corona
(32.43%, 12 out of 37). Results for grouping 4 with two situations indicated no statistical
significance.
In grouping five with four situations, college students in social situations drank Bud Light
more frequently (46.15%, 30 out of 65). College students that drank their favorite beer with a
date preferred Bud Light (80%, 4 out of 5). College students that drank their favorite alone were
equally distributed among brand choice at 33.33% (1 out of 3) for each brand. College students
that drank their favorite beer to relax with friends chose Blue Moon (42.86%, 9 out of 21). These
results did not provide statistical significance.
In grouping six with three situations, results were exactly the same as group five other than
omitting the relax with friends category. Therefore in group six, Bud Light was the most
dominantly chosen brand for these situations, but as in group five, results were also found to not
be statistically significant.
The chi-square analysis indicated that situation groups one (x² = 12.17, p > .05), two (x² =
2.55, p > .05), three (x² = 6.15, p > .05), four (x² = 2.11, p > .05), five (x² = 6.89, p > .05), and

53
six (x² = 3.06, p > .05) were not associated with beer brand choice. Results for all situation
groups were found to be not statistically significant with brand choice.
Table 4-1 Situational Groups and Brand Choice Situational Grouping
Items Included in Grouping
Bud Light Blue Moon Corona Total
Bar or club with friends 16 (45.71%)
10 (28.57%)
9 (25.71%)
35
At home with friends (not a party)
7 (41.18%)
5 (29.41%)
5 (29.41%)
17
Party (not at home) with friends
11 (55%)
3 (15%)
6 (30%)
20
At home alone (not a party) Beach/Pool with friends (not a party) Party at your home
2 (18.18%)
2 (18.18%)
7 (38.89%)
11
1
In a bar or club with a date In a restaurant with friends Other In a bar or club alone At home with a date (not a party) Sporting event/concert with friends Party (not at home) with date
7 (50%)
6 (42.86%)
1 (7.14%)
14

54
Table 4-1 Continued Situational Grouping
Items Included in Grouping Bud Light Blue Moon Corona Total
Bar or club with friends 16 (45.71%)
10 (28.57%)
9 (25.71%)
35
At home with friends (not a party)
7 (41.18%)
5 (29.41%)
5 (29.41%)
17
Party (not at home) with friends
11 (55%)
3 (15%)
6 (30%)
20
2
At home alone (not a party) Beach/Pool with friends (not a party) Party at your home In a bar or club with a date In a restaurant with friends Other In a bar or club alone At home with a date (not a party) Sporting event/concert with friends Party (not at home) with date
9 (36%)
8 (32%)
8 (32%)
25

55
Table 4-1 Continued Situational Grouping
Items Included in Grouping
Bud Light Blue Moon Corona Total
In a bar or club with friends In a bar or club with a date In a bar or club alone
17 (45.95%)
11 (29.73%)
9 (24.32%)
37
In a restaurant with friends At home with friends (not party) At home with a date (not a party) At home alone (not a party) Other
10 (35.71%)
11 (39.29%)
7 (25%)
28
3
Sporting event/concert with friends Beach/pool with friends (not a party) Party (not at home) with friends Party (not at home) with a date Party at your home
16 (50%)
4 (12.5%)
12 (37.5%)
32

56
Table 4-1 Continued Situational Grouping
Items Included in Grouping Bud Light Blue Moon Corona Total
In a bar or club with friends In a bar or club with a date In a bar or club alone Party (not at home) with friends Party (not at home) with a date Party at your home
30 (50%)
14 (23.33%)
16 (26.67%)
60
4
In a restaurant with friends At home with friends (not party) At home with a date (not a party) At home alone (not a party) Sporting event/concert with friends Beach/pool with friends (not a party) Other
13 (35.14%)
12 (32.43%)
12 (32.43%)
37

57
Table 4-1 Continued Situational Grouping
Items Included in Grouping Bud Light Blue Moon Corona Total
In a bar or club with friends Sporting event/concert with friends Beach/pool with friends (not a party) Party (not at home) with friends Party at your home
30 (46.15%)
14 (21.54%)
21 (32.31%)
65
In a bar or club with a date At home with a date (not a party) Party (not at home) with a date
4 (80%)
1 (20%)
0 (0%)
5
At a bar or club alone At home alone (not a party)
1 (33.33%)
1 (33.33%)
1 (33.33%)
3
5
In a restaurant with friends At home with friends (not a party)
7 (33.33%)
9 (42.86)
5 (23.81%)
21

58
Table 4-1 Continued Situational Grouping
Items Included in Grouping Bud Light Blue Moon Corona Total
In a bar or club with friends Sporting event/concert with friends Beach/pool with friends (not a party) Party (not at home) with friends Party at your home
30 (46.15%)
14 (21.54%)
21 (32.31%)
65
In a bar or club with a date At home with a date (not a party) Party (not at home) with a date
4 (80%)
1 (20%)
0 (0%)
5
6
At a bar or club alone At home alone (not a party)
1 (33.33%)
1 (33.33%)
1 (33.33%)
3
1: x² = 12.17, df = 8, N = 97, p-value =.14 2: x² = 2.55, df = 6, N = 97, p-value = .86 3: x² = 6.15, df = 4, N= 97, p-value = .19 4: x² = 2.11, df = 2, N=97, p-value = .35 5: x² = 6.89, df = 6, N = 94, p-value = .33 6: x² = 3.06, df = 4, N = 73, p-value = .55 *p-value ≤ .05 (%) Percentage of situation for a specific beer brand choice
Consumption Behavior among Situation Variation
An additional chi-square test was used in order to examine the relationship between
consumption behavior and situation variation. The same six situational groupings were used as in
the previous analysis. Beer consumption behavior was a categorical variable (beer consumption

59
levels of light, moderate, and heavy). Table 4-2 illustrates the results for the chi-square value,
frequencies among groups with brand choice, and degrees of freedom.
For group one consisting of five situations, college students that drank in a bar/club with
friends consisted of 40% moderate drinkers (14 out of 35), and 42.67% heavy drinkers (15 out of
35) drank in a bar/club with friends. Respondents that drank at home with friends were
dominantly light drinkers at 52.94% (9 out of 17). College students that drank their favorite beer
at a party not in their home with friends were light drinkers (35%, 7 out of 20) and moderate
drinkers (40%, 8 out of 20). Respondents drinking beer partying at home or pool/beach area
consisted of light drinkers at 72.73% (8 out of 11). Other situations were mostly comprised of
moderate drinkers (42.86%, 6 out of 14) that consumed their favorite beer in these situations.
These results were found to be statistically significant (p ≤ .05).
In group two with four situations, the first three situations (bar/club with friends, at home
with friends not a party, and at a party not at home with friends) are the exact same as in group
one. However, the other sections were added with the 4th and 5th situation from group one.
Therefore, in other situations light drinkers at 48% (12 out of 25) consumed their favorite beer.
However, unlike group the first grouping, these results were not statistically significant.
Therefore, the situations cannot be associated with consumptions behaviors.
Group three contains three situations, and college students drinking a bar or club were
mostly heavy drinkers (42.24%, 16 out of 37) and moderate drinkers (40.54%, 15 out of 37).
Respondents that drank their favorite beer in a restaurant/home not partying were 50% light
drinkers (14 out of 28). At a party/special event the light drinkers were comprised of 43.75% (14
out of 32). These results were statistically significant (p ≤ .05), and the situations have
associations with the drinking behaviors during them.

60
Group four has two situations. In a party, bar, or club moderate drinkers at 40% (24 out of
60) and heavy drinkers at 36.67% (22 out of 60) drank their preferred beer. The other group,
drinking beer but not in a party, bar, or club consisted mainly of light drinkers at 54.05% (20 out
of 37). This data was considered to be significant (p ≤ .05). Therefore, there is an association
with these drinking behaviors and the two situations.
Group five contains four situations, college students drinking in a social environment were
distributed moderately even among consumption behaviors: light drinkers at 29.69% (19 out of
65), moderate drinkers at 38.46% (25 out of 65), and heavy drinkers at 32.31% (21 out of 65).
College students that drank with a date were mostly heavy drinkers with 60% (3 out of 5).
Students that drank alone were mostly light drinkers 66.67% (2 out of 3). Respondents that drank
their favorite beer relaxing with friends were light drinkers (47.62%, 10 out of 21). Group five
data was not statistically significant so no associations can be made.
Group six had three situations. These situations come directly from group five. However,
the relax with friends situation was omitted form this grouping. Situations in group six were as
follows: social, date, and alone. This information had the same results as in group five. In
addition, this group was also not statistically significant.
Chi-square test results for all situational groupings were as follows: group one (x² = 15.50,
p < .05), two (x² = 10.22, p > .05), three (x² = 10.44, p < .05), four (x² = 9.67, p < .05), five (x² =
6.28, p > .05), and six (x² = 4.07, p > .05). Groups one, three, and five were significant (p ≤ .05).
Therefore, associations can be made from these situations and consumptions behaviors. College
students that drank in bars, clubs, and party situation had heavy and moderate drinking
behaviors. Students that just stayed with friends not in a party situation were light drinkers.
Situations including special events and restaurants exhibited light drinking behaviors as well in

61
college students. When respondents tended to go to parties not in their home, college students
drank in light to moderate drinking behaviors.
Table 4-2 Situational Groups and Consumption Behavior Situational Grouping
Items Included in Grouping
Light Drinker
Moderate Drinker
Heavy Drinker
Total
Bar or club with friends 6 (17.14%)
14 (40%)
15 (42.86%)
35
At home with friends (not a party)
9 (52.94%)
4 (23.53%)
4 (23.53%)
17
Party (not at home) with friends
7 (35%)
8 (40%)
5 (25%)
20
At home alone (not a party) Beach/Pool with friends (not a party) Party at your home
8 (72.73%)
2 (18.18%)
1 (9.09%)
11
1*
In a bar or club with a date In a restaurant with friends Other In a bar or club alone At home with a date (not a party) Sporting event/concert with friends Party (not at home) with date
4 (28.57%)
6 (42.86%)
4 (28.57%)
14

62
Table 4-2 Continued Situational Grouping
Items Included in Grouping
Light Drinker
Moderate Drinker
Heavy Drinker
Total
Bar or club with friends 6 (17.14%)
14 (40%)
15 (42.86%)
35
At home with friends (not a party)
9 (52.94%)
4 (23.53%)
4 (23.53%)
17
Party (not at home) with friends
7 (35%)
8 (40%)
5 (25%)
20
2
At home alone (not a party) Beach/Pool with friends (not a party) Party at your home In a bar or club with a date In a restaurant with friends Other In a bar or club alone At home with a date (not a party) Sporting event/concert with friends Party (not at home) with date
12 (48%)
8 (32%)
5 (20%)
25

63
Table 4-2 Continued Situational Grouping
Items Included in Grouping
Light Drinker
Moderate Drinker
Heavy Drinker
Total
In a bar or club with friends In a bar or club with a date In a bar or club alone
6 (16.22%)
15 (40.54%)
16 (43.24%)
37
In a restaurant with friends At home with friends (not party) At home with a date (not a party) At home alone (not a party) Other
14 (50%)
8 (28.57%)
6 (21.43%)
28
3*
Sporting event/concert with friends Beach/pool with friends (not a party) Party (not at home) with friends Party (not at home) with a date Party at your home
14 (43.75%)
11 (34.38%)
7 (21.88%)
32

64
Table 4-2 Continued Situational Grouping
Items Included in Grouping
Light Drinker
Moderate Drinker
Heavy Drinker
Total
In a bar or club with friends In a bar or club with a date In a bar or club alone Party (not at home) with friends Party (not at home) with a date Party at your home
14 (23.33%)
24 (40%)
22 (36.67%)
60 4*
In a restaurant with friends At home with friends (not party) At home with a date (not a party) At home alone (not a party) Sporting event/concert with friends Beach/pool with friends (not a party) Other
20 (54.05%)
10 (27.03%)
7 (18.92%)
37

65
Table 4-2 Continued Situational Grouping
Items Included in Grouping
Light Drinker
Moderate Drinker
Heavy Drinker
Total
In a bar or club with friends Sporting event/concert with friends Beach/pool with friends (not a party) Party (not at home) with friends Party at your home
19 (29.23%)
25 (38.46%)
21 (32.31%)
65
In a bar or club with a date At home with a date (not a party) Party (not at home) with a date
1 (20%)
1 (20%)
3 (60%)
5
At a bar or club alone At home alone (not a party)
2 (66.67%)
1 (33.33%)
0 (0%)
3
5
In a restaurant with friends At home with friends (not a party)
10 (47.62%)
6 (28.57%)
5 (23.81%)
21

66
Table 4-2 Continued Situational Grouping
Items Included in Grouping
Light Drinker
Moderate Drinker
Heavy Drinker
Total
In a bar or club with friends Sporting event/concert with friends Beach/pool with friends (not a party) Party (not at home) with friends Party at your home
19 (29.23%)
25 (38.46%)
21 (32.31%)
65
In a bar or club with a date At home with a date (not a party) Party (not at home) with a date
1 (20%)
1 (20%)
3 (60%)
5
6
At a bar or club alone At home alone (not a party)
2 (66.67%)
1 (33.33%)
0 (0%)
3
1: x² = 15.50, df = 8, N = 97, p-value =.05* 2: x² = 10.22, df = 6, N = 97, p-value = .12 3: x² = 10.44, df = 4, N = 97, p-value = .03* 4: x² = 9.67, df = 2, N = 97, p-value = .01* 5: x² = 6.28, df = 6, N = 94, p-value = .39 6: x² = 4.07, df = 4, N = 73, p-value = .40 *p-value ≤ .05 (%) Percentage of situation for a specific drinking behavior

67
Variables Affecting Beer Brand Choice
A multiple discriminant analysis was used in order to determine a linear combination of
continuously measured IVs that best classify cases in one of several known groups. The
continuous independent variables used in this analysis were brand benefits (quality, price,
emotion, social, environment, and health), exploratory shopping behaviors (risk-taking, variety-
seeking, and curiosity-seeking), susceptibility to interpersonal influence, product category
involvement, gender, employment, Greek membership, and age. The categorical dependent
variable was brand choice among the three brands of Bud Light, Blue Moon, and Corona. In
addition, Table 4-3 summarizes the results of multiple discriminant analysis. This table includes
unstandarized and standardized coefficients for both functions, Wilks’ Lambda, F-ratio, p-value,
for each brand, centroids for both group functions, eigenvalues, and the Wilks’ Lambda and Chi
Square for canonical discriminant functions.
In this analysis, two functions were produced. The first function produced a high degree of
separation among the second function based on the final Wilks’ lambda (.48) and canonical
correlation (.64). Therefore, there is a moderate to strong correlation between the discriminant
function and the independent variables. In addition, 73.8% of variance was explained by the first
function. The first function was found to be statistically significant (p = .00, x² = 63.90, df = 30).
The second function had a Wilks’ lambda of .80 and a canonical correlation of .44. The second
function was not significant (p = .17).
Standardized canonical discriminant function coefficients for the two functions were
included in Table 4-3. A structure matrix, listed in Table 4-4, was used to discover the largest
absolute correlation between variables and discriminant functions. This structure matrix indicates
the greatest impact on the discriminatory impact on the predictor variables on beer band choice.
According to the structure matrix, in function one, risk-taking behavior, social, and age were the

68
highest three variables correlated with discriminant scores. In function two, environment, gender,
and price were the highest three variables correlated with discriminant scores.
The average discriminant scores for the function 1 (centroids) with respect to brands were
the following: Bud Light = -.89, Blue Moon = 1.02 and Corona = .38. This means that in the 1st
function, while significant will do a good job discriminating between all three beer brands. The
most discriminating power existed between Bud Light and Blue Moon. Blue Moon and Corona
were more closely related than Bud Light and the other two brands.
Table 4-6 illustrates the mean and standard deviation for brand choice variables and the
independent variables used in the discriminant analysis. Variables that had statistical significance
with Wilks’ Lambda were the following: price (F-ratio = 6.64, p-value = .00), risk-taking
behavior (F-ratio = 4.08, p-value = .02), and environment (F-ratio =3.63, p-value = .03). The
mean scores price according to brand choice were the following: Bud Light = 5.23 (standard
deviation = .92), Blue Moon = 4.74 (standard deviation = .82), and Corona = 4.38 (standard
deviation = 1.13). Mean scores for risk-taking behaviors were the following: Bud Light = 3.70
(standard deviation = 1.26), Blue Moon = 4.58 (standard deviation = 1.32), and Corona = 3.98
(standard deviation = 1.13). Mean scores for environment were the following: Bud Light = 3.94
(standard deviation = .95), Blue Moon = 4.27 (standard deviation = .61), and Corona = 3.65
(standard deviation = .84). The most significant variable affecting Bud Light was price with a
mean of 4.23. Price was also the most significant variable with regards to the other two brands of
Blue Moon (mean = 4.74) and Corona (mean = 4.38).
The three most important variables in terms of individual variables for Wilks’ Lambda are
price, risk-taking behavior, and environment. These three variables had the smallest Wilks’
Lambda values of .88 for price, .92 for risk-taking behavior, and .92 for environment. In

69
addition, they have the highest F-ratios among the other variables, which are statistically
significant (p-value <= .05). Based on the interaction of the independent variables, price is the
most important variable in the first function (standardized coefficient = -.89) in discriminating
brand choice in terms of the standardized coefficients. The second most important variable with
interaction for the first function is social (standardized coefficient = -.69). However, the social
benefit variable was not found to be statistically significant (p-value = .06). The third most
important variable (standardized coefficient = .49) based on interaction of variables was risk-
taking behavior which was found statistically significant (p-value = .02). Based on these results,
college students that like the price of their favorite beer are less likely to change beer brands. In
addition, if a college student exhibits risk-taking behaviors, then they are more likely to change
beer brands. Finally, when a college student is in favorite of the environmental features of a beer
brand, then the individual is more likely to change beer brand choice.
Predictive results of this analysis based on the multiple discriminant analysis are illustrated
in Table 4-5. According the results, 66.70% of original grouped cases were correctly classified.
According to these results, 83.33% of Bud Light, 57.69% of Blue Moon, and 50.00% of Corona
were correctly classified. The largest prediction errors occurred in the Corona brand (12 at
42.86%). The overall hit ratio had a t-ratio of 6.44 and thus the resultant hit rate was statistically
significant (∂ = .05).
Additional analysis was used in order to determine the most significant contributions to
beer brand choice. A stepwise discriminant analysis was used in order to determine the greatest
linear combination of continuously measured independent variables that best classify cases in
one of several known groups. This analyze was used in order to limit the assumption that
predictor variables are independent or noncollinear. In addition, Table 4-7 summarizes the results

70
of stepwise discriminant analysis. This table includes unstandarized and standardized
coefficients for both functions, Wilks’ Lambda, F-ratio, eigenvalues, p-value, for each brand,
centroids for both group functions, and the Wilks’ Lambda and Chi Square for canonical
discriminant functions. In this analysis, two of the fifteen variables were selected when Wilks’
lambda was at the lowest level. The first function produced a high degree of separation among
the second function based on the final Wilks’ lambda (.77) and canonical correlation (.44). The
second function had a Wilks’ lambda of .96 and a canonical correlation of .21. Both functions
were found to be statistically significant (p ≤ .05).
Based on group centroids for group one, Bud Light = .54, Blue Moon = -.44, and Corona =
-.41, the first function discriminates Bud Light from the other two brands: Blue Moon and Bud
Light. The second function discriminates between all three brands with the group two centroids
of Bud Light at .01, Blue Moon at .28, and Corona at -.27. However, the degree of separation
among the brands in function two does not discriminate as strongly as in function one. In Table
4-7, the two-plot function of group centroids demonstrates this separation among Bud Light, and
the two other brands, Blue Moon and Corona.
The canonical correlation (R) for the first function is .44. This means that between the
independent variables included in the analysis, there is a moderate correlation between the
discriminant function and the independent variables. The Wilks’ Lambda for the canonical
discriminant function is .77. This means that 77% of discriminant scores for variance are not
explained by group differences. The Wilks’ Lambda (.77) and Chi-Square test (23.76) were
found to be statistically significant. The Chi-Square test has a p-value of .00 with 4 degrees of
freedom. Of the variance explained by the two functions, the 1st explains 84.3%.

71
The canonical correlation (R) for the second function is .21. This means that between the
independent variables included in the analysis, there is a low correlation between the
discriminant function and the independent variables. The Wilks’ Lambda for the canonical
discriminant function (2) is .96. This means that 96% of discriminant scores for variance are not
explained by group differences. The Wilks’ Lambda (.96) and Chi-Square test (4.01) were found
to be statistically significant. The Chi-Square test has a p-value of .05 with 1 degree of freedom.
Of the predictor variables in the second function, explains 15.7% was explained.
Standardized canonical discriminant function coefficients for the two functions were
included in Table 4-7. The two most important variables in terms of individual variables for
Wilks’ Lambda are price and risk-taking behaviors. These two variables had the smallest Wilks’
Lambda values of .88 for price and .92 for risk-taking behavior. This means that 87.5% of price
was not explained by group differences and that 91.9% of risk-taking behavior was not explained
by group differences as well. In addition, they have the highest F-ratios among the other
variables, which are statistically significant (p-value <= .05). Therefore, price and risk-taking
behaviors were analyzed in the canonical discriminant functions. Based on the interaction of the
variables price and risk-taking behavior, price is the most important variable in the first function
(standardized coefficient = .92) in discriminating the levels of the dependent variable in terms of
the standardized coefficients. The second most important variable with interaction for the first
function is risk-taking behavior (standardized coefficient = -.73). In the second function, risk-
taking behavior is the most important function (standardized coefficient = .74). The second most
important variable for this second function is price (standardized coefficient = .49). Based on the
results from this stepwise analysis, the first function indicates that college students that were

72
positively affected by pricing had a negative impact on risk-taking behavior. Therefore, as
pricing of a beer brand goes down, risk-taking behavior goes up.
Predictive results of this analysis based on the two predictor variables, illustrated in Table
4-8, indicated that 54.60% of original grouped cases were correctly classified. According to these
results, 78.57% of Bud Light, 37.04% of Blue Moon, and 35.71% of Corona were correctly
classified. The largest prediction errors occurred among Blue Moon (10 at 37.04%) and Corona
(13 at 46.43%) groups. There is some ambiguity in determining whet her Blue Moon drinker
should be predicted as a member of that group or of the Corona group. The overall hit ratio was
4.17. This was found to be statistically significant (∂ = .05).

73
Table 4-3 Multiple Discriminant Analysis: Beer Brand Choice Function 1 Function 2 Unstandardized Discriminant Coefficients
Standardized Coefficients
Unstandardized Discriminant Coefficients
Standardized Coefficients
Wilks’ Lambda
F-ratio† p-value*
(Constant)
-5.59 2.92
Quality .17 .18 .05 .05 .98 .97 .38 Price -.92 -.89 -.45 -.43 .88 6.64 .00 Social -.52 -.69 -.10 -.13 .94 2.92 .06 Emotion .03 .03 .48 .56 .99 .27 .76 Environment .50 .42 -.45 -.38 .93 3.63 .03
Brand Benefits
Health .09 .10 -.04 -.04 .98 1.11 .33 Risking Taking
.39 .49 -.20 -.27 .92 4.08 .02
Curiosity Seeking
.45 .45 -.07 -.09 .95 2.68 .07
Exploratory Shopping Behaviors
Variety Seeking
-.18 -.25 -.20 -.20 .99 .25 .78
Interpersonal Influence
.33 .32 .38 .37 .99 .30 .74
Product Category Involvement
.11 .18 -.29 -.48 .97 1.50 .23
Gender .13 .05 1.67 .71 .94 2.88 .06 Employment .19 .10 .05 .02 .98 .82 .45 Greek Membership
.48 .22 .95 .44 .98 1.19 .31
Consumer Factors
Age .17 .37 -.06 -.14 .94 2.79 .07

74
Table 4-3 Continued Function Eigenvalue % of Variance Cumulative % Canonical Correlation 1 .69 73.8 73.8 .64 2 .24 26.2 100.0 .44 After Function Wilks’ Lambda Chi-square df Significance* 1 through 2 .48 63.90 30 .00 2 .80 18.80 14 .17 Beer Brand Choice Function 1 Function 2
Bud Light -.89 -.16 Blue Moon 1.02 -.52 Corona .38 .72 *Significance ≤ .05 †F-ratio is bolded for significance (p-value<=.05)

75
Table 4-4 Structure Matrix for Beer Brand Choice Function 1 Function 2
Risk Taking .33* -.23 Social -.29* -.12 Age .28* -.14 Curiosity Seeking .27* -.18 Employment -.16* .04 Variety Seeking -.09* .04 Environment .11 -.54* Gender -.06 .49* Price -.36 -.48* Health .00 -.31* Quality .07 -.27* Product Category Involvement
.15 -.26*
Greek Membership .16 .18* Emotion .04 -.14* Susceptibility to Interpersonal Influence
-.08 .09*
*Largest absolute correlation between the variable and any discriminant function. Table 4-5 Group Classification for Beer Brand Choice: Multiple Discriminant Analysis
Predicted Group Membership Brand Choice Bud Light Blue Moon Corona
Number of Cases
Bud Light Blue Moon Corona
35 (83.33%) 4 (15.38%) 9 (32.14%)
2 (4.76%) 15 (57.69%) 5 (17.86%)
5 (11.90%) 7 (26.92%) 14 (50.00%)
42 26 28
*Percentage of group cases classified: 66.70%

76
Table 4-6 Mean and Standard Deviation based on Brand Choice Bud Light Blue Moon Corona Mean Standard
Deviation Mean Standard
Deviation Mean Standard
Deviation Quality Index*
5.42 .80 5.66 1.08 5.26 1.38
Price Index* 5.23 .92 4.74 .82 4.38 1.13 Social Index* 3.42 1.32 2.74 1.44 2.79 1.23 Emotion Index*
4.47 1.18 4.62 1.11 4.39 1.15
Environment Index*
3.94 .95 4.27 .61 3.65 .84
Brand Benefits
Health Index*
2.37 1.07 2.50 1.26 2.07 .96
Risking Taking Index*
3.70 1.26 4.58 1.32 3.96 1.13
Curiosity Seeking Index *
4.62 .96 5.19 1.04 4.80 1.00
Exploratory Shopping Behaviors
Variety Seeking Index*
4.52 1.48 4.28 1.15 4.42 1.45
Interpersonal Influence Index*
3.56 1.06 3.38 .88 3.54 .93
Product Involvement Index*
2.90 1.58 3.54 1.86 2.86 1.53
Gender† .74 .45 .62 .50 .89 .31 Employment† .62 .49 .46 .51 .54 .51 Greek Membership†
.62 .49 .73 .45 .79 .42
Consumer Factors
Age 20.14 1.75 21.46 2.89 20.68 2.21 *Measured on a 7-point Likert scale †Variables were coded as bivariates (0 and 1)

77
Table 4-7 Stepwise Discriminant Analysis: Beer Brand Choice Function 1 Function 2 Unstandardized Discriminant Coefficients
Standardized Coefficients
Unstandardized Discriminant Coefficients
Standardized Coefficients
Wilks’ Lambda
F-ratio† p-value*
(Constant) -2.26 -4.88 Qualityª .98 .97 .38 Price .95 .92 .51 .49 .88 6.64 .00 Socialª .94 2.92 .06 Emotionª .99 .27 .76 Environmentª .93 3.63 .03 Healthª .98 1.11 .33 Risking Taking -.59 -.73 .60 .74 .92 4.08 .02 Curiosity Seekingª
.95 2.68 .07
Variety Seekingª
.99 .25 .78
Interpersonal Influenceª
.99 .30 .74
Product Category Involvementª
.97 1.50 .23
Genderª .94 2.88 .06 Employmentª .98 .82 .45 Greek Membershipª
.98 1.19 .31
Ageª .94 2.79 .07 Function Eigenvalue % of Variance Cumulative Canonical Correlation 1 .24 84.3% 84.3% .44 2 .04 15.7% 100.0% .21

78
Table 4-7 Continued After Function Wilks Lambda Chi-squared D.F. Significance* 1 through 2 .77 23.76 4 .00 2 .96 4.01 1 .05 Function 1 Function 2
Bud Light .54 .01 Blue Moon -.44 .28 Corona -.41 -.27
†F-ratio is bolded for significance (p-value<=.05); Test of Equality of Group Means: df for all variables are (2, 93), N = 96
ªThese variables were not used in analysis for unstandardized and standardized coefficients. *Significance ≤ .05

79
Table 4-8 Group Classification: Beer Brand Choice Stepwise Discriminant Analysis Predicted Group Membership Brand Choice Bud Light Blue Moon Corona
Number of Cases
Bud Light Blue Moon Corona
33 (78.57%) 9 (33.33%) 12 (42.86%)
4 (9.52%) 10 (37.04%) 6 (21.43%)
5 (11.90%) 8 (29.63%) 10 (35.71%)
42 27 28
*Percentage of group cases classified: 54.6%
Variables Affecting Beer Consumption
A multiple discriminant analysis was used in determining linear relationship of the
independent variables on the dependent variable, beer consumption behavior. The independent
variables were all continuous variables, and the dependent variable was categorical (light beer
drinkers, moderate beer drinkers, and heavy beer drinkers). Table 4-9 illustrates the results of the
multiple discriminant analysis containing unstandardized and standardized coefficients, Wilks’
Lambda, F-ratio, eigenvalues, and p-value, for each consumption behavior, centroids for the
function, and the Wilks’ Lambda and Chi-square for the canonical discriminant function.
There were two functions produced from the multiple discriminant analysis. In function
one, the Wilks’ lambda was .60 and the canonical correlation was .58. Therefore, there is a
moderate to strong correlation between the discriminant function and the independent variables.
This function had 82.3% of variance explained by this function. The first function was found to
be statistically significant (p-value = .04, x² = 44.47, df = 30). The second function had a Wilks’
lambda of .90 and canonical correlation of .31. This function was not found to be statistically
significant (p-value = .83).
The structure matrix for this analysis is listed in Table 4-10. This table illustrates the
largest absolute correlation between the independent variables and the discriminant functions.
For the first function, the top three variables correlated with beer consumption behavior were

80
emotion, product category involvement, and quality. For the second function, the top three
variables were risk-taking behaviors, variety-seeking behaviors, and curiosity-seeking behaviors.
The discriminant scores for the first function (centroids) with respect to beer consumption
levels were the following: light beer drinkers = -.89, moderate beer drinkers = .26 and heavy beer
drinkers = .80. This means that the function does a good job of discriminating between all three
different levels of consumption behaviors. The most discriminating power among the first
function was between light beer drinkers and heavy beer drinkers. Moderate and heavy beer
drinkers were more closely related than light beer drinkers.
The mean and standard deviations for independent and dependent variables are located on
Table 4-12. Independent variables that had statistical significance with Wilks’ Lambda were the
following: quality (F-ratio = 4.20, p-value = .02), emotion (F-ratio = 11.80, p-value = .00), health
(F-ratio = 3.04, p-value = .05), and product category involvement (F-ratio = 9.15, p-value = .00).
The mean scores for quality according to consumption behaviors were the following: light beer
drinkers = 5.06 (standard deviation = 1.27), moderate beer drinkers = 5.52 (standard deviation =
.94), and heavy beer drinkers = 5.81 (standard deviation = .77). Mean scores for emotion
according to consumption behavior were the following: light beer drinkers = 3.82 (standard
deviation = 1.24), moderate beer drinkers = 4.75 (standard deviation = .96), and heavy beer
drinkers = 5.00 (standard deviation = .80). Mean scores for health with consumption behavior
were light beer drinkers = 1.97 (standard deviation = 1.03), moderate beer drinkers 2.44
(standard deviation = 1.18), and heavy beer drinkers = 2.61 (standard deviation = 1.00). The
mean scores for product category involvement for consumption behaviors were the following:
light beer drinkers = 2.26 (standard deviation = 1.35), moderate beer drinkers = 3.21 (standard

81
deviation = 1.69), and heavy beer drinkers = 3.89 (standard deviation = 1.54). The most
significant and highest variable affecting light, moderate, and heavy beer drinkers was quality.
The four most important variables in terms of individual variables for Wilks’ Lambda
were emotion, product category involvement, quality, and health. These four variables had the
smallest Wilks’ Lambda values of .80 for emotion, .84 for product category involvement, .92 for
quality, and .94 for health. In addition, these four variables have the highest F-ratios among all
other variables and are statistically significant (p-value <= .05). Therefore, emotion
(standardized coefficient = .56), product category involvement (standardized coefficient = .49),
quality (standardized coefficient = -.06), and health (standardized coefficient = .16) were the
most important factors in discriminating consumption behavior among all other independent
variables.
Based on these results, quality was an important factor in the consumption of beer all on
levels of consumption. This variable was negatively related to beer consumption behavior.
Therefore, as quality decreases, then beer consumption increases and vice versa. Emotion was
positively related with beer consumption behaviors. Therefore, the more passionate a respondent
was about their favorite brand of beer, the more beer they were likely to consume more. Product
category involvement also had a positive relationship meaning that as product category
involvement increases, then consumption behavior increases. Finally, health had a low,
positively related impact on consumption behaviors.
On Table 4-11, the classification matrix for beer consumption behavior and demonstrates
that there were 77.14% correctly classified cases for light beer drinkers. There were 51.52%
correctly classified cases for moderate beer drinkers and 57.14% correctly classified for heavy
beer drinkers. The largest prediction errors occurred in the moderate beer drinker group. There

82
were 16 cases incorrectly classified (48.48% errors). Therefore, 62.50% of the classification
matrix was correctly classified. The value of the hit rate was 5.29 (∂ = .05) and was statistically
significant.
Further analysis was used in determining which independent variables have the greatest
impact on the dependent variable, beer consumption behavior. This analyze also followed up in
order to clear up problems involving independence and noncollinear predictor variables used
from a multiple discriminant analysis. Table 4-13 illustrates the results of the stepwise
discriminant analysis containing unstandardized and standardized coefficients, Wilks’ Lambda,
F-ratio, eigenvalues, and p-value, for each consumption behavior, centroids for the function, and
the Wilks’ Lambda and Chi-square for the canonical discriminant function. One variable out of
the fifteen variables was selected when the Wilks’ lambda (.80) was the lowest and the canonical
correlation was .45. There was one function discriminated between all three beer drinking levels,
light, moderate, and heavy. The function was found to be statistically significant (p ≤ .05).
The canonical correlation (R) for the function is .45. This means that between the
independent variables included in the analysis, there is a moderate correlation between the
discriminant function and the independent variables. The Wilks’ Lambda for the canonical
discriminant function is .80. This means that 80% of the discriminant scores for variance are not
explained by group differences. The Wilks’ Lambda (.80) and Chi-Square test (21.04) were
found to be statistically significant. The Chi-Square test has a p-value of .00 with 2 degrees of
freedom. This means that there can be inferences made from the data onto the general population
based on these results. The average discriminant scores for the function (centroids) with respect
to consumption levels were the following: light beer drinkers = -.64, moderate beer drinkers =

83
.26 and heavy beer drinkers = .50. This means that the function does a good job of discriminating
between all three different levels of consumption behaviors.
The two most important variables in terms of individual variables for Wilks’ Lambda
were emotion and product category involvement. These two variables had the smallest Wilks’
Lambda values of .80 for emotion and .84 for product category involvement. This means that
79.8% of emotion was not explained by group differences and that 83.6% of product category
involvement was not explained by group differences. In addition, these two variables have the
highest F-ratios among all other variables and are statistically significant (p-value <= .05).
However, based on the stepwise discriminant analysis, all independent variables except emotion
were removed for analysis. In the discriminant function, emotion is the most important factor
(standardized coefficient = 1.00) and was the only independent variable analyzed. This
relationship was positive as in the multiple discriminant analysis. Therefore, the more a college
student feels emotionally toward a brand, then the more likely they to exhibit increased beer
consumption behavior.
On Table 4-14, the classification matrix demonstrates that there were 57.14% correctly
classified cases for light drinkers. There were 52.94% correctly classified cases for moderate
drinkers and 24.14% correctly classified for heavy drinkers. The largest prediction errors
occurred in the heavy drinker group. There were 53 cases incorrectly classified (54.1% errors).
Therefore, 45.9% of the classification matrix was correctly classified. The value of the hit rate
was 2.71 (∂ = .05). This hit rate was statistically significant.

84
Table 4-9 Multiple Discriminant Analysis: Beer Consumption Behavior Function 1 Function 2 Unstandardized Discriminant Coefficients
Standardized Coefficients
Unstandardized Discriminant Coefficients
Standardized Coefficients
Wilks’ Lambda
F-ratio† p-value*
(Constant) -4.81 -5.85 Quality -.06 -.06 -.21 -.22 .92 4.20 .02 Price .10 .10 -.27 -.27 .96 2.15 .12 Social -.02 -.03 .07 .09 .98 1.12 .33 Emotion .55 .56 .18 .18 .80 11.80 .00 Environment -.36 -.31 -.01 -.01 .97 1.23 .30
Brand Benefits
Health .15 .16 .04 .04 .94 3.04 .05 Risking Taking
-.13 -.16 .35 .48 .97 1.57 .21
Curiosity Seeking
.30 .31 .37 .47 .97 1.50 .23
Exploratory Shopping Behaviors
Variety Seeking
-.10 -.14 .33 .33 .97 1.64 .20
Interpersonal Influence
.15 .15 .25 .25 .99 .56 .57
Product Category Involvement
.32 .49 -.10 -.15 .84 9.15 .00
Gender -.90 -.39 -.88 -.38 .98 .99 .38 Employment .18 .09 .86 .43 .98 .91 .41 Greek Membership
-.98 -.46 .18 .08 .99 .71 .49
Consumer Factors
Age .12 .28 .10 .23 .97 1.68 .19 Function Eigenvalue % of Variance Cumulative % Canonical Correlation 1 .51 82.3 82.3 .58 2 .11 17.7 100.0 .31

85
Table 4-9 Continued After Function Wilks’ Lambda Chi-square df Significance* 1 through 2 .60 44.47 30 .04 2 .90 8.96 14 .83 Beer Consumption Behavior Function 1 Function 2
Light Beer Drinkers -.89 -.13 Moderate Beer Drinkers .26 .43 Heavy Beer Drinkers .80 -.35 †F-ratio is bolded for significance (p-value<=.05) *Significance ≤ .05

86
Table 4-10 Structure Matrix for Beer Consumption Behavior Function 1 2
Emotion .70* .18 Product Category Involvement .62* -.15 Quality .42* -.08 Health .36* .05 Price .30* -.08 Age .26* -.06 Gender -.20* .00 Greek -.17* -.05 Risk-Taking -.01 .56* Variety-Seeking -.12 .50* Curiosity-Seeking .14 .45* Employment -.04 .41* Social .14 .36* Environment .19 .28 Susceptibility to Interpersonal Influence
.08 .28
Table 4-11 Group Classification: Beer Consumption Behavior Multiple Discriminant Analysis
Predicted Group Membership Consumption Behavior Light Beer Drinker
Moderate Beer Drinker
Heavy Beer Drinker
Number of Cases
Light Beer Drinker Moderate Beer Drinker Heavy Beer Drinker
27 (77.14%) 12 (36.36%) 3 (10.71%)
7 (20.00%) 17 (51.52%) 9 (32.14%)
1 (2.86%) 4 (12.12%) 16 (57.14%)
35 33 28
*Percentage of group cases classified: 62.5%

87
Table 4-12 Mean and Standard Deviation: Beer Consumption Behavior Light Beer Drinker Moderate Beer
Drinker Heavy Beer Drinker
Mean Standard Deviation
Mean Standard Deviation
Mean Standard Deviation
Quality Index*
5.06 1.27 5.52 .94 5.81 .77
Price Index* 4.59 1.23 4.89 .80 5.12 .91 Social Index* 2.82 1.24 3.31 1.49 3.04 1.31 Emotion Index*
3.82 1.24 4.75 .96 5.00 .80
Environment Index*
3.77 .88 4.09 .80 3.99 .90
Brand Benefits
Health Index*
1.97 1.03 2.44 1.18 2.61 1.00
Risking Taking Index*
3.93 1.32 4.32 1.32 3.76 1.16
Curiosity Seeking Index *
4.64 1.07 5.06 .98 4.79 .95
Exploratory Shopping Behaviors
Variety Seeking Index*
4.49 1.42 4.68 1.40 4.05 1.28
Interpersonal Influence Index*
3.40 .90 3.65 .96 3.48 1.08
Product Involvement Index*
2.26 1.35 3.21 1.69 3.89 1.54
Gender† .83 .38 .73 .45 .68 .48 Employment† .54 .51 .64 .49 .46 .51 Greek Membership†
.77 .43 .67 .48 .64 .49
Consumer Factors
Age 20.14 1.42 20.76 2.45 21.18 2.83 *Measured on a 7-point Likert scale †Variables were coded as bivariates (0 and 1).

88
Table 4-13 Stepwise Discriminant Analysis: Beer Consumption Behavior Function 1 Unstandardized Discriminant Coefficients
Standardized Coefficients
Wilks’ Lambda
F-ratio† p-value*
(Constant) -4.35 Qualityª .92 4.20 .02 Priceª .96 2.15 .12 Socialª .98 1.12 .33 Emotion .97 1.00 .80 11.80 .00 Environmentª .97 1.23 .30 Healthª .94 3.04 .05 Risking Takingª .97 1.57 .21 Curiosity Seekingª .97 1.50 .23 Variety Seekingª .97 1.64 .20 Susceptibility to Interpersonal Influenceª
.99 .56 .57
Product Category Involvementª
.84 9.15 .00
Genderª .98 .99 .38 Employmentª .98 .91 .41 Greek Membershipª .99 .71 .49 Ageª .97 1.68 .19 Function Eigenvalue % of Variance Cumulative Canonical
Correlation 1 ..25 100.0% 100.0% .45 After Function Wilks
Lambda Chi-squared D.F. Significance
1 .80 21.04 2 .00 Beer Consumption Behaviors Function 1 Light Beer Drinkers -.64 Moderate Beer Drinkers .26 Heavy Beer Drinkers .50 †F-ratio is bolded for significance (p-value<=.05); Test of Equality of Group Means: df for all variables are (2, 93), N = 96 ªThese variables were not used in analysis for unstandardized and standardized coefficients. *Significance ≤ .05

89
Table 4-14 Group Classification: Beer Consumption Behavior Stepwise Discriminant Analysis Predicted Group Membership Beer Brand Choice Light Drinker Moderate Drinker Heavy Drinker
Number of Cases
Light Beer Drinker Moderate Beer Drinker Heavy Beer Drinker
20 (57.14%) 9 (26.47%) 6 (20.69%)
15 (42.86%) 18 (52.94%) 16 (55.17%)
0 (0%) 7 (20.59%) 7 (24.14%)
35 34 29
*Percentage of group cases classified: 45.9%

90
CHATPER 5 DISCUSSION
The three brands used in this study were excellent brands to analyze based on the
differences in their positioning and marketing strategies. Bud Light is positioned as a convenient,
light beer that focuses on fun and great taste. Bud Light is a brand extension from the popular
brand, Budweiser. Bud Light utilizes massive marketing efforts (television, radio, internet,
outdoor, sponsorships, print, etc.) by focusing humor and popular culture references used by
their consumers. This brand has the most market share among the three brands, and based on pre-
test and main study results, Bud Light was the most popular brand among all other brands
investigated.
The positioning for Blue Moon is a premium, craft beer. The marketing for Blue Moon
focuses on word of mouth and point of sale. Most consumers associate the brand with the slice of
orange that is traditionally placed on the side of the glass when served. This is a key
differentiation of the brand among other beers. Consumers know that a pint of beer with an
orange slide garnished on the side of the glass is Blue Moon. The brand is not highly marketed
and does not have a presence in most marketing media. This strategy appeals to their consumers
that love premium, craft beers.
The positioning for Corona is escapism. Corona has traditionally been known as an import
brand from Mexico, and the brand has moved into the idea of escaping to an exotic destination.
The brand tries to completely differentiate itself from all other beers. The brand competes with
premium beers based on its import status in the U.S. It has something similar with Blue Moon
based on its garnish, a sliced lime pushed through its clear bottle. The marketing efforts focus on
this idea of escaping to a relaxing place, whether it is a beach or just calm ocean waters. Corona

91
creates a mood with their branding. They focus heavily on television and print advertising for
their marketing efforts.
All three brands are completely different in their marketing and positioning strategies. The
prices of a six pack of twelve ounce bottles for all three brands from a local retailer were the
following: Bud Light = $4.54, Blue Moon = $6.97, and Corona = $6.97. Therefore, based on
using these three brands, there were different segments of consumers within the sample with
different marketing strategies for each. Therefore, these three brands provided variance in their
positioning and marketing strategy among the college market.
Results from this study demonstrated variables of significance for both beer brand choice
and beer consumption behavior. These variables were quality, price, emotion, environment,
health, risk-taking behavior, and product category involvement. However, other variables were
not found to be significant. Subjective norm variables such as social and interpersonal influence
may not have been deemed significant because this truly may not be a variable that influenced
this market. It could also be possible that this market has difficulty answering questions in this
area. College students did not seem to be aided in a beer consumption or beer brand choice
decision based on social/interpersonal factors. Previous research studies have found that there
were social and interpersonal factors influence drinking alcohol (Wall et al. 1998, July;
Trafimow, 1996; O’Callaghan et al. 1997, September). However, this study concluded that they
were not found to be influential in beer consumption behavior and brand choice. In addition,
retail marketing could potentially have very little effect on this market based on these results.
The exploratory shopping behaviors of curiosity-seeking and variety-seeking did not have
significant results as well. Variety-seeking consumers looked for alternatives that the consumer
was familiar with. College students appeared to either be loyal to a brand or be a risk-taker. They

92
did not look for alternatives to their favorite brands. However, they may be looking for
something new and different to become their new favorite. Curiosity-motivated behavior meant
that the consumer sought out information through shopping and interpersonal means. The fact
that this is not found to be significant reiterates the subjective norm results found from other
variables.
Study findings provided evidence that there was not a significant association between
brand choice of beer among college students and situational variation. Although, some of the
results had consistency with brand positioning (i.e. respondents drank Corona by the pool), there
was not significant data found situation and brand choice. College students appeared to either
remain brand loyal or strayed to other brands based on other factors.
Significant factors influencing beer brand choice were price, risk-taking behavior, and
environment. The main factor that influenced brand choice was price. This supports previous
research in terms of college students purchasing beer based on pricing for that particular product
category. As price goes up, then the brand choice for the brand declines. Inversely, as the price
decreases, then brand choice for the brand increases. Risk-taking behaviors were found to be
prevalent among college students with brand choice. These behaviors coincided with pricing
because college students were open to choice with the product category of beer. Therefore,
college students were willing to take risks when choosing a brand of beer, and pricing could be a
major factor influencing this risk-taking behavior. For example, a student could potentially
retract from buying their favorite beer and partake in risk-taking behavior in order to save some
money by purchasing a cheaper brand of beer that is not their favorite. Price and risk-taking
behavior had an inverse relationship among the two most important variables. Therefore, as the
price of a beer brand decreases, then the likelihood of a college student to exhibit risk-taking

93
behavior increases. College student are very price sensitive. Some loyalties and favorites exist.
However, most college students cannot turn down a bargain. Therefore, in terms of impacting
brand switching behaviors, the most influential factor is pricing strategies and promotions.
It was unclear if marketing in a particular situation would be effective because there was
not a relationship discovered that influences a beer brand choice with situation. However, the
situation does influence the amount of beer consumed. However, marketers must be very
cautious if they market to these heavy to moderate drinking behaviors and maintain a responsible
outlook when attempting to reach these high beer consumption consumers.
Beer consumption behaviors varied based on the situations that college students were
involved. College students consumed lighter amounts of beer in situations such as special events,
beach/pool areas, at a restaurant or relaxing at home, or in any situation that is not a party, bar, or
club setting. Heavy and moderate beer consumption occurred mostly in bars, clubs, or parties.
College students tend to exhibit consumption behavior based on the situation that they are in.
Variables that were significant with beer consumption behavior were quality, emotion, health,
and product category involvement. The most influential factor was emotion. Based on beer
consumption behaviors, a light beer drinker is more likely to not have a strong emotional
attachment to brands. However, a heavy to moderate drinker has more of a strong emotion for
brands of beer. In addition, the product category involvement and quality also seems to coincide
with these behaviors. If college students were highly involved with beer, then they consume
more and had a greater interest in the overall quality of the beer. College students had mild
concerns regarding health, and this could deal with light beer consumption. The health concerns
associated with drinking beer could potentially be curving the behavior with the consumption.

94
For example, if a college student is concerned with gaining weight due to carbohydrates, then the
student would be more likely to consume less beer.
College students are a vast market that contains different segments involving several
factors that influence their brand choice. It was apparent that there are divisions among their beer
consumption behaviors. Light beer drinkers appeared to be willing to try different brands and
base purchasing on pricing. Heavy to moderate beer consumption behaviors seemed to be more
passionate emotionally about brands and were more involved with the product category of beer.
This group could potentially exhibit brand loyalties. This ideal is similar in marketing to the
80/20 rule, where 20% of the market for a brand represents 80% of the sales for that particular
brand.
Among group differences in analysis in beer consumption behaviors, groups contrast
because moderate to heavy beer drinkers tend to be less likely to take a risk in their shopping
behaviors. The light beer drinkers were vast in numbers, but they are less likely to carry loyalties
to brands of beer. Marketers should recognize these factors in the college student population. A
very specific, targeted message involving emotion for a beer brand could affect buying behavior
for this heavy to moderate beer consumer. These college students want to be recognized on a
personal, emotional level and have a strong passion for beer. In marketing to the vast segment of
college students influenced by pricing and risk-taking behaviors, the message should involve
competitive pricing strategies and emphasize differentiation. Brand extensions and new beer
products would be of interest for this group.
With the Theory of Reasoned Action (TRA) model in mind, it could be potentially feasible
to present information from this study in order to seek certain behaviors from the college student
market. Advertising to this market provides the opportunity to influence brand attitudes,

95
intention, and ultimately attempt to result in a purchasing behavior for a particular brand of beer.
In addition, advertising may have some indirect impact on subjective norms by reaching opinion
leaders or individuals among a social group. The model also creates areas of investigation where
further research could be utilized in order to determine influential factors that were not explored
which have an impact beer consumption and beer brand choice.
This research study further validates the notion of using brand benefits instead of
measuring product attributes for brand choice research. In addition, insights from the college
market were discovered from this research study. This study has expanded upon previous brand
choice studies. In addition, this study adds to the research studies involved with the topic of
college students and consumption behavior. There has been evidence provided that influential
factors do influence beer brand choice and beer consumption behavior among college students.
However, this study was only exploratory in nature. This research creates a starting point for
further areas of investigation involving situation variation, the college student marketing, beer
brand choice, and beer consumption behavior.

96
CHAPTER 6 LIMITATIONS
The influential factors on beer brand choice with brand benefits among other variables
have not been explored previously. More research is needed in order to have a better
understanding of the college market. In this study, none of the demographic factors were found
to be significant. This could have been attributed to the sample. It is evident that there were vast
differences in the college market when it involves making a beer brand choice. In addition, the
population used in this study was not a true representation of the college market. Sampling was
limited to courses in the College of Journalism and Communications at the University of Florida.
Therefore, there were differences among gender, Greek membership, employment, and age could
have been affected by this.
In addition, two measures used in the study scored low reliability scores and were reduced
to two items. Health (reduced from four items to two) and curiosity-motivated behavior (reduced
from three items to two) scored reliability scores of .74 and .53 respectively. This reliability may
have hindered the results for these variables involved in this study. Health was found to be
statistically significant for beer consumption behaviors and curiosity-motivated behavior was not
found to be significant for neither brand choice or consumption behavior. These variables may
need further investigation and research. However, these measures were found to have an
acceptable reliability in previous studies (Orth, 2005).
Based on the broken down sample of 222 to 98, the sample could not be further narrowed
in order to achieve more reliable results based on multiple and stepwise discriminant analyses.
This study does not use previously recognized alcohol consumption levels used in previous
studies. Beer brand consumption behavior levels used in this study differed in contrast to other
studies involving both the general population and other studies using college students.

97
Situational variation and beer brand choice was not found to be significant. This could
have resulted from many possible problems. The sample size could have been too small in order
to create differentiated results, the construction of measuring variables may not have been the
best way to indicate situational variation, or there could have been a problem with recalling the
exact situation in which the respondent was last drinking their favorite beer. The fact that the
beer brand choice situation question asked college students where they last consumed there
favorite beer also creates some limitations as well. It is possible that a college student may drink
their favorite beer more routinely in other locations other than simply the last location they
consumed it. Therefore, in future research studies, the measure of this variable should be
carefully analyzed in order to gain significant and valid findings.
Multiple discriminant analyses were used in the main analysis for the study. However, a
stepwise discriminant analysis was used in order to limit multicollinearity. Stepwise discriminant
analysis has been criticized in other research studies. The issues that have been associated with
this analysis are incorrect degrees of freedom based on computer packages to analyze data,
sampling error capitalization, and failure to select the best subset of variables in a given size.
Problems with this research could be addressed and improved with more research on the topic,
recalculations, improved sampling, further analyses on data, and better reliability for construct
scales would aid in improving the current research (Thompson, 1995).
The Theory of Reasoned Action (TRA) model was used as a theoretical foundation for this
research study. However, the model does involve some limitations. One limitation of the TRA
model is based on ignoring internal or external conditions influencing or hindering the
individual’s behavior. Extraneous variables such as alcohol tolerance, opportunity, and money
could influence behavior (Netemeyer et al. 1991). Also, the model does not recognize more than

98
one behavior at a time. It is possible for an individual to have simultaneous intentions leading to
multiple behaviors. The model uses attitudes and subjective norms to predict behavior. However,
based on this model, there is limited amount of learning that can be obtained (Ajzen and
Fishbein, 1980; Schlegel et al. 1977; Hays, 1985).

99
APPENDIX A PRETEST

100
Hello, My name is Dave Ritter, and I am a graduate student in advertising at the University of Florida. This is a research study questionnaire for my thesis project. My topic involves the study of attitudes, perceptions, and decisions involving brand choice for the product category of beer. Please take a few moments to read over the questions carefully. There are no right or wrong answers, so please answers the questions honestly. Your results will remain confidential, and you will be anonymous upon the completion of this survey. I would just like to thank you very much for your participation in this study. Returning the survey indicates your consent for use of the answers you supply. If you have any questions, you may contact Dave Ritter at 309-531-3509. You may also reach me at [email protected]. Please fill out the follow information in order to receive credit for participating in this study. This section will be separated from the survey upon completion to protect your anonymity. Name: ________________________________ UF E-Mail: ________________________________ UF ID: ________________________________
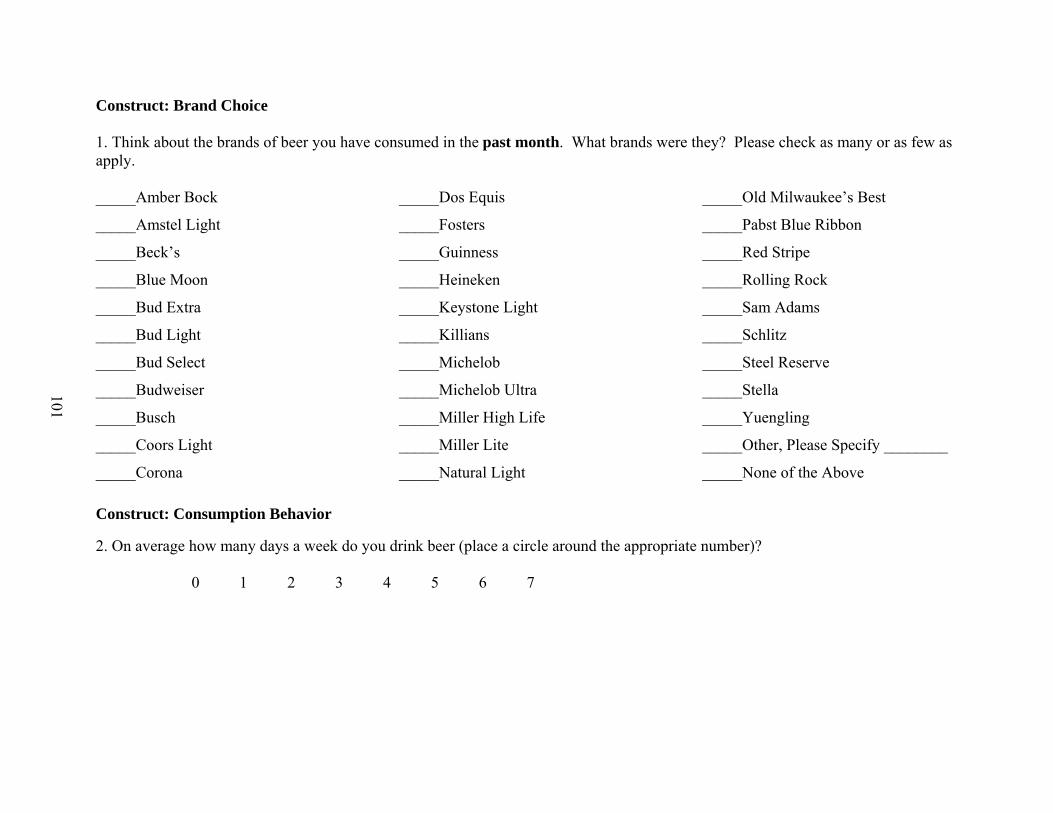
101
Construct: Brand Choice 1. Think about the brands of beer you have consumed in the past month. What brands were they? Please check as many or as few as apply. _____Amber Bock
_____Amstel Light
_____Beck’s
_____Blue Moon
_____Bud Extra
_____Bud Light
_____Bud Select
_____Budweiser
_____Busch
_____Coors Light
_____Corona
_____Dos Equis
_____Fosters
_____Guinness
_____Heineken
_____Keystone Light
_____Killians
_____Michelob
_____Michelob Ultra
_____Miller High Life
_____Miller Lite
_____Natural Light
_____Old Milwaukee’s Best
_____Pabst Blue Ribbon
_____Red Stripe
_____Rolling Rock
_____Sam Adams
_____Schlitz
_____Steel Reserve
_____Stella
_____Yuengling
_____Other, Please Specify ________
_____None of the Above Construct: Consumption Behavior 2. On average how many days a week do you drink beer (place a circle around the appropriate number)? 0 1 2 3 4 5 6 7

102
Construct: Situational Factors 3. Please indicate by circling how likely you are to drink beer in the following situations (place a circle around a number for each situation). Not Very Likely Very Likely
In a bar or club with a date 1 2 3 4 5 6 7
In a bar or club with friends 1 2 3 4 5 6 7
At a sporting event 1 2 3 4 5 6 7
Family events 1 2 3 4 5 6 7
At a restaurant with a date 1 2 3 4 5 6 7
At a restaurant with friends 1 2 3 4 5 6 7
Party with friends at home 1 2 3 4 5 6 7
Alone at home 1 2 3 4 5 6 7
Construct: Situational Factors 4. In addition to these situations, what are other occasions or situations that you drink beer? Please indicate your response in the blanks provided below. ____________________________________________________________________________________________________________
____________________________________________________________________________________________________________
____________________________________________________________________________________________________________

103
Construct: Consumption Behavior 5. How much beer on average do you drink (one drink = 12 oz. bottle and/or can) in one occasion? (Please do not include mixed drinks or other drinks that are not considered beer for your answer) _____________________________________________________________________________ The following questions ask about your perceptions and attitudes regarding Budweiser. Please answer them to the best of our knowledge. Construct: Quality/Performance Benefits 6. Please indicate the extend of your agreement with the following statements about the quality of Budweiser beer (place only one circle for each statement).
Strongly Disagree Strongly Agree
Budweiser has consistent quality. 1 2 3 4 5 6 7
Budweiser is well made. 1 2 3 4 5 6 7
Budweiser has an acceptable standard of quality. 1 2 3 4 5 6 7
Budweiser has poor craftsmanship. 1 2 3 4 5 6 7
Budweiser is a brand that would last a long time among other brands of beer. 1 2 3 4 5 6 7
Budweiser would perform consistently. 1 2 3 4 5 6 7
Construct: Health Benefits 7. Please indicate in the blanks below all the health benefits from Budweiser that you can think of. ____________________________________________________________________________________________________________
____________________________________________________________________________________________________________

104
Construct: Price/Value for Money Benefits 8. Please indicate the extend of your agreement with the following statements about the pricing of Budweiser beer (place only one circle for each statement).
Strongly Disagree Strongly Agree
Budweiser is reasonably priced. 1 2 3 4 5 6 7
Budweiser offers value for money. 1 2 3 4 5 6 7
Budweiser is a good product for the price. 1 2 3 4 5 6 7
Budweiser is economical. 1 2 3 4 5 6 7
Construct: Normative/Personal (Social) Benefits 9. Please indicate the extend of your agreement with the following statements about the social impact of Budweiser beer (place only one circle for each statement).
Strongly Disagree Strongly Agree
Budweiser helps me feel acceptable. 1 2 3 4 5 6 7
Budweiser improves the way I am perceived by others. 1 2 3 4 5 6 7
Budweiser makes a good impression on other people. 1 2 3 4 5 6 7
Budweiser gives its owner social approval. 1 2 3 4 5 6 7
Construct: Emotion Benefits 10. Please indicate the extend of your agreement with the following statements about your attitudes and enjoyment of Budweiser beer (place only one circle for each statement).
Strongly Disagree Strongly Agree
Budweiser is a product that I would enjoy. 1 2 3 4 5 6 7
Things about Budweiser make me want to use it. 1 2 3 4 5 6 7
Budweiser makes me feel relaxed. 1 2 3 4 5 6 7

105
Construct: Emotion Benefits
Budweiser makes me feel good. 1 2 3 4 5 6 7
Budweiser would give me pleasure. 1 2 3 4 5 6 7
Budweiser evokes thoughts of happiness. 1 2 3 4 5 6 7
Budweiser soothes me. 1 2 3 4 5 6 7
Budweiser eliminates all fear. 1 2 3 4 5 6 7
Budweiser eliminates all anger. 1 2 3 4 5 6 7
Budweiser makes me anxious. 1 2 3 4 5 6 7
Budweiser makes me want to use it. 1 2 3 4 5 6 7
Construct: Environment (Stewardship) Benefits 11. Please indicate the extend of your agreement with the following statements about the environmental impact of Budweiser beer (place only one circle for each statement).
Strongly Disagree Strongly Agree
Budweiser is produced in an environmentally friendly way. 1 2 3 4 5 6 7
Budweiser is made without polluting the environment. 1 2 3 4 5 6 7
Budweiser is made by people who care for the environment. 1 2 3 4 5 6 7
Construct: Health Benefits 12. Please indicate the extend of your agreement with the following statements about the health implications of Budweiser beer (place only one circle for each statement).
Strongly Disagree Strongly Agree
Budweiser comes with lots of health benefits. 1 2 3 4 5 6 7
Budweiser promotes one’s health when enjoyed in moderation. 1 2 3 4 5 6 7
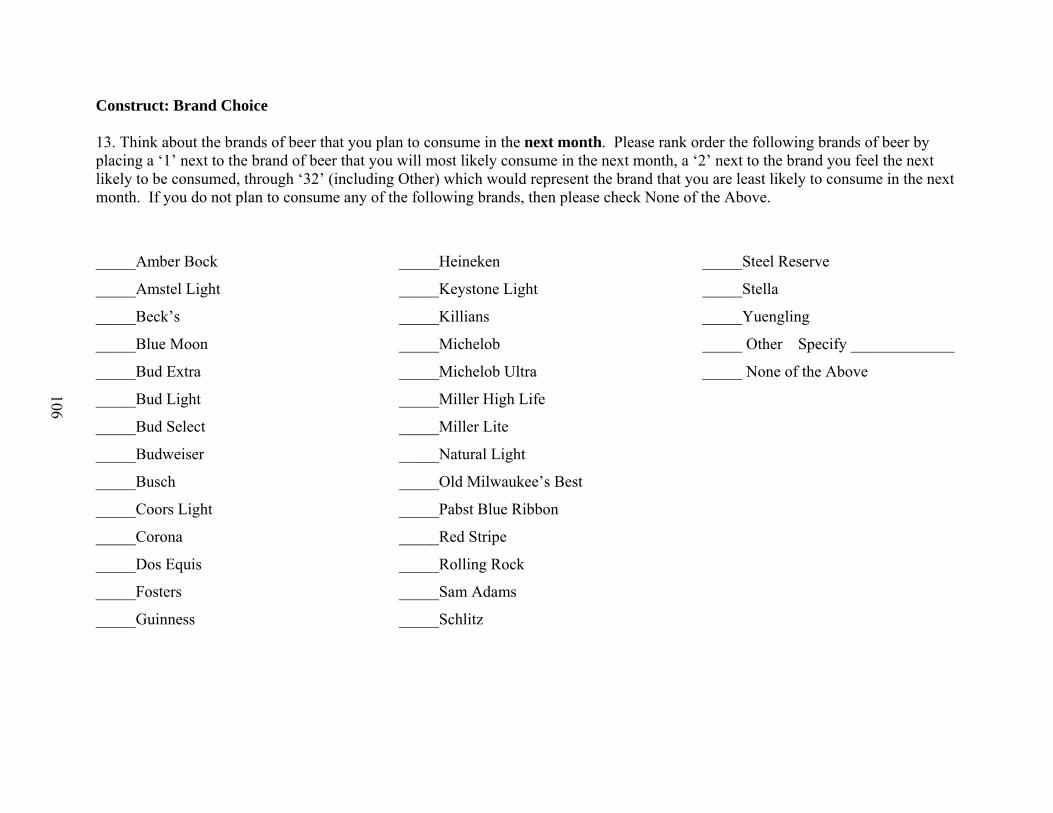
106
Construct: Brand Choice 13. Think about the brands of beer that you plan to consume in the next month. Please rank order the following brands of beer by placing a ‘1’ next to the brand of beer that you will most likely consume in the next month, a ‘2’ next to the brand you feel the next likely to be consumed, through ‘32’ (including Other) which would represent the brand that you are least likely to consume in the next month. If you do not plan to consume any of the following brands, then please check None of the Above.
_____Amber Bock
_____Amstel Light
_____Beck’s
_____Blue Moon
_____Bud Extra
_____Bud Light
_____Bud Select
_____Budweiser
_____Busch
_____Coors Light
_____Corona
_____Dos Equis
_____Fosters
_____Guinness
_____Heineken
_____Keystone Light
_____Killians
_____Michelob
_____Michelob Ultra
_____Miller High Life
_____Miller Lite
_____Natural Light
_____Old Milwaukee’s Best
_____Pabst Blue Ribbon
_____Red Stripe
_____Rolling Rock
_____Sam Adams
_____Schlitz
_____Steel Reserve
_____Stella
_____Yuengling
_____ Other Specify _____________
_____ None of the Above

107
Please take a few moments to fill to me a little about yourself by circling the appropriate responses. Please keep in mind that your information will remain completely confidential and anonymous. 14. What is your gender?
1) Male
2) Female
15. What is your current age (write in number in years)? _________ 16. What is your current year as a student?
1) Freshman
2) Sophomore
3) Junior
4) Senior
5) Master’s Graduate Student
6) PHD Student
7) Other Please Specify _________________________
17. What is your current employment status? 1) Full Time
2) Part Time
3) Unemployed

108
18. What is your current major? 1) Public Relations
2) Advertising
3) Telecommunications
4) Journalism
5) Other Please Specify _________________________
19. Please circle your current living situation?
1) Live with Parents
2) Live alone (Apartment or House) on campus
3) Live alone (Apartment or House) off campus
4) Live with roommate(s) (Apartment or House) on campus
5) Live with roommate(s) (Apartment or House) off campus
6) Fraternity or Sorority House
7) Live in a Dorm Alone
8) Live in a Dorm with roommate(s)
9) Other Please Specify _________________________ 20. Are you a member of a fraternity or sorority?
1) Yes
2) No

109
APPENDIX B MAIN STUDY

110
Hello, My name is Dave Ritter, and I am a graduate student in advertising at the University of Florida. This is a research study questionnaire for my thesis project. My topic involves the study of attitudes, perceptions, and decisions involving brand choice for the product category of beer. Please take a few moments to read over the questions carefully. There are no right or wrong answers, so please answers the questions honestly. Your results will remain confidential, and you will be anonymous upon the completion of this survey. I would just like to thank you very much for your participation in this study. Returning the survey indicates your consent for use of the answers you supply. If you have any questions, you may contact Dave Ritter at 309-531-3509. You may also reach me at [email protected]. Please fill out the follow information in order to receive credit for participating in this study. This section will be separated from the survey upon completion to protect your anonymity. Name: ________________________________ E-Mail: ________________________________ UF ID: ________________________________

111
Please take a moment to think about the last time you consumed your favorite beer. Construct: Brand Choice 1. What brand of beer is it (Please write only one beer brand in the blank provided below)? _____________________________________________________ Construct: Situational Factors 2. For the brand you mentioned in question 1, which of the following situations did you last consume this beer (Please circle only one choice for your answer)? 1) In a bar or club with friends
2) In a bar or club with a date
3) In a bar or club alone
4) In a restaurant with friends
5) In a restaurant with a date
6) In a restaurant alone
7) At home with friends (not a party)
8) At home with a date (not a party)
9) At home alone (not a party)
10) Sporting event/Concert with friends
11) Sporting event/Concert with date
12) Sporting event/Concert alone
13) Beach/Pool with friends (not a
party)
14) Beach/Pool with date (not a party)
15) Beach/Pool alone (not a party)
16) Party (not at home) with friends
17) Party (not at home) with date
18) Party (not at home) alone
19) Party at your home
20) Other; Please Specify
_________________________

112
3. For the brand you mentioned in question 1, when did you most recently consume this beer (Please circle only one choice for your
answer)?
1) A week ago (within the last 7 days) 4) More than one month but less than 3 months (30-90 days)
2) More than one week but less than two weeks (8-14 days) 5) More than 3 months (90+ days)
3) More than two weeks but less than a month (15-29 days) 6) Does not apply
4. For the brand mentioned in question 1, if you purchased this beer, then what was the cost per beer (Please estimate cost for one beer, where one beer = 12 ounces)? If you did not purchase, then please indicate by writing “N/A” in the blank provided. ______________________________________________________________
Construct: Quality/Performance Benefits 5. Please indicate the extent of your agreement with the following statements about your favorite beer (as mentioned in question one). Please place only one circle for each statement.
Strongly Disagree Strongly Agree
It has consistent quality. 1 2 3 4 5 6 7
It is well made. 1 2 3 4 5 6 7
It has an acceptable standard of quality. 1 2 3 4 5 6 7
It has poor craftsmanship. 1 2 3 4 5 6 7
It would last a long time among other brands of beer. 1 2 3 4 5 6 7
It would perform consistently. 1 2 3 4 5 6 7
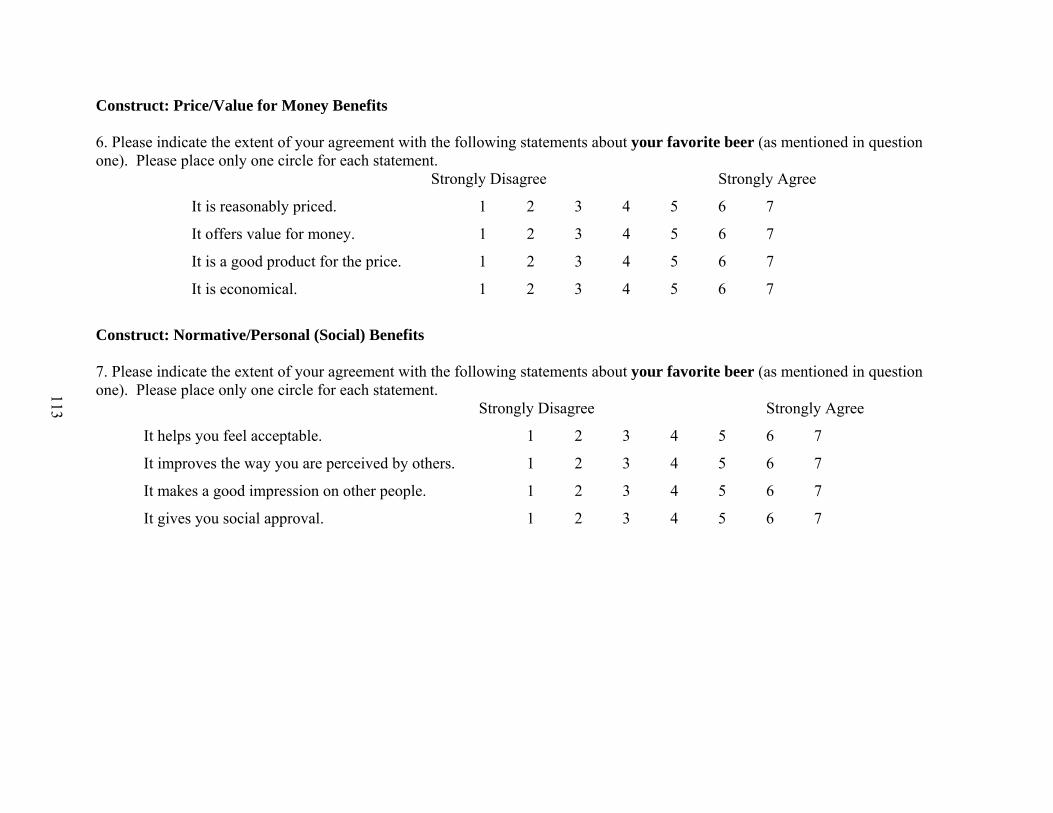
113
Construct: Price/Value for Money Benefits 6. Please indicate the extent of your agreement with the following statements about your favorite beer (as mentioned in question one). Please place only one circle for each statement.
Strongly Disagree Strongly Agree
It is reasonably priced. 1 2 3 4 5 6 7
It offers value for money. 1 2 3 4 5 6 7
It is a good product for the price. 1 2 3 4 5 6 7
It is economical. 1 2 3 4 5 6 7
Construct: Normative/Personal (Social) Benefits 7. Please indicate the extent of your agreement with the following statements about your favorite beer (as mentioned in question one). Please place only one circle for each statement.
Strongly Disagree Strongly Agree
It helps you feel acceptable. 1 2 3 4 5 6 7
It improves the way you are perceived by others. 1 2 3 4 5 6 7
It makes a good impression on other people. 1 2 3 4 5 6 7
It gives you social approval. 1 2 3 4 5 6 7

114
Construct: Emotion Benefits 8. Please indicate the extent of your agreement with the following statements about your favorite beer (as mentioned in question one). Please place only one circle for each statement. Strongly Disagree Strongly Agree
It is a product that you enjoy. 1 2 3 4 5 6 7
Things about it make you want to use it. 1 2 3 4 5 6 7
It makes you feel relaxed. 1 2 3 4 5 6 7
It makes you feel good. 1 2 3 4 5 6 7
It gives you pleasure. 1 2 3 4 5 6 7
It evokes thoughts of happiness. 1 2 3 4 5 6 7
It soothes you. 1 2 3 4 5 6 7
It eliminates all fear. 1 2 3 4 5 6 7
It eliminates all anger. 1 2 3 4 5 6 7
It makes you anxious. 1 2 3 4 5 6 7
It makes you want to use it. 1 2 3 4 5 6 7
Construct: Environment (Stewardship) Benefits 9. Please indicate the extent of your agreement with the following statements about your favorite beer (as mentioned in question one). Please place only one circle for each statement.
Strongly Disagree Strongly Agree
It is produced in an environmentally friendly way. 1 2 3 4 5 6 7
It is made without polluting the environment. 1 2 3 4 5 6 7
It is made by people who care for the environment. 1 2 3 4 5 6 7

115
Construct: Health Benefits 10. Please indicate the extent of your agreement with the following statements about your favorite beer (as mentioned in question one). Please place only one circle for each statement.
Strongly Disagree Strongly Agree
It comes with lots of health benefits. 1 2 3 4 5 6 7
It promotes one’s health when enjoyed in moderation. 1 2 3 4 5 6 7
It is a good way to relieve your stress. 1 2 3 4 5 6 7
It glorifies unhealthy drinking behaviors. 1 2 3 4 5 6 7
Construct: Exploratory Shopping Behaviors 11. Please indicate the extent of your agreement with the following statements (place only one circle for each statement).
Strongly Disagree Strongly Agree
I have little interest in fads and fashions. 1 2 3 4 5 6 7
I like to shop around and look at displays. 1 2 3 4 5 6 7
I shop around a lot for my clothes just to find out more about the latest styles. 1 2 3 4 5 6 7
I hate window shopping. 1 2 3 4 5 6 7
12. Please indicate the extent of your agreement with the following statements (place only one circle for each statement). When I eat out, I like to try the most unusual items the restaurant serves, even if I am not sure I would like them.
Strongly Disagree 1 2 3 4 5 6 7 Strongly Agree
When I go to a restaurant, I feel it is safer to order dishes I am familiar with.
Strongly Disagree 1 2 3 4 5 6 7 Strongly Agree

116
I am very cautious in trying new/different products.
Strongly Disagree 1 2 3 4 5 6 7 Strongly Agree
I would rather wait for others to try a new store or restaurant than try it myself.
Strongly Disagree 1 2 3 4 5 6 7 Strongly Agree
I never buy something I don’t know about at the risk of making a mistake.
Strongly Disagree 1 2 3 4 5 6 7 Strongly Agree
13. Please indicate the extent of your agreement with the following statements (place only one circle for each statement). A new store or restaurant is not something I would be eager to find out about.
Strongly Disagree 1 2 3 4 5 6 7 Strongly Agree
Investigating new brands of grocery and other similar products is generally a waste of time.
Strongly Disagree 1 2 3 4 5 6 7 Strongly Agree
When I hear about a new store or restaurant, I take advantage of the first opportunity to find out more about it.
Strongly Disagree 1 2 3 4 5 6 7 Strongly Agree
Construct: Susceptibility to Interpersonal Influence 14. Please indicate the extent of your agreement with the following statements (place only one circle for each statement).
I often consult other people to help choose the best alternative available from a product class.
Strongly Disagree 1 2 3 4 5 6 7 Strongly Agree
If I want to be like someone, I often try to buy the same brands that they buy.
Strongly Disagree 1 2 3 4 5 6 7 Strongly Agree
It is important that others like the products and brands I buy.

117
Strongly Disagree 1 2 3 4 5 6 7 Strongly Agree
To make sure I buy the right product or brand, I often observe what others are buying and using.
Strongly Disagree 1 2 3 4 5 6 7 Strongly Agree
I rarely purchase the latest fashion styles until I am sure my friends approve of them.
Strongly Disagree 1 2 3 4 5 6 7 Strongly Agree
I often identify with other people by purchasing the same products and brands they purchase.
Strongly Disagree 1 2 3 4 5 6 7 Strongly Agree
If I have little experience with a product, I often ask my friends about the product.
Strongly Disagree 1 2 3 4 5 6 7 Strongly Agree
When buying products, I generally purchase those brands that I think others will approve of.
Strongly Disagree 1 2 3 4 5 6 7 Strongly Agree
I like to know what brands and products make good impressions on others.
Strongly Disagree 1 2 3 4 5 6 7 Strongly Agree
I frequently gather information from friends or family about a product before I buy.
Strongly Disagree 1 2 3 4 5 6 7 Strongly Agree
If other people can see me using a product, I often purchase the brand they expect me to buy.
Strongly Disagree 1 2 3 4 5 6 7 Strongly Agree
I achieve a sense of belonging by purchasing the same products and brands that others purchase.
Strongly Disagree 1 2 3 4 5 6 7 Strongly Agree

118
Construct: Consumption Behavior 15. On average how many days a week do you drink beer (place a circle around the appropriate number)? 0 1 2 3 4 5 6 7 16. How much beer on average do you drink (one drink = 12 oz. bottle and/or can) in a one occasion? (Please do not include mixed drinks or other drinks that are not considered beer for your answer) 0 1 2 3 4 5 6 7 8 9 10 11 12 13 14 15 16 17+ Construct: Product Category Involvement 17. Please indicate the extent of your agreement with the following statements (place only one circle for each statement).
Strongly Disagree Strongly Agree
Generally, I am someone who finds it important what beer he or she buys. 1 2 3 4 5 6 7
Generally, I am someone who is interested in the kind of beer he or she buys. 1 2 3 4 5 6 7
Generally, I am someone whom it means a lot what beer he or she buys. 1 2 3 4 5 6 7
Please take a few moments to tell us about yourself by circling the appropriate responses. Please keep in mind that your information will remain completely confidential and anonymous. 18. What is your gender?
1) Male 2) Female
19. What is your current age (write in number in years)? _________

119
20. What is your current year as a student?
1) Freshman 2) Sophomore 3) Junior 4) Senior 5) Master’s Graduate Student
6) PHD Student 7) Other Please Specify _________________________________________
21. What is your current employment status? 1) Full Time 2) Part Time 3) Unemployed
22. What is your current major? 1) Public Relations 2) Advertising 3) Telecommunications 4) Journalism
5) Other Please Specify _________________________
23. Please circle your current living situation? 1) Live with Parents
2) Live alone (Apt/Home) on campus
3) Live alone (Apt/Home) off campus
4) Live with roommate(s) (Apt/Home) on campus
5) Live with roommate(s) (Apt/Home) off campus
6) Fraternity or Sorority House
7) Live in a Dorm Alone
8) Live in a Dorm with roommate(s)
9) Other Please Specify
___________________________
24. Are you a member of a fraternity or sorority?
1) Yes 2) No
Thank you for your participation in this study and remember if you do drink, then please drink responsibly!!!

120
REFERENCES
Aaker, D. A., Batra, R. and Myers, J. G. (1992), Advertising Management, 4th ed, Prentice Hall, Englewood Cliffs, NJ.
Ajzen, I. and Fishbein, M. (1980), Understanding Attitudes and Predicting Social Behavior, Englewood Cliffs, NJ: Prentice-Hall, Inc.
Alcohol makers tread tricky path in marketing to college students. (2005) USA Today, Money, pp. 01b.
Alvarez, B. A. and Casielles, R. V. (2005), Consumer evaluations of sales promotion: the effect on brand choice, European Journal of Marketing, Vol. 39, No. ½, pp. 54-70.
Andorfer, J. B. (2005), Got Beer? A-B plots health pitch, Advertising Age, Vol. 76, Issue 42.
Auger, P., Burke, P., Devinney, T. M., and Louviere, J. J. (2003), What will consumers pay for social product features?, Journal of Business Ethics, Vol. 42, No. 3, pp. 281-304.
Babor, T. F., and Mendelson, J. H., Greenberg, I., and Kuehnle, J. (1978), Experimental analysis of the ‘happy hour: effects of purchase price on alcohol consumption’, Psychopharmocology, Vol. 58, pp. 35-41.
Bagozzi, R. P. (1986), Principles of Marketing Management, Science Research Associates, Chicago, IL.
Bagozzi, R. P., Baumgartner, H., and Yi, Y. (1992), State versus action orientation and the theory of reasoned action: application to coupon usage, Journal of Consumer Research, Vol. 18, March, pp. 505-518.
Ballantyne, R., Warren, A., and Nobbs, K. (2006), The evolution of brand choice, Brand Management, Vol. 13, No. 4/5, pp. 339-352.
Bandura, A. (1977). Social Learning Theory. New York: Prentice Hall. Basler, R. P. (1953), Collected works of Abraham Lincoln, Vol. 1, New Brunswick, New Jersey:
Rutgers University Press.
Batra, R., Homer, M.P., and Kahle, L. R. (2001), Values, susceptibility to normative influence, and attribute importance Weights: A Nomological Analysis, Journal of Consumer Psychology, Vol. 11, No. 2, pp. 115-128.
Baumgartner, B. (2003), Measuring changes in brand choice behavior, Schmalenbach
Business Review. Vol. 55, pp. 242-256.

121
Bearden, W. O. and Etzel, M. J. (1982), Reference group influence on product and brand purchase decisions, Journal of Consumer Research, Vol. 9, No. 2, pp. 183-194.
Bearden, W., Netemeyer, R. G., and Tell, J. E. (1989), Measurement of consumer susceptibility to interpersonal influence, Journal of Consumer Research, Vol. 15, No. 4, pp. 473-481.
Beer has an image crisis; wine and spirits gain. (2005) USA Today, 1AP. Beer’s Bad Rap for Carbs Unjustified. (2006), USA Today Magazine, Vol. 134, Issue
2731.
Belch, G. E. and Belch, M. A. (1995), Introduction to Advertising and Promotion: An Integrated Marketing Communications Perspective, 3rd ed., Boston, MA: Irvin.
Belk, R. (1974), An exploratory assessment of situational effects in buyer behavior, Journal of Marketing Research, Vol. 11, pp. 156-163.
Bentz, Y. and Merunka, D. (2000), Neural networks and the multinomial logit for brand choice modelling: a hybrid approach, Journal of Forecasting, Vol. 19, pp. 177-200.
Berden, T. P. J., Brombacher, A. C., and Sander, P. C. (2000), The building bricks of product quality: An overview of some basic concepts and principles, International Journal of Production Economics, Vol. 67, pp. 3-15.
Berné, C., Contiñas, M., Elorz, M., and Múgica, J. M. (2004), The use of retail store database for brand choice analysis, Int. Rev. of Retail, Distribution and Consumer Research, Vol. 14, No. 1, pp. 19-29.
Boulard, G. (2005), Drinking too much, too: trying to find an answer to the persistent habit or binge drinking among young people vexes the nation’s policymakers. State Legislatures, pp. 12-15.
Bowlby, J. (1979), The Making and Breaking of Affectional Brands, London: Tavistock. Bozinoff, L. and Victor, R. J. (1984), Recall and recognition memory for product attributes and
benefits, Advances in Consumer Research, Vol. 11, No. 1, pp. 348-352.
Braglia, M. and Petroni, A. (2000), Stakeholders’ influence and internal championing of product stewardship in the Italian food packaging industry, Journal of Industrial Ecology, Vol. 4, No. 1, pp. 75-92.
Bruen, J. (2002), Product liability: The role of the product steward, Risk Management, Vol. 49,
No. 2, pp. 34-35. Calantone, R. and Knight, G. (2000), The critical role of product quality in the international
performance of industrial firms, Industrial Marketing Management, Vol. 29, pp. 493-506.

122
Charlton, P. and Ehrenberg, A. S. C. (1973), McConnell’s experimental brand choice data, Journal of Marketing Research, Vol. X, pp. 302-307.
Chib, S., Seetharaman, P. B., and Strijnev, A. (2004), Model of brand choice with a no purchase option calibrated to scanner-panel data, Journal of Marketing Research, Vol. XLI, pp. 184-196.
Choi, C. S. and Coughlan, A. T. (2006), Private label positioning: Quality versus feature differentiation from the national brand, Journal of Retailing, Vol. 82, No, 2, pp. 79-93.
Cioletti, J. (2006), Spread the brews, Beverage World, Vol. 125, No. 1. Christie, J., Fisher, D., Kozup, J. C., Smith, S., Burton, S., and Creyer, E. H. (2001), The effects
of bar-sponsored alcohol beverage promotions across binge and nonbinge drinkers, Journal of Public Policy and Marketing, Vol. 20, No. 2, pp. 240-253.
Coate, D. and Grossman, M. (1988), Effects of alcoholic beverage prices and legal drinking ages on youth alcohol use, Journal of Law and Econometric Evidence. pp. 145-171.
Collins, R. L., Schell, T., Ellickson, P. L., and McCaffrey, D. (2003), Predictors of beer advertising awareness among eighth graders, Addiction, Vol. 98, pp. 1297-1306.
Coxe, D. (2004), Sex is out, carbs are in, Maclean’s, Vol. 117, No. 5. Day, J. C. and Jamieson A. (2005) School enrollment: 2000, U.S. Census Bureau. Washington,
DC: U.S. Government Printing Office. Retrieved April 12, 2006 from http://www.census.gov/prod/2003pubs/c2kbr-26.pdf
Domestic ad spending by category (2006), Advertising Age, from TNS Media
Intelligence. Retrieved September 27, 2006, from www.adage.com Eagly, A. H. and Shelly, C. (1993), The Psychology of Attitudes. Orlando, FL: Harcourt Brace
Jovanovich, Inc.
Ennew, C. T., Reed, G. V., and Binks, M. R. (1993), Importance-performance analysis and the measurement of service quality, European Journal of Marketing, Vol. 27, No. 2, pp. 59-70.
Erdem, T. and Swait, J. (2004), Brand credibility, brand consideration, and choice, Journal of Consumer Research, Vol. 31, pp. 191-198.
Faden, Vivian B. (2006), Trends in initiation of alcohol use in the United States 1975 to 2003, Alcoholism: Clinical and Experimental Research, Vol. 30, No. 6, pp. 1011-1022, June, from NHSDA 1998.

123
Fall 2005 Product Beverages. (2006), MRI+ Mediamark Internet Reporter database 2006, accessed April 12, 2006
Farquar, P. H. (1989), Managing brand equity, Marketing Research, Vol. 1, pp. 24-
33. Feltham, T. S. (1998), Leaving home: Brand purchase influences on young adults, Journal of
Consumer Marketing, Vol. 15, No. 4, pp. 372-385.
Fornell, C., Johnson, M. D., Anderson, E. W., Cha, J. and Bryant, B. E. (1996), The American customer satisfaction index: Nature, purpose, and findings, Journal of Marketing, Vol. 60, pp. 7-18.
Fry, J. N. (1971), Personality variables and cigarette brand choice, Journal of Marketing Research, Vol. III, pp. 298-304.
Green, C. A., Perrin, N. A., and Polen, M. R. (2004), Gender differences in the relationships between multiple measures of alcohol consumption and physical and mental health, Alcohol Clin Exp Res, Vol. 28, pp. 754-764.
Grossman, M., Coate, D., and Arluck, G. M. (1987), Price sensitivity of alcoholic beverages in the United States, Control Issues in Alcohol Abuse Prevention: Strategies for States and Communities, Harold H. Holder ed., JAI Press, Inc., Greenwich, Conn., pp. 169-198.
Gruenewald, P., Madden, P., and Janes, K. (1992), Alcohol availability and formal power and resources of state alcohol beverage control agencies, Alcohol Clin Exp Res, Vol. 16, pp. 591-597.
Gruenewald, P., Miller, A., and Treno, A. (1993), Alcohol availability and the ecology of drinking behavior, Alcohol Health Res World, Vol. 17, pp. 39-45.
Haley, R. I. (1968), Benefit segmentation: A decision-oriented research tool, Journal of Marketing, Vol. 32, pp. 30-35.
Hartford, T. C., Weschsler, H., and Rohman, M. (1983), ‘The structural context of college drinking’, Journal of Studies on Alcohol, Vol. 44, pp. 722-732.
Havan, C. and Shaver, P. R. (1994), Attachment as an organizational framework for research on close relationships, Psychological Inquiry, Vol. 5, pp. 1-22.
Hays, R. (1985), An integrated value-expectancy theory of alcohol and other drug use, British Journal of Addiction, Vol. 80, pp. 379-384.
Helliker, K. and Ellison, S. (2005), Anheuser wants world to know beer is healthy, Wall Street Journal (Eastern edition), New York, N.Y., pp. B1.

124
Hoyer, W. D. and MacInnis, D. J. (2004), Consumer Behavior, 3rd Edition, Boston: Houghton Mifflin Company.
Hickle, G. T. and Stitzhal, D. (2003), Apportioning the responsibilities for product stewardship: A case for a new federal role, Environmental Quality Management, Vol. 12, No. 3, pp.1-16.
Hruschka, H. (2002), Market share analysis using semi-parametric attraction models, European Journal of Operational Research, Vol. 138, pp. 112-225.
Snider, M. (2006), IPods knock over beer mugs, USA Today; Section: Life, pp. 09d. taken from Spring 2006 Lifestyle and Media Study, Student Monitor.
Is the glass half-empty or half-full? (2004), Tufts University Health and Nutrition Letter, Vol. 22, No. 9.
Jessor, R. (1981), The perceived treatment environment in psychological theory and Research. In D. Magnusson (ed.), Toward a Psychology of Situations: An Interactionist Perspective, Hillsdale, NJ: Lawrence Erlbaum Associates.
Johnston, L. D., O’Malley, P.M., Bachman, J. G., and Schulenberg, J. E. (2004), Monitoring the Future National Survey Results on Drug Use, 1975-2003. Vol. II: College Students and Adults Ages 19-45, Bethesda, MD: National Institute on Drug Abuse, NIH Pubilication No. 04-5508.
Jones-Webb, R., Toomey, T., Short, B., Murray, D., Wagenaar, A., and Wolfson, M. (1997), Relationship among alcohol availability, drinking location, alcohol consumption, and drinking problem in adolescents, Subst Use Misuse, Vol. 32, pp. 219-228.
Kandel, D. B. (1980), Drug and drinking behavior among youth, In A. Inkeles, N.J. Smelser and R. Turner (eds.), Annual Review of Sociology, Vol. 6, pp. 235-285, Palo Alto, CA: Annual Reviews, Inc.
Keller, K. L. (1993), Conceptualizing, measuring, and managing customer-based brand equity, Journal of Marketing, Vol. 57, No. 1, pp. 1-22.
Klasky, A. L. (2006), Drink to your health?, Scientific American Special Edition, Vol. 16, No. 4.
Knibbe, R. A., Oostveen, T., and Van de Goor, I. (1991), Young people’s alcohol consumption in public places: Reasoned behavior or related to the situation? British Journal of Addiction, Vol. 86, pp. 1425-1433.
Kondo, K. (2004), Beer and health: Preventative effects of beer components on lifestyle related
diseases, BioFactors, Vol. 22, pp. 303-310.

125
Kuo, M., Wechsler, H., Greenberg, P., and Lee, H. (2003), The marketing of alcohol to college students: The role of low prices and special promotions, American Journal of Preventive Medicine, Vol. 25, No. 3, pp. 204-211.
Lai, A. (1991), Consumption situation and product knowledge in the adoption of a new product, European Journal of Marketing, Vol. 25, No. 10, pp. 55-67.
Lambert, Z. V. (1972), Price and choice behavior, Journal of Marketing Research, Vol. IX, pp. 35-40.
Lancaster, K. J. (1971), Variety, Equity and Efficiency, New York: Columbia Press. Laurent, G. and Kapferer, J. (1985), Measuring consumer involvement profiles, Journal of
Marketing Research, Vol. 22, No. 1, pp. 41-53.
Léger, J. and Scholz, D. (2004), The fickle beer consumer, Marketing Magazine, Vol. 109, No. 17.
Levy, S. and Sheflin, N. (1983), New evidence on controlling alcohol use through price, Journal
of Studies on Alcohol, Vol. 44, pp. 929-937.
Levy, S. and Sheflin, N. (1985), The demand for alcoholic beverages: An aggregate time series analysis, Journal of Public Policy and Marketing, Vol. 4, No. 1, pp. 47-54.
Loftus, P. (2005), Study brews on health benefits of hops, Wall Street Journal (Eastern edition), pp. B4C.
Mayhew, G. E. and Winer, R. S. (1992), An empirical analysis of internal and external reference prices using scanner data, Journal of Consumer Research, Vol. 19, June, pp. 62-70.
McGuire, W. J. (1968), Personality and susceptibility to social influence. In E. F. Borgetta and W. W. Lambert (eds), Handbook of Personality Theory and Research, Chicago: Rand McNally, pp. 1130-1187.
Miller, K. E. and Ginter, J. L. (1979), An investigation of situational variation in brand choice behavior and attitude, Journal of Marketing Research, Vol. XVI, pp. 111-123.
Netemeyer, R. G., Burton, S., and Johnston, M. (1991), Volitional and goal-directed
behaviors: A confirmatory analysis approach, Social Psychology Quarterly, Vol. 54, No. 2, pp. 87-100.
O’Callaghan, F. V., Chant, D. C., Callan, V. J., and Baglioni, A. (1997), Models of
alcohol use by young adults: An examination of various attitude-behavior theories, Journal of Studies on Alcohol, Vol. 58, No. 5, pp. 502-507.
126
Orth, U. R. (2005), Consumer personality and other factors in situational brand choice variation, Brand Management, Vol. 13, No. 2, pp. 115-133.
Orth, U. R., McDaniel, M. R., Shellhammer, T., and Lopetcharat, K. (2004), Promoting brand benefits: The role of consumer psychographics and lifestyle, Journal of Consumer Marketing, Vol. 21, No. 4, pp. 31-47.
Orth, U. R., McGarry Wolf, M., and Dodds, T. (2005), Dimensions of wine region equity and their impact on consumers preferences, Journal of Product and Brand Management, Vol. 14, No. 4, pp. 477-489.
Österberg, E. (1995), Do alcohol prices affect consumption and related problems? In: H. D. Holder and G. Edwards (eds.), Alcohol and Public Policy: Evidence and Issues. New York: Oxford University Press, pp. 145-163.
Papatla, P. and Krishnamurthi, L. (1996), Measuring the dynamic effects of promotions on brand choice, Journal of Marketing Research, Vol. XXXIII, pp. 20-35.
Park, C. W., Jaworski, B. J., and MacInnis, D. J. (1986), Strategic brand concept-image management, Journal of Marketing, Vol. 50, pp. 621-635.
Park, C. W. and Lessig, V. P. (1977), Students and housewives: Differences in susceptibility to reference group influence, Journal of Consumer Research, Vol. 4, No. 2, pp. 102-110.
Park, C. W. and Mittal, B. (1985), A theory of involvement in consumer behavior: Problems and issues, Research in Consumer Behavior, Vol. 1, pp. 201-232.
Puth, G., Mostert, P., and Ewing, M. (1999), Consumer perceptions of mentioned product and brand attributes in magazine advertising, Journal of Product and Brand Management, Vol. 8, No. 1, pp. 38-49.
Quester, P. G. and Smart, J. (1998), The influence of consumption situation and product
involvement over consumers’ use of product attributes, Journal of Consumer Marketing, Vol. 15, No. 3, pp. 220-238.
Raju, P. S. (1980), Optimum stimulation level: Its relationship to personality, demographics, and exploratory behavior, Journal of Consumer Research, Vol. 7, No. 3, pp. 272-282.
Ram, S. and Jung, H. (1989), The link between involvement, use innovativeness and product usage, Advances in Consumer Research, Vol. 16, pp. 160-166.
Redman, S., Sanson-Fisher, R. W., Wilkinson, C. Fahey, P., and Gibberd, R. W. (1987),
Agreement between two measures of alcohol consumption, Journal of Studies on Alcohol, Vol. 48, pp. 104-108.

127
Reeves, C. A. and Bednar, D. A. (1994), Defining quality: Alternatives and implications, Academy of Management Review, Vol. 18, No. 3, pp. 419-445.
Rhodes, P. (2005), 3 cheers for beer, Natural Health, Vol. 35, Vol. 9. Richins, M. L. and Bloch, P. H. (1986), After the new wears off: The temporal context of
product involvement, Journal of Consumer Research, Vol. 13, No. 2, pp. 280-285.
Romaniuk, J. (2003), Brand attributes – ‘distribution outlets’ in the mind, Journal of Marketing Communications, Vol. 9, pp. 73-92.
Romaniuk, J. and Sharp, B. (2003), Measuring brand perceptions: Testing quantity and quality,
Journal of Targeting, Measurement and Analysis for Marketing, Vol. 11, No. 3, pp. 218-229.
Schlegel, R. P., Crawford, C. A., and Sanburn, W. D. (1977), Correspondence and mediational
properties of the Fishbein model: An application to adolescent alcohol use, Journal of Experimental Social Psychology, Vol. 13, pp. 421-430.
Schwartz, R. H., Farrow, J. A., Banks, B., and Giesel, A. E. (1998), Use of false ID cards and other deceptive methods to purchase alcoholic beverages during high school, Journal of Addictive Diseases, Vol. 17, No. 3, pp. 25-33.
Simonson, I., Carmon, Z., and O’Curry, S. (1994), Experimental evidence on the negative effect of product features and sales promotions on brand choice, Marketing Science, Vol. 13, No. 1, Winter, pp. 23-40.
Singh, V. P., Hansen, K. T., and Sachin, G. (2005), Modeling preferences for common
attributes in multicategory brand choice, Journal of Marketing Research, Vol. XLII, pp. 195-209.
Smith, W. (1956), Product differentiation and market segmentation as alternative marketing strategies, Journal of Marketing, Vol. 21, pp. 3-8.
Stafford, J. E. and Cocanougher, B. A. (1977), Reference group theory. Selected Aspects of Consumer Behavior, Washington, DC: Superintendent of Documents, U.S. Government Printing Office, pp. 361-380.
Sweeney, J. C. and Soutar, G. N. (2001), Consumer perceived value: The development of a multiple item scale. Journal of retailing, Vol. 77, No. 2, pp. 203-220.
Thompson, B. (1995), Stepwise regression and stepwise discriminant analysis need not apply
here: A guidelines editioral, Educational and Psychological Measurement, Vol. 55, No. 4, pp. 525-535.

128
Thomson, M., MacInnis, D. J., and Park, C. W. (2005), The ties that bind: Measuring the strength of consumers’ emotional attachments to brands, Journal of Consumer Psychology, Vol. 15, No. 1, pp. 77-91.
Trafimow, D. (1996), The importance of attitudes in the prediction of college students’ intentions
to drink, Journal of Applied Social Psychology, Vol. 26, No. 24, pp. 2167-2188. Trafimow, D. and Fishbein, M. (2001), The moderating effect of behavior type on the subjective
norm-behavior relationship, The Journal of Social Psychology, Vol. 134, No. 6, pp. 755-763.
Uncles, M. D. and Ehrenberg, A. S. (1990), Brand choice among older consumers, Journal of Advertising Research, August/September, Vol. 30, No. 4, pp. 19-22.
U.S. market share leaders. (2007), Advertising Age, from TNS Media Intelligence.
Retrieved August 11, 2007, from www.adage.com Van Trijp, H. M. C. (1994), Product-related determinants of variety-seeking behavior for foods.
Appetite, Vol. 22, pp. 1-10.
Van Trijp, H. C. M., Hoyer, W. D., and Inman, J. (1996), Why switch? Product category level explanations for true variety-seeking behavior, Journal of Marketing Research, Vol. 33, No. 3, pp. 281-292.
Vazquez, R., Belen del Rio, R., and Iglesias, V. (2002), Consumer-based brand equity: Development and validation of a measurement instrument, Journal of Marketing Management, Vol. 18, No. ½, pp. 27-48.
Viral can’t cure what ails ‘beast’. (2006), Advertising Age, Vol. 77, No. 42.
Wagner, U. and Taudes, A. (1986), A multivariate polya model of brand choice and purchase incidence, Marketing Science, Vol. 5, No. 3, pp. 219-244.
Wahlers, R. G., Dunn, M. G., and Etzel, M. J. (1986), The congruence of alternative OSL measures with consumer exploratory behavior tendencies, Advances in Consumer Research, Vol. 13, No. 1, pp. 398-402.
Walker, R. (2004), The idea of a beer with a ‘health benefit’ is debatable, but that’s
clearly what’s resonating, New York Times Magazine, Vol. 153, No. 52746, pp. 18. Wall, A., Hinson, R. E., and McKee, S. A. (1998), Alcohol outcome expectancies, attitudes
toward drinking and the theory of planned behavior, Journal of Studies on Alcohol, Vol. 59, No. 4, pp. 409-419.
Walsh, G. and Mitchell, V. (2005), Demographic characteristics to consumers who find it
difficult to decide, Marketing Intelligence and Planning, Vol. 23, No. 2/3, pp. 281-295.

129
White, T. and Pomponi, R. (2003), Gain a competitive edge by preventing recalls, Quality Progress, Vol. 36, No. 8, pp. 41-49.
Wilkie, W. L. (1986), Consumer Behavior, New York: John Wiley and Sons. Wilks, J. and Callan, V. J. (1990), A diary approach to analyzing young adults’ drinking events
and motivations, Australian Drug and Alcohol Review, Vol. 5, pp. 3-7.
Witt, R. E. (1969), Informal social group influence on consumer brand choice, Journal of Marketing Research, Vol. VI, pp. 473-476.
Wood, L. M. (2004), Dimensions of brand purchasing behavior: Consumers in the 18-24 age group, Journal of Consumer Behavior, Vol. 4, No. 1, pp. 9-24.
Woods, P. (2005), Good news about brews, Health, Vol. 19, No. 8. Woodside, A. G. and Fleck Jr., R. A. (1979), The case approach to understanding brand choice,
Journal of Advertising Research, Vol. 19, No. 2, pp. 23-30. Xiaohua, L. and Germain, R. (2003), Product quality orientation and its performance
implications in Chinese state-owned enterprises, Journal of International Marketing, Vol. 11, No. 2.
Yang, S., Allenby, M. G., and Fennell, G (2002), Modeling variation in brand preference: The roles of objective environment and motivating conditions, Marketing Science, Vol. 21, No. 1, pp. 14-21.
Zaichkowsky, J. L. (1985), Familiarity: Product use, involvement or expertise? In E. C. Hirschman and M. B. Holbrook (eds), Advances in Consumer Research, Vol. 12, Provo, UT: Association for Consumer Research.

130
BIOGRAPHICAL SKETCH
Dave Ritter ([email protected]) is a graduate student majoring in advertising
at the College of Journalism and Communications at the University of Florida. His research
focuses on brand choice, marketing, and consumer behavior. Dave completed his Associate of
Science in business administration from Lakeland College. In addition, Dave completed his
Bachelor of Science in marketing from the University of Illinois.