Embed Size (px)
Citation preview
Full Terms & Conditions of access and use can be found athttps://www.tandfonline.com/action/journalInformation?journalCode=rero20
Economic Research-Ekonomska Istraživanja
ISSN: (Print) (Online) Journal homepage: https://www.tandfonline.com/loi/rero20
Influences on mutual fund performance:comparing US and Europe using qualitativecomparative analysis
J. Edward Graham, Carlos Lassala & Belén Ribeiro Navarrete
To cite this article: J. Edward Graham, Carlos Lassala & Belén Ribeiro Navarrete (2020)Influences on mutual fund performance: comparing US and Europe using qualitativecomparative analysis, Economic Research-Ekonomska Istraživanja, 33:1, 3049-3070, DOI:10.1080/1331677X.2019.1696695
To link to this article: https://doi.org/10.1080/1331677X.2019.1696695
© 2020 The Author(s). Published by InformaUK Limited, trading as Taylor & FrancisGroup.
Published online: 09 Dec 2019.
Submit your article to this journal Article views: 1699
View related articles View Crossmark data
Citing articles: 1 View citing articles

Influences on mutual fund performance: comparing USand Europe using qualitative comparative analysis
J. Edward Grahama, Carlos Lassalab and Bel�en Ribeiro Navarretec
aDepartment of Economics and Finance, Cameron School of Business, University of North Carolina atWilmington, Wilmington, NC, USA; bDepartment of Corporate Finance, University of Valencia,Valencia, Spain; cCameron School of Business, University of North Carolina at Wilmington,Wilmington, NC, USA
ABSTRACTThis study examines the conditions that lead mutual funds tounderperform or outperform competitors. Using fuzzy-set qualita-tive comparative analysis (fsQCA), we draw upon extensiveresearch on fund returns to affirm and extend earlier discoveries.Fund performance (Morningstar ratings), features of the fundsthemselves, and characteristics of the fund managers are consid-ered. Positive Morningstar star and analyst ratings are necessaryconditions for funds to generate value (measured by Jensen’salpha). Funds with low management fees and low ongoing feeshave attractive Sharpe ratios and high returns. Likewise, largefunds with good Morningstar ratings have good Sharpe ratiosand returns, often when fund managers have short tenures.
ARTICLE HISTORYReceived 7 June 2019Accepted 31 October 2019
KEYWORDSfsQCA; fund features; fundmanager characteristics;Morningstar ratings; mutualfund performance
JEL CLASSIFICATIONG15; G23; G24
1. Introduction
In the social sciences, the research-consuming public repeatedly fails to act uponwidely published findings. This study affirms and extends earlier findings concerningmutual fund returns and risks, doing so using results from fuzzy-set qualitative com-parative analysis (fsQCA), a method that scholars rarely employ.
Financial economists have used variants of ordinary least squares (OLS) to exam-ine mutual fund returns (Kamstra, Kramer, Levi, & Wermers, 2017; Mu~noz, Vicente,& Ferruz, 2015). The goal is usually to discern whether professional managers addvalue to investors. We offer further support to these studies’ principal findings,namely that few mutual funds outperform tracker indexes or justify their high fees.
This paper compares mutual funds in Europe and the United States. FsQCA over-comes the assumption of linear relationships when explaining fund returns in termsof other variables. It provides a tool for making empirical and theoretical inroadsinto the debate on factors that influence mutual fund performance and adds value by
CONTACT Carlos Lassala [email protected]� 2020 The Author(s). Published by Informa UK Limited, trading as Taylor & Francis Group.This is an Open Access article distributed under the terms of the Creative Commons Attribution License (http://creativecommons.org/licenses/by/4.0/), which permits unrestricted use, distribution, and reproduction in any medium, provided the original work isproperly cited.
ECONOMIC RESEARCH-EKONOMSKA ISTRAŽIVANJA2020, VOL. 33, NO. 1, 3049–3070https://doi.org/10.1080/1331677X.2019.1696695

jointly considering the pillars that are used to assess the functioning of mutual fundsbut have not yet been analysed in the economic literature.
The mutual fund literature focuses on equity funds. Numerous equity fund studieshave reported return persistence over short periods (Bollen & Busse, 2005; Droms &Walker, 2001; Gruber, 1996; Malkiel, 1995; Otten & Bams, 2002) and in poor eco-nomic climates (Carhart, Carpenter, Lynch, & Musto, 2002). Ferson and Schadt(1996) measured fund performance in changing economic conditions.
Certain studies have shown that positive, abnormal returns are relatively small andoften fail to exceed the funds’ expenses (Droms & Walker, 1995; Jensen, 1968;Malkiel, 1995; Sharpe, 1966). Paradoxically, the perceived value of active managementdominates the reality: Returns justifying active management are in fact rare. Despitethis paradox, scholars conclude that finding successful funds ex ante is extremely dif-ficult (Cuthbertson, Nitzsche, & O’Sullivan, 2016). Surprisingly, the industry has con-tinued to grow.
So why do people invest in managed funds? Ostensibly, such funds add valuethrough asymmetric information advantages and the fund manager’s skills, therebyproviding positive returns (Agarwal, Mullally, Tang, & Yang, 2015). Daniel, Grinblatt,Titman, and Wermers (1997) showed that mutual funds exhibit some selectivity abil-ity. Future fund performance is influenced by fund features and fund managercharacteristics.
Fund ratings offer a way of evaluating funds. For ratings to be useful and valid,performance should reflect these ratings (Chen, Wang, & Yu, 2014). Some studieshave examined the predictive capacity of certain well-established mutual fund ratingsystems for the US market (Blake & Morey, 2000; Sharpe, 1998). Morningstar’s quali-tative and quantitative ratings are a common investment ratings instrument amongstinvestors and managers (Bolster & Trahan, 2013).
Aware of the importance of fund ratings, we assess fund performance as a functionof Morningstar ratings, fund features, the fund manager’s experience, and fund fees.Methodologically, the use of fsQCA in this study contributes to the literature on fac-tors that affect mutual fund performance (Ragin, 2006). Comparative methods, whichare based on set theory, seek causal configurations within an empirical data set(Rihoux & Ragin, 2009). Such methods are unhindered by the assumption that causalconditions are linear-additive. Net effects must also be analysed. Multiple regressionanalysis (MRA) effectively identifies symmetrical relationships, but empirical observa-tions often conceal other kinds of relationships (Fiss, 2011). Insightful combinationsof conditions usually have asymmetrical relationships with an outcome.
FsQCA focuses on asymmetrical relationships to identify sufficient or necessaryconditions for a certain outcome. FsQCA performs well when causation is complexand when different conditions yield identical results. Regression coefficients offer littleinsight when a high value of any one variable is not always associated with a highvalue of the dependent variable (Woodside, 2012a).
In fsQCA, the outcome occurs only when necessary conditions are present. In con-trast, sufficient conditions always lead to the outcome (Fiss, 2007). FsQCA provides anovel tool for making empirical and theoretical inroads into the debate on factorsthat influence mutual fund performance.
3050 J. E. GRAHAM ET AL.
The paper has the following structure. Section 2 discusses the literature and framesmutual fund performance in terms of Morningstar ratings, fund features, and fundmanager characteristics. Section 3 describes the data and analysis method. Section 4presents the results. Section 5 provides the conclusions, limitations, and managerialimplications. Finally, research opportunities are outlined.
2. Literature review
Extensive literature describes mutual fund performance in terms of a wide array offactors. Our paper extends this body of research, exploring the ability of Morningstarratings and other fund features to predict fund performance. These features are fundsize and fund age, the manager’s experience, and fund fees.
2.1. Morningstar star rating
The Morningstar star rating was introduced in 1985 by Morningstar, Inc. Its one- tofive-star scale lets investors easily evaluate funds based on risk-adjusted returns anddistinguish between funds with similar investment strategies (Del Guercio & Tkac,2008). Sharpe (1998) explored the properties of the rating system, underscoringits importance.
Star ratings are based on expected utility theory. The assumptions are (1) thatinvestors are more sensitive to poor outcomes than unexpectedly high returns and (2)that they are willing to forgo part of the expected return in exchange for greater cer-tainty of returns. These assumptions offer a prosaic reflection of the classic risk/return trade-off. Blake and Morey (2000), Blume (1998), and Morey (2002) describethe Morningstar rating methodology in detail. The rating quantitatively assesses afund’s past performance over the past 3, 5, and 10 years. In certain scenarios, estab-lishing a rating proves impossible. For example, funds that have overhauled theirinvestment strategy have insufficient data to be awarded a rating. The rankings orderfunds by their Morningstar risk-adjusted return scores. The top 10% of funds receivefive stars, the next 22.5% receive four stars, the next 35% receive three stars, the next22.5% receive two stars, and the bottom 10% of funds receive one star.
The rating overlooks basic mutual fund data such as analyst opinions, fund man-ager performance, and expense ratios. Accordingly, it assesses the fund’s managementquality but does not predict future performance. Carhart (1997) criticisesMorningstar ratings, noting that the star rating is a backward-looking measure. Assuch, it is of limited use to investors because past performance is typically a poor pre-dictor of future performance. The rating alone provides insufficient data for invest-ment decisions. Other characteristics that the rating does not cover are keyconsiderations when choosing a fund. The rating nevertheless flags funds that deservepotential investors’ attention.
But do Morningstar ratings in some way predict performance? Studies have docu-mented the importance of star ratings in investor allocation decisions (Del Guercio &Tkac, 2008; Sirri & Tufano, 1998). New cash flows from investors flock to funds withgood past performance ratings. Babalos, Doumpos, Philippas, and Zopounidis (2015)
ECONOMIC RESEARCH-EKONOMSKA ISTRAŽIVANJA 3051

indicate that Morningstar ratings are closely related to the efficiency of the funds.Jain and Wu (2000) reveal that despite attracting extra cash inflows, funds that adver-tise above-the-benchmark returns fail to provide superior returns in the followingperiod. Morningstar affirms in its prospectuses that star ratings are not predictors offuture performance, advocating caution from investors who are keen to extrapolate ahigh fund rating to superior future performance. Nevertheless, highly rated fundsexperience cash inflows that far exceed the cash outflows experienced by poorly ratedfunds (Sirri & Tufano, 1998). Examining performance across funds shows whetherthese cash flows are justified by subsequent fund performance (Blake & Morey, 2000).
Using common performance metrics, studies have assessed how well Morningstarstar ratings predict returns. Even before Morningstar’s ratings methodology changedin 2002, several studies had already showed that high star ratings were poor predic-tors of future superior performance (Blake & Morey, 2000; Morey, 2005). After 2002,Gottesman and Morey (2006) found that the rating system had got better at predict-ing future performance. Kr€aussl and Sandelowsky (2007) refuted these findings,reporting that predictions based on star ratings could not beat a random walk.Gerrans (2006) and F€uss, Hille, Rindler, Schmidt, and Schmidt (2010) also failed tofind support for the ratings’ predictive power.
2.2. Morningstar analyst ratings
Investors and advisors operating in the current financial environment need objective,independent, transparent reports on mutual funds. Qualitative analysis of funds con-siders overall investment quality and helps investors understand how a particularfund can contribute to and complement their existing investment portfolios. In 2011,analyst ratings began to provide overall mutual fund ratings. Based on analysts’ opin-ions regarding whether funds will outperform benchmarks over the market cycle,analyst ratings are forward-looking qualitative and quantitative analyses of mutualfunds’ competitive advantages (or shortcomings). A report on each qualified fundaccompanies the Morningstar analyst rating. Analyst ratings identify funds that areappropriate for particular investor portfolios and risk tolerances (Haslem, 2014).
Morningstar is an independent, well-known, credible source of investment advice,so the market highly values Morningstar analyst ratings (Bolster & Trahan, 2013).Ratings may affect investors’ decisions, leading to a fund flow response to ratings.The impact of analyst ratings on future fund flows may incentivise fund managers toimprove in key areas that undermine their analyst ratings.
Morningstar analysts evaluate five pillars that have proven critical to a fund’s long-term risk-adjusted performance. Analysts rate each pillar as positive, neutral, or nega-tive. The fund’s overall rating depends on the following five pillars (Armstrong,Genc, & Verbeek, 2017):
Parent: The parent company is evaluated in key areas, including shareholder struc-ture, incentive compensation system, stability of management teams, and corporateculture. The parent company is important for long-term investment.
People: Many people contribute to the fund’s investment process. The qualityassessment of the management significantly influences the rating. Team experience,
3052 J. E. GRAHAM ET AL.
manager temperament, manager workload, analytical support, incentive structure, andinformation flow are amongst the factors that are analysed.
Performance: Does the manager add value? Lucky and talented managers oftenresemble one another. Analysts focus on the sources of performance, the risks themanager has taken, and the performance of the same managers at the helm ofother accounts.
Price: Fees are good predictors of future performance. Understanding whether thefund offers good value versus similar funds is important.
Process: Strategy is one of the keys to the fund’s success, so analysts evaluate thefund’s investment strategy and its implementation. They assess whether the strategysuits the manager’s skillset and the fund’s resources. They also evaluate the risksattached to the strategy.
Studies suggest that investors consider Morningstar ratings when picking well-per-forming funds. The result is higher inflow to higher rated funds. Armstrong et al.(2017) examined investors’ responses to analyst ratings. Overall, ratings influenceinvestor allocation decisions. But the lack of clarity regarding whether ratings providevaluable information on long-term performance is a key motivator of the pre-sent study.
Positive ratings have three levels: Gold, Silver, or Bronze. Neutral and Negative arethe alternative ratings. Negative ratings have only one level, so positive ratings aremore nuanced. By awarding positive ratings to certain funds, Morningstar analystsexpress the belief that these funds will outperform competitors in the long term.Through positive ratings, analysts convey their beliefs regarding funds’ strengths orweakness. Each analyst rating is now described. The ratings appear in descendingorder of expected performance.
� Positive ratings: Gold funds are outstanding. Based on the five assessment pillars,these funds have earned the analysts’ full conviction that their performance will beexcellent. Silver funds have notable advantages in several but not all of the five pil-lars. These strengths give analysts a high level of conviction. The advantages ofBronze funds outweigh the disadvantages. The analysts’ conviction is sufficient forthe fund to warrant a positive rating.
� Neutral ratings: Although the returns of these funds are not excellent, their behav-iour is no worse than average.
� Negative ratings: These funds have at least one flaw that it is believed will signifi-cantly affect future performance. They are considered inferior to their peers.
2.3. Performance and fund characteristics
Numerous fund performance studies provide evidence of the relation between per-formance and fund features such as size, manager tenure, and fees (Cuthbertsonet al., 2016; Golec, 1996). Others, like Agarwal et al. (2015) have affirmed that theperformance decline is more pronounced with greater information asymmetry. Wenow discuss these features.
ECONOMIC RESEARCH-EKONOMSKA ISTRAŽIVANJA 3053
2.3.1. Fund ageThe effect of fund age on performance is unclear (Cremers & Petajisto, 2009;Cuthbertson et al., 2016; Golec, 1996; Otten & Bams, 2002). Peterson, Petranico,Riepe, and Xu (2001) and Prather, Bertin, and Henker (2004) showed that youngerfunds perform better than older funds or that fund age and performance bear littlerelation. Younger funds may focus more on management, but this advantage is coun-tered by higher start-up costs. Gregory, Matatko, and Luther (1997) suggest thatyounger mutual funds’ performance might be affected by an ‘investment learningperiod’, reporting that younger funds tend to be smaller than older funds. Thatyounger funds sometimes outperform older funds is interesting, given that survivor-ship bias would favour the older funds.
2.3.2. Fund sizeFund size (net assets) influences fund management. The relationship between fundsize and fund performance remains unclear. Numerous investigations of the potentialeffect of size on fund performance are inconclusive. Droms and Walker (1995) actu-ally reported a negative relationship between fund size and performance, explainingthis negative relationship by citing larger funds’ more diversified portfolios, whichhave lower risk and consequently lower returns. Babalos, Mamatzakis, and Matousek(2015) revealed that investors should be aware that larger funds have reduced flexibil-ity, which offers inferior performance when markets are turbulent.
Chen, Hong, Huang, and Kubik (2004) reported that larger funds offer substantialsavings because of their scale but that fund size actually erodes performance. Bassoand Funari (2017) studied a set of European equity mutual funds and found thatthere is no relationship between size and performance but that there is a positive sizeeffect for large funds in comparison with smaller ones.
Other research also implies that performance deteriorates with fund size(Kacperczyk & Seru, 2007; P�astor, Stambaugh, & Taylor, 2015; Pollet & Wilson,2008). Ding, Zheng, and Zhu (2015) provide evidence of a U-shaped relationshipbetween fund size and performance: As fund size increases, fund performance firstimproves but later declines. Some studies have linked fund size to fund fees. Forexample, Khorana, Servaes, and Tufano (2009) noted that larger funds often chargelower fees. The hypothesis positing the benefits of economies of scale receives littlesupport from the literature.
2.3.3. Manager tenureManager tenure proxies management experience and may influence mutual fund per-formance. Here, we use the number of years the manager has been managing thefund to explore links between experience and fund performance. Nevertheless, moststudies have shown that manager tenure has no significant effect on performance(Costa, Jakob, & Porter, 2006; Costa & Porter, 2003; Switzer & Huang, 2007).Peterson et al. (2001) suggested that managers that run funds for shorter periods areusually more alert and have greater incentives to perform. Asal (2016) noted that it isnot possible to determine the managers who will be successful in the future becauseinvestors need to invest ex ante not ex post. In contrast, Filbeck and Tompkins
3054 J. E. GRAHAM ET AL.
(2004) and Golec (1996) have argued that managers with longer tenures perform bet-ter. Consequently, investors would prefer to invest in funds run by experienced man-agers. The same researchers reported a significant positive relationship betweenmanagement tenure and performance, concluding that managers with more experi-ence analyse and process information more efficiently, so manager tenure may alsobe linked to lower fees. Fund investors learn to avoid excess sales expenses (Ban,2015). Financial education plays a relevant role in the retail financial market.
Andreu, Sarto, and Serrano (2015) found that younger managers or managers withshorter fund management careers outperform older managers. The reason for thisfinding is that that older managers are more risk averse, whereas younger managerstake greater risks, which lead to greater fund returns. Not all scholars share this opin-ion, though. For example, Alibakhshi, Reza, and Moghadam (2016) affirmed that anamateur investor can make similar investments to those of professionals. Other schol-ars have cited good versus bad luck as a key factor (Ayadi, Ben-Ameur, &Kryzanowski, 2016; Ayadi, Chaibi, & Kryzanowski, 2016; Blake, Caulfield, Ioannidis,& Tonks, 2017). Andreu and Puetz (2017) affirmed that individuals with universitydegrees can be found at either extreme: outstanding returns or devastating losses. Incontrast, individuals with two university degrees are more cautious investors and takefewer risks, so they achieve more modest returns. Finally, Andreu, Gargallo, Salvador,and Sarto (2015) argued that everything depends on the emotional and rational fac-tors that lie behind decisions, so the traditional model based on the laws of the mar-ket (i.e., prices offer a source of information) ceases to be efficient.
2.3.4. Fund feesTypically, mutual fund cost is measured by the ongoing charge figure, which is thesum of all fees charged by the fund that are deducted from the fund’s net asset value.The mutual fund literature commonly treats the management fee separately to analysethe relationship between management fees and performance. The way that mutualfund performance and fund fees relate to one another tests the value of active man-agement. Mutual fund investors pay for the benefits associated with the costs of thisinvestment. The manager’s skill should be reflected in better performance, which jus-tifies a higher management fee. In some cases, high management fees signify superiorinvestment skill, which leads to better performance (Golec, 1996). In fact, the manag-er’s skill may shape the relationship between fees and fund performance. Berkowitzand Kotowitz (2002) report a positive relationship between fees and performance byfunds managed by good managers. In contrast, for low-quality managers, the relation-ship between fees and performance is negative.
The literature on the relationship between fees and performance is inconclusive.Droms and Walker (1996) reported a significant positive relationship between fundreturns and fees. Overall, however, scarce empirical evidence supports the expectedpositive relationship between performance and fees. Gruber (1996) reported that feesfor the top performing funds are no higher than they are for other funds, also argu-ing that investors are motivated to buy actively managed funds and pay their feesbecause past performance can partially predict future performance.
ECONOMIC RESEARCH-EKONOMSKA ISTRAŽIVANJA 3055

Ban (2015) confirmed that higher sales expenses are not related to better perform-ance. Anagol, Marisetty, Sane, and Venugopal (2017) found that reducing commis-sions would slow the growth of the mutual funds market. Carhart (1997) and Golec(1996) reported that higher fees are actually associated with lower investment per-formance. Otten and Bams (2002) listed different types of fees and reported a nega-tive relationship between European mutual fund performance and these fees.
3. Data and method
3.1. Empirical data
Morningstar classifies mutual funds according to asset investment policy. Funds areclassified according to their current management style rather than the managementregulation. This classification adheres more to the actual policy of the fund than toany statement by the manager. In September 2016, we collected mutual fund datafrom the Morningstar mutual fund database. The sample comprised funds thatinvested in large-cap US equities and large-cap Eurozone equities only. Sampledfunds had to have Morningstar ratings and Morningstar analyst ratings. Data wereavailable for 224 mutual funds, 60 of which invested in the Eurozone and 164 ofwhich invested in the US.
All funds had their registered offices in Luxembourg. Luxembourg is the largestfund domicile in Europe and the second largest worldwide (after the United States).Luxembourg offers managers operational ease, favourable fiscal conditions, and a lowlevel of bureaucracy. Registering funds is simpler in Luxembourg than it is elsewhere,reducing registration costs. The Association of the Luxembourg Fund Industry(ALFI) promotes Luxembourg’s status as a leading international fund hub that invest-ors, policymakers, and industry representatives consider open, reliable, and innova-tive. According to the ALFI Annual Report 2015–2016, net assets under managementat the end of 2015 were e3.5 trillion, and 45.75% of all net sales in Europe wereattributed to Luxembourg-domiciled funds.
The Morningstar mutual fund database provides data on fund size (net assets), age(years since creation), and fees. Management fees and ongoing fees were consideredin this study. The management fee is the amount the fund manager charges for man-aging the fund. The fee is subject to a legal cap. It is automatically deducted dailyfrom the net asset value of the fund. The ongoing fee consists of all fund fees thatare deducted from the fund’s net asset value. It is calculated as total charges dividedby net assets. Morningstar takes these data from managers’ reports. We also gathereddata on the fund manager to assess the influence of the manager’s experience onfund performance. The Morningstar database provided the number of years the man-ager had been managing the fund. Thus, the set of causal conditions leading to theoutcome of high (or low) performance comprised two Morningstar ratings and fivefeatures of mutual funds and their managers.
To quantify managed mutual fund performance, the average annual return overthree years and two traditional portfolio performance metrics—the Sharpe ratio andJensen’s alpha—were used. Whereas the Sharpe ratio considers the fund’s total risk,Jensen’s alpha considers only the fund’s systematic risk (Morningstar, Inc, 2009). The
3056 J. E. GRAHAM ET AL.

performance measures (return and risk-adjusted return) were based on three years ofmonthly returns. For each Morningstar category, Morningstar uses standard bench-marks and the index from the fund’s prospectus. The standard benchmark forEurozone mutual funds is the MSCI EMU NR EUR index. Standard benchmarks forUS mutual funds are the Russell 1000 TR USD indices.
3.2. Method
Conditions and combinations of conditions are studied using the configurationalcomparative method (Meyer, Tsui, & Hinings, 1993). Configurational approaches arebuilt on the concept of equifinality, which treats configurations as different types ofcauses that lead to an outcome. Studying the combination of causes or their absencehas current real-world applicability (Ragin, 2008).
The sample limitations in social science research also make the configurationalcomparative method a good technique for reaching reliable conclusions when work-ing with a small number of cases (Collier, 1993; Fiss, 2007; Vassinen, 2012). Its usecan nonetheless be extended to larger samples (Ragin, 2006b). For Rihoux and Ragin(2009), the number of causal conditions should be between three and eight; Crilly(2011) confirmed that up to seven causal conditions could be studied.
Such methods are used to examine how conditions (or variables) combine to createoutcomes. Regression and linear regression analysis are not applicable in turbulenteconomic environments such the current one because this form of analysis maintainsthe values of all except one of the variables constants in the equation to explain varia-tions in some outcome. In fsQCA, conditions may be present or absent (Ragin,2000), as explained below.
As a configurational comparative method, fsQCA builds on set theory to investi-gate causal claims (Rihoux & Ragin, 2009). Configurational theory has a long historyas a data analysis method. Roig-Tierno, Gonzalez-Cruz, and Llopis-Martinez (2017)conducted a bibliometric analysis of the three variants of QCA (csQCA, fsQCA, andmvQCA), reporting a positive trend in fsQCA use. Finance research based on config-urational theory has appeared in top journals. Recently, there has been a surge in theuse of comparative methodologies in management research (e.g., Crespo-Herv�as,Calabuig-Moreno, Prado-Gasc�o, A~n�o-Sanz, & N�u~nez-Pomar, 2019). Methodologicalinnovations in QCA create new opportunities for analysis and enrich methodologicalpluralism in research (Kornelakis, 2018).
In this research, fsQCA is used to identify the conditions associated with mutualfunds than underperform or outperform competitors. FsQCA is useful when cases arebest understood as combinations (or configurations) of attributes that potentially leadto an outcome.
3.3. Why use a fuzzy-set approach in this study?
We contribute methodologically to research on what influences mutual fund perform-ance by testing our conceptual model using a configurational comparative technique,namely fsQCA. This approach identifies causal configurations from a data set of
ECONOMIC RESEARCH-EKONOMSKA ISTRAŽIVANJA 3057

empirical cases (Rihoux & Ragin, 2009). FsQCA deals with complex causal perspec-tives (Greckhamer, Misangyi, Elms, & Lacey, 2008) and focuses on asymmetric rela-tionships to report causal conditions that are sufficient to cause an outcome (similarto the concept of the dependent variable in other analyses). FsQCA has advantagesfor studying complex causation and identical outcomes (Mills, van de Bunt, & DeBruijn, 2006). Regression coefficients show the impact of variables; they do not indi-cate which individual variables are sufficient or necessary for an outcome (Woodside,Ko, & Huan, 2012). Necessary and sufficient conditions are analysed under a complexcausal approach. Necessary conditions imply that the outcome only occurs when thecausal condition is present (or absent). The analysis also considers sufficient condi-tions. Sufficient conditions indicate that a causal condition always leads to the out-come (Braumoeller & Goertz, 2000; Fiss, 2007).
The within-case analysis (Yin, 1994) was important to identify the relationshipsthat we later tested using fs/QCA software. Use of configurational theory as a dataanalysis method is a recent phenomenon. Using this method, scholars have publishedresearch in top international management or social science journals (Roig-Tiernoet al., 2017; Urue~na, Arenas, & Hidalgo, 2018). The method is based on algorithmsand Boolean algebra.
3.4. Procedure
We use fs/QCA Version 3.0 software, available at www.fsQCA.com. (Ragin & Davey,2016). Qualitative comparative analysis proceeds in several steps (Rihoux & Ragin,2009). The first step is to calibrate set membership. The aim is to group cases (Ragin,2008). Degree of membership of observations in fuzzy sets is evaluated for each con-dition. Set membership scores are not probabilities (Woodside, 2012a). Independentand dependent measures are transformed into sets. For many variables, binary valuesof 0 and 1 would be appropriate, and crisp sets could be used. Other variables aremore complex and require ordinal or continuous values. For these variables, fuzzysets should be based on substantive knowledge (Vis, 2012). Here, the researcherdecides on three breakpoints: when a case is ‘fully in’ the set (1.00) or full member-ship, ‘fully out’ of the set (0.00) or full non-membership, and ‘neither in nor out’ ofthe set (0.50) or the cross-over point. The cross-over point is the point of maximum(membership) ambiguity in the assessment of whether a case is more in or out of aset (Ragin, 2008). These breakpoints enable the calibration of values into membershipvalues; they are based on theoretical knowledge of previous situations. This techniqueis a combination of qualitative and quantitative methods.
The second step is to build a data matrix, which is known as the truth table(Schneider, Schulze-Bentrop, & Paunescu, 2010; Fiss, 2011; Schneider & Wagemann,2012). Researchers should keep configurations with at least one observation for fur-ther analysis. Kenworth and Hicks (2008) have recommended a consistency thresholdof 0.95, although this threshold should not be applied mechanically. Ragin (2008)argued that the analysis should capture at least 75% to 80% of cases. In the processof obtaining the solution, researchers should select the prime implicants with themost significance in managerial decision making.
3058 J. E. GRAHAM ET AL.
In the third step, Boolean algebra is used to derive combinations of causal condi-tions that produce the outcome. These conditions are minimally sufficient. The fs/QCA software uses the Quine-McCluskey algorithm (Quine, 1955). The truth tablealgorithm provides three solutions: complex, parsimonious, and intermediate (Ragin,2008). The complex solution is the most conservative solution, although it provideslittle insight into causal configurations. Complex solutions do not consider logicalremainders, so researchers generally do not use this solution in their analyses. Theparsimonious solution includes all simplifying assumptions. The intermediate solutionincludes simplifying assumptions and restricts logical remainders to only those thatare most plausible. The parsimonious and intermediate solutions should be reportedin most analyses.
Researchers must decide between the parsimonious and intermediate solutions,using the coverage and consistency (of each configuration) to reach this decision.Woodside (2012b) showed that the coverage index is analogous to the coefficient ofdetermination and that the consistency index is analogous to correlation. Ragin(2008, p. 44) noted that coverage is ‘the degree to which a cause or causal combin-ation [accounts for] instances of an outcome’, and consistency is ‘the degree to whichinstances of the outcome agree in displaying the causal condition thought to benecessary’. Consistency can range from 0 to 1 (Ragin, 2006a). Ragin (2008) has rec-ommended a minimum measure of consistency of 0.8 (preferably 0.85 for macro-leveldata).
4. Results
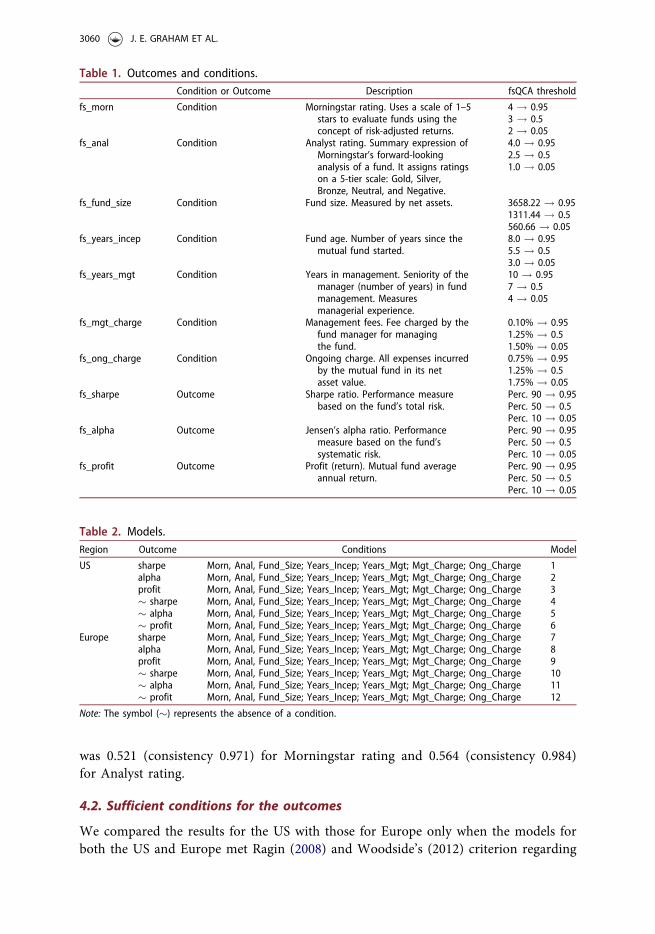
Table 1 shows the conditions and outcomes. The literature review justifies their rele-vance. Their measurement is explained in the empirical data section. Table 1 showsthe anchors used to calibrate each condition and outcome following the directmethod proposed by Ragin (2008). The consistency cut-off was 0.80 (Rihoux &Ragin, 2009).
We analysed the models presented in Table 2.
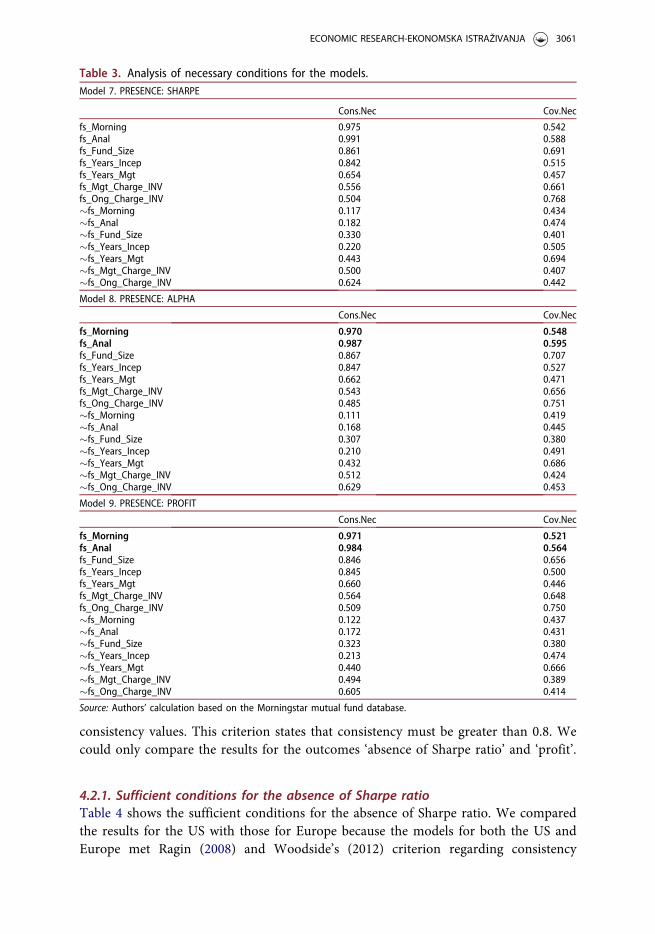
4.1. Necessary conditions
The analysis of necessary conditions identifies causal conditions that must occur forthe outcome to occur. Only fs_morn and fs_anal were necessary for the outcomes‘sharpe’, ‘alpha’, and ‘profit’ in models 7, 8, and 9 (Table 3). No other individual con-dition was necessary for any other outcome. Conditions are necessary only if theirconsistency exceeds 0.9 (Schneider et al., 2010).
The results show that relationships of necessity emerge for Europe but not for theUS. Furthermore, these relationships emerge for the presence of just three outcomesfor the conditions of Morningstar rating and Analyst rating.
First, for the outcome Sharpe, coverage was 0.542 (consistency 0.975) forMorningstar rating and 0.588 (consistency 0.991) for Analyst rating. Second, for theoutcome Alpha, coverage was 0.548 (consistency 0.970) for Morningstar rating and0.595 (consistency 0.987) for Analyst rating. Finally, for the outcome Profit, coverage
ECONOMIC RESEARCH-EKONOMSKA ISTRAŽIVANJA 3059
was 0.521 (consistency 0.971) for Morningstar rating and 0.564 (consistency 0.984)for Analyst rating.
4.2. Sufficient conditions for the outcomes
We compared the results for the US with those for Europe only when the models forboth the US and Europe met Ragin (2008) and Woodside’s (2012) criterion regarding
Table 1. Outcomes and conditions.Condition or Outcome Description fsQCA threshold
fs_morn Condition Morningstar rating. Uses a scale of 1–5stars to evaluate funds using theconcept of risk-adjusted returns.
4 ! 0.953 ! 0.52 ! 0.05
fs_anal Condition Analyst rating. Summary expression ofMorningstar’s forward-lookinganalysis of a fund. It assigns ratingson a 5-tier scale: Gold, Silver,Bronze, Neutral, and Negative.
4.0 ! 0.952.5 ! 0.51.0 ! 0.05
fs_fund_size Condition Fund size. Measured by net assets. 3658.22 ! 0.951311.44 ! 0.5560.66 ! 0.05
fs_years_incep Condition Fund age. Number of years since themutual fund started.
8.0 ! 0.955.5 ! 0.53.0 ! 0.05
fs_years_mgt Condition Years in management. Seniority of themanager (number of years) in fundmanagement. Measuresmanagerial experience.
10 ! 0.957 ! 0.54 ! 0.05
fs_mgt_charge Condition Management fees. Fee charged by thefund manager for managingthe fund.
0.10% ! 0.951.25% ! 0.51.50% ! 0.05
fs_ong_charge Condition Ongoing charge. All expenses incurredby the mutual fund in its netasset value.
0.75% ! 0.951.25% ! 0.51.75% ! 0.05
fs_sharpe Outcome Sharpe ratio. Performance measurebased on the fund’s total risk.
Perc. 90 ! 0.95Perc. 50 ! 0.5Perc. 10 ! 0.05
fs_alpha Outcome Jensen’s alpha ratio. Performancemeasure based on the fund’ssystematic risk.
Perc. 90 ! 0.95Perc. 50 ! 0.5Perc. 10 ! 0.05
fs_profit Outcome Profit (return). Mutual fund averageannual return.
Perc. 90 ! 0.95Perc. 50 ! 0.5Perc. 10 ! 0.05
Table 2. Models.Region Outcome Conditions Model
US sharpe Morn, Anal, Fund_Size; Years_Incep; Years_Mgt; Mgt_Charge; Ong_Charge 1alpha Morn, Anal, Fund_Size; Years_Incep; Years_Mgt; Mgt_Charge; Ong_Charge 2profit Morn, Anal, Fund_Size; Years_Incep; Years_Mgt; Mgt_Charge; Ong_Charge 3� sharpe Morn, Anal, Fund_Size; Years_Incep; Years_Mgt; Mgt_Charge; Ong_Charge 4� alpha Morn, Anal, Fund_Size; Years_Incep; Years_Mgt; Mgt_Charge; Ong_Charge 5� profit Morn, Anal, Fund_Size; Years_Incep; Years_Mgt; Mgt_Charge; Ong_Charge 6
Europe sharpe Morn, Anal, Fund_Size; Years_Incep; Years_Mgt; Mgt_Charge; Ong_Charge 7alpha Morn, Anal, Fund_Size; Years_Incep; Years_Mgt; Mgt_Charge; Ong_Charge 8profit Morn, Anal, Fund_Size; Years_Incep; Years_Mgt; Mgt_Charge; Ong_Charge 9� sharpe Morn, Anal, Fund_Size; Years_Incep; Years_Mgt; Mgt_Charge; Ong_Charge 10� alpha Morn, Anal, Fund_Size; Years_Incep; Years_Mgt; Mgt_Charge; Ong_Charge 11� profit Morn, Anal, Fund_Size; Years_Incep; Years_Mgt; Mgt_Charge; Ong_Charge 12
Note: The symbol (�) represents the absence of a condition.
3060 J. E. GRAHAM ET AL.
consistency values. This criterion states that consistency must be greater than 0.8. Wecould only compare the results for the outcomes ‘absence of Sharpe ratio’ and ‘profit’.
4.2.1. Sufficient conditions for the absence of Sharpe ratioTable 4 shows the sufficient conditions for the absence of Sharpe ratio. We comparedthe results for the US with those for Europe because the models for both the US andEurope met Ragin (2008) and Woodside’s (2012) criterion regarding consistency
Table 3. Analysis of necessary conditions for the models.Model 7. PRESENCE: SHARPE
Cons.Nec Cov.Nec
fs_Morning 0.975 0.542fs_Anal 0.991 0.588fs_Fund_Size 0.861 0.691fs_Years_Incep 0.842 0.515fs_Years_Mgt 0.654 0.457fs_Mgt_Charge_INV 0.556 0.661fs_Ong_Charge_INV 0.504 0.768�fs_Morning 0.117 0.434�fs_Anal 0.182 0.474�fs_Fund_Size 0.330 0.401�fs_Years_Incep 0.220 0.505�fs_Years_Mgt 0.443 0.694�fs_Mgt_Charge_INV 0.500 0.407�fs_Ong_Charge_INV 0.624 0.442
Model 8. PRESENCE: ALPHA
Cons.Nec Cov.Nec
fs_Morning 0.970 0.548fs_Anal 0.987 0.595fs_Fund_Size 0.867 0.707fs_Years_Incep 0.847 0.527fs_Years_Mgt 0.662 0.471fs_Mgt_Charge_INV 0.543 0.656fs_Ong_Charge_INV 0.485 0.751�fs_Morning 0.111 0.419�fs_Anal 0.168 0.445�fs_Fund_Size 0.307 0.380�fs_Years_Incep 0.210 0.491�fs_Years_Mgt 0.432 0.686�fs_Mgt_Charge_INV 0.512 0.424�fs_Ong_Charge_INV 0.629 0.453
Model 9. PRESENCE: PROFIT
Cons.Nec Cov.Nec
fs_Morning 0.971 0.521fs_Anal 0.984 0.564fs_Fund_Size 0.846 0.656fs_Years_Incep 0.845 0.500fs_Years_Mgt 0.660 0.446fs_Mgt_Charge_INV 0.564 0.648fs_Ong_Charge_INV 0.509 0.750�fs_Morning 0.122 0.437�fs_Anal 0.172 0.431�fs_Fund_Size 0.323 0.380�fs_Years_Incep 0.213 0.474�fs_Years_Mgt 0.440 0.666�fs_Mgt_Charge_INV 0.494 0.389�fs_Ong_Charge_INV 0.605 0.414
Source: Authors’ calculation based on the Morningstar mutual fund database.
ECONOMIC RESEARCH-EKONOMSKA ISTRAŽIVANJA 3061
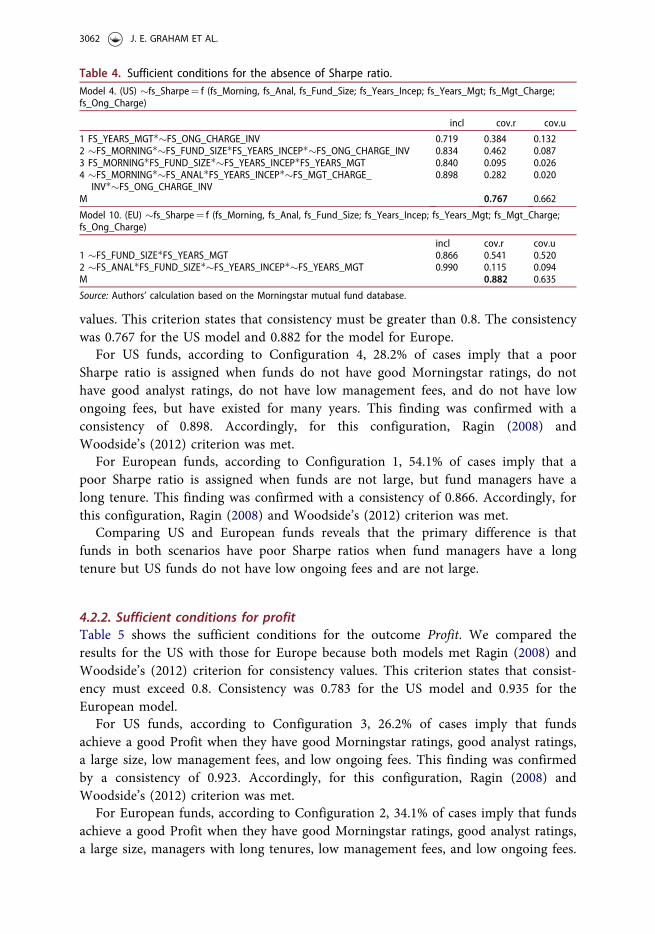
values. This criterion states that consistency must be greater than 0.8. The consistencywas 0.767 for the US model and 0.882 for the model for Europe.
For US funds, according to Configuration 4, 28.2% of cases imply that a poorSharpe ratio is assigned when funds do not have good Morningstar ratings, do nothave good analyst ratings, do not have low management fees, and do not have lowongoing fees, but have existed for many years. This finding was confirmed with aconsistency of 0.898. Accordingly, for this configuration, Ragin (2008) andWoodside’s (2012) criterion was met.
For European funds, according to Configuration 1, 54.1% of cases imply that apoor Sharpe ratio is assigned when funds are not large, but fund managers have along tenure. This finding was confirmed with a consistency of 0.866. Accordingly, forthis configuration, Ragin (2008) and Woodside’s (2012) criterion was met.
Comparing US and European funds reveals that the primary difference is thatfunds in both scenarios have poor Sharpe ratios when fund managers have a longtenure but US funds do not have low ongoing fees and are not large.
4.2.2. Sufficient conditions for profitTable 5 shows the sufficient conditions for the outcome Profit. We compared theresults for the US with those for Europe because both models met Ragin (2008) andWoodside’s (2012) criterion for consistency values. This criterion states that consist-ency must exceed 0.8. Consistency was 0.783 for the US model and 0.935 for theEuropean model.
For US funds, according to Configuration 3, 26.2% of cases imply that fundsachieve a good Profit when they have good Morningstar ratings, good analyst ratings,a large size, low management fees, and low ongoing fees. This finding was confirmedby a consistency of 0.923. Accordingly, for this configuration, Ragin (2008) andWoodside’s (2012) criterion was met.
For European funds, according to Configuration 2, 34.1% of cases imply that fundsachieve a good Profit when they have good Morningstar ratings, good analyst ratings,a large size, managers with long tenures, low management fees, and low ongoing fees.
Table 4. Sufficient conditions for the absence of Sharpe ratio.Model 4. (US) �fs_Sharpe¼ f (fs_Morning, fs_Anal, fs_Fund_Size; fs_Years_Incep; fs_Years_Mgt; fs_Mgt_Charge;fs_Ong_Charge)
incl cov.r cov.u
1 FS_YEARS_MGT��FS_ONG_CHARGE_INV 0.719 0.384 0.1322 �FS_MORNING��FS_FUND_SIZE�FS_YEARS_INCEP��FS_ONG_CHARGE_INV 0.834 0.462 0.0873 FS_MORNING�FS_FUND_SIZE��FS_YEARS_INCEP�FS_YEARS_MGT 0.840 0.095 0.0264 �FS_MORNING��FS_ANAL�FS_YEARS_INCEP��FS_MGT_CHARGE_
INV��FS_ONG_CHARGE_INV0.898 0.282 0.020
M 0.767 0.662
Model 10. (EU) �fs_Sharpe¼ f (fs_Morning, fs_Anal, fs_Fund_Size; fs_Years_Incep; fs_Years_Mgt; fs_Mgt_Charge;fs_Ong_Charge)
incl cov.r cov.u1 �FS_FUND_SIZE�FS_YEARS_MGT 0.866 0.541 0.5202 �FS_ANAL�FS_FUND_SIZE��FS_YEARS_INCEP��FS_YEARS_MGT 0.990 0.115 0.094M 0.882 0.635
Source: Authors’ calculation based on the Morningstar mutual fund database.
3062 J. E. GRAHAM ET AL.

This finding was confirmed by a consistency value of 0.943. Accordingly, for this con-figuration, Ragin (2008) and Woodside’s (2012) criterion was met.
Comparing US and European funds reveals that the primary difference is thatfunds in both scenarios achieve good profits under the same conditions, except thatEuropean funds must also have managers with long tenures.
5. Conclusions
Mutual fund performance is discussed at length in the finance literature. There hasbeen extensive research into the relationships between fund ratings, specific fund fea-tures, and performance. Numerous studies have investigated the features of mutualfunds and characteristics of fund managers that influence fund performance. Despitethe overall finding that fund fees are generally unjustified by subsequent performance,scholars have nonetheless failed to reach a consensus regarding the positive or nega-tive impacts of different factors. These factors invite further investigation into areassuch as the clustering of fund managers depending on whether they base their deci-sions on publicly available information or data that are less easily accessible to thegeneral public (Abdesaken, 2015).
Methodologically, this paper contributes to economics and finance researchthrough its application of fsQCA. Using complexity theory, researchers can test mod-els where no single condition is responsible for the outcome. Instead, we analysedseveral conditions to observe how they combine to contribute to the outcome. Weused fsQCA to identify the combinations of factors that lead to our outcome ofchoice (Ragin, 2008), instead of isolating the net and independent effects of singlefactors on a particular outcome.
Complexity theory helps provide answers when certain conditions cause an out-come (Feurer, Baumbach, & Woodside, 2016). No simple conditions are the cause ofan outcome of interest. In our study, this outcome is the influence on mutual fundperformance. As Kostova and Zaheer (1999) stated, international business is a
Table 5. Sufficient conditions for the Profit.Model 3. (US) fs_Profit¼ f (fs_Morning, fs_Anal, fs_Fund_Size; fs_Years_Incep; fs_Years_Mgt; fs_Mgt_Charge;fs_Ong_Charge)
incl cov.r cov.u
1 FS_YEARS_INCEP�FS_MGT_CHARGE_INV�FS_ONG_CHARGE_INV 0.757 0.388 0.0862 FS_MORNING�FS_YEARS_MGT�FS_MGT_CHARGE_INV�FS_ONG_
CHARGE_INV0.904 0.295 0.068
3 FS_MORNING�FS_ANAL�FS_FUND_SIZE�FS_MGT_CHARGE_INV�FS_ONG_CHARGE_INV
0.923 0.262 0.026
4 FS_MORNING�FS_ANAL�FS_FUND_SIZE�FS_YEARS_INCEP�FS_YEARS_MGT�FS_MGT_CHARGE_INV
0.888 0.172 0.031
M 0.783 0.522
Model 9. (EU) fs_Profit¼ f (fs_Morning, fs_Anal, fs_Fund_Size; fs_Years_Incep; fs_Years_Mgt; fs_Mgt_Charge;fs_Ong_Charge)
incl cov.r cov.u
1 FS_MORNING�FS_ANAL�FS_FUND_SIZE�FS_YEARS_INCEP��FS_YEARS_MGT 0.937 0.360 0.2652 FS_MORNING�FS_ANAL�FS_FUND_SIZE�FS_YEARS_MGT�FS_MGT_CHARGE_
INV�FS_ONG_CHARGE_INV0.943 0.341 0.246
M 0.935 0.606
Source: Authors’ calculation based on the Morningstar mutual fund database.
ECONOMIC RESEARCH-EKONOMSKA ISTRAŽIVANJA 3063

causally complex phenomenon. Pratt (2009) reported that number of interviews orobservations that should be conducted in a qualitative research project depends onthe question that researchers seek to answer.
One of the relevant points of regression analysis is that researchers do not requiredata calibration or prior causal knowledge. In addition, researchers do not needknowledge or previous theories for the regression analysis. In contrast, set member-ship is determined by substantive knowledge in fsQCA (rather than using the sam-ple mean).
Unlike standard econometric methods, sample representativeness is less of an issuein fuzzy-set methods. FsQCA does not rest on assumptions that data are drawn froma certain probability distribution (Woodside 2012b). The possible combinations ofindividual and group attributes may be infinite, but only a finite number of coherentconfigurations are prevalent in the real world.
We examined the performance of Luxembourg-domiciled mutual funds that investin large-cap US and Eurozone equities. A configurational comparative method,fsQCA, identified the combinations of conditions that lead to mutual funds’ under-performance or outperformance of competitors.
A poor Sharpe ratio for US funds is assigned when the funds do not have goodMorningstar ratings, do not have good analyst ratings, do not have low management fees,and do not have low ongoing fees, but have existed for many years. A poor Sharpe ratiofor European funds is assigned when the funds are not large, but fund managers have along tenure. Comparing US and European funds reveals that the main difference is thatboth US and European funds have poor Sharpe ratios when fund managers have a longtenure but US funds do not have low ongoing fees and are not large.
US funds achieve good Profit when they have good Morningstar ratings, good ana-lyst ratings, large size, low management fees, and low ongoing fees. European fundsachieve good Profit when they have good Morningstar ratings, good analyst ratings,large size, low management fees, low ongoing fees, and managers with long tenures.Comparing US and European funds reveals that the main difference is that both USand European funds achieve good profit under the same conditions, except thatEuropean funds must also have managers with long tenures.
All stakeholders in the performance of mutual funds (i.e., government regulators,investors, and investment managers) have an interest in better understanding mutualfund performance. They may find the results of our research helpful in their delibera-tions about mutual funds with criteria of good performance.
From a regulator’s perspective, the purpose of knowing the conditions that affectthe performance of funds is to evaluate the relevance of including information onthese conditions in the advertising of managers. For investors, the mutual fund mar-ket is large and offers a wide variety of assets in which to invest. Therefore, investorswill consider the values of these conditions for potentially selectable funds as keyaspects in their fund selection decisions. This research verifies the importance ofMorningstar ratings and analyst ratings in mutual funds to avoid poor performance.The achievement of good ratings constitutes an incentive for fund managers toimprove their advertising. Managers should spare no effort in carrying out policiesand actions to improve the ratings assigned to the mutual funds they manage.
3064 J. E. GRAHAM ET AL.
Like all studies, this study has certain limitations. The primary limitation relates tothe sample, which comprised firms from a specific asset class. In addition, the studyexamined data for a short period. Future fsQCA studies could cover other mutualfund categories in other investment areas. Verifying whether our results can be con-firmed for broader horizons would also be of interest.
A promising line of future research would be to explore whether any additionalconditions may contradict our findings. Recent research applied to other sectors haslinked performance to areas such as innovation (Ho, Nguyen, Adhikari, Miles, &Bonney, 2018), business intelligence capacities (Caseiro & Coelho, 2019), decision-making style (Abubakar, Elrehail, Alatailat, & Elci, 2019), and employee relations cli-mate (Ali, Lei, & Wei, 2018). As with any study of this nature, the robustness of theresults invites further inspection.
Disclosure statement
No potential conflict of interest was reported by the authors.
References
Abdesaken, G. (2015). On the precision of public information and mutual fund performance.Journal of Asset Management, 16(2), 85–100. doi:10.1057/jam.2015.7
Abubakar, A. M., Elrehail, H., Alatailat, M. A., & Elci, A. (2019). Knowledge management,decision-making style and organizational performance. Journal of Innovation & Knowledge,4(2), 104–114.
Agarwal, V., Mullally, K. A., Tang, Y., & Yang, B. (2015). Mandatory portfolio disclosure,stock liquidity, and mutual fund performance. The Journal of Finance, 70(6), 2733–2776.doi:10.1111/jofi.12245
Ali, M., Lei, S., & Wei, X. Y. (2018). The mediating role of the employee relations climate inthe relationship between strategic HRM and organizational performance in Chinese banks.Journal of Innovation & Knowledge, 3(3), 115–122. doi:10.1016/j.jik.2016.12.003
Alibakhshi, R., Reza, M., & Moghadam, S. (2016). A new algorithm for mutual funds evalu-ation based on multiple attribute decision making techniques. Kybernetes, 45(8), 1194–1212.doi:10.1108/K-10-2015-0256
Anagol, S., Marisetty, V., Sane, R., & Venugopal, B. (2017). On the impact of regulating com-missions: evidence from the Indian mutual funds market. The World Bank EconomicReview, 31(1), 241–270.
Andreu, L., Gargallo, P., Salvador, M., & Sarto, J. L. (2015). Bayesian analysis of herdingbehaviour: an application to Spanish equity mutual funds. Applied Stochastic Models inBusiness and Industry, 31(6), 745–761. doi:10.1002/asmb.2087
Andreu, L., Sarto, J. L., & Serrano, M. (2015). Implications of manager replacement: Evidencefrom the Spanish mutual fund industry. Applied Economics, 47(13), 1366–1387. doi:10.1080/00036846.2014.997921
Andreu, L., & Puetz, A. (2017). Choosing two business degrees versus choosing one: Whatdoes it tell about mutual fund managers’ investment behavior? Journal of Business Research,75, 138–146. doi:10.1016/j.jbusres.2017.02.014
Armstrong, W. J., Genc, E., & Verbeek, M. (2017). Going for gold: An analysis of Morningstaranalyst ratings. Management Science, 65(5), 2310–2327. Available at SSRN 2419669. http://dx.doi.org/10.2139/ssrn.2419669.
Association of the Luxembourg Fund Industry (ALFI). (2016). Annual Report 2015–2016.Retrieved from http://www.alfi.lu/annualreport2015–16.
ECONOMIC RESEARCH-EKONOMSKA ISTRAŽIVANJA 3065
Asal, M. (2016). Testing for the presence of skill in Swedish mutual fund performance:Evidence from a Bootstrap Analysis. Journal of Economics and Business, 88, 22–35. doi:10.1016/j.jeconbus.2016.07.001
Ayadi, M. A., Ben-Ameur, H., & Kryzanowski, L. (2016). Typical and tail performance ofCanadian equity SRI mutual funds. Journal of Financial Services Research, 50(1), 57–94. doi:10.1007/s10693-015-0215-0
Ayadi, M. A., Chaibi, A., & Kryzanowski, L. (2016). Performance of Canadian hybrid mutualfunds. The North American Journal of Economics and Finance, 38, 124–147. doi:10.1016/j.najef.2016.09.003
Babalos, V., Doumpos, M., Philippas, N., & Zopounidis, C. (2015). Towards a holisticapproach for mutual fund performance appraisal. Computational Economics, 46(1), 35–53.doi:10.1007/s10614-014-9450-y
Babalos, V., Mamatzakis, E. C., & Matousek, R. (2015). The performance of US equity mutualfunds. Journal of Banking & Finance, 52, 217–229. doi:10.1016/j.jbankfin.2014.12.008
Ban, J. (2015). Effects of sales expenses and management expenses on mutual fund perform-ance and flows. Asia-Pacific Journal of Financial Studies, 44(1), 129–173. doi:10.1111/ajfs.12082
Basso, A., & Funari, S. (2017). The role of fund size in the performance of mutual fundsassessed with DEA models. The European Journal of Finance, 23(6), 457–473. doi:10.1080/1351847X.2016.1164209
Berkowitz, M. K., & Kotowitz, Y. (2002). Managerial quality and the structure of managementexpenses in the US mutual fund industry. International Review of Economics & Finance,11(3), 315–330. doi:10.1016/S1059-0560(02)00099-0
Blake, C. R., & Morey, M. R. (2000). Morningstar ratings and mutual fund performance. TheJournal of Financial and Quantitative Analysis, 35(3), 451–483. doi:10.2307/2676213
Blake, D., Caulfield, T., Ioannidis, C., & Tonks, I. (2017). New evidence on mutual fund per-formance: A comparison of alternative bootstrap methods. Journal of Financial andQuantitative Analysis, 52(3), 1279–1299. doi:10.1017/S0022109017000229
Blume, M. E. (1998). An anatomy of Morningstar ratings. Financial Analysts Journal, 54(2),19–27. doi:10.2469/faj.v54.n2.2162
Bollen, N. P., & Busse, J. A. (2005). Short-term persistence in mutual fund performance.Review of Financial Studies, 18(2), 569–597. doi:10.1093/rfs/hhi007
Bolster, P. J., & Trahan, E. A. (2013). Investing in Morningstar five-star stock upgrades: Priceand style effects. Journal of Accounting and Finance, 13(6), 193–208.
Braumoeller, B. F., & Goertz, G. (2000). The methodology of necessary conditions. AmericanJournal of Political Science, 44(4), 844–858. doi:10.2307/2669285
Carhart, M. M. (1997). On persistence in mutual fund performance. The Journal of Finance,52(1), 57–82. doi:10.1111/j.1540-6261.1997.tb03808.x
Carhart, M. M., Carpenter, J. N., Lynch, A. W., & Musto, D. K. (2002). Mutual fund survivor-ship. Review of Financial Studies, 15(5), 1439–1463. doi:10.1093/rfs/15.5.1439
Caseiro, N., & Coelho, A. (2019). The influence of Business Intelligence capacity, networklearning and innovativeness on startups performance. Journal of Innovation & Knowledge,4(3), 139–145. doi:10.1016/j.jik.2018.03.009
Chen, J., Hong, H., Huang, M., & Kubik, J. D. (2004). Does fund size erode mutual fund per-formance? The role of liquidity and organization. American Economic Review, 94(5),1276–1302. doi:10.1257/0002828043052277
Chen, A. N., Wang, S. Y., & Yu, P. L. (2014). Evaluating multi-criteria ratings of financialinvestment options. International Review of Economics & Finance, 31, 46–58. doi:10.1016/j.iref.2013.12.003
Collier, D. (1993). The comparative method. In A. W. Finifter (Ed.), Political science: the stateof discipline II (pp. 105–119). Washington: American Political Science Association.
Costa, B. A., & Porter, G. E. (2003). Mutual fund managers: Does longevity imply expertise?Journal of Economics and Finance, 27(2), 224–235. doi:10.1007/BF02827220
3066 J. E. GRAHAM ET AL.

Costa, B. A., Jakob, K., & Porter, G. E. (2006). Mutual fund performance and changing markettrends 1990-2001: Does manager experience matter? The Journal of Investing, 15(2), 79–86.doi:10.3905/joi.2006.635634
Cremers, K. M., & Petajisto, A. (2009). How active is your fund manager? A new measure thatpredicts performance. Review of Financial Studies, 22(9), 3329–3365. doi:10.1093/rfs/hhp057
Crespo-Herv�as, J., Calabuig-Moreno, F., Prado-Gasc�o, V., A~n�o-Sanz, V., & N�u~nez-Pomar, J.(2019). The role of passion in the quality-value-satisfaction-intentions chain: linear modelsand the QCA approach for athletes. Economic Research-Ekonomska Istra�zivanja, 32(1),352–369. doi:10.1080/1331677X.2018.1553683
Crilly, D. (2011). Predicting stakeholder orientation in the multinational enterprise: A mid-range theory. Journal of International Business Studies, 42(5), 694–717. doi:10.1057/jibs.2010.57
Cuthbertson, K., Nitzsche, D., & O’Sullivan, N. (2016). A review of behavioural and manage-ment effects in mutual fund performance. International Review of Financial Analysis, 44,162–176. doi:10.1016/j.irfa.2016.01.016
Daniel, K., Grinblatt, M., Titman, S., & Wermers, R. (1997). Measuring mutual fund perform-ance with characteristic-based benchmarks. The Journal of Finance, 52(3), 1035–1058. doi:10.2307/2329515
Del Guercio, D., & Tkac, P. A. (2008). Star power: The effect of Morningstar ratings onmutual fund flow. Journal of Financial and Quantitative Analysis, 43(4), 907–936. doi:10.1017/S0022109000014393
Ding, H., Zheng, H., & Zhu, C. (2015). Equity funds in emerging Asia: Does size matter?International Review of Economics & Finance, 35, 149–165. doi:10.1016/j.iref.2014.09.012
Droms, W. G., & Walker, D. A. (1995). Determinants of variation in mutual fund returns.Applied Financial Economics, 5(6), 383–389. doi:10.1080/758538597
Droms, W. G., & Walker, D. A. (1996). Mutual fund investment performance. The QuarterlyReview of Economics and Finance, 36(3), 347–363. doi:10.1016/S1062-9769(96)90020-4
Droms, W. G., & Walker, D. A. (2001). Persistence of mutual fund operating characteristics:Returns, turnover rates, and expense ratios. Applied Financial Economics, 11(4), 457–466.doi:10.1080/096031001300314018
Ferson, W. E., & Schadt, R. W. (1996). Measuring fund strategy and performance in changingeconomic conditions. The Journal of Finance, 51(2), 425–461. doi:10.2307/2329367
Feurer, S., Baumbach, E., & Woodside, A. G. (2016). Applying configurational theory to builda typology of ethnocentric consumers. International Marketing Review, 33(3), 351–375. doi:10.1108/IMR-03-2014-0075
Filbeck, G., & Tompkins, D. L. (2004). Management tenure and risk-adjusted performance ofmutual funds. The Journal of Investing, 13(2), 72–80. doi:10.3905/joi.2004.412310
Fiss, P. C. (2007). A set-theoretic approach to organizational configurations. Academy ofManagement Review, 32(4), 1180–1198. doi:10.5465/amr.2007.26586092
Fiss, P. C. (2011). Building better causal theories: A fuzzy set approach to typologies in organ-ization research. Academy of Management Journal, 54(2), 393–420. doi:10.5465/amj.2011.60263120
F€uss, R., Hille, J., Rindler, P., Schmidt, J., & Schmidt, M. (2010). From rising stars and fallingangels: On the relationship between the performance and ratings of German mutual funds.The Journal of Wealth Management, 13(1), 75–90. doi:10.3905/JWM.2010.13.1.075
Gerrans, P. (2006). Morningstar ratings and future performance. Accounting and Finance,46(4), 605–628. doi:10.1111/j.1467-629X.2006.00185.x
Golec, J. H. (1996). The effects of mutual fund managers’ characteristics on their portfolio per-formance, risk and fees. Financial Services Review, 5(2), 133–147. doi:10.1016/S1057-0810(96)90006-2
Gottesman, A. A., & Morey, M. R. (2006). Manager education and mutual fund performance.Journal of Empirical Finance, 13(2), 145–182. doi:10.1016/j.jempfin.2005.10.001
Greckhamer, T., Misangyi, V., Elms, H., & Lacey, R. (2008). Using qualitative comparativeanalysis in strategic management research: An examination of combinations of industry,
ECONOMIC RESEARCH-EKONOMSKA ISTRAŽIVANJA 3067

corporate, and business-unit effects. Organizational Research Methods, 11(4), 695–726. doi:10.1177/1094428107302907
Gregory, A., Matatko, J., & Luther, R. (1997). Ethical unit trust financial performance: smallcompany effects and fund size effects. Journal of Business Finance Accounting, 24(5),705–725. doi:10.1111/1468-5957.00130
Gruber, M. J. (1996). Another puzzle: The growth in actively managed mutual funds. TheJournal of Finance, 51(3), 783–810. doi:10.1111/j.1540-6261.1996.tb02707.x
Haslem, J. A. (2014). Morningstar mutual fund measures and selection model. The Journal ofWealth Management, 17(2), 19–30. doi:10.3905/jwm.2014.17.2.019
Ho, K. L. P., Nguyen, C. N., Adhikari, R., Miles, M. P., & Bonney, L. (2018). Exploring marketorientation, innovation, and financial performance in agricultural value chains in emergingeconomies. Journal of Innovation & Knowledge, 3(3), 154–163. doi:10.1016/j.jik.2017.03.008
Jain, P. C., & Wu, J. S. (2000). Truth in mutual fund advertising: Evidence on future perform-ance and fund flows. The Journal of Finance, 55(2), 937–958. doi:10.1111/0022-1082.00232
Jensen, M. C. (1968). The performance of mutual funds in the period 1945–1964. The Journalof Finance, 23(2), 389–416. doi:10.1111/j.1540-6261.1968.tb00815.x
Kacperczyk, M., & Seru, A. (2007). Fund manager use of public information: New evidence onmanagerial skills. The Journal of Finance, 62(2), 485–528. doi:10.1111/j.1540-6261.2007.01215.x
Kamstra, M. J., Kramer, L. A., Levi, M. D., & Wermers, R. (2017). Seasonal asset allocation:Evidence from mutual fund flows. Journal of Financial and Quantitative Analysis, 52(1),71–109. doi:10.1017/S002210901600082X
Kenworth, L., & Hicks, A. (2008). Method and substance in macrocomparative analysis.Basingstoke: Palgrave Macmillan.
Khorana, A., Servaes, H., & Tufano, P. (2009). Mutual fund fees around the world. Review ofFinancial Studies, 22(3), 1279–1310. doi:10.1093/rfs/hhn042
Kornelakis, A. (2018). The comparative method and comparative management: uneasy bedfel-lows or natural partners? European Journal of International Management, 12(5), 6),642–654. doi:10.1504/EJIM.2018.10014754
Kostova, T., & Zaheer, S. (1999). Organizational legitimacy under conditions of complexity:The case of the multinational enterprise. The Academy of Management Review, 24(1), 64–81.doi:10.2307/259037
Kr€aussl, R., & Sandelowsky, R. M. (2007). The predictive performance of Morningstar’s mutualfund ratings. Working Paper, University of Amsterdam. Faculty of Economic Sciences andBusiness Administration, University of Amsterdam, The Netherlands. Retrieved from http://ssrn.com/abstract=963489. doi:10.2139/ssrn.963489
Malkiel, B. G. (1995). Returns from investing in equity mutual funds 1971 to 1991. TheJournal of Finance, 50(2), 549–572. doi:10.1111/j.1540-6261.1995.tb04795.x
Meyer, A. D., Tsui, A. S., & Hinings, C. R. (1993). Configurational approaches to organiza-tional analysis. Academy of Management Journal, 36(6), 1175–1195. doi:10.2307/256809
Mills, M., van de Bunt, G. G., & De Bruijn, J. (2006). Comparative research: Persistent prob-lems and promising solutions. International Sociology, 21(5), 619–631. doi:10.1177/0268580906067833
Morey, M. R. (2002). Mutual fund age and Morningstar ratings. Financial Analysts Journal,58(2), 56–63. doi:10.2469/faj.v58.n2.2523
Morey, M. R. (2005). The kiss of death? A 5-star Morningstar rating. Journal of InvestmentManagement, 3(2), 41–52.
Morningstar, Inc. (2009). Modern portfolio theory (MPT) statistics, Morningstar methodologypaper, May 29, 2009. Retrieved from http://www.morningstar.es/es/funds/help/methodology.aspx.
Mu~noz, F., Vicente, R., & Ferruz, L. (2015). Stock-picking and style-timing abilities: A com-parative analysis of conventional and socially responsible mutual funds in the US market.Quantitative Finance, 15(2), 345–358. doi:10.1080/14697688.2013.832833
3068 J. E. GRAHAM ET AL.

Otten, R., & Bams, D. (2002). European mutual fund performance. European FinancialManagement, 8(1), 75–101. doi:10.1111/1468-036X.00177
P�astor, L'., Stambaugh, R. F., & Taylor, L. A. (2015). Scale and skill in active management.Journal of Financial Economics, 116(1), 23–45. doi:10.1016/j.jfineco.2014.11.008
Peterson, J. D., Petranico, P. A., Riepe, M. W., & Xu, F. (2001). Explaining the performance ofdomestic equity mutual funds. The Journal of Investing, 10(3), 81–91. doi:10.3905/joi.2001.319477
Pollet, J. M., & Wilson, M. (2008). How does size affect mutual fund behavior? The Journal ofFinance, 63(6), 2941–2969. doi:10.1111/j.1540-6261.2008.01417.x
Prather, L., Bertin, W. J., & Henker, T. (2004). Mutual fund characteristics, managerial attrib-utes, and fund performance. Review of Financial Economics, 13(4), 305–326. doi:10.1016/j.rfe.2003.11.002
Pratt, M. G. (2009). For the lack of a boilerplate: Tips on writing up (and reviewing) qualita-tive research. Academy of Management Journal, 52(5), 856–862. doi:10.5465/amj.2009.44632557
Quine, W. V. (1955). A way to simplify truth functions. The American Mathematical Monthly,62(9), 627–631. doi:10.1080/00029890.1955.11988710
Ragin, C. C. (2000). Fuzzy-set social science. Chicago, IL: University of Chicago Press.Ragin, C. C. (2006). Set relations in social research: Evaluating their consistency and coverage.
Political Analysis, 14(3), 291–310. doi:10.1093/pan/mpj019Ragin, C. C. (2006). How to lure analytic social science out of the doldrums: Some lessons
from comparative research. International Sociology, 21(5), 633–646. doi:10.1177/0268580906067834
Ragin, C. C. (2008). Redesigning social inquiry: Fuzzy sets and beyond. Chicago: University ofChicago Press.
Ragin, C. C., & Davey, S. (2016). Fuzzy-Set/Qualitative Comparative Analysis 3.0. Irvine,California: Department of Sociology, University of California.
Rihoux, B., & Ragin, C. C. (2009). Configurational comparative methods. QualitativeComparative Analysis (QCA) and Related Techniques. Thousand Oaks, CA: Sage.
Roig-Tierno, N., Gonzalez-Cruz, T. F., & Llopis-Martinez, J. (2017). An overview of qualitativecomparative analysis: A bibliometric analysis. Journal of Innovation & Knowledge, 2(1),15–23. doi:10.1016/j.jik.2016.12.002
Schneider, M. R., Schulze-Bentrop, C., & Paunescu, M. (2010). Mapping the institutional cap-ital of high-tech firms: A fuzzy-set analysis of capitalist variety and export performance.Journal of International Business Studies, 41(2), 246–266. doi:10.1057/jibs.2009.36
Schneider, C. Q., & Wagemann, C. (2012). Set-theoretic methods for the social sciences. A guideto qualitative comparative analysis. Cambridge: Cambridge University Press.
Sharpe, W. F. (1966). Mutual fund performance. The Journal of Business, 39(S1), 119–138. doi:10.1086/294846
Sharpe, W. F. (1998). Morningstar’s risk-adjusted ratings. Financial Analysts Journal, 54(4),21–33. doi:10.2469/faj.v54.n4.2195
Sirri, E. R., & Tufano, P. (1998). Costly search and mutual fund flows. The Journal of Finance,53(5), 1589–1622. doi:10.1111/0022-1082.00066
Switzer, L. N., & Huang, Y. (2007). How does human capital affect the performance of smalland mid-cap mutual funds? Journal of Intellectual Capital, 8(4), 666–681. doi:10.1108/14691930710830828
Urue~na, A., Arenas, �A. E., & Hidalgo, A. (2018). Understanding workers’ adoption of product-ivity mobile applications: a fuzzy set qualitative comparative analysis (fsQCA). EconomicResearch-Ekonomska Istra�zivanja, 31(1), 967–981.
Vassinen, A. (2012). Configurational explanation of marketing outcomes. A fuzzy-set qualita-tive comparative analysis approach. Doctoral Dissertation, number 39. Helsinki, Finland:Aalto University.
ECONOMIC RESEARCH-EKONOMSKA ISTRAŽIVANJA 3069

Vis, B. (2012). The comparative advantages of fsQCA and regression analysis for moderatelylarge-N analyses. Sociological Methods & Research, 41(1), 168–198. doi:10.1177/0049124112442142
Woodside, A. G. (2012a). Incompetency training: Theory, practice, and remedies. Journal ofBusiness Research, 65(3), 279–293. doi:10.1016/j.jbusres.2011.10.025
Woodside, A. G. (2012b). Proposing a new logic for data analysis in marketing and consumerbehavior: Case study research of large-N survey data for estimating algorithms that accur-ately profile X (extremely high-use) consumers. Journal of Global Scholars of MarketingScience, 22(4), 277–289. doi:10.1080/21639159.2012.717369
Woodside, A. G., Ko, E., & Huan, T. C. (2012). The new logic in building isomorphic theoryof management decision realities. Management Decision, 50(5), 765–777. doi:10.1108/00251741211227429
Yin, R. K. (1994). Case study research: Design and methods. Thousand Oaks, CA: Sage.
3070 J. E. GRAHAM ET AL.