Embed Size (px)
Citation preview

NANO EXPRESS Open Access
Influence of Ultraviolet/OzonolysisTreatment of Nanocarbon Filler on theElectrical Resistivity of Epoxy CompositesYulia Perets1* , Lyudmila Matzui1, Lyudmila Vovchenko1, Irina Ovsiienko1, Olena Yakovenko1,Oleksandra Lazarenko1, Alexander Zhuravkov1 and Oleksii Brusylovets2
Abstract
In the present work, we have investigated concentration and temperature dependences of electrical conductivityof graphite nanoplatelets/epoxy resin composites. The content of nanocarbon filler is varied from 0.01 to 0.05volume fraction. Before incorporation into the epoxy resin, the graphite nanoplatelets were subjected to ultravioletozone treatment at 20-min ultraviolet exposure. The electric resistance of the samples was measured by two- orfour-probe method and teraohmmeter E6-13. Several characterization techniques were employed to identify themechanisms behind the improvements in the electrical properties, including SEM and FTIR spectrum analysis.It is established that the changes of the relative intensities of the bands in FTIR spectra indicate the destructionof the carboxyl group –COOH and group –OH. Electrical conductivity of composites has percolation characterand graphite nanoplatelets (ultraviolet ozone treatment for 20 min) addition which leads to a decrease of percolationthreshold 0.005 volume fraction and increase values of electrical conductivity (by 2–3 orders of magnitude) abovethe percolation threshold in comparison with composite materials—graphite nanoplatelets/epoxy resin.The changes of the value and behavior of temperature dependences of the electrical resistivity of epoxycomposites with ultraviolet/ozone-treated graphite nanoparticles have been analyzed within the modelof effective electrical conductivity. The model takes into account the own electrical conductivity of thefiller and the value of contact electric resistance between the filler particles of the formation of continuousconductive pathways.
Keywords: Polymer composite, Graphite nanoplatelets, Ultraviolet treatment, Percolation threshold, Electricalconductivity
PACS: 72.80.Tm, 64.60.ah, 82.35.Np
BackgroundProgress in various fields of science and technology pro-vides the creation of new materials with the requiredproperties. These materials put high demands on strength,hardness, conductivity, heat resistance, and so on. Most ofthese requirements are satisfied in the industry due to thewide usage of polymer composite materials (CMs). Thecomposite materials with carbon fillers such as graphite,carbon nanotubes, carbon fibers, carbon black, and graph-ite nanoplatelets (GNPs) are very popular today [1].
As it is known, graphite has excellent electrical [2] andthermal conductivity [3, 4] due to its layered structure andhas unique mechanical properties, with very high modulusalong its graphene plane. These useful properties com-bined with very low cost, especially compared to carbonnanotubes, make it a popular filler to produce conductingpolymers for applications in areas such as electromagneticinterference shields [5, 6] and thermal conductors.The graphite nanoplatelets are produced as a result of
the thermochemical treatment of the natural dispersegraphite (surface oxidation and thermal shock—get ther-mally expanded graphite (TEG)) and ultrasonic dispersing(UD) of thermally expanded graphite in various fluid envi-ronments [7–9]. One of the most widely used methods of
* Correspondence: [email protected]; [email protected] Department, Taras Shevchenko National University of Kyiv, 64/13Volodymyrska Str., Kyiv 01601, UkraineFull list of author information is available at the end of the article
© 2016 The Author(s). Open Access This article is distributed under the terms of the Creative Commons Attribution 4.0International License (http://creativecommons.org/licenses/by/4.0/), which permits unrestricted use, distribution, andreproduction in any medium, provided you give appropriate credit to the original author(s) and the source, provide a link tothe Creative Commons license, and indicate if changes were made.
Perets et al. Nanoscale Research Letters (2016) 11:370 DOI 10.1186/s11671-016-1577-4

nanoparticle surface oxidation is the treatment by strongacids such as HNO3 [10] and H2SO4 [11].Using acids as liquid processing agents is expected to
result in a high degree of nanocarbon dispersion due tothe formation of strong covalent bonds between func-tional groups and carbon atoms. In this case, however,the delocalized π-electronic system of graphite layer isdestructed and σ-bonds are partially broke, while freebonds that are formed provide the attachment of variousfunctional groups to the nanocarbon surface. At thesame time, chemical functionalization by strong acidsresults in the formation of a large quantity of defects onthe nanocarbon surface [12].Consequently, the splitting of source micron graphite
particles into individual particles 5–65 nm thick (GNPs)as well as their functionalization with different functionalgroups and formation of defects on the nanocarbonsurface occurred depending on the type of liquid reagentfor ultrasonic dispersing.One of the most popular methods of cleaning the sur-
face nanocarbon after functionalization is the ultraviolet(UV) ozone treatment (or UV/O3), which is fast and safe.Ultraviolet treatment of nanocarbon with small doses
leads to strengthening (due to additional functionaliza-tion) of connection between nanocarbon fillers and thepolymer matrix at interfaces [13] and can lead to in-creased efficiency of chemical interactions between thesurface of nanocarbon and polymer matrix in composites[14–16], thus improving the electrical, thermal, and mech-anical properties in polymer composites [17]. However,the concentration and temperature dependences of theelectrical conductivity of the composites with ultravioletozone-treated graphite nanoparticles are not sufficientlyinvestigated. The issue of the influence of ultravioletozone-treated nanocarbon on percolation characteristicsin polymer composites was not yet disclosed.The aim of this study was to investigate the effect of
ultraviolet ozone treatment of carbon filler on the concen-tration and temperature dependences of the electricalconductivity of polymer composite materials epoxy/graph-ite nanoplatelets in order to enhance the conductivity ofcomposite materials with low content of nanocarbon filler.
MethodsMeasurementsThe morphology of natural disperse graphite, expandedgraphite (TEG), and GNPs was examined by scanningelectron microscope (SEM; Mira3 Tescan) at accelerat-ing voltage of 10.0 kV.Ultrasonic dispersion of TEG powder occurs in ultrasonic
bath “BAKU” BK-9050, ultrasonic frequency—40 kHz, witha maximum electrical power output of 30 and 50 W.UV ozone treatment was performed by DRT-1000
(ultraviolet lamp) equipped with electric-discharge arc
lamp of high pressure inflated with mercury and argoncompound that could release ultraviolet radiation of50 W at 240–320 nm wavelength. The distance betweenthe UV lamp and the sample was fixed at 11 cm.The IR spectra were obtained by PerkinElmer Spectrum
BX FT-IR infrared spectrometer in the frequency range4000–400 cm−1 in transmission mode for TEG and GNPsbefore and after ultraviolet ozone treatment.The electric resistance of the samples was measured by
two-probe (R = 104–109 Ω) and four-probe (R ≤ 104Ω)method or teraohmmeter E6-13 (R = 109–1013 Ω). An au-tomated installation was used for the investigation of thetemperature dependence of the electrical resistance in thetemperature range of 6–300 K. The main components ofautomated installation are as follows: a rod for a sample,a power-switching current direction and a stable sourceof voltage, an analog-digital converter ADC 16–32F(SDI), a personal computer, and the interface cables.The temperature was measured by a copper-constantanthermocouple located near the sample. The measurementrange of electric resistance (0.01–1014 Ω) was divided intoseveral regions: 0.01–2.5 Ω, where error does not exceed0.5 %; 2.5–107 Ω (error was < 1 %); R = 108 Ω (< 5 %);R = 109 Ω (< 10 %); and R = 1010–1013 Ω (<20 %). Whenmeasuring the electric resistance of CMs, three samplesfor each concentration were tested. The scalar networkanalyzer was used to measure the transmission and re-flection loss within the 25.5–37.5-GHz frequency range.
MaterialsThe initial material for graphite nanoplatelets obtained wasthermally expanded graphite (d = 50–100 μm, l = 3–5 mm).TEG is a product of natural disperse graphite (d = 50–300 μm, h = 5–30 μm) intercalation with H2SO4 and subse-quent heat treatment in a furnace with ascending flowaccording to the method developed, and it was reported ina previously published paper (Fig. 1). To break the obtainedgraphite sheets into the individual or groups of GNPs, theywere sonicated in an acetone medium for 3 h at 40 kHzand 50 W. The electron microscopy investigations haveshown that obtained GNPs are disk-shaped particles. Theirdiameter is about 0.2–30 μm and their thickness is about5–65 nm (Fig. 1c).Then, the GNP powders were divided in two parts. One
part was subjected to UV/ozone treatment, while theother was left intact. The initial GNP powders were sub-jected to UV/ozone treatment for 20 min (GNP (UV/O3)).
Preparation of CompositesFor the investigation of the concentration dependencesof the conductivity, the GNP/polymer composites with0.01–0.05 volume fraction (vol. fr.) of filler were pre-pared. Epoxy resin Larit285 (viscosity of 600–900 mPa s)with hardening agent H285 (viscosity of 50–100 mPa s)
Perets et al. Nanoscale Research Letters (2016) 11:370 Page 2 of 10

was used as the polymer matrix. UV-treated (t = 20 min)GNP filler is mixed with epoxy resin and acetone. Amixture of these components was stirred an additional15 min in an ultrasonic bath for more uniform distri-bution of the filler in the polymer, then the curingagent H285 was added, and a mixture was poured intomolds and cured at room temperature. To completethe polymerization, the molds with composite mixtureswere exposed to the temperature that gradually in-creased from 40 to 80 °C for 5 h.
For the measurements of electrical conductivity, thesamples with the shape of a rectangular parallelepipedwith size 3.5 × 3.5 × 10 mm3 were prepared. The measur-ing conductivity range was from 10−12 to 10 S/m.
Results and DiscussionUltraviolet/Ozonolysis Treatment of NanocarbonTo verify the possibility of chemical functionalization asthe result of UV/ozone treatment, the IR investigation ofGNP before and after UV/ozone treatment has been done.Also, the IR spectrum of TEG sample was recorded.Figure 2 presents the IR absorption spectrum for the
source TEG. Evidently, the absorption spectrum for TEGcontains a series of peaks and bands, two of which corres-pond to the impurities, namely, a wide band at 3410 cm−1
corresponding to the vibration of the bounded –OHgroups (water). A group of peaks is observed in the IRspectrum of TEG in the range 3000 cm−1. They are relatedto the valence C–H vibrations. Besides, several peaks near1600 cm−1 corresponding to the vibration of C=C andC=O multiple bonds are also observed.Ultrasonic dispersion of TEG powder is carried out in
a ultrasonic bath in a liquid medium of acetone for 3 hto obtain the GNPs. As a result, the particles are strati-fied along the TEG planes with van der Waals forces andwe obtain particles of a micron size in plane and nano-meter thickness.As we can see from Fig. 2a, a number of intense lines
which do not exist in the IR spectrum of TEG particleshave appeared in the IR spectrum of GNPs: vibrations(δOH), vibrations of C–O group, and wide double-peakline in the band (3440–3160) cm−1 corresponds to fluctua-tions of hydroxyl group. Also, as it is seen from IR spectrain Fig. 2, the lines which corresponded to fluctuations ofCsp2 –H (2900 cm−1) and Csp
3 –H (2800 cm−1) groups andother lines observed in the spectrum of TEG are not prac-tically observed for the initial sample of GNPs as well asfor irradiated samples of GNPs. Such low relative intensityof the lines associated with fluctuations of carbon atoms isobviously explained by the high relative intensity of thelines that correspond to fluctuations of functional groups.So, as we can see from Fig. 2, the functionalization of
the surface of GNP particles has occurred under theultrasonic dispersion of TEG in the acetone medium.The UV/O3 treatment of GNP powder was carried out
at atmospheric pressure.The UV/O3 treatment is a photo-oxidation process,
when the molecules are excited by the absorption ofshort-wavelength UV radiation, while the carbon atomsat the defect sites of nanotube surface may react withthe atomic oxygen from the continuous dissociations ofthe oxygen molecules.So, the additional functionalization of the surface of
GNP particles could occur in this process. Simultaneously,
Fig. 1 SEM images. a Natural disperse graphite. b TEG. c TEG after3 h of ultrasonic dispersing in acetone (GNPs)
Perets et al. Nanoscale Research Letters (2016) 11:370 Page 3 of 10

the UV treatment leads to cleaning of the surface of theGNP particles. SEM investigation of GNP surfaces beforeand after UV treatment presented in [16] has shown thatthe UV-treated GNPs also exhibit a rougher surface as wellas clearer boundaries between the individual basal planesin comparison with the untreated graphite. It indicates thatloosely bonded materials and organic contaminants on theGNP surface were removed through the UV treatment.IR spectrum of the initial GNP powder is characterized
by a number of bands that correspond to different func-tional groups. Wide double-peak line in the band (3440–3160) cm−1 corresponds to fluctuations of hydroxylgroup. After 20 min of UV/ozone treatment, the redistri-bution of the relative intensities of these two peaks isobserved: the relative intensity of the band correspondedto the free –OH increases and the relative intensity ofbands corresponded to –OH bound decreases. Perhapssuch a redistribution of the relative intensities of thebands indicates the destruction of the carboxyl groupCOOH and of group –OH under UV irradiation.Let us consider the band that corresponds to the
vibrations of group >C=O. This band is formed by separ-ate lines, which is part of the carboxyl and ketone groups(short plot) and carbonyl and lactones groups (long-wavearea). Relative integrated intensity of this band for GNP(UV/O3) is increasing. In the spectra of GNPs, two bandsidentified as deformation vibrations (δOH) –OH group(1409 cm−1) and vibrations group of C–O (1263 cm−1)also are present. In the spectrum for GNP (UV/O3), theintensities of these bands are decreased.Thus, as follows from the IR spectra, UV/O3 function-
alized GNPs do not lead to the appearance of additional
functional groups on the surface of the GNPs. The num-ber of functional groups that arise on the surface of car-bon due to UV/ozone treatment and functionalizationozone significantly is less as compared with the numberof functional groups joining the carbon at the surface afterchemical functionalization (acetone treatment). UV/ozonefunctionalization of carbon apparently causes partial de-struction of some functional groups, such as, for example,carboxyl group, and also reduces the deformation vibra-tions (δOH) and vibrations of C–O group.
Electrical Conductivity of the Polymer Composites withGNPs and GNP (UV/O3)The electrical conductivity of CMs with nanocarbonfiller (GNP/L285, GNP (UV/O3)/L285) was investigated.The concentration dependences of electrical conductiv-ity of investigated CMs are presented in Fig. 3. As onecan see, the electrical conductivity demonstrates the per-colation behavior, and percolation threshold is observedat sufficiently low volume content of filler, ϕcr = 0.021 vol.fr. for CMs with GNPs. As it is seen from Fig. 1, for thecomposite materials GNP (UV/O3)/L285, percolationtransition has shifted to a lower concentration range of0.005 vol. fr. and ϕcr = 0.016 vol. fr. Also, there is a signifi-cant increase in the value of the electrical conductivity ofGNP (UV/O3)/L285 composites for the same content ofGNPs in a polymer matrix.For example, for CM GNP/L285 with a concentration
of 0.0236 vol. fr. GNPs, the electrical conductivity atroom temperature is σ = 5.8 × 10⁻⁵ S/m, and for CMGNP (UV/O3)/L285, the same concentration conductiv-ity is σ = 2.1 × 10⁻³ S/m, which is 36 times more.
Fig. 2 IR spectra of TEG and GNPs before and after UV/ozone treatment
Perets et al. Nanoscale Research Letters (2016) 11:370 Page 4 of 10

It is known that the concentration dependence of theelectrical conductivity of filled polymers is described bythree parameters: the critical concentration ϕcr (percola-tion threshold), the critical index t, and conductivity offiller σfiller in the classical percolation model:
σðϕÞ∼σ fillerðϕ−ϕcrÞt ð1Þ
Analysis of σ (ϕ) dependencies for samples showedthat they can be satisfactorily described by Relation (1).Using the scaling dependence lgσ ~ lg(ϕ − ϕcr), criticalindex t, and electrical conductivity related with filler σfiller(inset in Fig. 3 and Table 1) were determined.It is well known that t = 2 for an ideal three-dimensional
system. As it can be seen in Table 1, the values of criticalindexes of investigated polymer CMs appear to be about1.8–2.2 times greater compared to the theoretical value.Such behavior of critical index t also occurs in other con-ductive mixtures of PANI-PETG [18] and PANI-CA [19].The values of the critical index, presented in Table 1 forthe studied CMs, are higher than those given in the clas-sical theory of percolation, because Eq. 1 does not take intoaccount the specific features of the structure—filler morph-ology, filler interaction with the matrix, the presence of
contact phenomena on the boundary particle-particle, andtechnological conditions of composite fabrication—whichstrongly influence the spatial distribution of conductiveparticles [20–24]. As shown in [25], the critical parameter tmay lie in a range of 1 < t < 6.27 for different types of nano-carbon fillers. This difference in value can be explained alsoby the statistical distribution of the filler in the polymermatrix [26–28]. In addition, high value of index t may beattributed to the extreme geometry of conductive filler par-ticles and indicates the presence of different mechanismsof electric transport in composites.Tunnel conductivity between the anisometric filler
particles in the real composite, which are covered with athin layer of polymer, can be a major mechanism of elec-tric transport in CMs at concentrations in the vicinity ofthe percolation threshold [29] and can lead to not uni-versal values of critical index t, as well as to increase thewidth of the percolation transition.As can be seen from Table 1, the setting σfiller may dif-
fer from their own specific conductivity of the filler,which as shown in [30] is associated with both the con-ductive grid spatial structure of the filler particles, so thenature of the filler particles contacting each other.So, you can see that the classical percolation theory can-
not accurately describe the behavior of the concentrationcurves for CM nanocarbon-epoxy resin. In the classicalmodel of percolation, power dependence of conductivityon the filler content essentially reflects only the increasein the number of conductive chains N*
chain_in_CM. There-fore, to describe the behavior of electrical characteristicsdepending on concentration, temperature, etc., a model of
Fig. 3 Concentration dependence of electrical conductivity of polymer composite materials with GNP and GNP (UV/O3). Inset shows a scalingdependence (lg σ as a function of lg (ϕ − ϕcr) for the determining parameters of Eq. (1). 1 The experimental curves; 2 the calculated curvesaccording to Eq. (1)
Table 1 Percolation characteristics of nanocarbon polymer CMswith GNP and with GNP (UV/O3)
Nanocomposite ɸcr, vol.% σfiller, S/m t
GNP/L285 2.10 3.7 × 10⁵ 3.66
GNP (UV/O3)/L285 1.60 5.0 × 10⁶ 4.44
Perets et al. Nanoscale Research Letters (2016) 11:370 Page 5 of 10

effective electrical conductivity, based on consideration ofthe value of contact resistance between the conductivefiller particles Rк has been proposed in [31].According to this model, the electrical resistance of
CMs with disk-shaped particles (GNP and GNP (UV/O3))can be estimated from the following relation [31]:
where F is the packing factor (for GNP (GNP (UV/O3))F = 0.05); rGNP is the electric resistance of disk-shapedfiller particle r ¼ ρ⋅ d
d⋅h ¼ ρh
� �; therefore, z = h—for GNPs,
where h and d are the thickness and diameter of graph-ite disk-shaped particle, respectively; Rк is the electric re-sistance of single contact between the filler particles;N*chain_in_CM is the number of connected in parallel GNP
chains that conduct electric current and consequently, itis proportional to the number of particles, which takepart in electric transport; and γ is a factor, which variesfrom 1 to 2. Electric resistance of chain from GNPsRchain_with_GNP is proportional to the quantity of filler
particles in one chain NGNP_in_chain N ¼ b 1 cmð Þ⋅γd ¼ γ
d
� �;
where b is the sample length (1 cm).This model takes into account not only the critical
concentration, the packing factor, and the electrical re-sistivity of filler but the morphology of filler particles,namely its aspect ratio, defined as d/h for GNPs. The as-pect ratio of filler particles strongly influences on the
formation of conductive chain and percolation thresholdin filled CMs.Within the framework of the model of effective elec-
trical resistivity, the values of the number of conductivenanocarbon chains N*
chain_in_CM and contact resistanceRk were calculated and reported in Fig. 4.Figure 4 shows that the number of conductive chain
N*chain_in_CM increases with increasing concentration of
filler in the polymer matrix from 3.11 × 103 cm−3 (for0.0236 vol. fr. GNP) to 1.40 × 107 cm−3 (for 0.0469 vol.fr. GNP). At the same time, the value of contact resist-ance Rk decreases with increasing concentration of fillerin the polymer matrix due to the decrease of the thick-ness of polymer layer between the filler particles with in-creasing GNP content in polymer matrix and increase ofprobability for formation of new conductive chains.Let us consider the calculated values of the number of
conductive chains N*chain_in_CM and contact resistance Rk
for CMs with UV/O3-treated GNPs.As shown in Fig. 4, the number of conductive chains
N*chain_in_CM for CM GNP (UV/O3)/L285 also has a
growing dependence on the filler concentration and sig-nificantly exceeds the values of N*
chain_in_CM in CMGNP/L285 for the same content of GNPs. The value ofcontact resistance Rk decreases with increasing concen-tration of nanocarbon filler, but for GNP (UV/O3)/L285composites, the sharp slope of the Rk (ϕ) curve andlower value contact resistance Rk are observed as com-pared with CM GNP/L285 with the same filler content.This change in the value of contact resistance Rk may
be mainly due to the changing of the nature of the
Fig. 4 The number of conductive nanocarbon chains N*chain_in_CM and contact resistance Rk (in inset) of studied CMs, which are calculated by using Eq. (2)
(2)
Perets et al. Nanoscale Research Letters (2016) 11:370 Page 6 of 10
contact between the particles of the filler on the inter-face of carbon-polymer.As it was shown, UV/O3 treatment of nanocarbon par-
ticles leads to additional functionalization of GNPs thatimprove their dispersion because of the electrostatic re-pulsion of the functional groups on the GNPs surface.Besides, it was revealed [17] that the removal of organicsurface contaminants (pollution) and weak bonds fromthe graphite surface through the UV/ozone treatmentmay have an ameliorating effect on the formation ofstronger conductive network. The organic contaminantand weak bonds may possess an electrically insulatingcharacter as the electron scatter. But their removal leadsto a reduction in contact resistance Rk between thenanocarbon particles and the average number of con-ductive chains N*
chain_in_CM in CM increases.
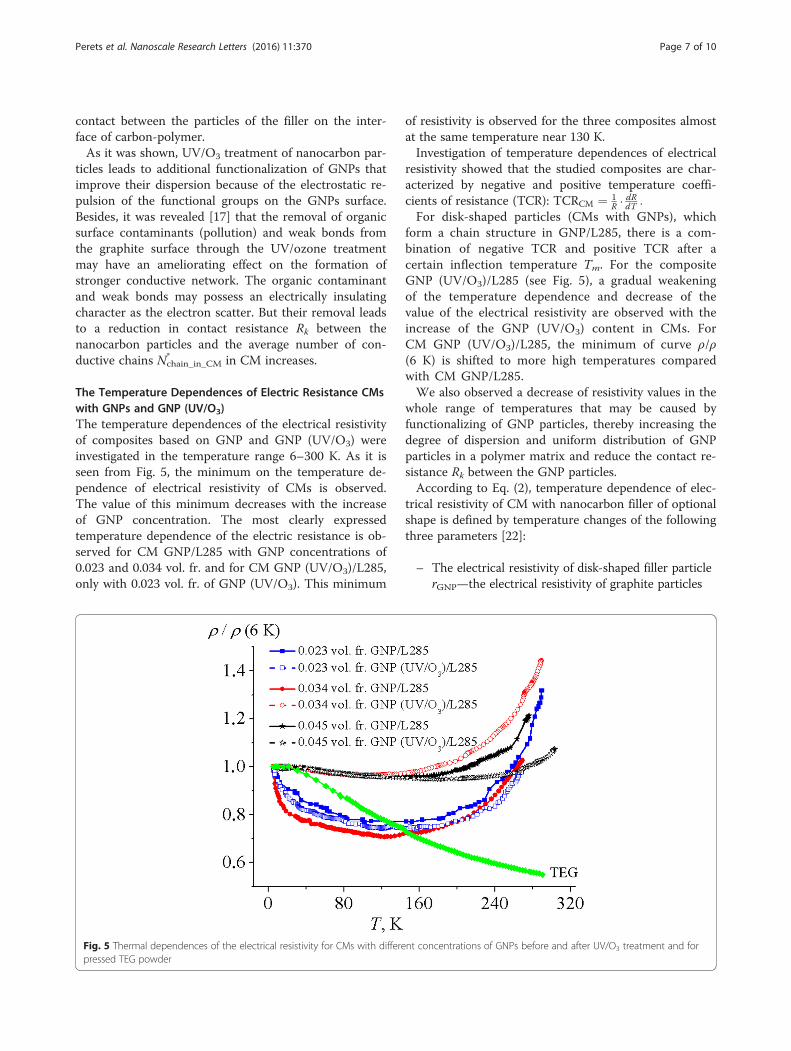
The Temperature Dependences of Electric Resistance CMswith GNPs and GNP (UV/O3)The temperature dependences of the electrical resistivityof composites based on GNP and GNP (UV/O3) wereinvestigated in the temperature range 6–300 K. As it isseen from Fig. 5, the minimum on the temperature de-pendence of electrical resistivity of CMs is observed.The value of this minimum decreases with the increaseof GNP concentration. The most clearly expressedtemperature dependence of the electric resistance is ob-served for CM GNP/L285 with GNP concentrations of0.023 and 0.034 vol. fr. and for CM GNP (UV/O3)/L285,only with 0.023 vol. fr. of GNP (UV/O3). This minimum
of resistivity is observed for the three composites almostat the same temperature near 130 K.Investigation of temperature dependences of electrical
resistivity showed that the studied composites are char-acterized by negative and positive temperature coeffi-cients of resistance (TCR): TCRCM ¼ 1
R ⋅dRdT :
For disk-shaped particles (CMs with GNPs), whichform a chain structure in GNP/L285, there is a com-bination of negative TCR and positive TCR after acertain inflection temperature Tm. For the compositeGNP (UV/O3)/L285 (see Fig. 5), a gradual weakeningof the temperature dependence and decrease of thevalue of the electrical resistivity are observed with theincrease of the GNP (UV/O3) content in CMs. ForCM GNP (UV/O3)/L285, the minimum of curve ρ/ρ(6 K) is shifted to more high temperatures comparedwith CM GNP/L285.We also observed a decrease of resistivity values in the
whole range of temperatures that may be caused byfunctionalizing of GNP particles, thereby increasing thedegree of dispersion and uniform distribution of GNPparticles in a polymer matrix and reduce the contact re-sistance Rk between the GNP particles.According to Eq. (2), temperature dependence of elec-
trical resistivity of CM with nanocarbon filler of optionalshape is defined by temperature changes of the followingthree parameters [22]:
– The electrical resistivity of disk-shaped filler particlerGNP—the electrical resistivity of graphite particles
Fig. 5 Thermal dependences of the electrical resistivity for CMs with different concentrations of GNPs before and after UV/O3 treatment and forpressed TEG powder
Perets et al. Nanoscale Research Letters (2016) 11:370 Page 7 of 10

decreases due to the increase of the charge carrierconcentration (electrons and holes) withtemperature raising under dominated temperature-independent charge carriers scattering on crystallitegrain boundaries, thus TCR is negative and,consequently, RCM decreases when thetemperature increases.
– Contact resistance between the conductive fillerparticles Rк.
– The number of conductive nanocarbon chainsN*chain_in_CM.
Depending on which one of these temperature-dependent processes is primary, we have a positive or nega-tive value of TCR.We know that the average value of contact resistance
between the filler particles Rk, defined as the sum ofelectric resistance through direct contacts Rdir, and thetunneling resistance Rtun [31] is
Rdir Tð Þ∝ρf ð4Þ
Rtun Tð Þ ¼ R0⋅ expT 1
T 0 þ T
� �⋅ exp A⋅δ Tð Þð Þ; ð5Þ
where ρf is the electrical resistivity of nanocarbon filler,the thickness of the polymer layer δ increases duringthe thermal expansion of the polymer matrix by lawδ(T) = δ0⋅(1 + αT(p)T) (coefficient of thermal expansionαT(p)≈1.4 × 10⁻⁴ 1/K for epoxy resin; αT(f )≈2.8 × 10⁻⁵
1/K for natural graphite), which increases the tunnelingresistance Rtun; R0, T1, T0, and A—independent ofthe temperature settings, and actually multiplier exp(T1/(T0 + T)) determine the temperature dependence ofthe electric resistance due to the change of the electricalconductivity of the carbon material and multiplier exp(A⋅δ(T))—the temperature dependence of the electric re-sistance, due to the nature of the filler particles contacteach other (contact area a, the gap δ between the particlesof filler).As noted in [31], tunneling mechanism is the most
famous to interpret conductivity in CM nanocarbon-epoxy resin near the percolation threshold. The analysisshowed that the temperature dependence of the resistiv-ity in CMs with a chain conductive structure (GNP/L285 and GNP (UV/O3)/L285) with filler concentrationsof 0.023, 0.034, and 0.045 vol. fr. can be described withinthe model of effective electrical conductivity (Eq. (2)).Change of the electric resistance at low temperatures
from 6 to 130 K is equal to 10–30 % for samples GNP/L285 and GNP (UV/O3)/L285 with a filler concentrationof 0.045 vol. fr., which correlates with the temperature
dependence of the resistivity of the carbon filler (see Fig. 5).This makes it possible to believe that the main contribu-tion to the temperature dependence of the resistivity at lowtemperatures in CMs is the temperature dependenceof electric resistance changes by direct contact Rdir
(see Eq. (4)). In the case of direct contact between the car-bon particles, contact resistance between particles Rk de-pends on the electrical resistivity of nanocarbon and the
contact area a [31]: Rk ¼ ρf2⋅a at a > > lpl (Holm contact)
and Rk ¼ ρf2⋅a ⋅
lpl2⋅a
� �at a < < lpl (Sharvin contact), where a
is contact spot radius, lpl is the effective path length of thecharge carriers.When the temperature rises above 130 K, the observed
changes in contact resistance Rk are associated with theratio between the coefficients of linear thermal expan-sion for graphite αGr and polymer αP. If αP > αGr, thenwith increasing temperature, i.e., heating decreases thecontact area (decreasing radius of the contact spot a), aswell as the direct contact between individual particles isbroken and the thickness of the polymer layer δ in-creases. This leads to the increase of the tunneling re-sistance Rtun, which exceeds reducing of direct electricalcontact Rdir due to the growth in the electrical conduct-ivity of the material (GNPs) and positive temperaturecoefficient of resistance (TCR) is observed (Fig. 5).For composites GNP/L285 with a concentration of
0.023, 0.034, and 0.045 vol. fr., GNP contribution of tun-neling mechanism increases, which leads to greater de-pendence of contact resistance Rk and, therefore, theresistance of the composite RCM at low temperatures.In CMs with GNP (UV/O3), a strong decrease of the
total contact resistance Rk is observed (see Fig. 4). Begin-ning from the filler concentration 0.034 vol. fr. GNP(UV/O3) in the composite GNP (UV/O3)/L285, the roleof direct contacts Rdir in the contact resistance betweenthe particles Rk increases, so that the particles are tightlynext to each other, and during thermal expansion of thepolymer L285 at the increase of temperature, the poly-mer layer slightly increases that does not influence onthe number of conductive chains N*
chain_in_CM. Effect ofchange in the distance between particles δ when thetemperature rises through a factor exp (A⋅δ(T)) in suchcomposites occurs at much higher temperatures.
The Frequency Dependences of Electric Conductivity CMswith GNPs and GNP (UV/O3)In order to verify the correctness of our reasoning, theelectrical conductivity in the range of high frequency ofelectromagnetic radiation has been studied.Using the experimentally measured values of σdc, ɛ
′r,
tgδ = ɛ′′/ɛ′ for high frequency and the ratio ɛ′′r = σac/(ɛ0ω), the frequency dependence of electrical conductivitywas reconstructed based on the equation ɛ′′r = σac/(ɛ0ω).
(3)
Perets et al. Nanoscale Research Letters (2016) 11:370 Page 8 of 10
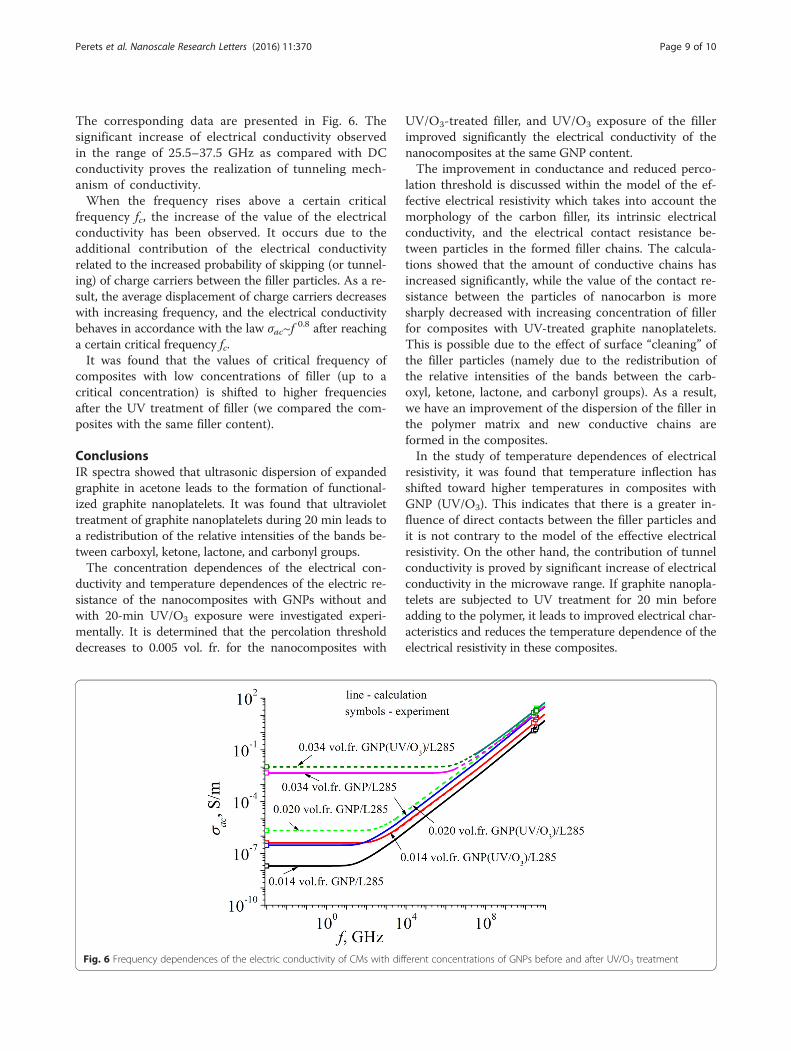
The corresponding data are presented in Fig. 6. Thesignificant increase of electrical conductivity observedin the range of 25.5–37.5 GHz as compared with DCconductivity proves the realization of tunneling mech-anism of conductivity.When the frequency rises above a certain critical
frequency fc, the increase of the value of the electricalconductivity has been observed. It occurs due to theadditional contribution of the electrical conductivityrelated to the increased probability of skipping (or tunnel-ing) of charge carriers between the filler particles. As a re-sult, the average displacement of charge carriers decreaseswith increasing frequency, and the electrical conductivitybehaves in accordance with the law σac~f
0.8 after reachinga certain critical frequency fc.It was found that the values of critical frequency of
composites with low concentrations of filler (up to acritical concentration) is shifted to higher frequenciesafter the UV treatment of filler (we compared the com-posites with the same filler content).
ConclusionsIR spectra showed that ultrasonic dispersion of expandedgraphite in acetone leads to the formation of functional-ized graphite nanoplatelets. It was found that ultraviolettreatment of graphite nanoplatelets during 20 min leads toa redistribution of the relative intensities of the bands be-tween carboxyl, ketone, lactone, and carbonyl groups.The concentration dependences of the electrical con-
ductivity and temperature dependences of the electric re-sistance of the nanocomposites with GNPs without andwith 20-min UV/O3 exposure were investigated experi-mentally. It is determined that the percolation thresholddecreases to 0.005 vol. fr. for the nanocomposites with
UV/O3-treated filler, and UV/O3 exposure of the fillerimproved significantly the electrical conductivity of thenanocomposites at the same GNP content.The improvement in conductance and reduced perco-
lation threshold is discussed within the model of the ef-fective electrical resistivity which takes into account themorphology of the carbon filler, its intrinsic electricalconductivity, and the electrical contact resistance be-tween particles in the formed filler chains. The calcula-tions showed that the amount of conductive chains hasincreased significantly, while the value of the contact re-sistance between the particles of nanocarbon is moresharply decreased with increasing concentration of fillerfor composites with UV-treated graphite nanoplatelets.This is possible due to the effect of surface “cleaning” ofthe filler particles (namely due to the redistribution ofthe relative intensities of the bands between the carb-oxyl, ketone, lactone, and carbonyl groups). As a result,we have an improvement of the dispersion of the filler inthe polymer matrix and new conductive chains areformed in the composites.In the study of temperature dependences of electrical
resistivity, it was found that temperature inflection hasshifted toward higher temperatures in composites withGNP (UV/O3). This indicates that there is a greater in-fluence of direct contacts between the filler particles andit is not contrary to the model of the effective electricalresistivity. On the other hand, the contribution of tunnelconductivity is proved by significant increase of electricalconductivity in the microwave range. If graphite nanopla-telets are subjected to UV treatment for 20 min beforeadding to the polymer, it leads to improved electrical char-acteristics and reduces the temperature dependence of theelectrical resistivity in these composites.
Fig. 6 Frequency dependences of the electric conductivity of CMs with different concentrations of GNPs before and after UV/O3 treatment
Perets et al. Nanoscale Research Letters (2016) 11:370 Page 9 of 10

AcknowledgementsPublication is based on the research provided by the grant support of theState Fund for Fundamental Research (projectNF61/88-2015).
Authors’ contributionsYP, AZ, OY, and LM conceived and designed the experiments. YP, OY, andOB performed the experiments. YP, LM, and IO analyzed the data. LYcontributed to the reagent/material/analysis tools. YP, LY, LV, and OYcontributed in the drafting and revision of the manuscript. LY, LV, and OLsupervised the work and finalized the manuscript. All authors read andapproved the final manuscript.
Competing interestsThe authors declare that they have no competing interests.
Author details1Physics Department, Taras Shevchenko National University of Kyiv, 64/13Volodymyrska Str., Kyiv 01601, Ukraine. 2Chemistry Department, TarasShevchenko National University of Kyiv, 64/13 Volodymyrska Str., Kyiv 01601,Ukraine.
Received: 30 December 2015 Accepted: 4 August 2016
References1. Perets YS, Matzui LY, Vovchenko LL, Prylutskyy YI, Scharff P, Ritter U (2014)
The effect of boron nitride on electrical conductivity of nanocarbon-polymer composites. J Mater Sci 49(5):2098–05
2. Lazarenko O, Vovchenko L, Prylutskyy Y, Matzuy L, Ritter U, Scharff P (2009)Mechanism of thermal and electrical conductivity in polymer-nanocarboncomposites. Mat-wiss uWerkstofftech 40(4):268–272
3. Vovchenko L, Matzui L, Kulichenko A (2007) Thermal characterization ofexpanded graphite and its composites. Inorg Mater 43(6):597–01
4. Perets Y, Matzui L, Vovchenko L, Serdyuk V (2014) Electrical and thermalproperties of epoxy resin filled with nanocarbon and boron nitride. MolCryst Liq Cryst 589:195–01
5. Vovchenko L, Perets Y, Matzui L, Ovsiienko I, Oliynyk V, Launetz V (2012)Shielding coatings based on carbon-polymer composites. Surf Coat Technol211:196–99
6. Vovchenko LL, Matzui LY, Oliynyk VV, Launetz VL (2011) The effect of fillermorphology and distribution on electrical and shielding properties ofgraphite-epoxy composites. Mol Cryst Liq Cryst 535:179–88
7. Stankovich S, Dikin DA, Piner RD, Kohlhaas KA, Kleinhammes A, Jia Y, Wu Y,Nguyen ST, Ruoff RS (2007) Synthesis of graphene-based nanosheets viachemical reduction of exfoliated graphite oxide. Carbon 45(7):1558–65
8. Geng Y, Wang SJ, Kim JK (2009) Preparation of graphite nanoplatelets andgraphene sheets. J Colloid Interface Sci 336:592–98
9. Chattopadhyay J, Mukherjee A, Chakraborty S, Kang J, Loos PJ, Kelly KF et al(2009) Exfoliated soluble graphite. Carbon 47:2945–49
10. Rios R, Alves D, Dalmázio I, Bento S, Donnici C, Lago R (2003) Tailoringactivated carbon by surface chemical modification with O, S, and Ncontaining molecules. Mater Res 6(2):129–35
11. Bikiaris D, Vassiliou A, Chrissafis K, Paraskevopoulos KM, Jannakoudakis A,Docoslis A (2008) Effect of acid treated multi-walled carbon nanotubes onthe mechanical, permeability, thermal properties and thermo-oxidativestability of isotactic polypropylene. Polym Degrad Stab 93:952–67
12. Datsyuk V, Kalyva M, Papagelis K, Parthenios J, Tasis D, Siokou A, Kallitsis I,Galiotis C (2008) Chemical oxidation of multiwalled carbon nanotubes.Carbon 46:833–40
13. Sham ML, Li J, Ma PC, Kim JK (2009) Cleaning and functionalization ofpolymer surfaces and nanoscale carbon fillers by UV/Ozone treatment: areview. J Compos Mater 43(14):1537–64
14. Kim JH, Min BG (2010) Functionalization of multi-walled carbon nanotubeby treatment with dry ozone gas for the enhanced dispersion and adhesionin polymeric composites. Carbon Lett 11(4):298–03
15. Simmons JM, Nichols BM, Baker SE, Marcus MS, Castellini OM, Lee CS,Hamers RJ, Eriksson MA (2006) The effect of ozone oxidation on single-walled carbon nanotubes. J Phys Chem B 110(14):7113–18
16. Li J, Sham ML, Kim JK, Marom G (2007) Morphology and properties ofUV/ozone treated graphite nanoplatelet/epoxy nanocomposites. ComposSci Technol 67:296–05
17. Li J, Kim JK, Sham ML (2005) Conductive graphite nanoplatelet/epoxynanocomposites: effects of exfoliation and UV/ozone treatment of graphite.Scripta Mater 53:235–40
18. Pelster R, Nimtz G, Wessling B (1994) Fully protonated polyaniline: hoppingtransport on a mesoscopic scale. Phys Rev B 49:12718–23
19. Planes J, Wolter A, Chequettine Y, Pron A, Genoud F, Nechtschein M(1998) Transport properties of polyaniline-cellulose-acetate blends.Phys Rev B 58:7774–85
20. Du JH, Bai J, Cheng HM (2007) The present status and keyproblems of carbonnanotube based polymer composites. ExpressPolym Lett 1(5):253–273
21. Hernandez Y, Gryson A, Blighe F, Cadek M, Nicolosi V, Blau W (2008)Comparison of carbon nanotubes and nanodisks as percolativefillers inelectrically conductive composites. Scr Mater 58(1):69–72
22. Lazarenko O, Vovchenko L, Matzui L, Perets J (2011) The electronic transportproperties of the composites with nanosized carbon fillers. Mol Cryst LiqCryst 536(1):72–80
23. Mamunya Y, Muzychenko Y, Lebedev E, Boiteux G, Seytre G, Boullanger C(2007) PTC effect and structure of polymer composites based onpolyethylene/polyoxymethylene blend filled with dispersed iron. Polym EngSci 47(1):35–42
24. Lebovka N, Lisunova M, Mamunya Y, Vygornitskii N (2006) Scaling inpercolation behaviour in conductive-insulating composites with particles ofdifferent size. J Phys D 39(10):1–8
25. Youngs IJ (2002) Exploring the universal nature of electrical percolationexponents by genetic algorithm fitting with general effective mediumtheory. J Phys D Appl Phys 35(23):3127–37
26. Mamunya YP, Levchenko VV, Rybak A, Boiteux G, Lebedev EV, Ulanski J(2010) Electrical and thermomechanical properties of segregatednanocomposites based in PVC and multiwalled carbon nanotubes. J Non-Cryst Solids 356:635–41
27. Feller JF, Linossier I, Grohens Y (2002) Conductive polymer composites:comparative study of poly(ester)-short carbon fibres and poly(epoxy)-shortcarbon fibres mechanical and electrical properties. Mater Lett 57:64–71
28. Mierczynska A, Hermite M, Boiteux G, Jeszka JK (2007) Electrical andmechanical properties of carbon nanotube/ultrahigh-molecular-weightpolyethylene composites prepared by a filler prelocalization method. J ApplPolym Sci 105(1):158–68
29. Bhadra D, Sannigrahi J, Chaudhuri BK, Sakata H (2012) Enhancement of thetransport and dielectric properties of graphite oxide nanoplatelets-polyvinylalcohol composite showing low percolation threshold. Polym Compos33(2):436–42
30. Matzui LY, Vovchenko LL, Perets YS, Lazarenko OA (2013) Electricalconductivity of epoxy resin filled with graphite nanoplatelets and boronnitride. Mat-wiss u Werkstofftech 44:254–58
31. Lai YR, Yu KF, Lin YH, Wu JC, Lin JJ (2012) Observation of fluctuation-induced tunneling conduction in micrometer-sized tunnel junctions.AIP Adv 2(3):032155–8
Submit your manuscript to a journal and benefi t from:
7 Convenient online submission
7 Rigorous peer review
7 Immediate publication on acceptance
7 Open access: articles freely available online
7 High visibility within the fi eld
7 Retaining the copyright to your article
Submit your next manuscript at 7 springeropen.com
Perets et al. Nanoscale Research Letters (2016) 11:370 Page 10 of 10