Embed Size (px)
Citation preview

Swedish University of Agricultural Sciences Faculty of Natural Resources and Agricultural Sciences Department of Economics
Influence of stochastic capital budgeting and real options valuation method on strategic investment decision
- Investment appraisal of synthetic firm producing algae based
fuels in Sweden
Inna Gannoshyna and Valentyn Volkivskyy
Master’s thesis · 30 hec · Advanced level Environmental Economics and Management Master’s Programme Agricultural Economics and Management Master’s Programme Degree thesis No 593 · ISSN 1401-4084 Uppsala 2010

II
Influence of stochastic capital budgeting and real options valuation methods on strategic investment decision - Investment appraisal of synthetic firm producing algae based fuels in Sweden Inna Gannoshyna and Valentyn Volkivskyy Supervisor: Carl-Johan Lagerkvist, SLU, Department of economics Assistant supervisor: Luca Di Corato, SLU, Department of economics Examiner: Hans Andersson, SLU, Department of economics Credits: 30 hec Level: Advanced E Course title: Degree Project in Business Administration Course code: EX0536 Programme/Education: Environmental Economics and Management Master’s Programme, Agricultural Economics and Management Master’s Programme Place of publication: Uppsala Year of publication: 2010 Name of Series: Degree project No: 593 ISSN 1401-4084 Online publication: http://stud.epsilon.slu.se Key words: Real options, NPV, stochastic budgeting, algae fuels
Swedish University of Agricultural Sciences Faculty of Natural Resources and Agricultural Sciences Department of Economics

III
Acknowledgments
This paper is dedicated to the society without global warming, poverty and catastrophes.
Moreover, authors sincerely express the most gratefulness for the front contribution and
gratuitous knowledge shared by:
Professor Carl-Johan Lagerkvist during the course of Quantitative finance and thesis
supervising;
Researcher Luca Di Corato during the course of Real Options Analysis and thesis sub-
supervising in the field of real options;
Chernov Piotr Jakovlevich as a biotechnology founder and advisor in the field of algae
fuels.
The diligence of teaching personnel from SLU is very much appreciated. In particular, many
thanks go to Hans Andersson, Bo Öhlmér, Cecilia Mark-Herbert. However, special
“mathematical” thanks go to Erik Ekström from Uppsala University for helping us not going to
the jungles of American call options, herewith giving the insight for professional development.

IV
Abstract
Algae based fuels may offer society a plenty of valuable benefits. Those include economical,
environmental, and social benefits representing sustainability. Investors may have a wealth
maximising option to diversify their portfolio hence reducing risks. Besides tax income and
reduced unemployment rate, government gets a facility to reach environmental goals and to
obtain energy security. When investor and government are satisfied, the other groups of
society in a whole enjoy sustainability amenities.
However, researches that have been done in the area of algae fuels have still controversies
whether the technology can be worth of attention. In spite of the debates, there are companies
claiming that they run commercial installation. As a fact, these commercialisations are carried
out in complete secrecy. Herewith, there are no enough information available helping investors
to study economical feasibility of technologies. Since it has a place, the industry of algae fuel
production is not very well supported and hence has a barrier for development.
This paper considers an investment appraisal of technology producing algae based fuels. This
technology has been technically and economically approved on the pilot project but in the less
developed country. However, neither this technology nor analogs are present in Sweden.
Therefore, authors evaluate it in the conditions of developed market of Sweden. The
economical and financial evaluation of synthetic firms comprises classical Net Present Value
approach, Stochastic Capital Budgeting and Real Option valuation. The set of these methods
was chosen for testing the project on robustness in the condition with uncertainties and
flexibilities. This is for the purpose to assist investment managers in the case when net present
value appraisal is not enough for objective decision “to invest now or wait”.
V
Abbreviations
ABF - algae-based fuel BAT - best available technology Bb – Botryococcus braunii CCS - Carbon capture and storage CHP - combined heat and power plant DH - district heat plant EXW – ex work (international commercial terms 2008) GHG - green house gas HTU – Hydro Thermal Upgrading HVP – high value added product IRR – internal rate of return LED – Light Emitting Diode NPK – Nitrogen, Phosphor, Kalium (potassium) NPV – net present value SME – small and medium enterprises ROA – Real Option Analysis b/cd – barrels per calendar day bbl – barrels b/d – barrels per day tcf – trillion cubic feet ppm – parts per million EBITDA – earnings before interest, tax, depreciation, amortisation GMB – geometric Brownian motion NCF – net cash flow (revenue minus cost) RSD – relative standard deviation RME – rapeseed methyl ester B2B – business – to – business B2C – business – to – customer

VI
Glossary
Axenic – “describes a culture of an organism that is entirely free of all other
"contaminating" organisms (www, Wikipedia, 6, 2010)”;
Bio-catalytic cracking – “refining process of breaking down the larger, heavier, and more
complex hydrocarbon molecules into simpler and lighter molecules. Catalytic cracking is
accomplished by the use of a catalytic agent (Catalyst) and is an effective process for
increasing the yield of gasoline from crude oil (EIA, 2006)”. Prefix “bio-“ means that there is
an organic matter taking place in the process (Rozzell, 1999);
Bio-crude (Green crude, biopetroleum) – biological material derived from living, or recently
living organisms used for distillation of carbon-based fuels. (www, Wikipedia, 3, 2010);
Botryococcus braunii (Bb) – “is a green, pyramid shaped planktonic microalgae. The species
is notable for its ability to produce high amounts of hydrocarbons. Up to 86% of the dry
weight of Bb can be long chain hydrocarbons i.e. botryocuccus oils: botryococcenes,
alkadienes and alkatrienes. Transesterification can NOT be used to make biodiesel from
botryococcus oils” (Banerjee, et al., 2002; Metzger and Largeau, 2005; www, Wikipedia,
10, 2010);
Carbon neutral – “refers to achieving net zero carbon emissions by balancing a measured
amount of carbon released with an equivalent amount sequestered or offset” (www,
Wikipedia, 14, 2010);
Catalyst – a substance that increases the rate of a chemical reaction without itself
undergoing any permanent chemical change, and may be regenerative (Soanes, C.,
Stevenson, A., 2006);
Cetane number – “Generally, diesel engines run well with a CN from 40 to 55. Fuels with
higher cetane number which have shorter ignition delays provide more time for the fuel
combustion process to be completed. Hence, higher speed diesels operate more
effectively with higher cetane number fuels” (www, Wikipedia, 12, 2010);
Continuous stirred-tank reactor – “also known as vat- or backmix reactor, is a common
ideal reactor type in chemical and environmental engineering” (www, Wikipedia, 9, 2010);
Distillation – “method of separating mixtures based on differences in their volatilities in a
boiling liquid mixture. Distillation is a unit operation, or a physical separation process, and
not a chemical reaction. It is used to separate crude oil into more fractions for specific uses
such as transport, power generation and heating” (www, Wikipedia, 19, 2010 );
Eichhornia (Water hyacinth) – “are a free-floating perennial and fastest growing aquatic
plants, can double their population in two weeks. Water hyacinth may rise above the
surface of the water as much as 1 meter in height. The leaves are 10–20 cm across, and
float above the water surface. It has a high capacity of uptaking heavy metals, such as Cd,
Cr, Co, Ni, Pb and Hg etc, plant has abundant nitrogen content, it can be used a substrate
for biogas production” (Joel de la Noie, 1998; Reddy and Tucker, 1983; www, Wikipedia, 7,
2010);
Fatty acid methyl ester (FAME) – “can be created by an alkali catalyzed reaction between
fats or fatty acids and methanol. The molecules in biodiesel are primarily FAMEs, usually
obtained from vegetable oils by transesterification” (www, Wikipedia, 5, 2010);

VII
Fischer-Tropsch synthesis – “is a catalyzed chemical reaction in which synthesis gas, a
mixture of carbon monoxide and hydrogen, is converted into liquid hydrocarbons of
various forms. The principal purpose of this process is to produce a synthetic petroleum
substitute, typically from coal, natural gas or biomass” (www, Wikipedia, 8, 2010);
Gasification – “process that converts carbonaceous materials, such as coal, petroleum,
biofuel, or biomass, into carbon monoxide and hydrogen by reacting the raw material, such
as house waste, or compost at high temperatures with a controlled amount of oxygen
and/or steam. The resulting gas mixture is called synthesis gas or syngas and is itself a fuel”
(www, Wikipedia, 20, 2010);
Green fuels – when biocatalytic cracking and traditional fractional distillation used to
process properly prepared algal biomass i.e. biocrude, then as a result we receive the
following distillates: kerosene (jet fuel), gasoline, diesel, etc.. Algae are low-input, high-
yield feedstocks to produce biofuels. It is claimed that algae can produces up to 30 times
more energy per acre than land crops such as soybeans, etc. (Rapier, 2008; www,
Wikipedia, 4, 2010);
Hydrocyclone – “a device to classify, separate or sort particles in a liquid suspension based
on the densities of the particles. Hydrocyclone may be used to separate solids from liquids
or to separate liquids of different density” (www, Wikipedia, 18, 2010);
Hydroprocessing (uncountable)– Any of several chemical engineering processes including
hydrogenation, hydrocracking and hydrotreating, especially as part of oil refining;
In situ – its natural place or position (Latin) (Soanes, C., Stevenson, A., 2006);
Inter alia – among other things (Latin) (Soanes, C., Stevenson, A., 2006);
Medium – the substance in which an organism lives or is cultured (Soanes, C., Stevenson,
A., 2006);
Mental frame – mental construct consisting of elements, and the relations among them,
that are associated with a situation that is of interest of a decision maker (Beach and
Connolly, 2008);
Phytoremediation aka bioremediation – “systematic use of plants to treat environmental
contamination. It is being investigated as a potential low-cost technology to help meet
environmental regulations” (www, House Committee on Agriculture, 1, 2010);
Polyaromatic hydrocarbon – “i.e. polycyclic aromatic hydrocarbons (PAHs) known for their
carcinogenic, mutagenic and teratogenic properties” (www, Wikipedia, 11, 2010);
Pyrolysis – “chemical decomposition of condensed substances by heating, that occurs
spontaneously at high enough temperatures. The word is coined from the Greek-derived
elements pyro "fire" and lysys "decomposition"(www, Wikipedia, 16, 2010);
Rectification column. “Rectification is an application of distillation and its uses include
fractionation of crude oil. If the distillate obtained during distillation is distilled again, a
new distillate is obtained with an even higher concentration of volatile components. As the
procedure is repeated, the concentration of volatile components in the distillate increases
on each occasion. In practice, this multi-stage distillation process is carried out in the form
of countercurrent distillation (rectification) in a column” (www, GUNT Hamburg, 1, 2010);

VIII
Sulphur – “burning of coal and/or petroleum by industry and power plants generates sulfur
dioxide (SO2), which reacts with atmospheric water and oxygen to produce sulfuric acid
(H2SO4). This sulfuric acid is a component of acid rain, which lowers the pH of soil and
freshwater bodies, sometimes resulting in substantial damage to the environment” (www,
Wikipedia, 13, 2010);
Transesterification – is a chemical process of transforming large, branched, triglyceride
molecules of vegetable oils and fats smaller, straight chain molecules, almost similar in size
to the molecules of the species present in diesel fuel (Pandey, 2008).
Peak oil - “The term Peak Oil refers the maximum rate of the production of oil in any area
under consideration, recognising that it is a finite natural resource, subject to depletion”
invented by Colin Campbellin (2001) cited in Robelius (2007.)
Third generation fuels – are the fuels are derived from non-edible sources. Read more in
chapter 3.
Bio – feedstock – raw material used in the production and manufacturing of a product.
Prefix “bio-“ means that there is an organic matter taking place in the process (Rozzell,
1999)
Energy security – “or security of supply, is the ability to supply energy to meet demand at a
price that protects economic growth. Uneven distribution of fossil fuel supplies among
countries, and the critical need to widely access energy resources, has led to significant
vulnerabilities. Threats to global energy security include political instability of energy
producing countries, manipulation of energy supplies, competition over energy sources,
attacks on supply infrastructure, as well as accidents and natural disasters” (www,
Wikipedia, 2, 2010).

Table of content
1 Introduction ............................................................................................................................ 1
1.1 Problem background ........................................................................................................ 2
1.1.1 Opportunity background .......................................................................................... 4
1.1.2 Investors’ problem as a focal problem ..................................................................... 4
1.2 Aim ................................................................................................................................... 5
1.3 Purpose of the study ........................................................................................................ 5
1.4 Delimitations .................................................................................................................... 5
2 Method ................................................................................................................................... 6
2.1 Approach, choice of method ............................................................................................ 6
2.2 Choice of country ............................................................................................................. 6
2.3 Choice of technology ........................................................................................................ 7
3 Algae based fuel industry (review) ......................................................................................... 8
3.1 Technology outline ........................................................................................................... 8
3.1.1 Application areas .................................................................................................... 10
3.2 BioDieselDnepr knowhow .............................................................................................. 11
3.2.1 General supremacy ................................................................................................. 11
3.2.2 Technological process and the methods incorporated .......................................... 12
3.2.3 Uncertainties of technological process................................................................... 15
3.2.4 Product slate ........................................................................................................... 15
4 Theoretical framework ......................................................................................................... 17
4.1 Traditional methods used in investment appraisal ....................................................... 17
4.1.1 NPV .......................................................................................................................... 17
4.1.1.1 Disadvantages of NPV ...................................................................................... 17
4.1.2 IRR ........................................................................................................................... 18
4.1.3 Payback period ........................................................................................................ 18
4.1.4 Sensitivity analysis .................................................................................................. 18
4.2 Forecasting methods used for time series data. ............................................................ 18
4.3 Real Option Analysis (ROA) ............................................................................................ 19
4.3.1 Stochastic capital budgeting ................................................................................... 20
4.3.2 Monte Carlo Simulation Method ............................................................................ 21
4.3.3 Critiques on ROA ..................................................................................................... 21

4.4 Previous research and studies ....................................................................................... 22
4.5 Modelling of the problem .............................................................................................. 22
4.5.1 Parameter estimation ............................................................................................. 22
4.5.2 ROA modelling ........................................................................................................ 22
5 Background for empirical study ............................................................................................ 26
5.1 Biofuels in Sweden – Energy Policy Overview ............................................................... 26
5.2 Governmental support ................................................................................................... 27
5.2.1 Tax reliefs on biofuels ............................................................................................. 27
6 Empirical findings .................................................................................................................. 28
6.1 Conditions for capital budgeting model ......................................................................... 28
6.2 Initial investment outlay ................................................................................................ 28
6.3 Sources of inflows and outflows .................................................................................... 31
6.4 Results of traditional evaluation method ...................................................................... 33
6.5 Stochastic budgeting ...................................................................................................... 34
6.5.1 Uncertainties imbedded in the stochastic budgeting............................................. 34
6.5.2 Results of stochastic budgeting .............................................................................. 35
6.6 Results of real option analysis ........................................................................................ 36
6.7 Deviation of results ........................................................................................................ 37
7 Analysis and discussion ......................................................................................................... 38
7.1 Economic and financial feasibility of the ABF production plant .................................... 38
7.2 Impact of evaluation methods on investment decision ................................................ 39
7.3 Opportunities and obstacles for adopting ABF production in Sweden ......................... 40
8 Conclusions ........................................................................................................................... 43
8.1 Suggestions ..................................................................................................................... 43
Reference list: ............................................................................................................................... 45
Literature and publications ....................................................................................................... 45
Personal communications ......................................................................................................... 50
Internal sources ......................................................................................................................... 51
Internet sources ........................................................................................................................ 51
Software used............................................................................................................................ 54
Enclosures ..................................................................................................................................... 55

1
1 Introduction The degree and number of ecology related problems discovered, accepted and not solved
worldwide indicate that humanity did not overcome them yet. It might mean that human kind
badly think of consequences of decisions they take. It might moreover mean that people do not
concur on the common problem but solve own money driven problems forgetting about
environment. The money driven behaviour leads to competition with each other and hence to
protection of information, i.e. findings of knowhow solution to those problems. This
competitive protection of information leads to postponing in practical realisation of those
findings, therefore a progress overcoming environmental problems is not yet observed. In fact,
humanity should anticipate and outstrip those problems before taking decisions.
The outstripping solution may be a technology that is able to solve the range of ecological and
economical problems. Water and atmosphere contaminations as well as energy security are
those problems that can be avoided with the considered in this paper technology (pers. com.
Chernov et. al., 2010). The technology, which produces direct fossil fuel substitutes like
gasoline, diesel and kerosene, uses a bio-feedstock cultivated on its production site. Microalgae
are the feedstock, which is renewable and alternative source for green fuels. Herewith
according to the statements by Grahn and Hansson (2009), Nygren (2008), Ruth (2008), the
technology belongs to the third generation.
However, competing behaviour does not allow the solution to be practically realised. This is
because of controversies among scholars’ opinions about economical feasibility of such
technology where pessimistic views are prevailing. On the other hand, we observe that big
corporations invest huge money in the algae fuel pilot production whereas it can be also a
business for small and medium enterprises. Moreover, investments in such industry are not
observed at any level in some countries including Sweden. Thus, it might be a missing
opportunity for Sweden as an environmentally conscious country.
In this paper authors consider, by doing an economical feasibly study, the technology that has
technical potential to be adopted at any level of business enterprise in Sweden.
The more particular reasons for doing this are outlined in the consequent sub-chapters with
reference to the literature research.

2
1.1 Problem background
Considering why the technology should be adopted in Sweden, one should take into account
problems of more wide content. As it was mentioned, there are problems of environmental
and economical nature. Let have look on the problem of economical nature first. One of those
is energy dependency on imports of liquid fuels and bio-feedstock for biofuels from other
countries. If reader look at the below table 1, it may become clear that energy dependency for
Sweden is crucial issue for energy security of the country. Absence of own oil and gas
productions can negatively influence on overall economy of the country.
Table 1. Petroleum reserves (Hilyard, 2008)
Moreover, this table should be read having in mind the consequences of near future given the
fact that depletion of oils is globally reached their peak. According to Robelius’s forecasts
(2007), the oil industry experiences a “Peak oil” tendency. According to the best-case scenario,
human kind will observe decline in supplies of fuels at the end of the current decade (ibid).
Having zero oil production and reserves (Hilyard, 2007; Hilyard, 2008), and in spite of recent oil
drilling tests (OPAB and Oljeprospektering, 2007) in the Baltic sea, Sweden has various
environmental objectives leading to become an oil free society until 2030 (www,
Regeringskansliet, 1, 2010; Persson, 2006; Sahlin, 2005).
Therefore, goals of energy independency and environmentalism are major incentives for
national policies. Obviously, energy dependency on other countries’ supplies lead to the
uncertainty in national security. Different actions are practiced in order to reach the goals of
energy and environmental safety. Hence, politicians (Naturvårdsverket, 2005) by means of
economical and environmental instruments encourage production and use of bio-fuels. These
include tax reliefs on bio-fuels, subventions on instalment of newly developed technologies,
support of R&D in the area of alternative energy supplies, etc. (Persson, 2006).
As it is clear and an accepted fact by policy developers, the presence of bio-feedstock does not
fulfil the total country demand for fuels. Forest residuals, agricultural crops that are in conflict
with the food supply, are considered major feedstock for biofuels today. This is also the case
with ethanol, which will be largely imported if the goal of full fossil fuel avoidance is to be
reached (Hilyard, 2007; Persson, 2006; Sahlin, 2005). Taking into consideration the scarcity of
such (Andræ, 2009; Persson, 2006), it creates imports of raw materials, meaning that problem
of oil (energy) dependency still exists and hence it is not possible to reach the energy
independency goal for the country, whatsoever at the end of the days.
Country Sweden Denmark Norway Germany
Refining capacity 437,000 b/cd 174,400 b/cd 315,000 b/cd 2,417,083 b/cd Oil production 0 312,000 b/d 2.25 million b/d 67,500 b/d Oil reserves 0 1.188 billion bbl 6.865 billion bbl 367 million bbl Gas reserves 0 2.490 tcf 79.13 tcf 9 tcf

3
Geo-economic dependency on the energy sources and their possible scarcity initiate
engineering of renewable energy. There are commercially successful technological realisations
in exploitation the renewable sources, but whether they are socially or environmentally
justified; this is another aspect of the issue. However, production of algae-based fuels (ABF) as
one of those alternatives seems to be environmentally friendly, whereas commercialisation of
the technology needs to be realised (Marsh, 2009; Carlsson, et al., 2007).
The barrier for technology to be widely realised include numerous approaches and conclusions
that are withdrawn by commercial and scientific researches in the area. This phenomenon may
be enriched with commercial secrecy and vested interests from lobby group of oil industry. The
enclosure 1 illustratively represents an enormous amount of methods and approaches
incorporated in the area of bio-fuels industry. Moreover, this area should be considered in the
content of multiple uncertainties: content of political, market, human, and operational factors.
Production of biodiesel is often associated with the high cost involved in the process of oil
extraction from biomass (Andræ, 2009). When one talks about biodiesel, we immediately see a
picture of exploitation such agricultural crops as canola, sunflower, etc. Many investigators
(Alabi et al., 2009) perceive a new source of biomass as algae somewhat sceptically claiming
that fuels from algae will not be competitive with fossil fuel either, because the process of oil
extraction is still practiced (Cherubini, et al., 2009; Brennan and Owende, 2010). Nevertheless,
if there would exist a method, which cuts major costly processes in production, investors will
be still reluctant to take an investment decision until more practically approved information
arrives.
There are sources claiming that ABF production is not yet economically attractive (Mata, et al.,
2010; Walker, 2009). On the other hand, conclusions from the laboratory research and pilot
projects demonstrate that ABF may be very competitive with the fossil-fuel if the certain
conditions are met (Brown, 2009; pers. com. Chernov, 2010). Scientific and commercial
experiments to produce high-value added products (HVP) and ABF products are carried out
since the 1960s (Sheehan et al., 1998; Spolaore, et al., 2006). Those experiments are done
more privately and only a few economic feasibility studies are publicly available, and must rely
on the little data (often based on the engineering estimates) available in the public domain
(Dmitrov, 2007; Fredin, 2009). However, the facts of economic attractiveness are also
supported by the heavy investments with the oil giants ExxonMobil Corp, Chevron, avian
corporations, private investors, government programs, and specialised companies (Marsh,
2009; www, Oilgae, 1, 2010).
Herewith, taking into account the above mentioned unfavourable for technology situation in
the field, one may conclude that lack of economical feasibility studies may restrain the decision
maker from thinking of this technology as a solution for environmental and economical
problems. Definitely, the decision maker can represent either or both investor groups, i.e.
private as well as political. Therefore, the results of this economical feasibility study should
disclose at least to what degree the considered technology could be financially attractive in the
uncertain conditions.

4
1.1.1 Opportunity background
The degree of controversy of above claims makes authors to think of taking the most promising
technology into the Swedish setting and study it for economic efficiency. The ongoing debate
besides other factors brings the uncertainty to the investors. As a result, environmentally
friendly industry faces barriers in its development. The environmentally positive impact of ABFs
is inter alia explained by the fact of carbon neutrality (Packer, 2009). Production of ABF
eliminates introduction of new CO2 that is going to be depleted from the earth with crude oil.
The amount of CO2 exhausted with combustion of the 1st ton of ABF is used back for algae
nutrition leading to the 2nd ton of ABF and so forth making close loop. It is technically easy
(pers. com. Chernov et al., 2010) to equip the most polluting industries with ABF production
which can play role of carbon offsetting, and some of those industries are the following: the
district heat (DH) and combined heat and power plants (CHP); iron and steel industry; cement
producers.
Due to dynamically developing environmentalism, the mentioned industries experience a
burden of legislative restrictions in regards to the technogenic factors they bring. Those
requirements lead to the use of best available technology (BAT) with less polluting features.
They tend to use the alternative bio-feedstock and\or the green house gas (GHG) preventing
technologies at the current premises. Nevertheless, it might be costly to make revamps,
retrofit, etc. Hence, it is important to find the proactive solutions to not only reduce emissions
as it is facilitated by carbon capture and storage (CCS) methods but produce green fuels.
A recent finding by Kolesnikov, et al. (2009) that resources of mineral oil seem to be in
abundance can bring higher uncertainties to the alternative energy investment decisions.
Plenty of mineral oil can have a downwards price effect on fossil fuel making biofuels
uncompetitive. In fact, Kolesnikov’s, et al. (2009) finding is theoretical one and it might take
decades until it realises to practice. However, such trends make a decision to be uncertain
today: whether to invest into ABF production or wait. Today, it is when we already met
environmental challenges that must be abolished by means of knowhow and innovation.
The opportunity is a technology invented by BioDieselDnepr Ltd. and other relative
stakeholders, which according to the claims of innovators is defended on the pilot project as
being competitive with fossil fuels at the current state of affairs of Ukrainian market.
Economical evaluation of given technology is introduced in the enclosure 4. The knowhow
methods applied in the technology is the result of long lasting scientific work and experiments
carried out in the Chemistry-Technological University of Dnepropetrovsk and Polytechnical
University of Charkov, Ukraine, and practically realised by Chernov et al., (2010) in
BioDieselDnepr Ltd.. Encouraging, was the proclamation from the Cabinet of Ministers of
Ukraine endorsed on 22 of December, 2006, by № 1774 “The program of biofuels production
development”.
1.1.2 Investors’ problem as a focal problem
Investors may find it complicated to venture in the newly developed technology mainly having
in mind a few alternative options to invest considering the volatility of (market) fuel prices. Due

5
to high degree of uncertainty in returns, high operational and adoption costs, investors and
firms are not readily adopting technology of third generation biofuels production (Walker,
2009; Alabi et al., 2009).
Many investment decisions involve both large sunk cost of investment and uncertainties
regarding future prices, operational costs, tax and regulatory policies. Widely used Net Present
Value (NPV) rule doesn’t represent the real picture of the investment and thus some implicit
assumptions are often overlooked (Dixit and Pindyck, 2004). In reality, such characteristics as
irreversibility and a possibility to delay are very important in most of the investment decisions.
A rapidly growing literature in a real option theory shows that ability to delay an irreversible
investment costs greatly affect investment decision (ibid). Often, decisions are made not only
on the concrete numbers but involve more complex and sophisticated process such as
involvement of intuition, personal attitudes, preferences and characteristics (Lee et al., 1999).
1.2 Aim
The aim of this research is to analyze the economic and financial feasibility of ABF production in
Sweden on the basis of BioDieselDnepr technology using traditional investment appraisal
methods, stochastic budgeting and theory of real options.
Therefore the key research (problem) questions are:
1. Will ABF production be profitable without governmental support in the developed
economic environment?
2. How do considered methods change managerial decision to invest?
3. What are the opportunities and obstacles for adopting such technology in Sweden?
4. When is it optimal to invest in ABF production?
1.3 Purpose of the study
Despite all obstacles preventing the progress of ABF production, we should contribute to the
promotion of such industry. There are many fascinating issues surrounding algae. However, we
touch upon the ABF production from the economical aspect, since the financial feasibility can
be an initial stimulus for the stakeholders who stand behind political and investment will.
The purpose of this study is to see whether there is an economical feasibility behind the
considered technology. If the results will be positive then there is a sense to provide it on the
Swedish market, which can stay in line with national objectives. We believe that if the
technology shows itself viable in the conditions of developed market, it will be even more
financially attractive for the rest of the world.
By doing the calculus, we strive to make an input into the research area. Herewith, we expect
that new data and questions will arrive that should be solved in the further research. For
instance, life circle and cost benefit analysis including energy balance, and environmental
assessment will have to be carried out after this paper.
1.4 Delimitations
No engineering and biochemistry issues are of concern in details.

6
2 Method This chapter outlines different methods used in gathering the data for empirical study,
literature review, deciding on theory, country and technology.
2.1 Approach, choice of method
We have selectively applied a set of methods from marketing research approach suggested by
Kotler and Keller (2006, pp. 102-118), and Jobber and Fahy (pp.81-94). As a fact some
informational sources are inaccessible therefore we eluded them relying on available materials.
The literature presented and discussed in this paper has been mainly accessed from LIBRIS, the
national database of Swedish libraries. During the literature and publications search, there
were also used such databases as ScienceDirect, Web of Knowledge, Scopus, Ebrary, Emerald,
Jstor. The keywords used are presented in the enclosure 5.
The data for empirical study was obtained from the internal source of the Ukrainian company
BioDieselDnepr as a report from the pilot project. Besides that, a field research was conducted
in gathering the input data applied in the models where qualitative and quantitative sources of
information were used such as e-mail communication with sales persons and managers, phone
interviews. Secondary sources of information were of great help in the forms of reports and
web pages of relevant institutions.
Data analysis is aimed to measure the economic attractiveness of ABF production and
therefore quantitative analysis has been chosen for this study. The main tools for analytical
evaluation were the following software: @Risk, Risk Simulator 2010 and Excel 2007.
Throughout the text, there have been used the technological terms. These are indicated in
italic typeface. For readers’ convenience, the definitions for these terms are taken from open
public sources and are cited in the chapter “Glossary”.
2.2 Choice of country
There are numerous incentives to
consider Sweden as the country of
choice. Those vary from the personal
to social significance. However, the
most-valuable are the following:
Government initiatives and the large demand for green fuel have attracted investments
in the sector. The inability of domestic supply to meet demand coupled with the targets
set for efficiency in the transportation sector is expected to boost the market. (Cormick
and Kaberger, 2005);
Target to be the first oil free society in the world must be supported (Sahlin, 2005,
Hilyard, 2007);
Limited raw material resources for the 1st and 2nd generation biofuels (Andræ, 2009);
There is no commercial competition existent in the area of ABF industry in Sweden
(Fredin, 2009), however research is started in 2010 by the Sveriges tekniska
forskningsinstitut in Borås (Grahn and Hansson, 2009).
“Sweden has a chance to be an international
model and a successful actor in export markets for
alternative solutions,” said Mona Sahlin (2005),
minister for sustainable development in Sweden.

7
2.3 Choice of technology
The main reasons for choosing BioDieselDnepr technology are a multiple ability of algae as a
feedstock to solve the problematic areas of anthropogenic life. By disclosing the economical
aspect of germinating alternative solution, we would like to contribute to it because of its
positive effect in the subsequent issues.
Algae fuels do not conflict with food or feed crops: unlike first generations biofuels, cultivation
of algae does not require land and much water. Land-based cultivation systems do not depend
on soil fertility and can be conducted on barren land (Alabi et al., 2009; Campbell, 2008;
Neltner and Tester, 2008). Farming of algae culture in the closed land based systems is done all
around year independently of seasonal weather changes (Mata et al., 2009).
Sustainable use of water resources: Both marine and freshwater algae can be cultivated, so
either source of water can be used. Some freshwater species can be grown in higher salinity.
The technological process allows for sustainable recycling of water in the system and use of
wastewaters (pers. com. Chernov et al., 2010). Wastewater treatment can be done by removal
of NH4+, NO3
-, PO43-, and organic meters, making algae to grow using these water contaminants
as nutrients (Mata et al., 2009).
Benefits to farmers: farmers can organise fuel supply cooperatives having significant reduction
on input cost, generating rural employment, and increasing rural electrification and heat
(Alkalay, 2007; Alabi et al., 2009). It is known, cooperatives allow for achieving economies of
scale and vertical integration into supply chain gaining market control which is economically
feasible (Nilsson, 2004; Royer, 2003).
Energy security: Green fuels from algae share the same benefits with 1st and 2nd generation
biofuels, such as the potential to increase energy independency by reducing reliance on
imported fuels and bio-feedstock (Alabi et al., 2009; Demirbas, 2009).
Mitigation of atmosphere pollutions: Algae are theoretically carbon neutral in that they recycle
CO2 otherwise released to the atmosphere, rather than adding CO2 to it (as occurs when fossil
fuels are burned) (Mata, 2009; Alabi et al., 2009; Demirbas, 2009; Packer, 2009).
In addition, we consider the areas of practical utilisation of above mentioned potential which
are introduced in the chapter 3.1.1 “Application area”.

8
3 Algae based fuel industry (review) Taxonomy of science in the algal area dates back to the 1800th. William Henry Harvey (1811—
1866) was the first to divide the algae into four divisions based on their pigmentation (www,
Wikipedia, 15, 2010). However, a Dutch microbiologist, Martinus Willem Beijerinck (1851-1931)
has been an initiator to report about a pure (axenic) culture of algae stems (Andersen, 2005).
Whereas the 20th century was a period when algae was discovered and tested on the subject of
the HVPs, energy source, and environmental remediation.
Nowadays, the hypothesis of possibility to produce wide range of synthetic fuels has been
proved on the pilot projects worldwide (www, Oilgae, 1, 2010). As a result, algae as the
renewable source has been considered throughout two generations of liquid biofuels, and
today synthetic fuels derived from algae considered as the third generation green fuels. The
main feature of green fuels is that they are alike with fossil fuels and even somewhat better in
the quality. The distinguishing character of the 3rd generation from the 1st and 2nd generation
fuels is its utility to be used as original fuel without a need to be blend with fossil fuels as it is in
case with ethanol and biodiesel. Whereas, the 3rd generation fuels fit to the existent petroleum
products storage and distribution infrastructure, moreover can be integrated to the petroleum
refining facilities.
However, 1st generation biofuels refined from terrestrial crops such as sugar cane, sugar beet,
maize and rape seed create a harm on world food markets, help to cause water shortages and
precipitate the destruction of the world’s forests. The 2nd generation biofuels derived from
lingo cellulosic agriculture and forest residues and from non-edible feedstock address some of
the above mentioned problems. However, there is concern over competing land use or
required land use changes. Therefore, based on current knowledge and technology projections,
3rd generation fuels specifically derived from microalgae are considered a technically viable
alternative energy resource that is devoid of the major drawbacks associated with 1st and 2nd
generation biofuels.
3.1 Technology outline
To the problem background, we should additionally elucidate how complex the ABF area is.
From a diagram presented in the enclosure 1, one can see how vast the distribution of research
area should the decision maker take into account. The same reason compels us to restrain
describing those technological pros and cons because of colossal multiple-choice variables.
Furthermore, it can be argued by the fact that there is no enough primary and historical data
available simply due to the commercial confidentiality (Berg-Nilsen, 2006; Andræ, 2009; Fredin,
2009). Most researches are privately financed and hence the primary data is barely accessible.
Therefore, this and other social phenomenon is, as result, halting the progress in the area.
Moreover, if we put those into different content like political, market, climate factors, it will
even complicate the choice for decision maker due to the uncertainty. Hitherto, there is not yet
found a common denominator for those technological approaches since we still witness
discrepancies among scholars and investigators protecting own money driven researches and
oil giants’ interests.

9
As one of the outcomes of above stated phenomenon is that the concept of production process
is heavily influenced by the experiences obtained while the 1st generation of biofuels e.g. Fatty
acid methyl ester inter alia have been developed. Leaving the fact of sustainability and costs
involved in biomass cultivation of food competing crops, it is mainly borrowed that production
process should obligingly composed of dewatering and drying the biomass for extraction oil
before it is to be refined into fuels (Cherubini, et al., 2009; Brennan and Owende, 2010; Andræ,
2009; Fredin, 2009; Rapier, 2008). A diagram of possible technological processes is introduced
in the enclosure 1. Those thermo-chemical processes are obviously electricity and chemical
ingredients consuming. Whereas the 2nd generation developers, pursuing cost efficiency
studied the possibility of processing the biomass somehow avoiding those stages. However, oil
extraction has been still considered in combination with transesterification and pyrolysis of dry
biomass where a proper catalyst is still ought to be found (Tran, et al., 2010; Demirbas, 2009).
As one of the alternative approaches was a gasification of biomass and upgrading the outcome,
i.e. bio-syngas with Fischer-Tropsch (FT) synthesis into green fuels (Pandey, 2008; Rapier, 2008).
Worthy to say, FT process still has its drawbacks. Hydroprocessing is the process also borrowed
from the petroleum industry; however, it is still costly because extracted oil has to be used in
the process.
ABFs produced with BioDieselDner Ltd technology can be taken to the 3rd generation. The core
uniqueness implies an innovative method of treating the algal biomass into the substance
similar to terrestrial crude oil. The scholars in the University of Oklahoma (2009) approached
this method also. It consists of a refining process where biomass treated with catalyst is
converted into suspension for bio-catalytic cracking, and as a result we get bio-crude, which
easily distilled into the following fractions: kerosene, gasoline, diesel, masout (pers. com.
Chernov, et al., 2010). Referring to the illustrative enclosure 2 and comparing it with enclosure
1, one can see the differences of the chosen technology from others. Such innovative approach
allows for cost effective use of energy resource since the stages of dewatering are innovatively
approached, i.e. drying the biomass and extraction of oil are avoided (ibid).
As one of the reasons of choice why we consider BioDieselDnerp technology is its major cost-
effective dissimilarity (enclosures 2) with above-mentioned approaches (enclosure 1), which
are proved still not be economically feasible at least in the near future (Carlsson, et al., 2007).
The following features distinguish considered in paper technology from the world wide
introduced. This can evidently justify the claims of developers that their method of producing
fuels from algae is economically feasible at any return of scale.
Hence, we consider this bio-refining technology as the most promising, because it fulfils (pers.
com. Chernov, et al., 2010) the following conditions for being technically and economically
viable biofuels resource (Brennan and Owende, 2010):
it should be competitive or cost less than petroleum fuels and 1st, 2nd biofuels;
should require low to no additional land use;
should enable air quality improvement (e.g.CO2 mitigation);
should require minimal to no drinking water use.

10
According to technical features and capabilities, BioDieselDnerp solution (2010) meets these
conditions and makes a substantial input to meeting the primary energy demand
simultaneously providing environmental benefits (pers. com. Chernov, 2010).
3.1.1 Application areas
The area of application is numerous which gives a great opportunity to diversify business risks
and gain competitive advantage with the diverse HVPs like chemical and\or pharmaceutical
products. However, HVPs products are not considered in this research.
With respect to considered in the paper technology, the following are the projects that can be
realized as a standalone project or in combination with the other options:
Standalone project producing only biofuels. The technology implies cultivation of
micro-algae called Botryococcus braunii reach on hydrocarbons in combination with
Eichhornia (Water hyacinth) for deriving green fuels. For particular description of the
given technology, refer to the chapter 3.2.2.
Such option is itself flexible in production of synthetic fuels. Meaning that technology
allows for adjustment the proportion of fractions produced (kerosene, diesel, gasoline
etc.) matching the market conjuncture (pers. com. Chernov, 2010). If we qualitatively
consider algae diesel, it contains no sulphur and performs better than petroleum diesel
(Mata et al., 2009). Moreover, there is no need to modify the compression ignition
engines and blend green fuels with fossil ones in order to enable it for use in the
unmodified engines. Whereas, lighter distillates such as kerosene and gasoline exceed
in quality the ones of petroleum origin as well (ibid).
Biorefinery project in synergy with fish farms. Fish farm waters must be purified after
fish life excrement and leftovers, at the same time water used (medium) for cultivation
the micro-algae has to be also cleaned up before it can be utilised again in bioreactors
executing a sustainable closed loop use of water (ibid). The in situ bioremediation
(phytoremediation) is provided by the ability of Eichhornia (Joel de la Noie et al., 1992;
Reddy and Tucker, 1983) grown in the fishponds to clean up water after cultivation of
micro-algae and before it goes back to the bioreactors.
Biorefinery project in synergy with farm manure or grass digesters. The most
sustainable and economy efficient synergy project is relevant for the livestock farms
with manure biogas digesters. Evidently, methane deriving process results in up to 50%
of CO2 as outcome (DGS and Ecofys, 2005; Smyth et al., 2009). This surplus of CO2 can
be easily utilised for nutrition of microalgae. Moreover, CO2 obtained from the methane
combusted in the electro-generator or CHP installations is also successfully nourished to
the microalgae. Electricity derived from the mentioned generator is used for internal
electrification the biorefinery project whereas the surplus of heat from CHP is used for
heating bioreactors cultivating microalgae and ponds with Eichhornia. Moreover,
Eichhornia can remediate waters after biogas digesters and used as a co-substrate in

11
those biogas digesters (Reddy and Tucker, 1983). Finally, farmer gets governmental
incentives for CO2 reduction.
Biorefinery integrated in a carbon mitigation project. Besides biogas digester synergy,
some possible variants of synergy projects are illustrated in the enclosure 8. The
heaviest donors for CO2 can be cement producers, DH and CHP facilities.
Diversified biorefinery project with high-value added products. At the minor technical
upgrades, a holistic approach for the production of both green fuels and HVP co-
products can be integrated into biorefinery. This model is similar to petroleum
refineries where fuels are produced simultaneously with chemicals and other high-value
materials. Some algae species give more options to consider pharmaceutical, food and
feed additives production, etc..
Potential substituter for mineral oil in petroleum industry. As it is known, Swedish
state among others is pretending to be the first mineral oil-free society (Hilyard, 2007;
Persson, 2006; Sahlin, 2005), meaning that mineral oil refining industries has to
reconsider their feedstock or simply sell the equipment as a scrap metal. Therefore, the
most sustainable solution to this problem is the technology considered here.
BioDieselDnerp Ltd. invented the method of converting algal biomass into synthetic
biocrude. This process is done with BioDieselDnerp invented catalyst that plays the most
crucial role in the whole biorefining process. The algal biomass concerted with the
catalyst into biocrude is successfully used in the petroleum cracking and distillation
facilities. Therefore, biocrude is cracked and distilled into fractions as much the same
way as mineral oil is made to kerosene, gasoline, diesel and other heavier fractions.
Herewith, we see how that almost written off petroleum infrastructure can be freely
utilized substituting mineral crude with biocrude (pers. com. Chernov, et al., 2010).
3.2 BioDieselDnepr knowhow
Additionally to a disclosure of this technology related issues in chapters 2.3 and 3.1.1 and
slightly touched upon in 3.1, more description is given in the following chapters.
The paper focuses on the technology that enables cultivation of algae despite on divergence of
Swedish climate and daylight conditions. Local availability of nutrient sources has been also
taken into account. There is a technical match with environmental objectives of the country,
which explains the environmental sustainability. Marketability is fulfilled for the account of
ever needed product, as well as introduced concepts and solutions (ch. 2.3 and 3.1.1) for
various industries giving flexibility in risk diversification strategies and competitive advantages
(Charter and Polonsky, 1999). Energy efficiency is achieved useing cheap energy supplies that
are produced on-site.
3.2.1 General supremacy
Given project presumes cultivation of algal biomass and further treatment of it with the bio-
catalytic cracking method into synthesis biocrude. Such biocrude is distilled on kerosene (jet
fuel), gasoline, diesel and masout, whereas by-products are oxygen and fertilizers. The

12
distillation process can be placed on virtually any equipment that is used for refining mineral
crude oil. The project does not require fertile soils and has comparatively low variable costs for
the account of technology intensive and automatized processes.
Should be noted that synthesis fuels derived on the give technology from the renewable and
CO2 neutral source should be recognised as green fuels of the 3rd generation. The other fact
complying with the goals of environmental regulations is that those fuels are of superior
quality:
The fraction of gasoline with octane number 95 and density of 690 kg/m3 corresponds
to the standards method ASTM D 5798-99:EN 228 and EURO-4;
Comparing the synthetic diesel fraction with petroleum diesel of EN-590 standard, we
have the following table 2:
Table 2. Key qualitative comparison of synthetic and petroleum diesels (BioDieselDnepr, 1, 2, 2010)
synthetic diesel petroleum diesel
cetane number 75 55 polyaromatic hydrocarbon 0,1% 6 Sulphur 0 ppm 50 Density 767 kg/m3 835
Sulphur content is lower than 10 mg/kg (equivalent to 10 ppm) than such diesel corresponds to
environmental class Miljöklass 1-diesel (MK1) in Sweden (www, SPI, 2, 2010). Moreover,
emissions of carbon dioxide are much lower than after petroleum diesel. In addition, for the
account that a source for synthetic fuels is algae which uses CO2 as a nutrition source, we can
argue that such fuels are carbon neutral. Earlier was mentioned that 1 ton of algal biomass may
consume up to 2 tons of CO2. Low content of polyaromatic hydrocarbon means less
cancerogenic exhaust and flue gases we breathe. Plankton origin gives the ABFs a
biodegradable feature, which is important in case of spill out in the nature. Higher cetane
number gives us higher engine efficiency. Such fuels are used as usual petrol ones without
modernization of engine and fuel supply and injection systems. Petrol and synthetic fuel could
be mixed at any ratio. Besides that, higher quality means more kilometres run and less wore
engines.
3.2.2 Technological process and the methods incorporated
Here is described a core technology units that comprises a standalone project. The same
installation is currently run on the pilot project in Ukraine. Since it is a testing facility, the
constant upgrades are made for the purpose of testing until economies of scales will be
reached. Nowadays the capacity of producing the biomass up to 12 t per 24 h has been reached
successfully and it is not yet limited. Nevertheless, the objective to meet the highest economies
of scale is to be met shortly. Modular composition allows for easy scaling up of production
capacity giving flexibility for initial investment decision. Herewith, positive projections for 100 t
of biomass per 24 h are already given in terms of capital investments and payoffs. Modular
system gives also an option of gradual scaling down, if it will be necessary.

13
Enclosure 2 outlines the major stages incorporated in the production process as well as
enclosure 8 gives an illustration about the area of applications. For a visual guidance, it is
suggested to watch the promo video at www, Authors’ page, 1, 2010. However descriptively,
the production process involves below following.
Cultivation of Botryococcus braunii (enclosure 3) takes place in the closed land based
system called continuous stirred-tank reactor innovated into photobioreactor by
BioDieselDnepr (enclosure 9). Whereas enclosure 10 gives a visual insight of other
competing cultivating approaches. Definitely, closed system gives a chance for SMEs to
enter the market and hence a goal “produce locally – consume locally” has only positive
effect on employment rate and in a whole on national economy.
Photobioreactor plays a role of accommodator where algae is grown in the favourable
for growth conditions. Those conditions are 24 h light, nutrients supply (table 3) and
ambient temperature. Moreover, this system allows for extracting O2 out and provides
microbial isolation which is important in disease control.
Optimal spectrum realised with help of internal LED illumination gives the most efficient
lux conversation in photosynthesis process of algae, defining the rapid growth rate of
mass. Whereas, pulse mode and LED facilitate electricity savings hence defining cost
efficiency. System “shelf life” is 10 years without replacement of lighting units. Alabi, et
al., (2009) states, that internal illumination is more effective than sun lighting. There are
other advantages and disadvantage behind all systems, but it will take another
bioengineering paper to outline them.
Table 3. Medium ration (BioDieselDnepr, 1,2, 2010)
Inside the photo bioreactor, microalgae are
nourished with the medium that should be
prepared according to the following ration
in table 3. This is carried out under
operators’ strict control. It should be
mentioned that 70 – 80% of required
macro- and microelements is usually
present in the river, effluent or industrial waters. Therefore, the qualitative
characteristics of local water supply should be studied thoroughly in order to balance it
with minimum required according to the table 3.
Cultivation of Eichhornia (Water hyacinth). However, if the water needs to be purified
before Bb cultivation, i.e. there are some chemical elements or pathogens harmful for
Bb, it can be adjusted by having the waters in the ponds with Eichhornia. Eichornia has
huge capability to neutralise heavy chemical elements and some pathogens, it has the
fastest growth rate hence is considered as renewable energy source (Reddy and Tucker,
1983; Joel de la Noie et al., 1992; Lufti and Desougi, 1984). Here, it used for primary
bioremediation of dirty waters and in the other processes mentioned. Secondary
unit Per ton of biomass
H2O T 2,5 CO2 T 1,4 KNO3 Kg 0,56 Ca3(PO4)2 Kg 0,333 MgSO4 Kg 0,25 FeSO4 Kg 0,066 C6H8O7 Kg 0,5

14
bioremediation is carried out after waters have been utilised in the bioreactors
cultivating Bb. Herewith, technically clean water can be discharged to the nature
without being considered as harmful for the environment. This way we use river and
effluent water rather than drinking. However, if access to effluent waters is limited,
farm liquid residuals as manure or slurry are used as nutrient enrichment for drinking
water. However, farm residuals can be used in combination with river and effluent
water as well. It should be noticed that those farm residuals and municipal waters are
“free of charge” source of nutrients that are required for medium ration. This fact can
be used for cost minimisation strategy.
As it was mentioned, water is recycled between bioreactors and Eichhornia ponds.
Therefore, according to the plant capacity, total volume of water is renewed every 4-6
months with equivalent portion from above mentioned supply sources.
One may ask: “where do we get rid of Eichhornia mass?”. Well, according to Chernov
(2010), it is fully utilised in the production process for energy deriving which is to be
used for internal needs. In particular, biomass of Eichhornia takes a part in biocrude
preparation as well as in gasification of the other processes, i.e. in cogeneration of
electricity and heat, and in bio catalytic cracking block (enclosure 8). Water hyacinth
biomass being grown on-site as a “part and parcel” of the technology is digested into
biogas for cogeneration and CO2 for nutrition the algae. Biogas cogenerated to heat,
electricity and CO2 also for nutrition. Herewith, according to Chernov et al., (2010),
economical efficiency is argued by the fact of energy self-supply process (table 4). Table 4. Energy supply (BioDieselDnerp, 1, 2, 2010)
Supplies source %
Steam self-supplied 100 Compressed air self-supplied 100 Heat self-supplied 100 Electricity self-supplied 100
Biomass harvesting. When concentration of algae biomass has reached its maximum, it
is being subjected to a certain shock starts multiply in accelerated manner thus
accumulating the maximum of hydrocarbons. It is time of harvesting, which is done by
means of partial water separation in the hydrocyclone. The requited amount of
eichhornia is harvested too for further step.
Biocrude preparation. Hereafter algae-eichhornia sludge mixed with the catalyst and
unloaded to the cavitator for homogenization obtaining oily- hydrocarbon mass. The
derived mass is a biocrude oil having similar structure with petroleum crude oil.
The cavitator is engineered by BioDieselDnepr Ltd. based on the latest high technology
solutions. Whereas, given catalyst is a key knowhow in the entire technology, and it is
developed by the same company.
Biocatalytic cracking and refining – suspension (biocrude) received to the cracking unit
converts into syntheses crude, which is distilled in the rectification column on synthetic

15
gasoline, kerosene, diesel and masout. These fractions may be called as green fuels
since they are derived from plants and hence are carbon dioxide neutral.
It should be also added that part of biogas from Eichhornia is supplied to the
biocatalytic cracking unit. Whereas CO2 is also use for nutrition of algae and sub
products of this process are recycled until full utilisation, hence making technology
sustainable.
From the above description, it seen how the algae is supplied with CO2 as the main nutrient.
Herewith, due to algae’s ability to consume up to 2 tons of CO2 per ton of biomass, it explains
where carbon originates from, being a base for lipid-hydrocarbonaceous substances (Banerjee,
et al., 2002; Metzger and Largeau, 2005). Whereas, it is known that fossil fuels are composed of
hydrocarbons, hence one can see similarity with green fuels.
Rounding this subchapter off, should be noticed that hydrocarbons are the chemical carrier of
energy that releases to heat energy in the engine of internal combustion. The engine turns heat
energy into kinetic energy – energy of motion which the human kinds enjoy driving a car.
3.2.3 Uncertainties of technological process
Operational factors besides others play significant role for decision maker when a few
investment options are the subject for concern. The below outlined are the most discussed
technical uncertainties, factors that are important to take into account for disclosing
economical feasibility.
Cultivation process uncertainty. Qualitative and quantitative deviation in the features of
biomass might take place due to outage and\or negligence of the staff. However, if a
firm control is carried out according to the technology requirements prescribed by the
provider, deviation might take place in the range of foreseen values. Those controllable
factors are chemical, microbial water content and ambient temperature (pers. com.
Chernov, 2010).
Biocatalytic cracking and refining. The major cause for deviation in output is the
qualitative and quantitative characteristics of biomass used for preparation of biocrude.
However, for credibility purposes, the deviations of output are also considered in
calculations. Herewith, percentile projection of such is introduced in the next chapter
(ibid).
3.2.4 Product slate
Aforementioned technological process gives flexibility in output for the account of catalyst and
Eichhornia biomass. These two determinants play crucial role in forming the quality of
biocrude. Herewith, producer can adjust the output proportion concentrating on the certain
fuel, meaning that certain market demand can be met without additional capital investments.
However, since the process involves an organic growing matter, the insignificant fluctuations in
output exist but should be considered as uncertainty. The following figure 1 introduces the
production outputs with their capacity ranges. It should be mentioned, that gas phase and

16
masout are recycled in the production process, therefore, these are not counted as outcome
nor cost. Whereas, coke and wastage can potentially be used as fertilisers.
Figure 1. Product slate (adapted from BioDieselDnerp Ltd, 1, 2, 2010)
According to the data from pilot project, a plant with production capacity of 10-12 t of biomass
per 24 h gives in average 7,7 t of liquid phase. It results in the following fuels (table 5):
Table 5. Quantitative fractions of fuels (BioDieselDnerp Ltd, 1, 2, 2010)
Fuel Tons per day Density, kg/l Amount, I/day
Diesel 5,39 0,85 6341,2 Gasoline 0,87 0,74 1175,6 Kerosene 0,89 0,77 1155,8 Masout 0,33 0,91 362,6
Fuel fractions are given in tons. Appropriate densities rates to transform tons to a litre
equivalent have been used. This is done for the purpose of further convenience in calculations,
since historical prices on fuels are given per 1 litre.
100% synthesis biocrude(with app. density 0,96 g/cm3 at t=+20 C0)
Liquid phase, %70 - 85
Gasoline
fraction, %7 - 10
Kerosene (industr.),
%10 - 15
Diesel fraction, %
65 - 80
Masout3 %
Wastage
2 %
Gas phase, %
12 - 17
Coke, %3 - 5

17
4 Theoretical framework The choice of subjects to be reviewed mainly applies two issues, in particular economical
evaluation of technology by means of real option analysis (ROA) and traditional methods used
in investment appraisal. Hence, theoretical backgrounds for economic study are briefly
introduced in the following chapters.
4.1 Traditional methods used in investment appraisal
Capital budgeting (or investment appraisal) is “the planning process used to determine
whether a firm's long term investments such as new machinery, replacement machinery, new
plants, new products, and research development projects are worth pursuing. It is budget for
major capital, or investment, expenditures”. (Sullivan and Sheffrin, 2003, p.375). The main
criteria used by managers for evaluation of project’s profit are NPV, IRR and Payback period.
4.1.1 NPV
Net Present Value (NPV) is a central tool in discounted cash flow (DCF) analysis, and is a
standard method for using the time value of money to appraise long-term projects. According
to Pretorius et al. (2008) evaluation of projects should be done on different basis depending on
whether it is a project company or a general company. A project company “is generally a one-
asset company, highly specific and capital intensive ... with high debt in its capital
structure”(ibid, p.95). Differently saying it is a company which exist in the form of a business
plan. A term “general company” is applied to existent business with existent cash flows.
Therefore, Pretorius et al. (2008) suggests that for a project company (as a basis for NPV
calculation) should be taken not after tax cash flows but a business cash flows which is defined
as earnings before interest, tax, depreciation and amortization (EBITDA).
The net present value (NPV) is the aggregated value today of a series of cash flows occurring in
the future. It is calculated in today’s monetary value in order to make future incomes
comparable with incomes from other potential projects. The annual net cash flows over the
investment’s life need to be estimated. It needs however to be considered that one unit today
accounts for 1 plus the interest rate next year (1+i). In the discounting process future incomes
therefore needs to be taken back to the starting point by dividing the next year amounts with
(1+r). The main investment rule is to invest when NPV is zero. The NPV formula is:
,
where At – net cash flows, I – initial investment.
This signifies that the higher the interest/discount rate used the lower is the value of future
payments. NPV calculation is very sensitive to a discount rate: a small change in discount rate
causes a large change in NPV (Campbell and Brown, 2003).
4.1.1.1 Disadvantages of NPV
Notwithstanding underlying advantages, NPV approach has clear limitations. The method
assumes that management is able to predict accurate cash flows of the future project. In
reality, the more distant future the more it is difficult to make correct predictions. As a result,

18
overestimation or underestimation leads to acceptance of the project that has to be rejected
and rejecting of the project that has to be accepted. Additionally, NPV approach assumes that
discounting rate will not change over time. In reality, discounting rate changes from one year to
another just as interest rate does (Groppelli and Nikbakht, 2006).
It is commonly agreed (Schwartz and Trigeorgis, 2004; Dixit and Pindyck, 1994; Copeland and
Antikarov, 2001) that NPV approach presumes that investors will follow a passive commitment
once project is undertaken. However, they are not passive but have the flexibility to sell the
asset, invest further, wait and see or abandon the project entirely. The orthodox theory of
investment has not recognized the importance of interaction between irreversibility of
investment, uncertainty over future reward and the choice of investment timing. As researches
have proved, real world investment seems to be much less sensitive to interest rate changes
than it does to volatility and uncertainty over economic environment. The theory of real
options argues that the common investment rule “invest when NPV is zero” is not enough (Dixit
and Pindyck, 1994).
4.1.2 IRR
“A discount rate at which NPV becomes zero is called Internal rate of return (IRR)” (Campbell
and Brown, 2003, p.44). One should think of IRR as a rate of growth that a project is expected
to generate. If the internal rate is higher than the cost of capital (r) then the investment should
be undertaken (ibid).
4.1.3 Payback period
Payback period is the number of years needed to recover initial investments and in a way
represent the riskiness of losing invested money. However, this method doesn’t account for a
time value of money. Nonetheless, a discounted payback period can be used instead, which
presents a more reliable figure. (Groppelli and Nikbakht, 2006).
4.1.4 Sensitivity analysis
In business evaluation, it is important to recognize key value drivers that determine the
performance of the business. In such a case, it is very useful to perform sensitivity analysis, i.e.
“testing the impact on the outcome from changes in one or more key assumptions” (Helfert,
2001, p.191). Sensitivity analysis is a method to predict the outcome of a decision if a situation
turns out to be different compared to the key prediction(s).
4.2 Forecasting methods used for time series data.
Financial planning process in capital budgeting involves making predictions of future cash
inflows and outflows. To make good prediction of cash inflows requires both great experience
and good knowledge of market and/or use of forecasting tools.
The most general class of models for forecasting in time series is ARIMA (autoregressive
integrated moving average) - an advanced econometric modelling technique. ARIMA looks at
historical data and performs back-fitting optimization routines to account for historical
autocorrelation, the stability of the data to correct for the non-stationary characteristics of the

19
data, and this predictive model learns over time by correcting its forecasting errors. A minimum
of 50 observations is required for proper use of this method.
Another method of forecasting is Time Series Analysis, which is used to forecast time series
variables by decomposing the historical data into baseline, trend and seasonality elements into
the future forecasts. This analysis assumes that the trend and seasonality will exist. For
example, when the data variable has trend but no seasonality, then double moving average or
double exponential smoothing would be an appropriate forecast model.
Moving averages rank is among the most popular techniques for the pre-processing of time
series. They are used to filter random "white noise" from the data, to make the time series
smoother or even to emphasize certain informational components contained in the time series.
Exponential smoothing is a very popular scheme to produce a smoothed time series. Whereas
in moving averages the past observations are weighted equally, exponential smoothing assigns
exponentially decreasing weights as the observation get older. In other words, recent
observations are given relatively more weight in forecasting than the older observations.
Double exponential smoothing is very good in capturing the trend (Mun, 2006).
4.3 Real Option Analysis (ROA)
Real option analysis revolutionized the way practitioners and academics think about
investment projects by explicitly incorporating management flexibility into the analysis. Real
option approach was adapted from the financial options, which are tradable on the stock
markets. Thus, in 1977 Stewart C. Myers has argued that the concept of pricing financial
options can also be used in real investments (Gustavsson and Töre 2006). Supporting Myers,
Trigeorgis (1996) states: “an option approach to capital budgeting has the potential to
conceptualize and quantify the value of options from active management and strategic
interactions” (p. 4).
Comparing to traditional NPV approach, which employs “risk-adjusted” discount rate, real
options analysis is made on the basis of risk-neutral environment applying risk-free interest
rate. The critical advantage of working in risk-neutral environment is its appropriate and
convenient setting for option pricing. This allows the multiple operating options available in a
typical investment project to be naturally incorporated in the analysis. These options include
the optimal investment timing, the option to abandon the project, to temporarily stop and
later restart the operation, growing options etc. The other advantage of the risk-neutral
framework is that it allows using analytical tools developed in contingent claims analysis to
determine both the value of the investment project and its optimal operating policy (Schwartz
and Trigeorgis, 2004).
Leslie and Michaels (1997) (cited in Gustavsson and Töre, 2006) compared a traditional NPV
methodology with real options and identified corresponding value levers and how each lever
affects the valuation (figure 2). They argue that NPV can mislead whenever there is flexibility,
especially flexibility to respond to uncertainty over the rate of cash flow growth because it

20
captures only two levers on value creation. Real options "thinking" may lead to increased
opportunities to take advantage of upside market potential and mitigate downside risks.
Figure 2. Comparison of valuation methods (Leslie and Michaels, 1997, cited in Gustavsson and Töre, 2006)
However, it is important to note that the two methods, NPV and ROA, do not necessarily
oppose but rather complement each other. Dixit and Pindyck (1994) states that “the simple
NPV rule must be modified to include the opportunity cost ... that opportunity cost is exactly
the value of the option” (p.153). This view is also supported by Copeland and Antikarov (2001),
who says that real options approach doesn’t necessarily have to be considered the be-all and
end-all in terms of valuation techniques; rather, it should be considered a part of an expanded
NPV analysis. The expanded “strategic” NPV is equal to the static “passive” NPV plus the value
of real options: .
Real options theory emphasizes the importance of waiting or staging flexibility, suggesting that
managers should either "wait and see" until substantial uncertainty is resolved and the project
is more clearly successful, requiring a premium over the zero-NPV or they should stage the
decision so that they can revise the situation at critical milestones (Trigeorgis, 2005; Dixit and
Pindyck, 2004). The higher value of the option to "wait and see" requires a higher critical
investment threshold. The critical project value at which it is optimal to invest must be at a
significant premium above the required investment cost, before it is justifiable to invest and
give up the option to wait. The meaning of this is that higher uncertainty would most probably
lead to investing less or later (Trigeorgis, 2005). Should be noted that the option to "wait and
see" increases when uncertainty increases, as does the critical value of optimal investment.
However, critical value of optimal investment increases more sharply than it does the option
value (Dixit and Pindyck, 2004). Nevertheless, in the presence of competition the option value
to wait must be traded off against the strategic dedication value of early investing. (Trigeorgis,
2005).
4.3.1 Stochastic capital budgeting
Standard capital budgeting model doesn’t account for the risks involved in the model.
Recently, several authors have used stochastic capital budgeting model to account for risk

21
when investing in a methane digester for instance (Strokes, et al., 2008; Lauer, et al., 2007).
Furthermore, Artikis (1999) has outlined the reasons for using simulation rather than other
methods in developing capital budgeting model showing that such approach gives better
indication of risk involved in the project. Among existent computer simulations, Monte Carlo
simulation is the most useful for modelling with significant uncertainty in inputs. Stochastic
approach is also helpful in estimation of volatility in net cash flows, which can be used in real
options analysis (Strokes, et al., 2008).
4.3.2 Monte Carlo Simulation Method
Monte Carlo methods are often used in finance and mathematical finance to value complex
instruments, portfolios and investments. The definition of simulation described as “any
analytical method that is meant to imitate a real life system, especially when other analyses are
too mathematically complex or too difficult to reproduce” (Mun, 2006, p. 112). Monte Carlo
simulation randomly generates values for uncertain variables over and over to simulate a real
life situation. It calculates numerous scenarios of a model by repeatedly picking values from the
probability distribution for uncertain variables and uses those variables for the event.
Simulations are used for many different purposes: to define such events as totals, net profits,
gross expenses or it can also be used as a forecasting tool. Specifically, with Monte Carlo
simulation can be forecasted future cash flows, costs, revenues, prices which are stochastically
evolved (ibid).The method of Monte Carlo simulation is widely used in such software as @Risk,
RiskOptimizer, Risk Simulator, etc.
Mun (2006) describes how Monte Carlo simulation can be used to estimate the volatility in the
project. First, a model of the project and a decomposition of the future expected cash flows
into price, quantity, etc should be constructed. By assigning mean values, probability
distribution and standard deviations to the variables and running the simulation with the
appropriate software, one can acquire a simulated distribution of the percent changes in the
value of the project. The computer program can then easily calculate the simulated volatility.
The process as such is quite easy; however setting the parameters for the variable in the model
is the hardest part. To estimate parameters for variables, literature suggests using either
historical data or subjective estimate form the management (ibid).
4.3.3 Critiques on ROA
Real options theory as well as other theories has its critiques. The main and most common
critique is that ROA approach is too complex to be worthwhile (Bowman and Moskowitz, 2001;
cited in Gustavsson and Töre, 2006). The main problem comes with evaluation of estimates: if
inputs are improperly evaluated then ROA is worthless. Miller and Park (2002) also support
critique side saying that real option only works for tradable assets, i.e. when the asset price can
be observed in the financial market. They stress on the point that key parameter in ROA is
volatility and to estimate volatility one needs appropriate data such as historical data or
actuarial information.

22
4.4 Previous research and studies
Looking at the renewable energy technology, real option theory has been widely used in energy
and agricultural sectors. As can be expected, real option theory has been applied in a wide
range of methods in order to evaluate and analyse investment decisions. In the table 6
presented examples of resent studies of ROA application used to evaluate agricultural
investments.
Table 6. ROA application in valuing agricultural investments
Study Issue
Schmit et al., (2009) Optimal investment and operating decisions (entry-exit, mothballing) of dry-grinding corn ethanol facilities
Stokes et al., (2008) Analysis of economic and financial feasibility of installing a methane digester
Isik et al., (2003) Investment in an emerging market of remote sensing technology: model of entry-exit decision and capacity choice
Hyde, Stokes and Engel (2003)
Optimal replacement decision of an operational milking system with an automatic milking system
Tauer (2006) Entry and exit decision from dairy farming Purvis et al.,(1995) Optimal investment in free-stall dairy housing
4.5 Modelling of the problem
An investment in ABF technology involves significant uncertainties about benefits and costs
associated with the project. To account for risk involved in the project we will simulate
uncertainty in the capital budgeting model and generate distributions of possible NPVs. Thus, a
probabilistic assessment of NPV can be made to help determine the feasibility of a project. We
also will use stochastic budgeting for volatility estimation of net cash flows (NCFs) as Stockes et
al., (2008) did in their study of investment in a methane digester. This volatility is a critical input
for determining the option value. Moreover, simulated NCFs can be used to estimate the
investment value and the payout rate.
4.5.1 Parameter estimation
Volatility. Since we do not have historical data regarding similar project from related
industry, neither data from the financial market we will apply the approach used by
Stockes et al., (2008) and Vintila (2007): rolling a great number of Monte Carlo
simulations (minimum 3000 iterations), the standard deviation of discounted NCFs is
obtained and then relative standard deviation (RSD) is used as a proxy of underlying
asset. (Dodge, 2003).
Payout rate is a percentage of discounted NCFs in relation to investment cost.
Risk free rate is represented by the expected rate of return for a riskless security (treasury
bill or government bond) with the same maturity as project life (Vintila, 2007).
4.5.2 ROA modelling
Let V(t) denote a time t- value of a ABF technology with V(0) which represents its present value
at the beginning of time horizon. V(t) is a discounted sum of all NCFs associated with the
investment. According to Postali and Picchetti (2006, cited in Schmit et al., 2009, p.15),

23
Geometric Brownian Motion (GBM) is a good approximation for crude oil prices. As fuel prices
are stochastic, the value of the project, V, is believed to be also stochastic. Therefore it is
assumed that V follows GMB with drift μ and variance σ so that
. Observe that is the immediate expected capital gain
on V.
The investment in ABF technology pays intermediate cash flows in almost the same way as
stock pays dividends. Therefore, a capital gain can be written as the difference between the
total expected return, α, and payout rate or so called “dividend”, δ. Hence, the diffusion
equation for the value of the ABF technology investment can be written as
where is the increment of Wiener process with zero mean and unit standard
deviation having an instantaneous variance equal to dt, representing natural measure of risk.
Let I denote the initial cost of investment in ABF technology. We assume that the investment
opportunity can be delayed. Thus, the delay can be thought of as an option to supervene –I
SEK at time t in exchange for V(t). In the region V(t) > I, the NPV is positive. However, under the
presence of the option to delay this condition is insufficient for investment decision.
Let be the investment strategic value consisting of the sum of NPV and the option to
delay investment. Since investment opportunity, F(V), yields no cash flows until the time, T the
investment is undertaken, the only return from it is its capital appreciation. By imposing a non
arbitrage condition, Bellman equation is then applied:
The above equation says that over time interval dt, the total expected return on the investment
opportunity, is equal to its expected rate of capital appreciation. The dynamics of F is
found using Ito’s Lemma (Dixit and Pindyck, 1994) gives:
Substituting equation (1) for dV into (3) gives the dynamic of F
Hence, Bellman equation becomes:
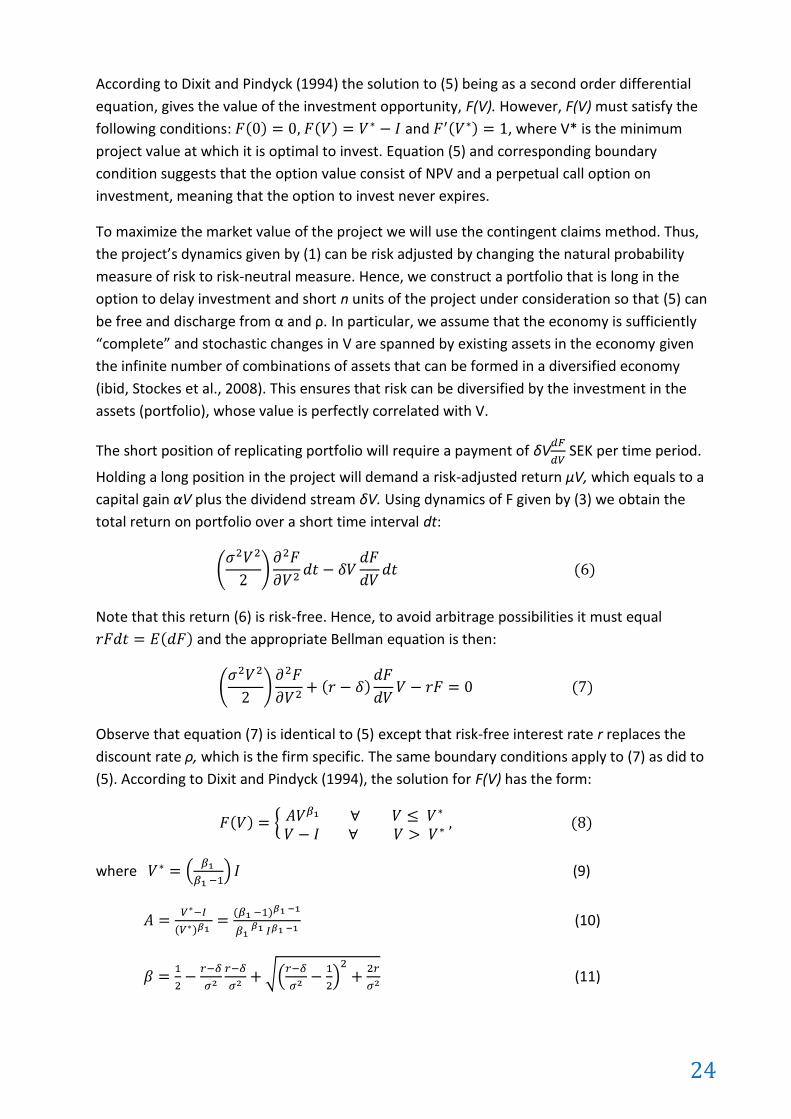
24
According to Dixit and Pindyck (1994) the solution to (5) being as a second order differential
equation, gives the value of the investment opportunity, F(V). However, F(V) must satisfy the
following conditions: and , where V* is the minimum
project value at which it is optimal to invest. Equation (5) and corresponding boundary
condition suggests that the option value consist of NPV and a perpetual call option on
investment, meaning that the option to invest never expires.
To maximize the market value of the project we will use the contingent claims method. Thus,
the project’s dynamics given by (1) can be risk adjusted by changing the natural probability
measure of risk to risk-neutral measure. Hence, we construct a portfolio that is long in the
option to delay investment and short n units of the project under consideration so that (5) can
be free and discharge from α and ρ. In particular, we assume that the economy is sufficiently
“complete” and stochastic changes in V are spanned by existing assets in the economy given
the infinite number of combinations of assets that can be formed in a diversified economy
(ibid, Stockes et al., 2008). This ensures that risk can be diversified by the investment in the
assets (portfolio), whose value is perfectly correlated with V.
The short position of replicating portfolio will require a payment of δV SEK per time period.
Holding a long position in the project will demand a risk-adjusted return μV, which equals to a
capital gain αV plus the dividend stream δV. Using dynamics of F given by (3) we obtain the
total return on portfolio over a short time interval dt:
Note that this return (6) is risk-free. Hence, to avoid arbitrage possibilities it must equal
and the appropriate Bellman equation is then:
Observe that equation (7) is identical to (5) except that risk-free interest rate r replaces the
discount rate ρ, which is the firm specific. The same boundary conditions apply to (7) as did to
(5). According to Dixit and Pindyck (1994), the solution for F(V) has the form:
where (9)
(10)
(11)

25
Equations (8-11) give the value of investment opportunity and trigger value at which it is
optimal to make an investment. If the value of the investment is less than trigger value, the
opportunity to invest is consists of NPV and call option value. If the value of the
investment is more than trigger value, the value of the investment is simply the NPV, i.e. .
Hereof, as the value of the investment increases the value of the option to delay investment
decreases.

26
5 Background for empirical study This chapter provides an insight to the Swedish biofuel market and related policies with the aim
to present a holistic picture about macroeconomic issues. However, the focus is put on a
biofuel market.
5.1 Biofuels in Sweden – Energy Policy Overview
Sweden is the one to have most ambitious policy for renewable energy. Presently it obtained to
have about 28% of energy supplied from renewable sources with the aim to increase it to 50%
by 2020 and have a vehicle fleet that is independent of fossil fuels by 2030 (USDA Foreign
Agricultural Service, 2006 – 2009). However, 3 years earlier Swedish oil independency was set
to be reached by 2020 (Persson, 2006). The biofuel industry in Sweden is set to expand mainly
due to the new legislation on energy and climate strategy passed by the Swedish parliament.
The general economic policy instruments that put a price on greenhouse gas emissions
together with beneficial conditions for cars running on alternative fuels will encourage a
different choice of fuel. By the middle of 2010 Swedish government aims to implement new EU
biofuel directive that enables a blending of 10% ethanol and 7% biodiesel. Development of
plug-in hybrid vehicles and electric cars is supported alongside.
The promotion of the use of ethanol and biodiesel is implemented mainly through tax reliefs -
there are no taxes on ethanol and biodiesel. In addition to tax reliefs, Sweden provides
different policy instruments to stimulate use of biofuels. Mentioning a few, those instruments
are: “gasoline and diesel cars emitting less than an average of 120 grams of carbon dioxide per
kilometre are exempt from vehicle tax”, “energy tax on conventional diesel will be raised by a
total of SEK 0.40 per litre by 2013” comparing to the total tax for diesel of SEK 5.42 in 2009, etc
(Dahlbacka, 2009, p. 4-5).
Swedish bio-diesel rapeseed methyl ester (RME) is produced from rapeseed. About 50% of the
rapeseed produced in Sweden is used for biodiesel. In addition to domestic raw material,
imported rapeseed oil, mainly from the Netherlands and Lithuania was used in 2008. Yet,
Sweden largely promotes ethanol (E85) as alternative biofuel believing that cheaper biofuel
benefits both the climate and consumers (ibid). On the other hand, several EU countries want
to treat ethanol as an agricultural commodity levying high tariffs.
From the table 7 it is seen that consumption of biodiesel in 2010 is 140 metric tons (Mt) of
which 60 Mt (43%) is imported, which indicates a great potential for biodiesel market as well as
high demand.
Table 7. Biodiesel Production / Consumption / Trade (thousand tons), (Dahlbacka, 2009)
Biodiesel 2006 2007 2008 2009 2010
Production 20 70 80 100 100 Imports 40 50 40 40 60
Total Supply 60 120 120 140 160 Exports 0 0 10 20 20
Consumption 60 120 110 120 140

27
5.2 Governmental support
Businesses are heavily supported for innovations in the environmental sector. This support is
carried out in the forms of cheap investment capitals, funds, subsidies, CO2 allowances, tax
reliefs, political will, informative and consultancy supports, etc. Numerous agencies on a
national as well as on a local levels, run periodically programs stimulating business to reduce
pollutions and improve services, etc. (www, Swedish Energy Agency , 1, 2, 2010; www,
Tillväxtverket, 1,2, 2010; www, CMF, 1, 2010; www, Naturvårdsverkets, 1, 2010; www,
Industrifonden, 1, 2010; pers. com. Innovationsbrons, 2010).
5.2.1 Tax reliefs on biofuels
According to the current situation, biofuels are exempt from so called “punktskatter”. The
punktskatter – an excise duties introduced by “energiskatt” – energy tax and “koldioxidskatt” -
carbon dioxide tax. These taxes are an obligation of producer to put them on the top of its
producer price. This means that the end consumer pays those taxes whereas the producer
collects them and transfers to the inland budget (Monti, 2003; Neelie, 2005; USDA Foreign
Agricultural Service, 2006 - 2009; www, SPI, 2, 2010; pers.com. SPI, 2010). In particular, biofuels
from pilot projects are exempt from both duties.
However, the more “free of tax” biofuels introduced on the market the less government gets
income. Being aware of this fact, government is currently working on decision to balance those
tax reliefs. A revision of the energy tax directive is currently discussed within EU and a proposal
for a revised directive might be published this year, 2010. It is discussed that the directive
would include both a split of excise duties into energy tax and carbon dioxide tax for biofuels as
well as separate minimum tax rates for biofuels (pers. com. SPI, 2010).

28
6 Empirical findings Pursuing to fulfil the aim of paper, the research of data has been done in Sweden. The
following chapters reveal those findings as well as estimates of the calculations.
It should be mentioned that underlying principle for projecting the budget is: “Pay maximum -
get minimum”. However, when the plan comes to practical establishing, the opposite principle
has to be applied: “Pay minimum – get maximum”. Herewith, the first principle should be taken
into account by the retriever while replicating this paper for his \ her own purposes.
6.1 Conditions for capital budgeting model
As it was mentioned, we consider a synthetic project established on Swedish market. Projecting
the entity, one must hold conditions clear. Therefore, making the accounts transparent, we put
the project in the following conditions:
Project life period is taken as 10 years because it represents the economic and physical
life of the equipment.
It has no reinvestment and\or recapitalisation strategies during its life period, herewith
no expansions are considered. This way we believe to avoid distortion of true value of
the project which is moreover important when one judges it against the value of the
project that induces immediate investment according to the real option analysis;
Even though it produces mainly four products, the only three of them are considered
because they create app. 95% of turnover due to their higher prices and higher volumes
produced;
Technically, the production cost part represents one asset i.e. biocrude from which
those multiple products are finally refined. Therefore, the project is evaluated as one
asset project;
Accrual accounting principle is applied, meaning that income and expenses are
allocated to periods to which they apply, regardless of when they actually received or
paid;
Value added tax is not considered in either expense nor income part of budgeting;
No governmental and other institutions grants or alike financial support are considered
as a means of direct infusion of money;
The underlying principle for projecting the budget is: “Pay maximum - get minimum”;
6.2 Initial investment outlay
According to the set above delimitations, the budget is developed for a stand along project
producing only green fuels. The capacity of ABF production plant is to be 10- 12 tons of biomass
produced per day. The same size of ABF production pilot project is currently running in Ukraine.
Therefore, the technology related information about production capacity of input and output
will be used from the pilot project for our estimation. However, the prices are adopted from
the Swedish market setting, though.
The total land area needed to allocate the project is 3000m2 (0,3 ha) of which 2000m2 needed
for building to place biomass cultivating facilities , laboratory and office. Note, production of

29
green fuels from algae does not require a specific type of land nor climate; therefore it can be
installed in any region of Sweden. Herewith, initial investment outlay is outlined in the
enclosure 11 in details. The costs for tangible assets consist of the following:
The price for equipment includes producer’s price (BioDieselDnepr, 1, 2010 ),
transportation cost from Ukraine to Sweden (pers. com. Alpha Projects & Logistics ApS,
2010) and custom clearance (www,Tullverket, 2010). Producer’s price includes
installing of equipment, start up operation and staff education. Besides that, a onetime
royalty fee is included in the total price of equipment, giving a right to use the
technology method (pers. com. Chernov, 2010).
Real estate with needed plot of land was estimated based on the market price of
existent industrial facility that is most suitable for the type of production and does not
require much rebuilding (pers. com. Svensk Fastighetsförmedling, 2010). However,
some uncertainty was given to rebuilding expense in the stochastic budgeting.
The capacitive tank park is calculated to fulfil the required storage capacity of fuels for
10 days. Prices were taken from the fuel tank producer and include transportation costs
from Denmark to Sweden with custom clearance (www, CGH Nordic, 2010).
Investment in security system (Intrusion alarm, CCTV Surveillance system, Fire Alarm
System) is based on consultation with G4S (pers.com. G4S, 2010).
Price of laboratory equipment is adapted from numbers applied on pilot project in
Ukraine since the equipment is imported (BioDieselDnepr, 1, 2010).
IT and office facilities are estimated based on required felicities for the staff employed.
Establishing and start up operational costs, presented in enclosure 11, among others include
costs of CO2 and electricity as they are needed only for start up operation. The price of CO2 is
provided by AGA (pers.com., AGA, 2010). Electricity price was chosen with energy taxes but
without VAT (www, EON, 1, 2010).
Marketing, legal expertises, IT and expenses for extra technical expert are based on qualified
guesswork. However, extraordinary costs have been also included in order to cover unexpected
activities, despite on governmental informative support.
As the project and technology is very new for Sweden, one might also consider costs associated
with the start up of operation. Given the fact that the key production processes is automated
and controllable the authors do not expect the variations in outcome greater than predicted.
Moreover, together with the purchase of technology a seller provides the staff for 3 months
with the purpose to educate local workers while setting up the operation.
Much attention has been put on administrative regulatory costs (enclosure 13). The major
complication that we met estimating them was the fact that there is no similar technology
established in Sweden. Meaning, there is no existent completely similar business entity to copy
historical data from.
The feature of 100% environmentally friendly technology was brought up while making
inquiries to the relevant authorities (www, Verksamt, 1, 2010) and biofuel producers (www,

30
Retriever Sverige, 1, 2010). Inquiries were underling that synthetic fuels are produced from CO2
neutral organic matter of own produce. These fuels surpass the quality of fuels of petroleum
origin exciding the normative of Miljöklass 1 standard. Technology does not produce toxic
wastes and by-products; water is bio-remediated and recycled, colossal amount of carbon
dioxide is neutralised. From the other side, these technicalities have to be also considered:
Project produces flammable and explosive good;
Some chemicals are used in the production process;
Production process involves tree types of activities i.e. cultivation of organic matter,
chemical mechanical conversion of organic matter to biocrude with consequent
thermal refining to fuels, and cogeneration of biogas to electricity and heat for internal
use;
Product derived with the method incorporated in technology should be inspected
thoroughly for final approval and hence classify them as green biofuels;
Technology and its methods is also a subject for thorough studying and certification;
Environmental issues as to how the water used is purified and how much of CO2 is
neutralised should be approved.
Herewith, this presumes the following procedures which in monetary value have the most
burden at establishing as well as in the consequent operational years (www, Verksamt, 1,
2010):
getting approved and consequently inspected as chemical operator;
registering the product in the chemical register;
getting approved and consequently inspected for flammable and explosive goods
operation "general permit";
getting approved and consequently inspected on the issue of environmentally
hazardous activities "environmental permit"
However, this list does not end on it. The report about total municipal cost mentioned in the
enclosure 13 outlines them thoroughly (Näringslivets Regelnämnd, 2008). Complication of issue
justifies the reason of why Tillvaxtverket (Swedish Agency for Economic and Regional Growth),
Kemikalieinspektionen (Swedish chemical agency), Naturvårdsverkets (The Swedish
Environmental Protection Agency), Swedish Petroleum Institute gave a partial respond on the
question, while the rest 26 respondents found it impossible to quote on those expenditures.
The overall meaning was that in order to adequately estimate those costs, the relevant
technology projecting documentation should be provided and project installed under
inspection. Therefore, it depends from case to case. However, they gave a good navigation in
the field. If we pay attention on the table in the enclosure 13 we can see that average firm
bears 4,4 M SEK per year of administrative costs or 266833 SEK in average per employee a year.
The rates for approval and inspection mainly depend on the number of employees, volume
produced, total revenue, and profit after tax.

31
Näringslivets Regelnämnd provides great help in this regards. The enclosure 11 contains the
estimate of annual total administrative regulatory costs for establishing year, whereas
projection of the item for consequent years is shown in the enclosure 14 part 2 (P&L account,
see under fixed cost). However, according to the mission of this organisation and its report
“Regelindikator 2009” these costs have a tendency to decrease with 2,5 % yearly (Näringslivets
Regelnämnd, 2010).
In addition to the decreasing tendency, we could include the assumption that the project is
financially supported with the government fund, since it complies with environmental goals.
However, for sake of transparency we do not consider governmental grants or financial support
like subsidies, and allowances in this paper.
6.3 Sources of inflows and outflows
The primary sources of cash inflow are the sold products (chapter 3.2.4): diesel, gasoline and
kerosene. Coke and wastage can potentially be used as fertilisers, however; we disregard them
as it can be used as a source of nutrients for medium ration.
As it was mentioned in chapter 3.2.1, ABFs are by the quality the same and even better as of
fossil fuel origin. Moreover, according to Swedish legislation, green fuels produced on the pilot
projects are exempt from energy and carbon taxes (Monti, 2003; Neelie, 2005; USDA Foreign
Agricultural Service, 2006 - 2009; pers.com SPI, 2010). Therefore, since our synthetic project
belongs to the category of pilot, as there is no similar once on the market, its products are
currently not taxed. However, it is most likely for the close future that energy tax will be
introduced for biofuels on the same level with fossil fuels, but will be still exempted from
carbon dioxide tax. This is considered as uncertainty in price for the output (chapter 6.5.1).
However, this vagueness is moreover enriched with the increasing tendency on fossil prices,
caused by ever growing demand and declining prognoses of oil reserves (Robelius, 2007).
Therefore, objectively approaching in defining the price for output, we made statistical forecast
based on historical data on fossil fuel prices.
Herewith, fuel prices (enclosure 14, part 1) for projected revenues (ibid, part 2) were derived
based on forecasted with Risk Simulator software (2010). The business administration expertise
allows us to appropriately use the derived data. In particular, we used time series analysis as a
forecasting method applying Double Exponential Smoothing model. We also considered ARIMA
model but due to low number of observations had to choose another approach. Holt-Winter’s
multiplicative has also been tested and compared with Double Exponential Smoothing (DES)
results. However, we stay with the last one (DES) because Holt-Winter’s multiplicative is more
applicable for the data where seasonality is observed, which is not in our case. Herewith,
historical and forecasted prices of fossil fuels are attached in the enclosure 6.
Nevertheless, from the figure 3 we observe that Double Exponential Smoothing model in
overall quite nicely capture the trend, though the error in forecasted data exists. Also, should
be noted that forecast for kerosene is somewhat biased due to low number of observations

32
(15) whereas observations for gasoline and diesel is 40 each. However, such errors will be
taken into account in stochastic capital budgeting.
Figure 3. Fuels price forecast (authors’ calculations; enclosure 6)
Herewith, ceiling prices are the result of forecast for the period of 2011 – 2020 yy. However,
we presume 20% discount from the ceiling prices defying it as list price, whereas minimum
prices is derived as percentage from price structure on fossil gasoline in 2009 given in enclosure
15. Accordingly, the minimum producer price is a sum of product total cost (productkostnad)
and gross margin (bruttomarginal), i.e. (3,55+0,85) = 4,4 SEK/L for fossil gasoline, which is 36%
out of retail price 12,06 SEK / L in 2009. Herewith, we assume that the minimum price will
represent on average 36% of the forecasted price. The same principle applies to the prices on
diesel and kerosene. However, sale price assumed to be a mean of Max and Min prices with
skewness to the Min price following our underling principle “get minimum”. These set of prices
is introduced in the enclosure 14, part 1. Should be noticed that today’s (07.05.2010) top price
on synthetic diesel is 15,09 SEK which is available online on www, Framtidsbranslen, 1, (2010).
Nevertheless, the products are sold at aforementioned prices under following conditions:
Direct access to the B2B customer. As it was mentioned, the qualitative characteristics
of given product allows for direct substitution of the fossil fuels.
Existent demand – ever needed product, at least for 10 years ahead according to the
qualified guesswork.
On the expense side, fixed and variable costs (enclosure 12), capital depreciation, principal,
interest and taxes all contribute to total cash outflow. Notice that the first establishing year
(2011) has only half year of production period. Hence, labour cost and other relative one are
introduced only for half year. Estimates related to the fixed and variable costs are the
following:

33
Labour expenses are taken from Swedish statistics on salaries (www, lonestatistik, 1,
2010) and expected to grow with 2% annually in real terms according to Swedish
statistic (www, ekonomifakta, 1, 2010).
Maintains of equipment is 1,5% annually of initial investment (pers.com., Chernov,
2010). Maintains of building is assumed to be 1% annually of initial investment.
The prices of laboratory costs are adapted to the Swedish setting from the pilot project
run in Ukraine (BioDieselDnepr Ltd, 1, 2010).
Insurance is calculated as 3% of the beginning year value of the equipment and 2% as
the beginning year value of building.
Prices for fertilisers for algae nutrition are taken from “Lantmännen Lantbruk
Park&Mark” (pers.com., 2010). These prices are expected to grow with 1,5% annually
(ibid).
Transportation cost adopted from Den Nya Välfärden (2002) according to the annual
inflation indexes (www, ekonomifakta, 1, 2010).
Annually projected administrative regulatory costs are shown in enclosure 14, part 2.
For asset depreciation, we chose to apply 2% of depreciation on building and 78% on
equipment to depreciate it through its 10 years physical life time.
Other extraordinary costs are put based on qualified guesswork or else compensated
for the account of uncertainties inserted in the stochastic budgeting.
6.4 Results of traditional evaluation method
Examining financial feasibility of ABF project, a capital budgeting model was developed to
determine the net cash flows (enclosure 14). To study economical feasibility of the project,
several evaluation models were applied. However, this chapter discloses NPV, IRR and payback
period calculations.
In defining net present value, business cash flows (EBITDA) were taken as a basis for discounted
cash flow analysis. Due to innovative nature of the project, it is perceived to be quite risky
business. Therefore, its capital structure consists of 75% of venture capital provided by a
business angel at 25% interest rate and 25% assumed as a bank debt at 5% interest rate.
However, since EBITDA was used as a basis for NPV, the interest rate on venture capital has
been taken as for discounting rate (table 8). Such high discount rate is explained by the fact
that business angels usually require high interest rate. Whereas, the bank loan interest rate has
been considered in budgeting P&L account for the only purpose to show its influence on profit
after tax. Avoiding double discounting of cash flows with the rate of opportunity cost, it has not
been included into discounting rate, but they are included in ROA (chapter 6.6).
Table 8. Discount rate and structure of capital (authors' assumption)
Equity (venture capital) 75%
Debt (bank loan) 25%
Proportion of capital (debt to equity ratio) 33%
Cost of equity (interest rate) 25%
Cost of debt (interest rate) 5%
Discount rate 25%

34
Herewith, the results of discounted cash flows analysis showed positive NPV which is equal to
11,4 M SEK. The other criteria used for evaluation of project profit also showed positive results
where IRR is 47% and greater than discount rate (25%); payback period is 3,1 years, which is
perceived to be relatively short meaning that the investment sum can be recovered reasonably
quickly. However, the authors leave this indicator for investors’ decision. According to the rules
of traditional evaluation methods, these calculations lead to conclusion that investor has to
accept this project. However, these results represent a certainty equivalent project where
inputs are assumed to be known for sure.
6.5 Stochastic budgeting
Indeed, we never know for sure what happens in the future especially when the talk is about
political will or state of nature. By incorporating uncertainties associated with the future cash
flows into capital budgeting model, we are able to observe the range of possible outcomes of
project’s profitability.
6.5.1 Uncertainties imbedded in the stochastic budgeting
Presented in table 9 sources of uncertainty and their distributions were incorporated into
stochastic budgeting. The types of distribution to the following items are taken as
recommendations from external sources (Stockes et al., 2008; Mun, 2006). Whereas, the
distributional spread is set on assumptions based on data outlined in the paper. In general,
distributions were chosen to capture minimum and maximum predictable levels with
corresponding probabilities The actual numbers taken into account are projected in the
enclosure 14, part 1, whereas the distribution graphs laid down in the enclosure 7.
Table 9. Uncertainty assumption for capital budgeting model
Uncertainty Description Distribution
Project outlay (investment cost)
Total cost of equipment, start up operational cost, variable and fixed costs for the 1st operational month
Lognormal (enclosure 7)
Mean = 14,8M SEK,
Std.Dev.= 1,2M SEK
Production capacity
The amount of fuel production by fractions: gasoline (G), diesel (D), kerosene (K)
Uniform (enclosure 7)
(G): Min = 801 L, Max = 1297 L, Likeliest = 1049 L (D): Min = 5882 L Max = 7247 L, Likeliest = 6564 L (K): Min = 1103 L, Max = 1272 L, Likeliest = 1188 L
Price for output Producer price for products sold: gasoline (G), diesel (D), kerosene (K)
Lognormal (enclosure 7)
(G): Mean = 6,66 SEK, Std.Dev.= 2 SEK (D): Mean = 6,8 SEK, Std.Dev.= 1,97 SEK (K): Mean = 4,48 SEK, Std.Dev.= 1,13SEK

35
6.5.2 Results of stochastic budgeting
In figure 4 presented results of stochastic simulation (running 3000 iterations) of NPV with help
of @Risk software (2010). It is clear that 20% of all possible outcomes will be less than zero.
With 90% confidence, we can say that this project can end up with NPV in the range from -9,2
M SEK to +41,2 M SEK with the mean of 12 M SEK.
Figure 4. Probability distribution of possible NPVs (authors’ calculations, 2010; @Risk, 2010)
In uncertain environment evaluation it is important to know which input has the most influence
on the outcome and how a change in particular variables affects the predicted outcome. For
this reason, we derived sensitivity analysis based on uncertainties incorporated into stochastic
budgeting (figure 5).
Figure 5. Sensitivity analysis of inputs (authors’ calculations, 2010; @Risk, 2010)

36
From the graph above it is easy to notice that the diesel sales price and its amount produced
are very sensitive to changes. Thus, a decrease in diesel sales price by 10% decreases NPV by
app. 60%, the same 10% decrease in diesel production decreases NPV by almost 70%. Should
be noticed, it is only these variables that can cause NPV to be negative if we expect change
from the base value up till 50%. Relatively high sensitivity is observed behind investment cost: a
decrease by 10% in investment cost increases NPV by 20%. All other variables are almost
indifferent to the change unless large variation from the base vale is expected.
6.6 Results of real option analysis
In traditional valuation methods, only a finite time horizon is considered. However, in reality,
once the project is undertaken it is assumed that it will run forever and therefore assumption
of GBM with infinite time horizon was applied in evaluation with ROA approach. Moreover, the
same approach can be found in a study conducted by Stokes et al. (2008), who valued
investment in a methane digester, and a study by Schmit et al. (2009), who did analysis of
ethanol plant investment.
To evaluate ABF production plant by method of real option analysis the estimates of volatility,
σ2 and payout rate, δ has been obtained via stochastic simulation. These parameter values are
then used to estimate trigger value of the project and its strategic investment opportunity.
Volatility of the underlying asset is estimated from the distribution of probability of discounted
NCFs from Monte Carlo simulation using @Risk software (2010). As standard deviation is
obtained in the same values as NPV (i.e. millions SEK), relative standard deviation has been
used to convert it to percentage equivalent. Thus, a standard deviation of 57% is obtained,
corresponding to a variance σ2 = 0,32. This estimated volatility is within the range of
conventional option valuation where the diffusion parameter often approaches 50% (Stokes et
al., 2008). The average payout rate, δ is estimated to be 18%. The risk free interest rate is
assimilated to inflation-linked government bonds with 10 years maturity date and corresponds
to a rate of 4% (www, riskgalden, 1, 2010,).
Based on the above estimates, other unknown parameters, β and A using formulas (11) and
(10) correspondingly, were calculated for the purpose of option pricing. Thus, β = 1,98 meaning
that the value of the project should be almost twice as large as investment sum before the
project should be undertaken. Parameter A = 0,000000025 is just used for option value (i.e.
opportunity cost) calculation.
The clear advantage of using stochastic simulation is that values of some unknown parameters
are empirically estimated. Although, the clear disadvantage is that very little is known about
precise nature of the uncertainty of the underlying inputs.
Applying the above mentioned estimates into ROA modelling, presented in chapter 4.5.2, it was
found that the optimal value of the project, V* at which it is optimal to invest is 30M SEK.
Whereas, the calculated present value, V, of the ABF production plant under posed conditions
is 26,2M SEK and the option value to “wait and see” is 0,2M SEK (difference between strategic
value and NPV line). These results are graphically presented in figure 6. Thus, ROA suggests not

37
investing now (despite of positive NPV) but to wait until more information will arrive. As
uncertainty of ABF production plant is high, ROA requires a substantial premium over
investment sum in order to shield the risk.
Figure 6 Value of the investment opportunity, F(V), as a function of project value (V), for δ = 0,18, r = 0,04, σ = 0,57 (authors’ calculations, 2010)
6.7 Deviation of results
It is know that micro- and macro environments are nowadays dynamically evolving. Therefore
replicating this case, one should consider the historical development and current state of
affairs in the environment where technology supposed to be placed.
Due to numerous factors, the results may deviate if we put a research object into different
content. In our case, the technology invented in Ukraine is studied in Swedish market
conditions.
This study was based on the assumption that the equipment was enquired based on EXW
Dnepropetrovsk, Ukraine and therefore all transportation, logistics expenditures and custom
duties, levies, and VAT has been included to the price of equipment imported to Sweden.
Nevertheless, researcher can consider taking into the account the locally purchased equipment
as the technology consists of such units that should be available in every country besides those
units that are invented at BioDieselDnerp Ltd..
The external factors should be remembered, since the price trends on input and output may
fluctuate and, moreover, tend to increase. The political wills are not stable either, and the
technology as itself may be more developed and even the method will be upgraded or changed
according to the future market challenges.

38
7 Analysis and discussion In this chapter authors attempt to analyse results derived in previous chapters, discuss how
each method used for investment appraisal impact the investment decision and to answer
research questions, which were put at the beginning of this paper.
7.1 Economic and financial feasibility of the ABF production plant
Economic and financial feasibility of the project to a great extend depends on the assumptions
applied to the capital budgeting and valuation models. Nevertheless, constructed capital
budgeting (enclosure 14, part 2) illustrate that under strict market and financial conditions the
project gives positive after tax net cash flows, which profess good financial viability.
Evaluation of economic feasibility is somewhat more complicated. One should bear in mind
that discounting rate has significant influence on the result, which is seeing from the sensitivity
analysis and proofed by the theory. It should be also repeated that discounting rate is not
constant and varies over time, thus changing predicted outcome. Nevertheless, the use of high
discounting rate still gives positive NPV, all other being constant, confirming viability of the
project.
The use of more ample valuation approach then NPV gives slightly different result. It’s rather
hard to make an investment decision for risk-averse person under results from sensitivity
analysis which showed 20% probability of negative NPV. Hence, it may be a sign of not
accepting the project because of its inability. Wide spread of results (high standard deviation)
points out to high risk involved. It should be noted that this riskiness is determined by the input
data put to the stochastic budgeting. For example, the reason for wide spread between min
and max product price is that max price involves taxes that are imposed on fossil fuel. Since
biofuels are currently exempted from those taxes, we are not sure how much, and when they
will be imposed, we are allowed to take a gap between products cost price and fossil fuel retail
price. Under most probable prices, which take only a small part of above mentioned gap, the
NPV is positive. However, if biofuels will become a subject to a full taxation the NPV will be
negative.
Will ABF production be profitable without governmental support?
From empirical findings and the above analysis become clear: without governmental support
ABF production is unlikely to be profitable. At least some of tax reliefs should exist, e.g. no CO2
tax. It is seen from the case study that tax reliefs on biofuels is a good tool for supporting
producers of biofuels.
However, investors look not only to the fact of profitability but also rather to its level in
comparison with other available options. The approach of ROA is very useful in valuing the
opportunity cost. According to the results presented in chapter 6 “empirical findings”, despite
of positive NPV the estimated project has an option value “to wait” which equals to 0,2M SEK.
Under highly uncertain environment, even positive NPV is not sufficient condition to trigger
immediate investment. Most investors would prefer to wait until some uncertainties will
disperse. Therefore, if the government would like to reach its goal of fossil fuel free society and

39
stimulate production of biofuels, it should consider benefits for biofuel producers that would
also cover the opportunity cost.
When is it optimal to invest in ABF production?
As theory of real option suggests, a positive NPV does not necessarily implies the right time for
investment. In such rapidly expanding technology as algae fuel production there might be a
value to wait and observe future technological and fuel price development. By doing so, the
investor might experience a better, more cost efficient method of extracting fuels from algae, a
better method of cultivating them, or sufficiently high prices on fossil fuels. On the other hand,
by investing today the investor can gain good market share as a “first mover”. Eventually, even
though Sweden put accent to promote such alternatives as gas and electric cars, it might take a
decade or more to change the existent infrastructure. As we observe, methane-deriving
technologies are developed long ago but the use of gas in vehicles are still not prevailing fuel.
This is because of high investments needed to change the entire infrastructure. Contrary, the
ABFs having alike feature with fossil fuels are well fitted to existent infrastructure, therewith
being a direct substitute to fossil fuels ABFs should not face any problem in this regard.
An early investment, in its turn, can open up new options, which are not existent before project
is actually realised. These options are expansion / scaling up, deferring and later restarting the
operation if things go unfavourably and the exit option. By answering the question “when to
invest” we should take into account the resulting benefits of the investment and whether they
are damaging or benefiting the competitor. Given the degree of secrecy of ABF production, it is
expected that the emerging competitors will have contrarian behaviour and thus an aggressive
price competition is not expected. Moreover, the option value to “wait and see” is relatively
low and the optimal investment point is quite close to an evaluated situation (refer to figure 6).
Herewith, the above-mentioned facts and current market situation leads to conclusion that the
investor should commit to an early investment.
7.2 Impact of evaluation methods on investment decision
Intuitively, more advanced evaluation methods should provide clearer picture about the posed
problem at the same time simplifying managerial decision. But, let us see: “how different
valuation methods change managerial decision to invest?”.
Under traditional NPV rule, the manager would decide to invest. However, after sensitivity
analysis the risk-averse person would be in doubt whether to invest or reject proposal. He/she
might want to consult other specialists or spend additional time gathering extra information.
Nevertheless, even after that there is no guarantee that he/she will be satisfied with the
findings in order to make the correct decision. Theory suggests that when NPV has a marginal
value (near 0 or near hurdle rate) it is valuable to use ROA approach. Thereby, real option
analysis, despite on positive NPV, tells us to wait until uncertainties disperse and the situation
became clearer or until prices for the produced commodities will be high enough to shield the
underlying risk.

40
Supporting the theory, we agree that traditional valuation methods in investment appraisal do
not always provide the correct answer. NPV approach is useful under conditions when future
predictions are certain. Using NPV method under uncertain environment may frankly lead to a
wrong decision. The stochastic budgeting and sensitivity analysis are, of course, supportive in
capturing uncertainties and providing wider frame to be considered at the same time
introducing carefulness into manager’s behaviour. As for today, the most advanced method in
valuing irreversible investments (in reality almost all investments are irreversible) is the real
options analysis. Real options approach is not just about getting a number, it provides a useful
framework in strategic decision making that can help to prevent making mistakes. In the other
words, ROA brings flexibility into managerial behaviour. The above analysis is graphically
presented in figure 7.
Consequently, advanced valuation methods do not explicitly simplify the process of decision-
making but lead to a structural thinking and facilitate in concentrating on critical variables that
significantly influence outcome.
Nevertheless, should be pointed that ROA values the opportunity but not the cost of waiting.
On this issue scholar has still to work further to find even better way to value irreversible
investments, where both opportunities and costs are valued and weighted.
7.3 Opportunities and obstacles for adopting ABF production in Sweden
Prevailing seems to be the opportunities rather than obstacles. A political will directed towards
environmentalism makes everything possible to reach its goals for improving the state of affair
in the nature. Looking at the Swedish energy policy becomes clear that main accent in support
within biofuels is put to RME, ethanol and biogas. It is clearly stated in the Biofuels report
(2009) that second-generation biofuels such as RME will continue to be supported even though
import of raw materials will be required. Moreover, it encourages with tax exemptions
installing the pilot projects within renewable energy sector, which fits to the technology we
considered. These are both energy security and environmentally driven factors. Contributory to
the opportunity is the fact that Sweden makes the business environment to be more
economically attractive. This is confirmed by the observation mentioned in the chapter 6.2
Eval
uat
ion
co
mp
lexi
ty
Figure 7. Evaluation methods and their influence on decision-making (developed by author’s)
NPV
• Hard to make reliable decision
• Usefull only for certainty equivalent world
Stochastic budgeting
• Captures uncertainties
• Introduces carefulness into decision-making process
ROA
• Captures flexibility
• Prevent from making mistakes (wrong deciisons)
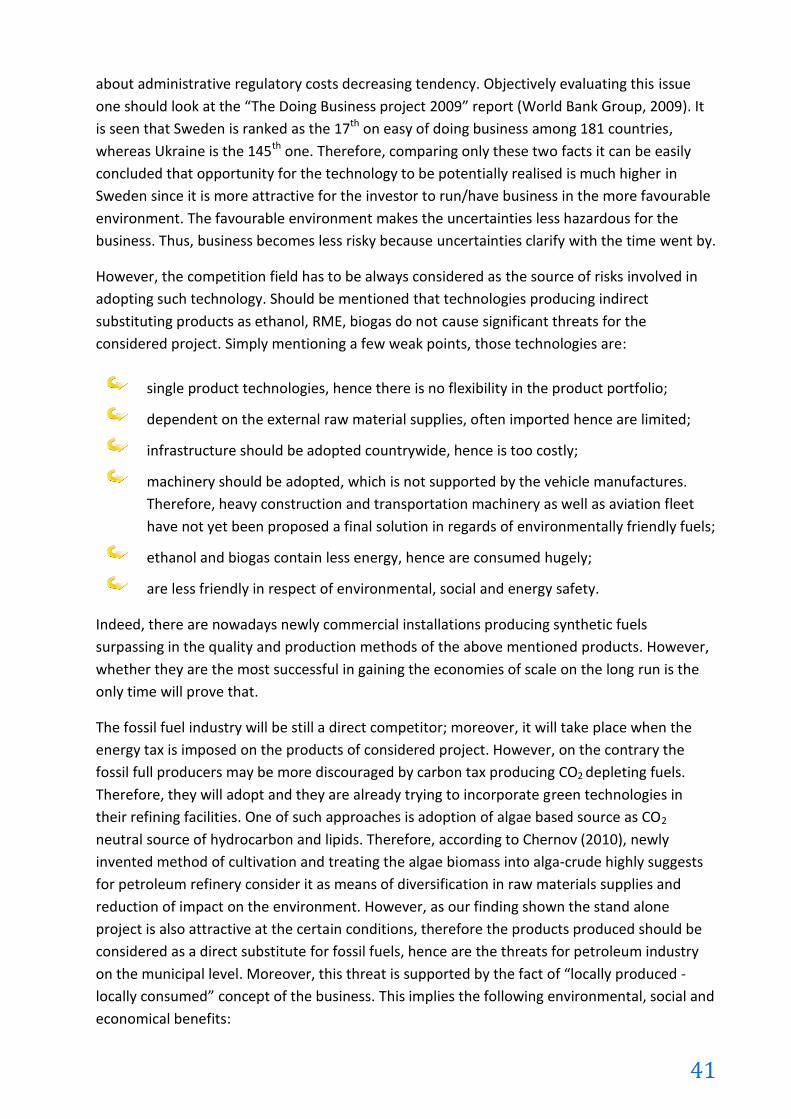
41
about administrative regulatory costs decreasing tendency. Objectively evaluating this issue
one should look at the “The Doing Business project 2009” report (World Bank Group, 2009). It
is seen that Sweden is ranked as the 17th on easy of doing business among 181 countries,
whereas Ukraine is the 145th one. Therefore, comparing only these two facts it can be easily
concluded that opportunity for the technology to be potentially realised is much higher in
Sweden since it is more attractive for the investor to run/have business in the more favourable
environment. The favourable environment makes the uncertainties less hazardous for the
business. Thus, business becomes less risky because uncertainties clarify with the time went by.
However, the competition field has to be always considered as the source of risks involved in
adopting such technology. Should be mentioned that technologies producing indirect
substituting products as ethanol, RME, biogas do not cause significant threats for the
considered project. Simply mentioning a few weak points, those technologies are:
single product technologies, hence there is no flexibility in the product portfolio;
dependent on the external raw material supplies, often imported hence are limited;
infrastructure should be adopted countrywide, hence is too costly;
machinery should be adopted, which is not supported by the vehicle manufactures.
Therefore, heavy construction and transportation machinery as well as aviation fleet
have not yet been proposed a final solution in regards of environmentally friendly fuels;
ethanol and biogas contain less energy, hence are consumed hugely;
are less friendly in respect of environmental, social and energy safety.
Indeed, there are nowadays newly commercial installations producing synthetic fuels
surpassing in the quality and production methods of the above mentioned products. However,
whether they are the most successful in gaining the economies of scale on the long run is the
only time will prove that.
The fossil fuel industry will be still a direct competitor; moreover, it will take place when the
energy tax is imposed on the products of considered project. However, on the contrary the
fossil full producers may be more discouraged by carbon tax producing CO2 depleting fuels.
Therefore, they will adopt and they are already trying to incorporate green technologies in
their refining facilities. One of such approaches is adoption of algae based source as CO2
neutral source of hydrocarbon and lipids. Therefore, according to Chernov (2010), newly
invented method of cultivation and treating the algae biomass into alga-crude highly suggests
for petroleum refinery consider it as means of diversification in raw materials supplies and
reduction of impact on the environment. However, as our finding shown the stand alone
project is also attractive at the certain conditions, therefore the products produced should be
considered as a direct substitute for fossil fuels, hence are the threats for petroleum industry
on the municipal level. Moreover, this threat is supported by the fact of “locally produced -
locally consumed” concept of the business. This implies the following environmental, social and
economical benefits:

42
locally created jobs, enforcing rural development and lessen social unemployment
benefits assignments;
significantly reduced delivery cost, since the main raw material “biocrude” is produced
on site;
reduced delivery, handling and storage costs also achieved for the account of direct
access to the B2B customer and optionally to B2C, avoiding deliveries to wholesale fossil
fuel depots. This is because the ABFs are fully compatible with existent engines and
infrastructure;
lesser transportation reduces CO2 and other contaminants impact on the nature, hence
less health problems in the community resulting in stronger generations.
Finally, the multiple areas of application and issues mentioned in the chapters 3.1.1 and 2.3 set
the technology in front of the others that are currently introduced on Swedish market.
Herewith, this competitive advantage justifies the claims of being it as the 3rd generation and
sustainable technology.

43
8 Conclusions The problem raised up in this paper declares about controversy among scientist regarding
economic feasibility of ABF production. Findings presented above prove that production of
third generation biofuels (in particular fuels from algae) is feasible under certain conditions
(e.g. tax reliefs). However, should be mentioned that economic attractiveness of ABF
production to a great extend depends on the methods and technology applied.
Taking into account considered technology can be drawn an optimistic conclusion about its
economical and financial feasibility. However, the fact that this paper is about a synthetic firm
should be kept in mind. The principle “Pay maximum - get minimum“ could have led
calculations to the worst case scenario, nevertheless the results are still promising. Therefore,
as suggestion, the technology should be approved practically on the pilot project running all
possible tests on it, which is pointed out in the chapter “Suggestions”.
It is clear from the discussion that analytical tools applied here are of great support for
investment decision; however, other decision-making methods such as market observation and
analysis should not be neglected. The use of more complicated evaluation models does not give
the straight answer to the problem but provides hints and guidelines to the structural and
strategic thinking. We adhere to the fact that traditional evaluation methods do not give an
adequate picture to the problem-solving in a multifaceted reality. We found to be supportive
and useful such evaluation methods as stochastic budgeting and real option analysis, which
help not only apprise but conceptualize projects facilitating in risk mitigation. Of course, ROA is
not perfect valuation method but it is the best what we have for today.
Hence, the contribution of this study is that it reveals economic attractiveness of the shadowed
industry and secondly, uncovers the effect of the evaluation method on the investment
decision.
8.1 Suggestions
The first need that authors met on the initial stages of research is lack of techno-economic data
(due to secrecy of data). This data is the bioengineering estimates that determine the effect of
input on output. The data could be used in production function formulation relevant to the
technology considered. It is known that each production process has its own specific
production function, which is used in profit-cost optimisation problems taking into account
constraints. However, testing facilities are needed for this, because “forecasted” engineering
production function has to be adjusted to the real production data. The adjusted production
function is convenient when one solves the problems of scaling up the capacity of plant, etc..
The hypothesis applied for ROA modelling that value of the project follows GBM would be
valuable to verify in further studies. It was assumed that change in project value follows the
stochastic trends of fossil fuel prices. It is valuable to prove it because this approach could be
easily used for mathematical modelling in other similar problem.
The other issue is that paper studied the project with predefined time life (10 years) under
condition that reinvestments have not been taking into account, and the equipments is 100%

44
depreciated. However, if one considers to replicate this study for its own use for instance
business plan, it is suggested to consider an expansion strategy if the accumulated cash flows
will allow for that. In such a case, the planner will reach economies of scale, which should
positively reflect on the end NPV figure and other financial indexes.
Moreover, intelligence research on the subject of technogenic competitive advantage could be
done for the purpose of disclosing the situation whether the considered technology has a direct
competitors in the field for the future.
Since authors dealt with relatively new technology, not tested on the long run, proper
economical and financial analysis ought to be done based on the historical economic and
bioengineering data. Obviously, the historical data is needed for such kind of works; therefore,
an empirical observation should be run in the relevant conditions to get such data. Thereafter
given the results of empirical observations it will become logical to carry out the decisive
studies, such as: life cycle analyses disclosing energy balance, cost benefit analysis,
environmental assessment, etc..
Having in mind the environmental goals of country and the equivalent features of technology,
could be generally suggested that human kinds should extensively practice R&D of various
systems within the multiple area (chapters 3.1.1) of ABF production. Herewith, taking into
account the optimistic results of this research, instalment of relevant facilities based on
considered technology can be justified in economical terms. Therefore, research institutions
will not have financial burden, meanwhile investor has positive cash flows reducing risks
through diversification of his\her investment portfolio.
Novelty of technology brings many undiscovered areas to be studied. Therefore, establishing
pilot project in Sweden for the purpose of collaboration and exchange of knowledge would be
valuable contribution to highly needed infant industry. These united affords have to utilise the
highest potential of technology reaching the common goals of environmental and energy
safety.

45
Reference list:
Literature and publications
Alabi, Y., Tampier, M., Bibeau, E., SeedScience Ltd. (2009) Microalgae Technologies & Processes for Biofuels / Bioenergy production in British Columbia: Current Technology, Suitability & Barriers to Implementation. Available via: http://www.bcic.ca/images/stories/publications/lifesciences/microalgae_report.pdf ; and Appendixes via: http://www.bcic.ca/images/stories/publications/lifesciences/microalgae_appendices.pdf , 16.02.10.
Alkalay, G. (2007) Guide to Starting a Biofuel Co-operative. Northfield Ventures Ltd.
Andersen, R. A. (2005) Algal culturing techniques, ISBN: 0120884267, 9780120884261
Andræ, E. (2009) Produktion av förnyelsebar diesel, en studie av producenter av biobränsle från skogs- eller jordbrukssektorn, Master thesis, ISSN: 1654-1367, Swedish University of Agricultural Sciences.
Articis, P., G. (1999) A capital budgeting stochastic simulation model applied in the banking industry. Managerial finance, 25(8), 1-11.
Banerjee, A., Sharma, R., Chisti, Y., and Banerjee, U., C., (2002) Botryococcus braunii: A Renewable Source of Hydrocarbons and Other Chemicals, Critical Reviews in Biotechnology, 22(3):245–279. Available via: http://informahealthcare.com/doi/pdfplus/10.1080/07388550290789513 , 17.05.2010, accessed via the library of Sveriges lantbruksuniversitet.
Berg-Nilsen, J. (2006) Production of Micro algae based products, Algetech Produkter AS. Available via: http://www.nordicinnovation.net/_img/production_of_micro_algea-based_products_final_report.pdf , 10.02.10.
Bowman, E.H. and Moskowitz, G.T. (2001) Real options analysis and strategic decision making. Organization science, 12(6), 772-777. Cited in: Gustavsson, A. and Töre, H., (2006) Venture Capital: In need of new valuation tools? Master’s Thesis in corporate finance, Jönköping University.
Brennan, L. and Owende, P. (2010) Biofuels from microalgae—A review of technologies for production, processing, and extractions of biofuels and co-products. Renewable and Sustainable Energy Reviews, 14, 557–577. Available via: http://www.sciencedirect.com/science?_ob=ArticleURL&_udi=B6VMY-4XJVGRG-1&_user=10&_coverDate=02%2F28%2F2010&_rdoc=1&_fmt=high&_orig=search&_sort=d&_docanchor=&view=c&_searchStrId=1214597180&_rerunOrigin=google&_acct=C000050221&_version=1&_urlVersion=0&_userid=10&md5=9b5d783eb59b82ecb62427d3832dd965 , 10.02.10, accessed via the library of Sveriges lantbruksuniversitet.
Brown, P. (2009) Algal Biofuels Research, Development, and Commercialization. Priorities: A Commercial Economics Perspective. Diversified Energy. Available via: http://www.diversified-energy.com/auxfiles/pressReleases/Algae%20Biofuel%20Development%20Priorities.pdf , 18.01.10.

46
Campbell, H. F. and Brown, R. P. C. (2003) Benefit-cost analysis: financial and economic appraisal using spreadsheets. ISBN 0-521-82146-0
Campbell, N., M. (2008) Biodiesel: Algae as a Renewable Source for Liquid Fuel, Guelph Engineering Journal, (1), 2 - 7. ISSN: 19161107.
Carlsson, A., S., Beilen, J., B., Möller, R., Clayton, D. (2007) Micro- and Macro-algae utility for industrial applications. ISBN 13: 9781872691299
Charter, M. and Polonsky, M. J. (1999) Greener Marketing. A global perspective on greening marketing practice. ISBN 1874719144
Cherubini, F., Jungmeier, G., Wellisch, M., Willke, T., Skiadas, I., René Van Ree, Ed de Jong (2009) Toward a common classification approach for biorefinery system. Biofuels, Bioproducts and Biorefining, 3(5), 534-546. Available via: http://www3.interscience.wiley.com/cgi-bin/fulltext/122589508/PDFSTART , 16.02.10.
Copeland, T. and Antikarov, V. (2001) Real Options: A Practitioner's Guide. Texere Publishing Limited, New York, NY.
Cormick, K. and Kaberger, T. (2005) Exploring a pioneering bioenergy system: The case of Enkoping in Sweden, Journal of Cleaner Production, 13 , 1003 – 1014
Dagens Industri (2006 - 2010), rubric ”Råvaror”, issues: 30.06.2006 – 26.02.2010.
Dahlbacka, B. (2009) Sweden Biofuels Annual Report, GAIN report no.: SW9008. Available via: http://gain.fas.usda.gov/Recent%20GAIN%20Publications/Biofuels%20Annual_Stockholm_Sweden_6-24-2009.pdf , 16.03.2010
Demirbas, A. (2009) Biofuels securing the planet’s future energy needs. Energy Conversion and Management, 50, 2239–2249.
Den Nya Välfärden (Konkurrenskommissionen), (2002), KKO 01-079, PM-2 2002-02-27. Available via: http://www.dnv.se/konkurrenskommissionen/JuristPM.aspx?Fall=KKO%2001-079, 05.04.2010.
DGS -The German Solar Energy Society, Ecofys (2005) Planning and Installing Bioenergy Systems : A Guide for Installers, Architects and Engineer. ISBN: 9781844071326, 9781849772167, 1844071324 (pdk). Available via: http://site.ebrary.com/lib/slub/Doc?id=10128902&ppg=1, 08.03.10, accessed via the library of Sveriges lantbruksuniversitet.
Dixit, A.K. and Pindyck, R.S. (1994) Investment under Uncertainty. Princeton University Press, Princeton, NJ.
Dmitrov, K. (2007) GreenFuel Technologies: A Case Study for Industrial Photosynthetic Energy Capture. Available via: www.nanostring.net/Algae/CaseStudy.pdf , 18.01.10.
Dodge, Y. (2003) The Oxford Dictionary of statistical Terms, OUP. ISBN 0-19-920613-9
EIA (2006) Glossary from the U.S. Energy Information Administration
Fredin, M. (2009) Alger som energikälla – en Svensk möjlighet? Examensarbete är utfört vid Tekniska Högskolan i Jönköping, och vid Sveriges Tekniska Forskningsinstitut i Borås.

47
Grahn, M. and Hansson, J. (2009) Möjligheter för förnybara drivmedel i Sverige till år 2030. Institutionen för Energi och Miljö, Avdelningen Fysisk resursteori, Chalmers tekniska högskola, Göteborg.
Groppelli, A. A. and Nikbakht, E. (2006) Finance. 5th edition. ISBN-10: 978-0-7641-3420-3, ISBN-13: 978-0-7641-3420-3
Gustavsson, A. and Töre, H. (2006) Venture Capital: In need of new valuation tools? Master’s Thesis in corporate finance, Jönköping University.
Helfert, E. (2001) Financial Analysis Tools and Techniques. ISBN: 9780071378345, 9780071395410.
Hilyard, J. (PennWell Corporation) (2007) International Petroleum Encyclopedia. ISBN: 9781593701031
Hilyard, J. (PennWell Corporation) (2008) International Petroleum Encyclopedia. ISBN: 1593701640, 9781593701642
Hyde, J., Stokes, J., Engel, P. (2003) Optimal investment in an automatic milking system. Agricultural and Resource Economics Review, 32, October, 282-294
Isik, M., Coble, K., H., Hudson, D., House, L.O. (2003) A model of entry-exit decision and capacity choice under demand uncertainty. Agricultural Economics, 28, 215-224.
Jobber, D. and Fahy, J. (2003) Foundations of Marketing. ISBN: 0077098668
Joel de la Noie, Laliberte, G., Proulx, D. (1992) Algae and waste water. Journal of Applied Phycology, 4, 247-254.
Kolesnikov, A., Kutcherov, V., G., Goncharov, A. F. (2009) Methane-derived hydrocarbons
produced under upper-mantle conditions. Nature Geaoscience, 2, 566 - 570, August. Available
via: http://www.nature.com/ngeo/journal/v2/n8/pdf/ngeo591.pdf , 24.01.10, accessed via the
library of Sveriges lantbruksuniversitet.
Kotler, P. and Keller, K. L. (2006) Marketing Management, 12th ed.. ISBN: 0131457578
Lauer, B., Hyde, J., Richard, T. (2007) Assessing the profitability of anaerobic digester operation on a Minnesota dairy farm. Paper presented at northeast agricultural and resource economics annual meeting, Rehoboth Beach, DE, June.
Lee, D., Newman, P., Price, R. (1999) Decision making in organisations. ISBN 0 273 63113 6
Leslie, K.J. and Michaels, M.P. (1997) The real power of real options. The McKinsey quarterly,3. Cited in: Gustavsson, A. and Töre, H. (2006) Venture Capital: In need of new valuation tools? Master’s Thesis in corporate finance, Jönköping University.
Lufti, A. and Desougi (1984) Mineral nutrient demands of the water hyacinth (Eichhornia crassipes (Mart.) Solms) in the White Nile, Hydrobiologia 110, 99-108. Available via: www.springerlink.com/content/q527p36lpw525722/fulltext.pdf , 04.05.2010, accessed via the library of Sveriges lantbruksuniversitet.

48
Marsh, G. (2009) Small wonders: biomass from algae. Renewable energy focus, January-February 2009, 74-78.
Mata, T., M., Antonio A., M., Nidia, S., C. (2010) Microalgae for biodiesel production and other applications: A review. Renewable and Sustainable Energy Reviews, 14, 217–232.
Metzger, P., Largeau, C., (2005) Botryococcus braunii: a rich source for hydrocarbons and related ether lipids, Appl Microbiol Biotechnol 66: 486–496. Available via: www.springerlink.com/content/8x1v7thjvayfgr7p/fulltext.pdf , 17.05.2010, accessed via the library of Sveriges lantbruksuniversitet.
Miller, L.T. and Park, C.S. (2002) Decision making under uncertainty - Real options to the rescue? The engineering economist, 47(2).
Monti, M. (Europeiska kommissionen) (2003) Answer on proposal from Minister for Justice Laila Freivalds: “Statligt stöd N 480/2002 – Sverige: Punktskattelättnad för koldioxidneutrala drivmedel”, C(2003)4071fin.
Mun, J. (2006) Real option analysis: tools and techniques for valuing strategic investments and decisions. 2nd edition. ISBN-13: 978-0-471-74748-2
Näringslivets Regelnämnd (2008) Företagens totala regelkostnader (Delrapport 7: Så påverkar EU företagens regelkostnader), available via: http://www.regelkostnader.se/assets/files/nnr_eusregelkostnader.pdf , 15.04.2010.
Näringslivets Regelnämnd (2010) Regelindikator 2009 (NNR utvärderar det statliga regelförenklingsarbetet i Sverige), Januari. Available via: http://www.nnr.se/assets/files/publikationer/nnr_regelindikator_2009.pdf , 15.04.2010
Naturvårdsverket (The Swedish Environmental Protection Agency) (2005) Economic Instruments for the Environment. ISBN: 9162082213.
Neelie, Kroes, (Europeiska kommissionen) (2005) Answer on proposal from Minister for Justice Laila Freivalds: “Statligt stöd N 187/2004 – Sverige: Nedsättning eller befrielse från skatt för pilotprojekt för alternativa drivmedel”, C(2005)1171 fin.
Neltner, B. and Tester J. (2008) Algae Based Biodiesel
Nilsson, J. (2004) Agricultural Cooperatives and Legislation on Competitio. Department of Economics, Swedish University of Agricultural Sciences
Nygren, E. (2008) Aviation Fuels and Peak Oil. Undergraduate diploma thesis, Uppsala University. ISSN: 1650-8300.
OPAB AB, Oljeprospektering AB (2007) Information about project Dalders – consultation document. Available via: http://www.dalders.se/ds/export/dalders/galleries/downloads/kontakta_press/consultation_dalders.pdf , 08.03.2010
Packer, M. (2009) Algal capture of carbon dioxide; biomass generation as a tool for greenhouse gas mitigation with reference to New Zealand energy strategy and policy. Energy Policy, 37, 3428–3437

49
Pandey, A. (2008) Handbook of plant-based biofuels. ISBN: 9781560221753 9780789038746
Persson, G. (2006) Making Sweden an oil-free society. Commission on Oil Independence, Sweden.
Postali, F.A.S.and Pichcetti, P. (2006) Geometric Brownian motion and structural breaks in oil prices: a quantitative analysis. Energy Economics, 28, 506-522.
Pretorius, F., Chung-Hsu, B.-F., McInnes, A. (2008) Project Finance for Constructions and Infrastructure: Principles and Case Studies. Hoboken, NJ, USA: Wiley-Blackwell.
Purvis, A., Boggess, W.G., Moss, C.B., Holt, J. (1995) Technology adoption under irreversibility and uncertainty. American Journal of Agricultural Economics, 77, 541-551
Rapier, R. (2008) Renewable Diesel. Biofuels, Solar and Wind as Renewable Energy Systems, Ch.7, 153-171. ISBN: 9781402086533
Reddy, K. R. and Tucker J. C. (1983) Productivity and Nutrient Uptake of Water Hyacinth, Eichhornia crassipes. Economic Botany, 37(2), pp. 237-247. Available via: www.springerlink.com/content/jt553064194777gv/fulltext.pdf , 03.05.2010 , accessed via the library of Sveriges lantbruksuniversitet.
Robelius, F. (2007) Giant Oil Fields - The Highway to Oil : Giant Oil Fields and their Importance for Future Oil Production. Doctoral thesis. Uppsala: Acta Universitatis Upsaliensis; Uppsala Dissertations from the Faculty of Science and Technology, Uppsala University, ISBN 978-91-554-6823-1. Available via: http://uu.diva-portal.org/smash/record.jsf?pid=diva2:169774 , 07.05.2010
Royer J., S. (2003) Theory of Cooperatives: Neoclassical. University of Nebraska-Lincoln
Rozzell, J.,D. (1999) Commercial Scale Biocatalysis Myths and Realities. Bioorganic & Medicinal Chemistry, 7, 2253-2261 Available via: http://www.sciencedirect.com/science?_ob=MImg&_imagekey=B6TF8-3XX697T-P-W&_cdi=5220&_user=651610&_pii=S0968089699001595&_orig=search&_coverDate=10%2F31%2F1999&_sk=999929989&view=c&wchp=dGLbVlz-zSkzS&md5=4a7d74c5861242fdf2ca66b661983f9e&ie=/sdarticle.pdf , 11.03.2010, accessed via the library of Sveriges lantbruksuniversitet.
Ruth, L. (2008) Bio or bust? The economic and ecological cost of biofuels. EMBO reports, Vol 9, No 2, 133.
Sahlin, M. Minister for Sustainable Development, Sweden, (2005) Dagens Nyheter, 01 October.
Schmit, T.M., Luo, J., Tauer, L.W. (2009) A real option analysis of ethanol plant investment under uncertainty. Biomass and Bioenergy, Vol. 33, Issue 10, October, 1442-1451. Available via the library of Sveriges Landbrugsuniversitet: http://www.sciencedirect.com/science?_ob=ArticleURL&_udi=B6V22-4WPS9GT-4&_user=651610&_coverDate=10%2F31%2F2009&_rdoc=1&_fmt=high&_orig=search&_sort=d&_docanchor=&view=c&_acct=C000035238&_version=1&_urlVersion=0&_userid=651610&md5=7cc1c1e1af79c2921c2fbe3db0eca91a#sec4.2 , 16.03.2010.
Schwartz, E.S. and Trigeorgis, L. (2004) Real options and investment under uncertainty: classical readings and recent contributions. ISBN 0-262-69318-6 (pb)

50
Sheehan, J., Dunahay, T., Benemann, J., Roessler, P. (1998) A look back at the U.S. department of energy's aquatic species program biodiesel from algae. Available via: http://www.nrel.gov/docs/legosti/fy98/24190.pdf , 22.02.10.
Smyth, B., M., Murphy ,J., D., O’Brien, C., M. (2009), What is the energy balance of grass biomethane in Ireland and other temperate northern European climates? Renewable and Sustainable Energy Reviews, 13, 2349–2360.
Soanes, C. and Stevenson, A. (2006) Concise Oxford English Dictionary, Oxford University Press (software).
Spolaore, P., Joannis-Cassan, C., Duran, E., Isambert, A. (2006) Commercial applications of microalgae. Journal of Bioscience and Bioengineering, 101(2), 87-96.
Stokes, J.R., Rajagopalan, R.M., Stefanou, S.E. (2008) Investment in a Methane Digester: An Application of Capital Budgeting and Real Options. Review of Agricultural Economics, 30(4), 664-676.
Sullivan, A. and Sheffrin, S. M. (2003) Economics: Principles in action. Upper Saddle River, New Jersey 07458: Pearson Prentice Hall. ISBN: 0130630853
Tauer, L. (2006) When to get in and out of dairy farming: a real option analysis. Agricultural and Resource Economics Review, 35, October, 339 – 347.
Tran, N.,H., Bartlett, J., R., Kannangara, G.,S.,K., Milev, A.,S., Volk, H., Wilson, M., A. (2010) Catalytic upgrading of biorefinery oil from micro-algae. Fuel, 89, 265–274.
Trigeorgis, L. (1996) Real options: managerial flexibility and strategy in resource allocation. ISBN: 0-262-20102-X
Trigeorgis, L. (2005) Making use of real options simple: an overview and applications in flexible/modular decision making. Engineering Economist, March 22.
University of Oklahoma (2009)'Green' Gasoline On The Horizon, ScienceDaily, January 14. Available via: http://www.sciencedaily.com/releases/2009/01/090113155902.htm , 09.03.2010
USDA Foreign Agricultural Service (2006 – 2009) GAIN Bio-Fuels Annual Report (Global Agriculture Information Network)
Vintila, N. (2007) Real options in capital budgeting. Pricing the option to delay and the option to abandon the project. Theoretical and applied economics, Vol 7 (512), p.47-58.
Walker, D. A. (2009) Biofuels, facts, fantasy, and feasibility. Journal of Applied Phycology, Vol 21, № 5, October, 2009.
World Bank Group (2009) Doing Business project 2009. Available via: www.doingbusiness.org/documents/Simulator_English_2009.xls , 11.05.2010.
Personal communications
AGA (www.aga.se ): telephone communication with sales person Gerd Nilesol, 11.03.2010

51
Alpha Projects & Logistics ApS (www.alphapnl.com): telephone communication with sales person, 14.03.2010;
CGH Nordic (www.cghnordic.com): telephone communication with sales person, 12.03.2010
Chernov, P., J., and staff from Biodieseldnepr Ltd, Ukraine (www.biodiesel.dp.ua): phone, email personal communication, 2009 - 2010
G4S (www.g4s.se): telephone and email communication with sales person Jonas Lideborg,
11.03.2010 – 08.04.2010
Innovationsbrons (www.innovationsbron.se): email and meeting communications with investment manager Magnus Engevik, 18.03.2010 – 03.05.2010
Lantmännen Lantbruk Park&Mark (www.lantmannen.com): e-mail correspondence with the area sales manager Jan-Erik Johannesson, 14.04.2010
SPI (Swedish Petroleum Institute)(www.spi.se): email communication with Assistant Director Göran Lindell, 21.03.2010 – 30.04.2010
Svensk Fastighetsförmedling (www.svenskfast.se): phone communication with sales person Jan Bergström, 28.03.2010
Svenska Statoil AB: email communication with sales person Anna Ledensjö , 23.03. 2010
Internal sources
BioDieselDnerp Ltd., (2010):
1. Technology – commercial proposal (a refining plant of production synthesis fuels from
biomass of micro- and macro-algae with production capacity 10 – 12 tons of biomass
per 24 hours)
2. Business-plan of innovative project (a refining plant of production synthesis fuels from
biomass of micro- and macro-algae with production capacity 100 tons of biomass per 24
hours)
Internet sources
Authors’ page (http://home.student.uu.se/vavo3301/):
1. BioDieselDnerp promo video, http://home.student.uu.se/vavo3301/ , 12.03.2010.
CMF (Centrum för Miljödriven Företagsutveckling) (www.cmf.nu):
1. Consultancy support,
www.cmf.nu/in%20english/environmental%20consultant%20agency.shtml , 09.04.2010
E.ON (www.eon.se):
1. Electricity price for businesses,
www.eon.se/templates/Eon2TextPage.aspx?id=48572&epslanguage=SV , 17.03.2010
Facts about Swedish economy (www.ekonomifakta.se):

52
1. Development in real wages,
www.ekonomifakta.se/sv/Fakta/Arbetsmarknad/Loner/Real-loneutveckling-/ ,
31.03.2010
Framtidsbranslen (www.framtidsbranslen.se):
1. List price on synthetic diesel, http://www.framtidsbranslen.se/grundpris.asp,
07.05.2010
GUNT Hamburg (www.dunt.de):
1. Rectification, http://www.gunt.de/static/s1_1.php , 12.03.2010;
Regeringskansliet (www.regeringen.se):
1. Goal to oil free fleet 2030, http://www.regeringen.se/sb/d/11680/a/122082 ,
08.03.2010
Rudekinc (www.rudekinc.com):
1. Algae-hand, http://www.rudekinc.com/Algae-Hands.jpg, 11.03.2010;
Riskgalden (Swedish national debt office) (www.riksgalden.se):
1. Inflation-linked government bonds: Verksamt (web service provided by the Swedish
Companies Registration Office, the Swedish Tax Agency and the Swedish Agency for
Economic and Regional Growth),
(https://www.riksgalden.se/templates/RGK_Templates/TwoColumnPage____15736.asp
xwww.verksamt.se , 30.03.2010
Retriever Sverige AB (www.retriever-info.com):
1. Database of companies registered at Bolagsverket, the Swedish Companies Registration
Office, and Statistics Sweden, https://web.retriever-
info.com/services/businessinfo.html , 29.03.2010, accessed via the library of Sveriges
lantbruksuniversitet.
House Committee on Agriculture (www.agriculture.house.gov):
1. Phytoremediation aka bioremediation,
http://agriculture.house.gov/info/glossary/p.htm, 11.03.2010;
Industrifonden (www.industrifonden.se):
1. Capital, http://www.industrifonden.se/in_english/financing/default.asp , 02.04.2010
Lifesciences (www.lifesciences.napier.ac.uk):
1. Botryococcus braunii,
http://www.lifesciences.napier.ac.uk/algalweb/Islay06/botryococc-a.jpg, 11.03.2010;

53
Lonestatistic (www.lonestatistic.se):
1. Swedish statistics on salaries, www.lonestatistik.se/loner.asp/ , 9.03.2010
Naturvårdsverkets (The Swedish Environmental Protection Agency)(www.naturvardsverket.se):
1. Database of projects,
http://klimp.naturvardsverket.se/mir/submitQuickSearch_en.do;jsessionid=LvhwJgJnyT
rQFjQpW2Pn0VMgbLL2XJ1lcj5ChWTCp1yrpzXTvvzV!267132730 , 10.04.2010;
2. Investment programs, www.naturvardsverket.se/en/In-English/Menu/Legislation-and-
other-policy-instruments/Economic-instruments/Investment-Programmes/ , 05.04.2010
Oilgae (www.oilgae.com):
1. Latest news in algae industry, www.oilgae.com, 11.03.2010;
SPI (Swedish Petroleum Institute) (www.spi.se):
1. Yearly average prices of fuels, www.spi.se/statistik.asp?art=42 , 20.03.2010;
2. Energy taxes 2005 – 2010,
www.spi.se/fprw/files/Skatteöversikt%20per%20år%20till%202010.xls , 26.04.2010;
3. Gasoline price structure, http://www.spi.se/eng/statistics.asp?stat=56, 28.04.2010
Swedish Energy Agency (Energimyndigheten) (www.energimyndigheten.se), (National Energy
Authority):
1. Mission, http://www.energimyndigheten.se/en/About-us/Mission/ , 05.04.2010;
2. Commercialisation,
www.energimyndigheten.se/sv/Foretag/Affarsutveckling_och_kommersialisering ,
05.04.2010
Tullverket (Swedish Customs): http://taric.tullverket.se/taric/bin/tagAvdelningar.cgi ,
13.04.2010
Tillväxtverket (The Swedish Agency for Economic and Regional Growth)(www.tillvaxtverket.se):
1. Project database, http://projektbanken.tillvaxtverket.se/sb/d/1329/a/8357 ,
03.04.2010;
2. Funding,
www.tillvaxtverket.se/huvudmeny/englishpages/demoenvironment/whenandhowtoap
ply.4.21099e4211fdba8c87b800017748.html , 09.04.2010
Wikipedia (www.wikipedia.com):
1. Monte Carlo methods in finance,
http://en.wikipedia.org/wiki/Monte_Carlo_methods_in_finance , 15.03 2010
2. Energy security, http://en.wikipedia.org/wiki/Energy_security, 12.05.2010;
3. Green crude, http://en.wikipedia.org/wiki/Green_crude, 10.05.2010;

54
4. Green fuel, http://en.wikipedia.org/wiki/Biofuel#Green_fuels , 24.02.2010;
5. Fatty acid methyl ester, http://en.wikipedia.org/wiki/Fatty_acid_methyl_ester ,
04.03.2010;
6. Axenic, http://en.wikipedia.org/wiki/Axenic , 09.03.2010;
7. Eichhornia, http://en.wikipedia.org/wiki/Water_hyacinth , 04.03.2010;
8. Fischer – Tropsch Synthesis, http://en.wikipedia.org/wiki/Fischer-Tropsch_process ,
04.03.2010;
9. Continuous stirred-tank reactor, http://en.wikipedia.org/wiki/Continuous_stirred-
tank_reactor , 09.03.2010;
10. Microalgae (Botryococcus braunii), http://en.wikipedia.org/wiki/Botryococcus_braunii ,
11.03.2010;
11. PAHs, http://en.wikipedia.org/wiki/Polycyclic_aromatic_hydrocarbon , 10.03.2010;
12. Cetane number, http://en.wikipedia.org/wiki/Cetane_number , 10.03.2010;
13. Sulphur , http://en.wikipedia.org/wiki/Sulphur , 10.03.2010;
14. Carbon neutral, 10.03.2010;
15. Algae, http://en.wikipedia.org/wiki/Algae , 11.03.2010;
16. Pyrolysis , http://en.wikipedia.org/wiki/Pyrolysis , 11.03.2010;
17. -
18. Hydrocyclone, http://en.wikipedia.org/wiki/Hydrocyclone , 12.03.2010;
19. Distillation, http://en.wikipedia.org/wiki/Distillation , 12.03.2010;
20. Gasification, http://en.wikipedia.org/wiki/Gasification , 12.03.2010;
Verksamt (The Swedish Business Link to Government) (ww.verksamt.se):
1. Database of permits,
www.verksamt.se/portal/en_GB/web/international/starting/tools/find-
permits/permits?p_p_id=tvv_hitta_tillstand_WAR_tvv_hitta_tillstand_INSTANCE_FxJ9&
p_p_lifecycle=1&p_p_state=normal&p_p_mode=view&p_p_col_id=column-
2&p_p_col_count=1&_tvv_hitta_tillstand , 29.03.2010
Software used
@Risk 5.5.1 (free trial), (2010), Palisade Corporation, Available via:
www.palisade.com/trials.asp , 01.05.2010
Risk Simulator 2010 C (free trial), (2010), Real Options Valuation, Inc.. Available via:
www.realoptionsvaluation.com/download.html , 01. 05.2010;

55
Enclosures Enclosure 1. Diagram: Biofuels technology outline. ................................................................ 56
Enclosure 2. BioDieselDnepr generic technology outline. ....................................................... 57
Enclosure 3. Lipid content and productivities of different microalgae species, and comparison
with other biodiesel feedstock. ............................................................................................... 58
Enclosure 4. Accounts from demo production of synthetic fuels from algae and eichhornia, with
production capacity of 10 – 12 tons biocrude per 24 hours in Ukraine .................................. 59
Enclosure 5. List of keywords used for literature search......................................................... 60
Enclosure 6. Historical and forecasted prices of fossil fuels .................................................... 61
Enclosure 7. Uncertainty distributions .................................................................................... 62
Enclosure 8. ABF production and application area for BioDieselDnepr technology ............... 64
Enclosure 9. BioDieselDnerp photobioreactors ....................................................................... 65
Enclosure 10. Other cultivating systems .................................................................................. 66
Enclosure 11. Investment and establishing costs .................................................................... 67
Enclosure 12. Fixed and variable costs .................................................................................... 68
Enclosure 13. Administrative regulatory costs ........................................................................ 69
Enclosure 14. Investment appraisal and P&L. ......................................................................... 70
Enclosure 15. Fossil gasoline price structure ........................................................................... 72

56
Enclosure 1. Diagram: Biofuels technology outline.
Sources: Alabi et al. (2009); Sjors van Iersel et al. (2009); Mata et al. (2010); Cherubini, et al., (2009); Brennan, L., Owende, P., (2010).
Algae spece selection
(depending on desired product)
3000 discovered species
(enclosure 3)
cultivation system
(enclosure 10)
opened
closed
offshore
Biomass harvesting
(dewatering, thickening,
filtering)
centrifugation
sedimentation
filtration
micro- and ultra-filtration
or in combination with flocculation-
flotation
settling pond
microsraining
Drying of biomass
drum -drying
spray-drying
freez-drying
sun-drying
or in combination with dewatering
methods
Cell distruction
for oil or other
metabolites of interest
ultrasounds
autoclave
bead mills
cell homogenizers
freezing
with organic solvents
osmotic shock
acid
base
enzyme reaction
lyophilization
microvawe
Oil refinery to biofuels or
other products
transesterification(multiple step reaction)
hydrocracking
HTU
Gasification
fermentation
Digestion
Burning
Purification
starch fermentation
Biopyrolysis(Fischer-Tropsch, other )
KDV

57
Enclosure 2. BioDieselDnepr generic technology outline.
Source: (BioDieselDnepr, 1, 2, 2010)
Algae spece selection
Botryococcus braunii or Chlorella
(enclosure 3)
cultivation
closed
system (Continuous stirred-tank
photobioreactor )
(enclosure 9)
Biomass harvesting
(dewatering until 7 -10 %)
hydrocycloneseparation
Drying of biomass
NONE
No oil extraction,
but biocrude preparation
algal biomass homogenization with catalyst in
cavitator
Biocatalytic cracking and
refining
suspension received to
cracking unit converts into
syntheses biocrude, which
is distilled in rectification column on gasoline,
kerosene, diesel and masout

58
Enclosure 3. Lipid content and productivities of different microalgae
species, and comparison with other biodiesel feedstock.
Source: Mata et al., 2010
Source: Mata et al., 2010
Botryococcus braunii. Source: www, Rudekinc, 1, 2010; www, Lifesciences, 1, 2010;

59
Enclosure 4. Accounts from demo plant in Ukraine. Production capacity
per 24h is 10 – 12 tons of biocrude. Staff employed: Chemist – 1, biologist – 1, operators – 4, facility manager – 1, secretary – 1. Capital investments:
Production equipment (БиоМ – 1™, БКК™, other facilities): 4.872.000 UAH
Other establishing costs (tank park, interior construction works and installment electrical
equipment, laboratory equipment, СО2*: 500.000 UAH Electricity*: 250kW/h*24*10*0,78 = 46.800 UAH TOTAL: 5.418.800 UAH *CO2 is purchased for start up, electricity purchased during first 10 days for 0,78 UAH per kW/h.
Monthly production capacity in terms of biomass: 11 tons х 30 = 330 tons Monthly product outcome is 70% of 11 t biomass (less 2% waste): 748 kg х 11t х 30 = 246,84 tons of synthetic fuels from algae and eichhornia Revenue:
Product slate (70%) derived from 1,1 t of biocrude (biomass with density 0,96g/cm3 at 20 Co) consists of the following distillates (in average reached):
Revenue, UAH
Sales price earnings
Diesel 70% 539 kg 5 2695 Gasoline 10% 87 kg 6 522 Kerosene 15% 89 kg 3 267 Masout 3% 33 kg 1,5 49,5 Wastage and fertilisers 2% - 24 kg TOTAL: 748 kg 3533,5 UAH
Production costs:
unit Per ton of biomass Price UAH per 1kg Cost
H2O t 2,5 8,44 / m3 21,1 CO2 t 1,4 1,24
KNO3 (potassium-nitrate) kg 0,56 9,48 4,74
Ca3(PO4)2
(calciumphosphat)
kg 0,333 3,6 1,2
MgSO4 (magnesium
sulfate)
kg 0,25 3,6 0,9
FeSO4 (ferrous sulphate) kg 0,066 0,76 0,05
C6H8O7 (citric acid) kg 0,5 9,80 4,9 TOTAL: 32,9 UAH
Salaries 18 000 /330 = 54,55 UAH Transportation cost 5 000/330 = 15,15 UAH
Depreciation of investments 5.418. 800х40/100/12/330 = 547,35 UAH
Overhead expenses 4.000/330 = 12,12 UAH Marketing 2000/330 = 6,06 UAH Other costs 10.000/330 = 30,30 UAH Taxes 3533,5х30х0,9% = 954,04 UAH TOTAL: 1620 UAH Production profitability calculation: Income from product slate sold (748kg) 3533,5 – (1620 х 1,1) = 1751,5 UAH Income from 1 ton of fuels sold 1751,5 / 748 х 1000 = 2341,6 UAH Monthly income 2341,6 х 246,84 = 577995 UAH Payback period 5.418. 800/577995 = 9,3 months Profitability 2341,6 /(1620 х 1,1) *100 = 131,4 %
Source: translated from BioDieselDnerp Ltd., 1, 2010.

60
Enclosure 5. List of keywords used for literature search Algae fuel* economic efficiency*
Algae biofuel* economic feasibility*
synthetic fuel economic viability*
algae biodiesel* economic assessment*
algae diesel* investment option*
Microalgae* profit maximization*
real option analysis*
financial appraisal*
efficiency*
product slate
In Swedish
Alger bränsle* ekonomisk effektivitet*
Alger biobränsle* ekonomisk genomförbarhet*
syntetiskt bränsle* ekonomisk vialability*
Alger biodiesel* ekonomisk bedömning*
alger diesel* investeringsalternativ*
Mikroalger* vinstmaximering*
drivmedel* lönar analys*
GROSSHANDELSPRIS finansiella bedömningar*
RME* Kostnaden för optimal*
Flygfotogen effektivitet*
Flygbränsle
flyfotogen skattesatser drivmedel
drivmedel skater Alternativa drivmedel
Beskattningen av drivmedel från förnybara energikällor
koldioxidneutrala drivmedel
algbränsle
In Danish
Alger brændsel * økonomisk effektivitet *
Alger biobrændstof * økonomiske gennemførlighed *
syntetisk brændstof økonomiske vialability *
alger biodiesel * økonomisk vurdering *
alger brændsel * investering option *
alger diesel * gevinstmaksimeringspolitik *
Mikroalgen * reelt valg analyse *
Biobrændstoffer* finansiel vurdering *
cost optimazation *
effektivitet *
or investeringer under usikkerhed* or reel mulighed analysis*
or investering under osäkerhet * or verkliga analysis alternativ*

61
Enclosure 6. Historical and forecasted prices of fossil fuels
Source: authors’ calculation on Risk Optimiser software (2010)
Historical data of Benzine and Diesel prices, excl. VAT, last updated on 2010-03-16 (www, SPI, 1, 2010)
Historical data of Kerosine, excl. VAT (Dagens Industri, 2010; pers.com. Svenska Statoil AB, 2010)
Forecasted prices, Öre per liter, derived on 10.04.2010
Holt-Winter's Multiplicatiive
Double Exponential Smoothing
Year Orig. BenP Frcst BenP Frcst BenP Org. DisP Frsct DisP Frsct DisP Org. KerP Frcst KerP Frcst KerP
1970 92 67
1971 102 92 77 67
1972 102 101 101 74 74 75
1973 107 103 103 82 75 75
1974 137 107 108 55 81 81
1975 141 135 135 50 62 62
1976 159 145 145 59 53 52
1977 163 162 162 60 57 56
1978 185 169 169 66 59 58
1979 218 190 190 98 64 64
1980 294 223 223 148 90 90
1981 352 298 297 184 137 137
1982 394 367 364 233 179 179
1983 417 417 414 252 231 230
1984 424 446 444 285 261 259
1985 467 455 453 305 296 293
1986 417 493 491 230 321 318
1987 420 453 452 257 269 266
1988 448 444 443 267 272 270
1989 479 464 463 322 279 278
1990 526 494 494 382 323 322
1991 543 541 540 413 383 381
1992 532 565 564 394 424 422
1993 642 558 557 482 421 419 Org. KerP
1994 626 652 651 565 486 484 159
1995 634 656 655 544 570 568 154 159
1996 690 661 661 524 578 576 181 156 156
1997 689 709 708 532 563 561 184 172 172
1998 675 717 716 504 562 560 134 181 181
1999 699 704 703 533 539 536 180 152 152
2000 791 719 719 675 551 549 334 169 169
2001 786 802 801 696 663 662 312 280 280
2002 774 814 813 673 714 712 325 312 312
2003 781 803 803 636 710 708 301 334 334
2004 828 804 804 693 678 676 386 326 326
2005 915 844 843 838 710 708 557 378 378
2006 948 928 927 886 829 829 632 512 512
2007 956 974 973 870 902 902 622 619 619
2008 1032 988 988 1050 911 910 867 656 656
2009 997 1055 1055 918 1049 1048 559 831 831
2010 1110 1036 1036 1015 989 987 642 699 699
2011 1128 1128 1041 1040 693 693
2012 1162 1162 1075 1072 720 720
2013 1196 1196 1109 1105 748 748
2014 1231 1230 1142 1138 776 776
2015 1265 1264 1176 1171 803 803
2016 1299 1299 1210 1203 831 831
2017 1333 1333 1243 1236 858 858
2018 1367 1367 1277 1269 886 886
2019 1402 1401 1311 1302 914 914
2020 1436 1435 1345 1334 941 941

62
Enclosure 7. Uncertainty distributions

63
Source: authors’ calculations on @Risk software (2010)

64
Enclosure 8. ABF production and application area for BioDieselDnepr
technology
Source: BioDieselDnepr Ltd, 1, 2 (2010); pers. com. Chernov (2010)
DH or CHP
plants, cement
producer, other
CO2 donors
CO2
BioGas
MicroAlgae photobiore
actors (H2O)
Algae
biomass +
Catalyst
O2
Biocatalytic
cracking,
refining
Bio-crude
CO2
Gasoline
Diesel
Jet fuel
Masut
Pond with Eichhornia (fish farm, effluent
facility)
Methane digester (manure, biomass, etc), or to gasification block
Water remediation
Eichhornia biomass
Electricity
surplus
Fertiliser, bedding
Tre –, Cogeneration on biogas, diesel
CO2
CO2
CO2
Cheap heat, cooling, electricity
Area of application and optional sources
of CO2, heat and electricity
BioDieselDnepr Technology

65
Enclosure 9. BioDieselDnerp photobioreactors
Source: BioDieselDnepr Ltd, 1, 2 (2010); Chernov (2010)

66
Enclosure 10. Other cultivating systems
Traditional bag system (Neltner, 2008)
Tubular photobioreactor inside greenhouse (Berg-Nilsen, 2006)
Tubular photobioreactor outside system (Fredin, 2009)
Open race ponds and lakes (Moheimani, 2005)

67
Enclosure 11. Investment and establishing costs Investment costs for production of 10-12 t of biomass per day
Equipment 5,539,147 Real estate, building 2000m2 + land 1000m2 4,500,000
Intrusion alarm 250,000 CCTV Surveillance system 180,000
Fire Alarm System 325,000 Laboratory equipment 280,000
IT and office facilities 255,000 Capacitive tank park: Q P per unit
Benzin, 10 m3 1 60,000 60,000 Diesel, 50 m3 1 150,000 150,000
Jet fuel, 10 m3 1 60,000 60,000 TOTAL, SEK: 11,599,147
Establishing and start up operational costs 1st year
Research and Market analysis: Marketing 120000
Extraordinary costs (meetings) 17000 Counselling, municipal approvals and inspection:
Legal expertises 85000 IT experts 53000
Administrative regulatory costs (www, Regelkostnader, 1, 2010) 2190311 Extraordinary costs (tech. advising) 23000
Start up operational costs: Q P per unit CO2 for start up, tonn 15.4 1,524 23,470
Electricity for start up, kWt 60000 0.86 51,600 TOTAL, SEK: 2,563,381
Source: Assembled by authors based on research observations from Swedish market, 2010.

68
Enclosure 12. Fixed and variable costs
Source: Authors’ calculations, 2010
Source: Authors’ calculations, 2010
Variable Costs (VC) for production of 11 ton biomass per 24h
Assumption: total chemicals annual increase by 1,5%
Rate per 1 ton
biomass, kg
Price
(SEK/kg)
Value,
SEK 1 year 2 year 3 year 4 year 5 year 6 year 7 year 8 year 9 year 10 year
Production cost of 1 ton biomass:
Nitrogen fertilizer 0.5 11.85 5.925 11,732 23,463 23,463 23,463 23,463 23,463 23,463 23,463 23,463 23,463
Phosphoric fertilizer 0.333 9.4 3.1302 6,198 12,396 12,396 12,396 12,396 12,396 12,396 12,396 12,396 12,396
MgSO4 0.25 4.95 1.2375 2,450 4,901 4,901 4,901 4,901 4,901 4,901 4,901 4,901 4,901
FeSO4 0.066 10 0.6600 1,307 2,614 2,614 2,614 2,614 2,614 2,614 2,614 2,614 2,614
Citric acid 0.5 9.8 4.9 9,702 19,404 19,404 19,404 19,404 19,404 19,404 19,404 19,404 19,404
Total chemicals: 31,388 62,777 63,718 64,674 65,644 66,629 67,628 68,643 69,672 70,717
t m3
Water,t 2.5 6.9 17.25 380 759 759 759 759 759 759 759 759 759
Extraordinary costs 75,000 40,000 30,000 30,000 30,000 30,000 30,000 30,000 30,000 30,000
Fuels, litters kr/l
Transportation costs 8672.51 0.74 1,155,178 2,310,357 2,310,357 2,310,357 2,310,357 2,310,357 2,310,357 2,310,357 2,310,357 2,310,357
1,261,946 2,413,892 2,404,834 2,405,790 2,406,760 2,407,745 2,408,744 2,409,758 2,410,788 2,411,833TOTAL VC, SEK
Fixed Cost
Annual salary increase, real: 2%
1 year 2 year 3 year 4 year 5 year 6 year 7 year 8 year 9 year 10 year
Facility manager 180000 384000 391680 399513.6 407504 415654 423967 432446 441095 449917
Secretary 132000 216000 220320 224726 229221 233805 238481 243251 248116 253078
Operator (3 employees) 324000 828000 844560 861451 878680 896254 914179 932462 951112 970134
Biologist 147000 342000 348840 355817 362933 370192 377596 385148 392850 400708
Chemist 171000 348000 354960 362059 369300 376686 384220 391905 399743 407737
Laboratory costs (reagents,other) 10578 20764 20764 20764 20764 20764 20764 20764 20764 20764
Internet and phone communication 23400 28800 28800 28800 28800 28800 28800 28800 28800 28800
Marekting 0 55000 55000 55000 55000 55000 55000 55000 55000 55000
w eb page hosting and maintance, domain 3000 3000 3000 3000 3000 3000 3000 3000 3000 3000
Maintance of equipment 47861 95721 95721 95721 95721 95721 95721 95721 95721 95721
Maintance of building 22500 45000 45000 45000 45000 45000 45000 45000 45000 45000
Insurance of facilties and estates 253172 124098 94334 86445 83395 81437 79744 78135 76570 75037
Security monitoring 11100 22200 22200 22200 22200 22200 22200 22200 22200 22200
Accounters/Auditors 12000 20000 20000 20000 20000 20000 20000 20000 20000 20000
Overheads 80000 100000 80000 80000 80000 80000 80000 80000 80000 80000
TOTAL, SEK 1,417,611 2,632,583 2,625,179 2,660,497 2,701,519 2,744,513 2,788,672 2,833,832 2,879,971 2,927,097

69
Enclosure 13. Administrative regulatory costs
Table. Example of administrative regulatory costs in diffrent businesses of Sweden (Näringslivets Regelnämnd, 2008)
Source: Näringslivets Regelnämnd, 2008
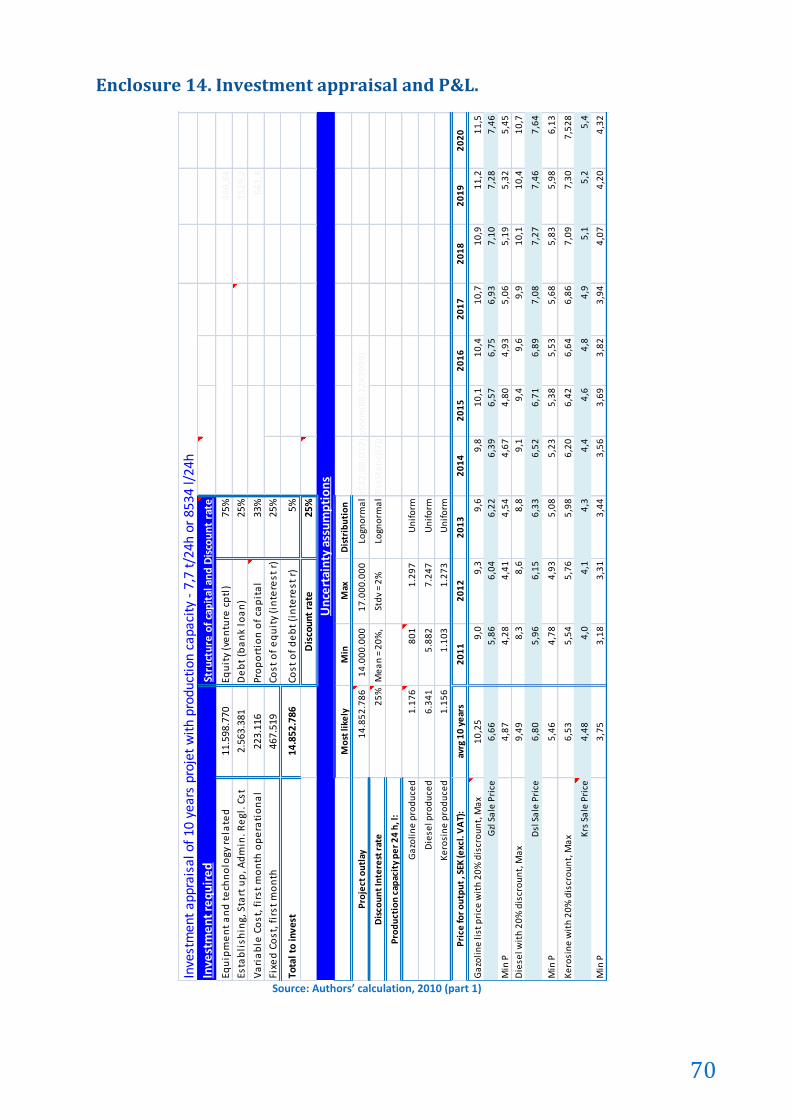
70
Enclosure 14. Investment appraisal and P&L.
Source: Authors’ calculation, 2010 (part 1)
Inve
stm
en
t re
qu
ire
d D
isco
un
t ra
te
Equ
ipm
en
t a
nd
te
chn
olo
gy r
ela
ted
11.5
98.7
7075
%A
vera
ge W
eigh
ed C
ost
of
Ca
pit
al
0,2
48
0,8
4
Esta
bli
shin
g, S
tart
up
, Ad
min
. Re
gl. C
st2.
563.
381
25%
Op
po
rtu
nit
y C
ost
0,0
43
52
9,2
Va
ria
ble
Co
st, f
irst
mo
nth
op
era
tio
na
l22
3.11
633
%D
isco
un
t ra
te0
,29
66
1,8
Fixe
d C
ost
, fir
st m
on
th46
7.51
925
%
Tota
l to
inve
st14
.852
.786
5% 25%
20%
Mo
st li
kely
Min
Max
Dis
trib
uti
on
Pro
ject
ou
tlay
14
.85
2.7
86
1
4.0
00
.00
0
17
.00
0.0
00
Logn
orm
al
=Ris
kTri
an
g(C
12
;B8
;D1
2)
=Ris
kLo
gno
rm(B
8;1
24
99
99
)
Dis
cou
nt
Inte
rest
rat
e2
5%
Me
an
= 2
0%
, St
dv
= 2
%Lo
gno
rma
l=R
iskL
ogn
orm
(0,2
8;0
,02
;Ris
kSta
tic(
I7))
Pro
du
ctio
n c
apac
ity
pe
r 2
4 h
, l:
Ga
zoli
ne
pro
du
ced
1.1
76
80
1
1.2
97
U
nif
orm
Die
sel p
rod
uce
d6
.34
1
5
.88
2
7
.24
7
Un
ifo
rm
Ke
rosi
ne
pro
du
ced
1.1
56
1.1
03
1.2
73
U
nif
orm
Pri
ce fo
r o
utp
ut
, SEK
(exc
l. V
AT)
:av
rg 1
0 y
ear
s2
01
12
01
22
01
32
01
42
01
52
01
62
01
72
01
82
01
92
02
0
Ga
zoli
ne
list
pri
ce w
ith
20
% d
iscr
ou
nt,
Ma
x1
0,2
59
,09
,39
,69
,81
0,1
10
,41
0,7
10
,91
1,2
11
,5
Gzl
Sa
le P
rice
6,6
65
,86
6,0
46
,22
6,3
96
,57
6,7
56
,93
7,1
07
,28
7,4
6
Min
P4
,87
4,2
84
,41
4,5
44
,67
4,8
04
,93
5,0
65
,19
5,3
25
,45
Die
sel w
ith
20
% d
iscr
ou
nt,
Ma
x9
,49
8,3
8,6
8,8
9,1
9,4
9,6
9,9
10
,11
0,4
10
,7
Dsl
Sa
le P
rice
6,8
05
,96
6,1
56
,33
6,5
26
,71
6,8
97
,08
7,2
77
,46
7,6
4
Min
P5
,46
4,7
84
,93
5,0
85
,23
5,3
85
,53
5,6
85
,83
5,9
86
,13
Ke
rosi
ne
wit
h 2
0%
dis
cro
un
t, M
ax
6,5
35
,54
5,7
65
,98
6,2
06
,42
6,6
46
,86
7,0
97
,30
7,5
28
Krs
Sa
le P
rice
4,4
84
,04
,14
,34
,44
,64
,84
,95
,15
,25
,4
Min
P3
,75
3,1
83
,31
3,4
43
,56
3,6
93
,82
3,9
44
,07
4,2
04
,32
Inve
stm
ent
appr
aisa
l of
10 y
ears
pro
jet
wit
h pr
oduc
tion
cap
acit
y -
7,7
t/24
h or
853
4 l/
24h
Equ
ity
(ve
ntu
re c
ptl
)
De
bt
(ba
nk
loa
n)
Stru
ctu
re o
f ca
pit
al a
nd
Dis
cou
nt
rate
Pro
po
rtio
n o
f ca
pit
al
Cost
of
eq
uit
y (i
nte
rest
r)
Cost
of
de
bt
(in
tere
st r
)
Dis
coun
t ra
te
Un
cert
ain
ty a
ssu
mp
tio
ns

71
Source: Authors’ calculation, 2010 (part 2)
hal
f 20
11
20
12
20
13
20
14
20
15
20
16
20
17
20
18
20
19
20
20
Ne
t tu
rno
ver
fro
m p
rod
uct
s so
ld1
01
03
77
62
02
07
55
32
02
07
55
32
02
07
55
32
02
07
55
32
02
07
55
32
02
07
55
32
02
07
55
32
02
07
55
32
02
07
55
3
12
61
94
62
41
38
92
24
04
83
42
40
57
90
24
06
76
02
40
77
45
24
08
74
42
40
97
58
24
10
78
82
41
18
33
Gro
ss m
argi
n8
84
18
30
17
79
36
60
17
80
27
19
17
80
17
63
17
80
07
93
17
79
98
08
17
79
88
09
17
79
77
94
17
79
67
65
17
79
57
20
14
17
61
12
63
25
83
26
25
17
92
66
04
97
27
01
51
92
74
45
13
27
88
67
22
83
38
32
28
79
97
12
92
70
97
25
63
38
16
43
86
08
68
16
34
97
07
50
51
73
09
63
47
53
35
81
77
60
99
97
98
73
52
82
07
89
58
43
42
76
Op
era
tin
g m
argi
n (E
BIT
DA
)4
86
08
39
87
22
47
08
36
11
91
80
66
21
57
78
96
40
75
21
71
47
24
91
37
69
76
61
06
70
88
99
64
34
34
7
43
32
47
51
02
15
44
29
17
72
12
98
81
92
95
18
35
39
80
20
77
82
37
76
59
27
50
42
Pro
fit
be
fore
inte
rest
52
83
64
77
00
92
68
06
94
20
79
36
33
37
69
66
89
74
38
17
47
16
89
30
68
98
37
36
63
23
07
63
59
30
5
Less
inte
rest
on
Ve
ntu
re fu
nd
0
,25
-28
12
74
6-2
81
27
46
Less
Inte
rest
on
ba
nk
loa
n0
,05
-18
75
16
-18
75
16
Ca
sh c
red
it in
tere
st c
ost
s +/
- in
com
e+
0,0
01
25
/ -
0,0
21
14
25
15
57
31
62
11
37
77
15
93
73
81
29
11
03
77
41
25
59
91
47
49
71
69
46
8
Pro
fit
afte
r in
tere
st-2
46
04
74
47
16
23
68
08
56
30
79
74
10
47
75
60
62
75
19
46
57
27
27
05
70
23
97
16
77
98
04
65
28
77
2
Less
ta
x 0
,28
01
32
05
46
22
63
97
62
23
27
49
21
71
69
72
10
54
50
20
36
35
71
96
67
12
18
98
34
51
82
80
56
Pro
fit
afte
r ta
x-2
.46
0.4
74
3.3
95
.69
05
.82
1.6
54
5.7
41
.35
55
.58
4.3
65
5.4
14
.01
55
.23
6.3
47
5.0
57
.25
94
.88
1.4
59
4.7
00
.71
6
Ra
tio
na
l Eco
no
mic
life
01
23
45
67
89
10
Init
ial I
nve
stm
en
t a
gain
st E
BIT
DA
-14
.85
2.7
86
48
60
83
98
72
24
70
83
61
19
18
06
62
15
77
89
64
07
52
17
14
72
49
13
76
97
66
10
67
08
89
96
43
43
47
Scra
b V
alu
e (b
uil
din
g)3
.67
6.8
28
Dis
cou
nti
ng
rate
, fa
cto
r25
%0
,80
00
,64
00
,51
20
,41
00
,32
80
,26
20
,21
00
,16
80
,13
40
,10
7
DC
F-1
48
52
78
63
.88
8.6
71
5.5
82
.38
14
.28
0.9
30
3.3
03
.92
12
.55
2.5
09
1.9
71
.77
21
.52
0.2
54
1.1
70
.48
19
00
.45
31
.08
5.6
79
NP
V11.404.266
38
88
67
15
58
23
81
42
80
93
03
30
39
21
25
52
50
91
97
17
72
15
20
25
41
17
04
81
90
04
53
10
85
67
9
IRR
47%
-5%
20
%3
2%
39
%4
2%
44
%4
5%
46
%4
7%
Acc
um
ula
tin
g D
isco
un
ted
Cas
h fl
ow
-14
85
27
86
-10
96
41
15
-53
81
73
4-1
10
08
04
22
03
11
84
75
56
27
67
27
39
98
24
76
53
94
18
13
41
03
18
58
71
1.4
04
.26
6
Pay
bac
k p
eri
od
, ye
ars
3,1
NP
V, I
RR
, PB
P, A
AP
, Pay
ou
t ra
te, e
tc..
Pro
fit
& L
oss
acc
ou
nt
con
vert
ed
fo
r an
alys
is p
urp
ose
(SEK
)
Less
Est
ab
lish
. an
d A
dm
. Re
gul.
co
sts
(ww
w, r
ege
lko
stn
ad
er,
1, 2
01
0)
Less
Fix
ed
Co
st
Less
Va
ria
ble
Co
sts
Less
de
pre
cia
tio
ns

72
Enclosure 15. Fossil gasoline price structure
Source: www, SPI, 3, 2010