Embed Size (px)
Citation preview
The Pennsylvania State University
The Graduate School
Department of Food Science
INFLUENCE OF PROCESSING PARAMETERS ON EYE SIZE AND
ELASTICITY OF TEF-BASED INJERA
A Thesis in
Food Science
by
Wendy Darling Attuquayefio
©2014 Wendy Darling Attuquayefio
Submitted in Partial Fulfillment
of the Requirements
for the Degree of
Master of Science
December 2014
The thesis of Wendy Darling Attuquayefio was reviewed and approved* by the
following:
Gregory R. Ziegler
Professor of Food Science
Thesis Advisor
*Signatures are on file in the Graduate School
Ramaswamy C. Anantheswaran
Professor of Food Science
John N. Coupland
Professor of Food Science
Robert F. Roberts
Professor of Food Science
Head of the Department of Food Science

iii
ABSTRACT
Injera is a fermented and naturally-leavened flatbread indigenous to Ethiopia. It
constitutes 70% of the diet of Ethiopians and is preferably made from the grain of
Eragrostis tef. Elasticity and eye (pore) formation are important quality attributes of
injera. The pliability of injera allows it to be used as a utensil to pick up wot (stew eaten
with injera). The honey-comb like eyes help in the grasping of wot which soaks into the
pores on the surface of injera. This study focused on determining the effects of
fermentation time and viscosity on the elasticity and eye formation of injera and also
understanding the mechanism by which eyes form. Viscosity and fermentation time were
found to have a significant effect on elasticity and eye formation of injera. It was
observed that injera baked from tef batters with low or high apparent viscosities had
fewer eyes on their surfaces and hence an optimum range of apparent viscosity for baking
injera with many evenly distributed eyes was determined to be approximately 1.1 to 1.4
Pa.s. Carbon dioxide was also shown to significantly influence the formation of eyes on
the surface of injera. The higher the amount of CO2 or gas bubbles in the fermented
batter, the higher the number of eyes formed on the injera. Also, addition of sodium
metabisulphite (a reducing agent) to tef batters significantly affected both elasticity and
eye formation of injera. This suggested that disulfide bonds between proteins may
contribute to elasticity and may have an influence on eye formation.

iv
TABLE OF CONTENTS
List of Figures ............................................................................................................. vii
List of Tables ............................................................................................................... ix
Acknowledgements ...................................................................................................... x
CHAPTER 1 ............................................................................................................................ 1
INTRODUCTION ................................................................................................................... 1
1.1 Statement of the problem ........................................................................................... 1 1.2 Rationale and Significance ......................................................................................... 2 1.3 Hypotheses ................................................................................................................. 2 1.4 Objectives ................................................................................................................... 3
CHAPTER 2 ............................................................................................................................ 4
LITERATURE REVIEW ........................................................................................................ 4
2.1 The tef grain and its properties ................................................................................... 4 2.1.1 Nutritional quality of tef and injera ................................................................ 5
2.2 Characteristics of injera ............................................................................................. 7 2.2.1 Preparation of injera ........................................................................................ 8 2.2.2 Eye formation on injera .................................................................................. 10 2.2.2.1 Characteristics of eyes on injera .................................................................. 10 2.2.2.2 Effect of processing on eye formation ......................................................... 11 2.2.2.3 Measurement of ‘eyes’ on injera .................................................................. 13 2.2.3 Elasticity of injera ........................................................................................... 14
2.3 Structural components of tef and fermented tef flour ................................................ 16 2.3.1 Proteins ............................................................................................................ 17 2.3.2 Starch ............................................................................................................... 20 2.3.3 Hemicelluloses ................................................................................................ 23 2.3.4 Exopolysaccharides ......................................................................................... 23
2.4 The effect of other components in fermented tef on injera quality ............................ 24 2.4.1 Fermentable sugars .......................................................................................... 24 2.4.2 Polyphenols ..................................................................................................... 26 2.4.3 Moisture .......................................................................................................... 27
2.5 Tef fermentation and the contribution of ‘absit’ to injera quality ............................. 28 2.6 Viscosity of tef batter ................................................................................................. 30 2.7 Impact of pH and temperature on injera quality ........................................................ 32 2.8 Summary .................................................................................................................... 34
CHAPTER 3 ............................................................................................................................ 35
MATERIALS AND METHODS ............................................................................................. 35
v
3.1. Materials.................................................................................................................... 35 3.2. Fermentation of tef flour ........................................................................................... 35 3.3 Baking of injera ......................................................................................................... 36 3.4 pH ............................................................................................................................... 38 3.5 Titratable acidity ........................................................................................................ 39 3.6 Moisture content ........................................................................................................ 39 3.7 Glucose concentration ................................................................................................ 39 3.7 Total phenolic content ................................................................................................ 40 3.8 Flow behavior ............................................................................................................ 40 3.9 Modulus of elasticity .................................................................................................. 41 3.10 Eye size and distribution using image analysis ........................................................ 42
3.10.1 Image analysis of injera ................................................................................ 42 3.10.2 Number, mean equivalent diameter, % total area and distribution of eyes
on injera ........................................................................................................... 43 3.10.3 Effect of reducing agent, sodium metabisulphite, on elasticity and eye
formation .......................................................................................................... 44 3.11 Statistical analyses ................................................................................................... 45
CHAPTER 4 ............................................................................................................................ 46
RESULTS AND DISCUSSION .............................................................................................. 46
4.1 Analysis of commercial injera products .................................................................... 46 4.2 Effect of fermentation time on physical and chemical properties of tef batter and
injera ........................................................................................................................ 50 4.2.1 pH and titratable acidity .................................................................................. 50 4.2.2 Apparent viscosity ........................................................................................... 52 4.2.3 Glucose content ............................................................................................... 53 4.2.4 Total phenolic content ..................................................................................... 54 4.2.5 Moisture content of injera ............................................................................... 55 4.2.6 Elastic modulus of injera ................................................................................ 55 4.2.6 Eye formation of injera ................................................................................... 56 4.2.6.1 Number of ‘eyes’ on the injera surface ........................................................ 56 4.2.6.2 Mean equivalent diameter of eyes on surface of injera ................................ 57 4.2.6.3 Percent (%) total area of eyes on surface of injera ....................................... 58
4.3 Effect of viscosity on eye formation and elasticity of injera ..................................... 59 4.3.1 Flow behavior of tef batter .............................................................................. 59 4.3.2 Eye formation on the surface of injera ............................................................ 62 4.3.3 Elastic modulus of injera ................................................................................ 66
4.4 Influence of carbon dioxide on eye formation of injera ............................................ 68 4.5 Influence of a reducing agent, sodium metabisulfite (SMBS) on elasticity or
storage modulus of injera ......................................................................................... 71 4.5.1 Rheological behavior of tef batter ................................................................... 71 4.5.2 Determination of modulus of elasticity ........................................................... 73 4.5.3 Determination of the effect of SMBS on eye formation of injera .................. 74
CHAPTER 5 ............................................................................................................................ 76
CONCLUSIONS AND RECOMMENDATIONS .................................................................. 76

vi
5.1 Conclusions ................................................................................................................ 76 5.2 Recommendations ....................................................................................................... 77
REFERENCES ........................................................................................................................ 78
APPENDIX A: Glucose Standard Curve ................................................................................. 88
APPENDIX B: Gallic Acid Standard Curve............................................................................ 89
APPENDIX C- Effect of temperature and time (at 20°C) on storage and loss modulus of
tef batter with and without SMBS .................................................................................... 90
vii
LIST OF FIGURES
Figure 2.1. Injera (source: http://mosob.com/menu/guide).................................................8
Figure 2.2. Injera preparation flow diagram……………………………………………..10
Figure 2.3. Examplesof injera on the market……………………………………………11
Figure 2.4. Model for the mechanism of eye formation………………………................13
Figure 3.1. Heritage griddle with thermocouple connected below the griddle
controller....................................................................................................................37
Figure 3.2. Injera baking set-up consisting of a hotplate/stirrer, temperature controller
and an aluminum plate with thermocouple connected to the center of the
plate…………………………………………………………………………………38
Figure 3.3. Stress vs. strain of injera .........................................................................…...42
Figure 3.4. Steps used in image analysis...........................................................................43
Figure 4.1. Wub, Kare, Gebeta and Mena injeras.............................................................47
Figure 4.2: Eye size distribution of commercial brands of injera……………………….48
Figure 4.3. Effect of fermentation time of pH and titratable acidity of tef batters……....51
Figure 4.4. Effect of fermentation time on apparent viscosity of tef batters…………….52
Figure 4.5. Effect of fermentation time on glucose content of tef batter samples.............53
Figure 4.6. Effect of apparent viscosity on the number of eyes on the surface of
injera………………………………………………………………………………..63
Figure 4.7. Columnar structures (tunnels) in cross-sectional view of injera……………...64
Figure 4.8. Effect of apparent viscosity on the mean equivalent diameter of eyes on the
surface of
injera………………………………………………………………………………..65
Figure 4.9. Effect of apparent viscosity on % total area of eyes on the surface of
injera………………………………………………………………………………..66
Figure 4.10. Effect of apparent viscosity on elastic modulus of eyes on the surface of
injera..................................................................................................................................67

viii
Figure 4.11. Effect of apparent viscosity on the thickness of injera…………………….68
Figure 4.12. Effect of temperature and time (at 20°C) on storage and loss modulus of tef
batter without SMBS…………………………………………………………………….72
Figure 4.13. Effect of temperature and time (at 20°C) on storage and loss modulus of tef
batter with SMBS ……………………………………………………………………….73

ix
LIST OF TABLES
Table 4.1. Comparing number, mean equivalent diameter and % total area of eyes on the
surface of different brands of injera..................................................................................48
Table 4.2. Comparing pH and moisture content of different brands of injera..................49
Table 4.3. Effect of fermentation time on moisture content of injera………...................55
Table 4.4. Effect of fermentation time on elastic modulus of injera................................56
Table 4.5. Effect of fermentation time on number of eyes on the surface of injera…….57
Table 4.6. Effect of fermentation time on mean equivalent diameter of eyes on the surface
of injera……………………………………………………………………………..57
Table 4.7. Effect of fermentation time on % total area of eyes on the surface of injera. 58
Table 4.8. Apparent, viscosity, yield stress, consistency coefficient and flow index of tef
batter samples………………………………………………………….....................60
Table 4.9. The effect of degassing, not degassing and not degassing with addition of
baking powder of batters on the number, mean equivalent diameter and % total area
of eyes on the surface of injera..................................................................................69
Table 4.10. Effect of SMBS on the thickness and elastic modulus of injera……………..74
Table 4.11. Effect of SMBS on number, mean equivalent diameter and % total area of
eyes on the surface of injera……………………………………………………….75

x
ACKNOWLEDGEMENTS
My appreciation first of all goes to the ALMIGHTY GOD for bringing me this
far. I never thought I could make it but me being here today is proof that with Him, all
things are possible.
I am also deeply indebted to my advisor Dr. Gregory Ziegler who worked with
me every step of the way from beginning to finish. I am very grateful for his support,
insight, experience and guidance. I also thank my thesis committee members, Drs.
Ramaswamy Anantheswaran and John Coupland, for their useful and very important
contributions to my research.
I thank the College of Agricultural Sciences and the Department of Food Science
for the award of graduate research assistantship that helped make this degree worthwhile.
I am also grateful to Ato Sisay Shimelis who helped with bringing new starter from
Ethiopia for my fermentation studies. I am thankful to Dr. Lingyan Kong and my other
lab mates, Sabina Deweber, Dr. Toral Zaveri and Jacqueline Krampfl who in one way or
the other helped me with my experiments.
Lastly, I thank my family back home for their support and my best friend and
husband, Emmanuel Atta-Obeng for his encouragement, love and support. I am very
grateful to everyone that has helped in making this a success.

1
CHAPTER 1
INTRODUCTION
1.1 Statement of the problem
Injera is a traditional Ethiopian sourdough flatbread that constitutes 70% of the
diet of Ethiopians (Ekris and Gamboa, 2008). Injera is usually made with flour from the
tef grain (Eragrostis tef [Zucc.] Trotter), but can also be made from other grains such
wheat, sorghum, and maize. The elastic texture and pores (referred to as ‘eyes’) formed
on the surface of injera are important quality attributes. According to Yetneberk et al.
(2004), a good injera is soft, fluffy and able to be rolled without cracking. Injera is
elastic despite the absence of gluten. The pliable texture and honeycomb nature of the
surface of injera enables it to be used as a utensil in picking up ‘wot’ (stew made with
either vegetables and/or meat). As gluten in wheat makes wheat products spongy and
elastic, the functional property of proteins in tef is of interest. Apart from proteins, other
structural components such as starch, hemicelluloses in tef flour and bacterial
exopolysaccharides in fermented tef batter may also contribute to this elastic quality.
In order to commercialize the production of injera in Ethiopia, it is important to
produce good quality injera that will be acceptable to the Ethiopian consumer. According
to Yetneberk (2004), tef is preferred to sorghum for producing the best quality injera.
The reason tef is the preferred cereal for making injera has not been scientifically

2
explored in detail. There is also limited scientific knowledge on the characteristics of the
protein, starch, hemicellulose and bacterial exopolyssacharide fractions of tef or
fermented tef batter. The focus of this study is to determine the influence of injera
processing parameters such as viscosity of tef batter and fermentation time on the
elasticity and eye formation of injera, and to understand the molecular mechanisms
underlying these characteristic qualities. The tef grain is gluten-free and has the potential
of replacing wheat in gluten-containing products such as bread. The use of tef in the
production of injera may stimulate research in the development of quality gluten-free
bread based on tef flour.
1.2 Rationale and Significance
Elasticity and eye formation are important characteristics that determine the
quality of injera. To produce good quality injera, a standardized method of injera
production will have to be put into place, and to do so requires knowledge of the effect of
processing parameters on the quality of injera. This knowledge may also lead to
improvements in the quality of gluten-free breads by incorporating tef flour in gluten-free
formulations.
1.3 Hypotheses
The hypotheses tested were:
1. Fermentation time has a significant effect on the quality of injera.

3
2. Viscosity of the batter has a significant effect on eye formation and elasticity of
injera and is influenced by the addition of water during absit making.
3. Eyes are formed from CO2 produced during fermentation.
4. Protein contributes to injera structure through formation of disulfide bonds.
1.4 Objectives
1. To develop a scaled-down injera preparation protocol that accurately represents
traditional injera baking,
2. To quantify the eye size and distribution of different brands of injera already on
the U.S. market,
3. To measure chemical changes and viscosity of batter during a 72 h fermentation,
and eye formation and elasticity of injera baked from that batter,
4. To alter the ratio of fermented batter-to-water during absit preparation in the
range1:2 - 1:7 and determine the effect on viscosity of batter, eye formation and
elasticity of injera baked from it,
5. To de-gas batter and determine the effect of dissolved gases (i.e. carbon dioxide)
on eye formation,
6. To determine the effect of sodium metabisulfite on elasticity and eye formation of
injera.

4
CHAPTER 2
LITERATURE REVIEW
2.1 The tef grain and its properties
The grain ‘tef’ (Eragrostis tef [Zucc.] Trotter) is cultivated as a major cereal in
Ethiopia and is a staple food for the majority of Ethiopians (Bultosa et al., 2002). In a
country of over 80 million people, tef accounts for about 15% of all calories consumed in
Ethiopia (Fufa et al., 2011). According to Assefa et al. (2011) the crop has both its origin
and diversity in Ethiopia, and plays a vital role in the country’s overall food security. Tef
is a resilient crop that can withstand varying environmental and cultural conditions,
including reasonable tolerance to both drought and waterlogging (Assefa et al., 2011).
The color of the tef grains can be ivory, light tan to deep brown or dark reddish brown
purple, depending on the variety (Ekris and Gamboa, 2008). The composition of tef is
similar to that of millet, although it contains generally higher amounts of the essential
amino acids, including lysine, the most limiting amino acid (Jansen et al. 1962).
According to Ekris and Gamboa (2008), the potential of this grain as an interesting raw
material for new food product development is due principally to its protein composition ̶
it is gluten free and has a high quality amino acid composition.

5
2.1.1 Nutritional quality of tef and injera
The principal use of tef is in the production of injera. The main components of tef
are protein, ash, fat, fiber, moisture and carbohydrates. Prolamins are the major proteins
found in the tef grain. Adebowale et al. (2011) compared tef prolamins to sorghum
prolamins and concluded that tef prolamins are more hydrophilic, less polymerized and
have lower thermal stability. They further stated that these differences probably make tef
prolamins more functional in bread making. Jansen et al. (1962) indicated that tef has an
excellent balance among the essential amino acids that makes it somewhat comparable to
that of egg, except for its relatively low lysine content. Steinkraus (1996) observed that
during the injera fermentation process, the nutritional value of protein decreased
markedly. However, it is possible though unknown, that the overall effect of fermentation
is to improve bioavailability of nutrients.
The tef grain is also rich in iron, calcium, magnesium and phosphorous (Taylor
and Emmambux, 2008). According to Ekris and Gamboa (2008) tef has a high content of
minerals such as: iron, calcium, zinc and magnesium compared to wheat, barley and oats.
Forsido and Ramaswamy (2011) described tef as nutritious as major staple cereals like
wheat, rice, oats, barley, and even better in some aspects, containing more calcium, zinc,
iron and potassium. They also described tef as being high in dietary fiber. The properties
of tef and injera have been reviewed by Yetneberk et al. (2004) and Gebremariam et al.
(2012).
In the preparation of injera, tef flour undergoes fermentation by lactic acid
bacteria and yeast. In a review by Ashenafi (2006), Pediococcus cerevisieae,

6
Lactobacillus brevis, Lactobacillus plantarum and Lactobacillus fermentum were found
to be the dominant microorganisms in fermenting tef batter. Other studies have isolated
L. plantarum, L. fermentum, and L. brevis (Gashe, 1985) from injera. Fermentation
serves as a means of preserving food. According to Mehta et al. (2012), fermentation
alters food shape, texture, and flavor, increases its nutritional value, and promotes safety.
Blandino et al. (2003) stated that, in general, natural fermentation of cereals leads to a
decrease in the level of carbohydrates as well as some non-digestible poly- and
oligosaccharides. Also, certain amino acids may be synthesized and the availability of B
group vitamins may be improved. Ramachandran and Bolodia (1984) evaluated the effect
of fermentation on the bioavailability of iron, zinc, and phosphorous by dialysis of tef
batter and reported increases in dialyzable portions of iron from 9 to 24%, phosphorous
from 16 to 60%, and zinc from 2 to 43%. These findings suggest that fermentation plays
a key role in reducing the phytic acid concentration of tef and in increasing the
bioavailability of minerals (Umeta et al., 2005). Although it has been suggested that tef
contains tannins which are considered an anti-nutritional factor, Bultosa and Taylor
(2004) found that the testa of neither white nor brown varieties contained tannin.
In addition to its nutritional qualities, the tef grain is gluten-free. The demand for
gluten-free foods is growing as more people are diagnosed with celiac disease and other
types of gluten sensitivity (Bultosa and Taylor, 2004; Spaenij-Dekking et al., 2005;
Hopman et al., 2008). Tef can be a valuable addition to a gluten-free diet of celiac
disease patients (Ekris and Gamboa, 2008).

7
2.2 Characteristics of injera
Injera is a fermented and naturally-leavened flatbread indigenous to Ethiopia, ~50
cm in diameter with a honeycomb-like texture, rather like a giant crumpet (Belton and
Taylor, 2004). It constitutes 70% of the diet of Ethiopians (Ekris and Gamboa, 2008) and
is preferrably made from the tef grain which is indigenous to Ethiopia. Other grains such
as sorghum, millet, maize, wheat and mixtures thereof have also been used in making
injera. Sorghum is the second most preferred flour for injera preparation in Ethiopia,
however, tef injera is the most preferred because it can be stored for 3 days without
losing its pliability (Steinkraus, 1996) . Pliability is related to the ability of injera to roll
without tearing or cracking and this is a mark of a good quality injera. This pliability of
injera enables it to be used as a utensil to pick up wot (meat or vegetable sauce eaten with
injera). Quality characteristics of injera are directly related to its appearance, texture and
taste. According to Gebrekidan and GebreHiwot (1982), a normal and typical injera is
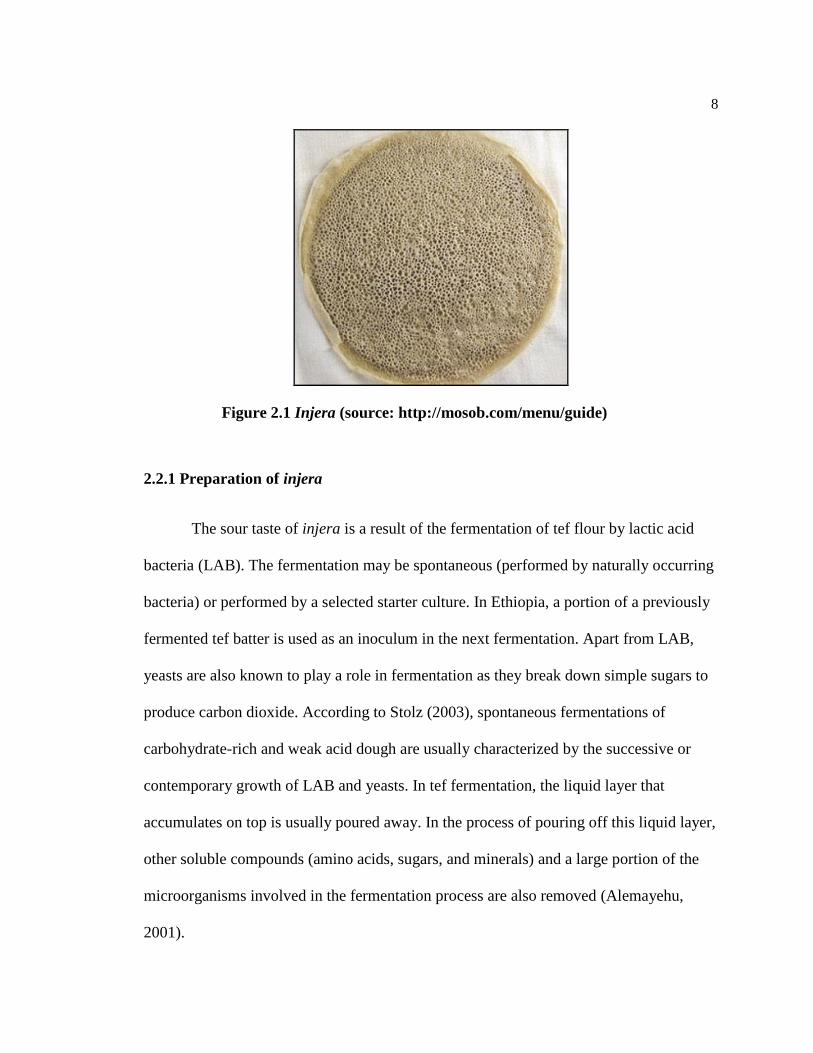
round, soft, spongy and resilient, about 6 mm thick and ~60 cm in diameter with
uniformly spaced honeycomb-like ‘‘eyes’’ on the top (Fig. 2.1). Injera is unique in that
despite the fact that it is not made from gluten-containing wheat, it is leavened.
8
Figure 2.1 Injera (source: http://mosob.com/menu/guide)
2.2.1 Preparation of injera
The sour taste of injera is a result of the fermentation of tef flour by lactic acid
bacteria (LAB). The fermentation may be spontaneous (performed by naturally occurring
bacteria) or performed by a selected starter culture. In Ethiopia, a portion of a previously
fermented tef batter is used as an inoculum in the next fermentation. Apart from LAB,
yeasts are also known to play a role in fermentation as they break down simple sugars to
produce carbon dioxide. According to Stolz (2003), spontaneous fermentations of
carbohydrate-rich and weak acid dough are usually characterized by the successive or
contemporary growth of LAB and yeasts. In tef fermentation, the liquid layer that
accumulates on top is usually poured away. In the process of pouring off this liquid layer,
other soluble compounds (amino acids, sugars, and minerals) and a large portion of the
microorganisms involved in the fermentation process are also removed (Alemayehu,
2001).
9
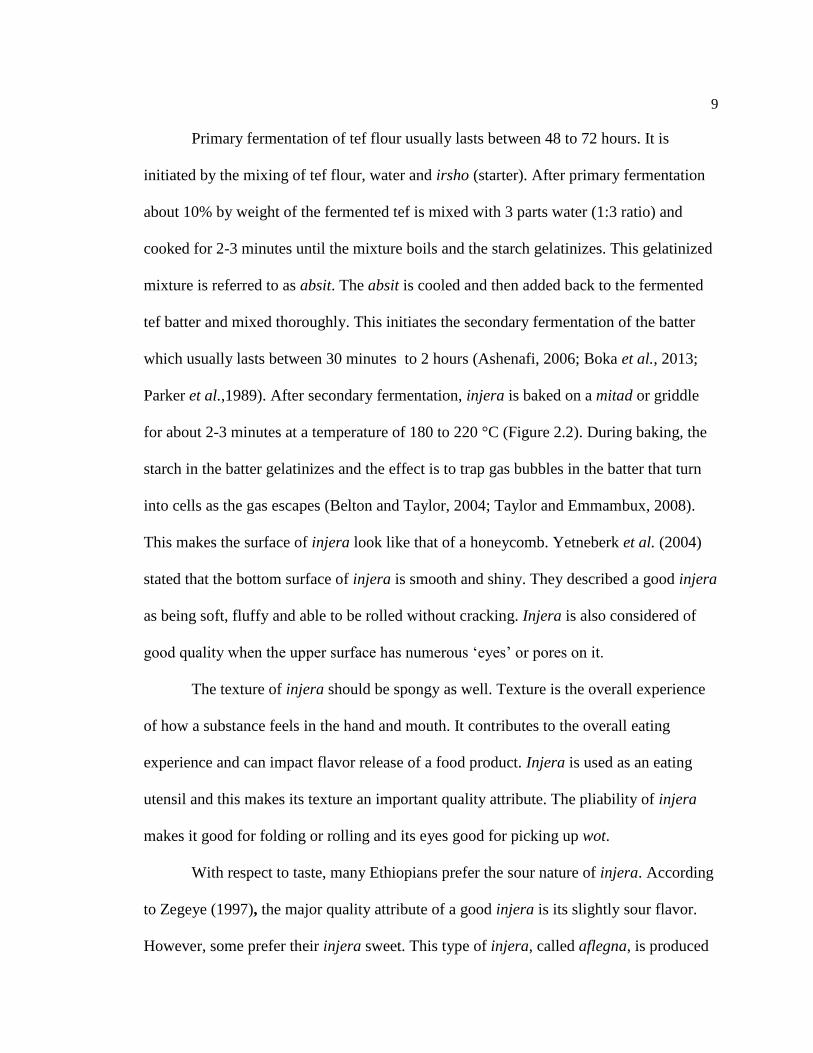
Primary fermentation of tef flour usually lasts between 48 to 72 hours. It is
initiated by the mixing of tef flour, water and irsho (starter). After primary fermentation
about 10% by weight of the fermented tef is mixed with 3 parts water (1:3 ratio) and
cooked for 2-3 minutes until the mixture boils and the starch gelatinizes. This gelatinized
mixture is referred to as absit. The absit is cooled and then added back to the fermented
tef batter and mixed thoroughly. This initiates the secondary fermentation of the batter
which usually lasts between 30 minutes to 2 hours (Ashenafi, 2006; Boka et al., 2013;
Parker et al.,1989). After secondary fermentation, injera is baked on a mitad or griddle
for about 2-3 minutes at a temperature of 180 to 220 °C (Figure 2.2). During baking, the
starch in the batter gelatinizes and the effect is to trap gas bubbles in the batter that turn
into cells as the gas escapes (Belton and Taylor, 2004; Taylor and Emmambux, 2008).
This makes the surface of injera look like that of a honeycomb. Yetneberk et al. (2004)
stated that the bottom surface of injera is smooth and shiny. They described a good injera
as being soft, fluffy and able to be rolled without cracking. Injera is also considered of
good quality when the upper surface has numerous ‘eyes’ or pores on it.
The texture of injera should be spongy as well. Texture is the overall experience
of how a substance feels in the hand and mouth. It contributes to the overall eating
experience and can impact flavor release of a food product. Injera is used as an eating
utensil and this makes its texture an important quality attribute. The pliability of injera
makes it good for folding or rolling and its eyes good for picking up wot.
With respect to taste, many Ethiopians prefer the sour nature of injera. According
to Zegeye (1997), the major quality attribute of a good injera is its slightly sour flavor.
However, some prefer their injera sweet. This type of injera, called aflegna, is produced
10
when the injera batter does not ferment for the recommended three days. Komtata injera,
is very sour-tasting. While some have preference for it, normally this kind of injera is
made by unskilled women, usually newly-weds, who have not learned the proper timing
(Stewart and Getachew, 1962).
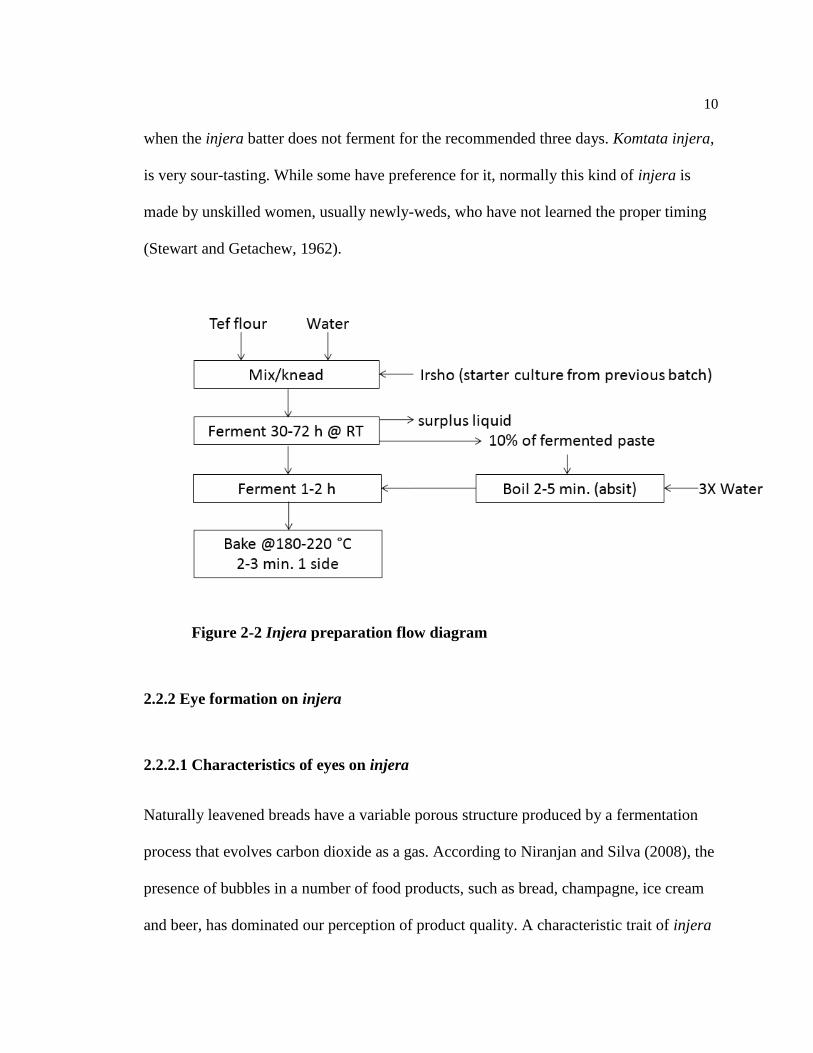
Figure 2-2 Injera preparation flow diagram
2.2.2 Eye formation on injera
2.2.2.1 Characteristics of eyes on injera
Naturally leavened breads have a variable porous structure produced by a fermentation
process that evolves carbon dioxide as a gas. According to Niranjan and Silva (2008), the
presence of bubbles in a number of food products, such as bread, champagne, ice cream
and beer, has dominated our perception of product quality. A characteristic trait of injera
11
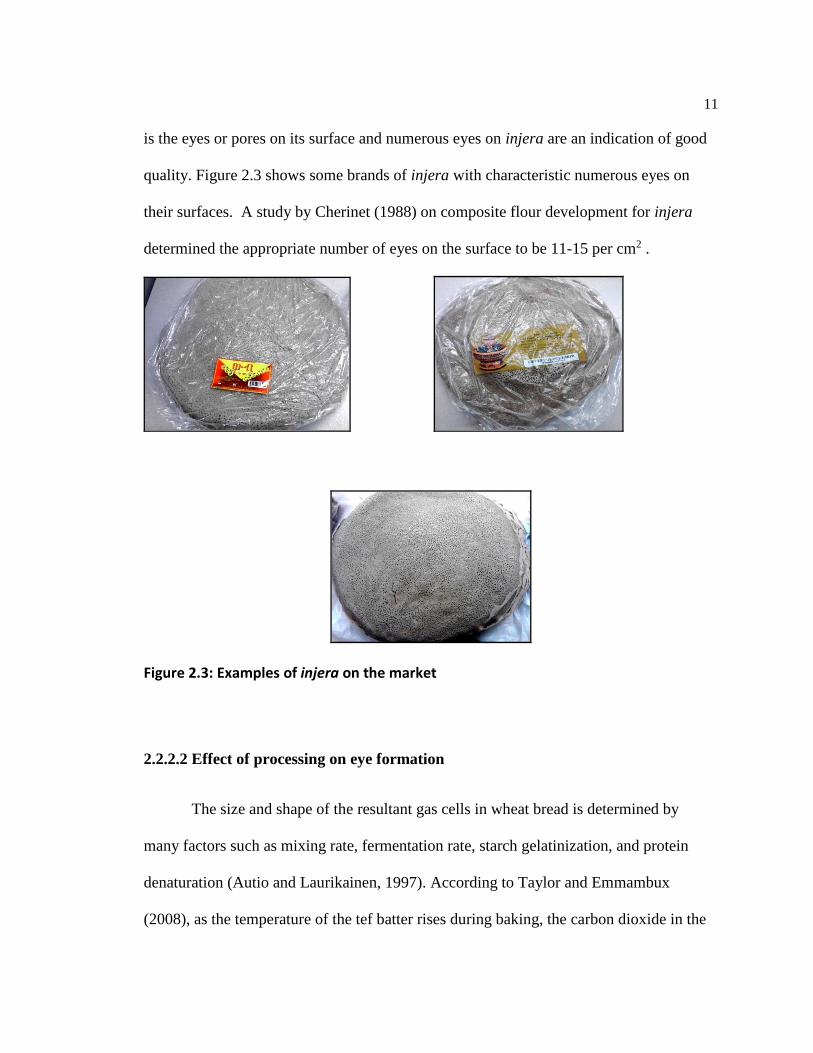
is the eyes or pores on its surface and numerous eyes on injera are an indication of good
quality. Figure 2.3 shows some brands of injera with characteristic numerous eyes on
their surfaces. A study by Cherinet (1988) on composite flour development for injera
determined the appropriate number of eyes on the surface to be 11-15 per cm2 .
Figure 2.3: Examples of injera on the market
2.2.2.2 Effect of processing on eye formation
The size and shape of the resultant gas cells in wheat bread is determined by
many factors such as mixing rate, fermentation rate, starch gelatinization, and protein
denaturation (Autio and Laurikainen, 1997). According to Taylor and Emmambux
(2008), as the temperature of the tef batter rises during baking, the carbon dioxide in the
12
batter comes out of solution. At the same time, the starch in the batter gelatinizes
increasing the viscosity of the batter. This creates gas bubbles in the batter that turn into
cells as the gas escapes and the batter sets. Niranjan and Silva (2008) stated that in
crumpet production, the batter expands due to the formation of CO2 during fermentation;
the larger bubbles then escape leaving behind a population of small nuclei. The authors
further stated that the water in the batter evaporates into the nuclei during hot plate
baking at 200–230°C to form a series of vertical cones. Hence, the rise of bubbles during
baking is due to the gravity acting on bubbles of lower density than the tef batter. This
phenomenon has been described by Stokes’ law, which relates the rise velocity of
particles or bubbles in a liquid to the density difference between the bubble and the liquid
phase, the diameter of the bubble, and the viscosity of the liquid phase. The viscosity of
tef batter may have a significant role to play in the formation of ‘eyes’ on the surface of
injera during baking. Figure 2.4 shows the proposed mechanism by which eyes are
formed on the surface of injera. Viscosity may not only affect eye formation on injera
but may also contribute to its elastic texture. According to Niranjan and Silva (2008),
even though a continuous phase may be purely viscous, bubble incorporation tends to
make the dispersion viscoelastic. Pyle (2005) stated that dissolved carbon dioxide
released from batter during heating contributed to pore development and overall
expansion of the baked crumpet, and that the main role of the fermentation process is in
the production of carbon dioxide. This was the conclusion drawn from an experiment that
compared vacuum degassed batter to batter that was not degassed. From this experiment,
Pyle (2005) observed that pore formation was absent in the degassed white wheat flour
batter when baked on a hot plate. The baked product from the degassed batter was also

13
similar to the baked product obtained from a batter which did not have any yeast or
leavening agents. In this study, it is hypothesized that carbon dioxide produced during tef
fermentation significantly affects eye formation on the surface of injera.
Figure 2.4: Model for the mechanism of eye formation
2.2.2.3 Measurement of ‘eyes’ on injera
In a study conducted by Cherinet (1993), a 3 x 3 cm frame was used to count the
eyes of injera at four randomly selected sites. They found the number of eyes to be in a
range of 11-15 eyes/cm2. However, according to Gebrekidan and GebreHiwot (1982),
about 4 eyes are contained per cm2 of surface. There is no standard on how many eyes
KEY:
a) Bubble trapped in tef batter during baking
b) Bubble erupts or escapes at surface to form
‘eyes’

14
should be on the surface of an injera, but according to Cherinet (1993), eyes should
neither be too few nor too numerous, they must be rather deep, interlocked with thin
cross-walls between them and evenly distributed.
Stanley and Baker (2002) stated that the characteristic honeycomb structure of
bread can be studied using the micro-structural imaging capabilities of an ordinary
flatbed scanner. Computer measurements can also provide accurate numerical values
provided that good measurement algorithms are used, which is not always the case. There
is still debate about which of the many size measurements to use in any particular
situation (Russ, 2005). The area covered by a feature can be determined by counting the
number of pixels, and applying the appropriate calibration factor to convert to square
centimeters (Russ, 2005). Hence, the size of each eye on the surface of injera can be
measured using a scanner and imaging software. The equivalent diameter calculated from
the area of an eye on the surface of injera gives an indication of the size of the eye. The
average of all the equivalent diameters is determined and the mean equivalent diameter of
the eyes on the injera scanned is obtained. The percentage of the area covered by all the
eyes on the surface of the injera is obtained by dividing the total area of all the eyes by
the surface area of the injera scanned and multiplying by 100.
2.2.3 Elasticity of injera
Gluten-free breads lack the elasticity provided by gluten, the protein found in
wheat flour. According to Keiffer (2006), elasticity, which is closely connected to the
cohesive structures, seems to be nothing but an indicator of a persisting good continuous
15
gluten network. Even though injera lacks gluten, it has an elastic texture. It is therefore
not clear what is responsible for this property. There is lack of research on the mechanism
of injera elasticity and hence the importance of delving into this area.
‘Elasticity’ in bakery science is a sensory perception that is felt when the dough is
rapidly stretched, then released, and is “good” when the dough contracts rapidly to
approximately its original shape (Keiffer, 2006). Protein degradation during sourdough
fermentation in wheat flour affects the overall quality of sourdough bread by modifying
its viscoelastic properties. Structural components in tef such as hemicellulose, proteins
and starch (amylose and amylopectin) undergo changes during fermentation and these
changes affect the rheology of the final product. It is essential to determine how the
changes occurring during fermentation affect the texture of injera. Studies of proteolytic
events occurring during sourdough fermentation and their effects on gluten-free bread
quality are still limited.
There are different procedures used to measure the texture of food materials.
According to Dobraszczyk and Morgenstern (2003), the most common types of
fundamental rheological tests used in cereal testing are: (i) small deformation dynamic
shear oscillation; (ii) small and large deformation shear creep and stress relaxation; (iii)
large deformation extensional measurements; and (iv) flow viscometry. Dobraszczyk and
Morgenstern (2003) stated that the dynamic oscillation measurements are the most
popular and widely used fundamental rheological techniques for measuring cereal dough
and batters and that these tests measure rheological properties (such as elastic and viscous
moduli) by the application of sinusoidally oscillating stress or strain with time and
measuring the resulting response.
16
Dynamic mechanical analysis is used to determine the mechanical behavior of
food materials. Studies on the dynamic mechanical properties of injera are lacking. Most
studies using dynamic mechanical analyses have been conducted on wheat breads. In a
study conducted on bread by Wang and Sun (2002), it was observed that the bread crumb
behaved similarly to a soft rubberlike solid in the frequency sweep. They also observed
that typical viscoelastic behaviors of bread crumb involved a transition from rubberlike to
glasslike consistency with increasing frequency. According to (Duncan, 2007), it is
desirable to check whether a material is within its linear viscoelastic range before
commencing a series of measurements. He stated that this can be done by performing a
strain scan on the material over the range 0.01–5% (or the maximum possible strain) and
if a constant modulus is obtained, then it is within the linear range. If the modulus starts
to drop (or increase) at a certain level then this is the onset of non-linear behavior, and
unless there is a specific reason to study this effect, strains should be kept below this
level (Duncan, 2007).
2.3 Structural components of tef and fermented tef flour
Among the components of tef flour, proteins, starch (amylose and amylopectin),
and hemicelluloses could possibly contribute to the elastic texture of injera, as could
bacterial exopolysaccharides formed during fermentation. However, studies on
characteristics of these structural components and how they affect the textural quality of
injera are limited. The elasticity and pore or eye formation of injera are major quality
17
attributes, however it is not clear what component(s) of tef flour is (or are) responsible for
elasticity and the formation of eyes.
2.3.1 Proteins
Since tef flour does not contain gluten, its elasticity is not due to gluten. However,
proteins in tef may have a function similar to that of gluten in wheat flour. Gluten is the
primary structural component in wheat breads and provides structure and texture in other
wheat-based bakery products. Its alteration by protease degradation or its complete
absence often results in a viscous system or even a liquid bread batter rather than dough
(Rosell et al., 2002). The gluten proteins in wheat contain gliadin and glutenin subunits.
The fractions have functional significances as the glutenins are largely responsible for
gluten elasticity and gliadins for viscosity (Shewry et al., 1995). According to
Damodaran et al. (2008) and Dong and Hoseney (1995), the viscoelasticity of wheat
dough is related to the extent of sufhydryl-disulfide interchange reactions. This view is
supported by the fact that when reductants such as cysteine, or sulfhydryl-blocking
agents, such as N-ethylmaleimide, are added to the dough, viscoelasticity decreases
greatly (Damodaran et al., 2008). Interactions other than disulfide crosslinks, such as
hydrogen bonding and hydrophobic interactions may also play a vital role in
viscoelasticity of wheat dough. Belitz et al. (1986) stated that partial or total reduction of
intermolecular disulfide bonds lowers both molecular weight and elasticity of gluten.
Adebowale et al. (2011) observed in their study of tef proteins that polypeptide bonds in
prolamins are disulphide bonds and that a large proportion of the storage proteins in

18
cereals are bonded into large polymeric networks. Tef prolamins were however found to
be less cross-linked by disulfide bonds than sorghum prolamins. A study by Vallons et al.
(2011) showed that protein polymerization by thiol/disulfide-interchange reactions
occurred in white rice and tef batters using capillary gel electrophoresis but there was no
such cross-link mechanism in buckwheat proteins due to the absence of free sulfhydryl
groups. Even though Adebowale et al. (2011) showed that there is crosslinking of
disulfide bonds of prolamins in tef, it is still unknown to what extent this interaction may
be responsible for elasticity of injera. Other studies (Renzetti and Arendt, 2009; Moore et
al., 2006) have used enzymatic manipulation to crosslink proteins in gluten-free flours in
order to obtain similar textural characteristics of gluten-containing cereal flours.
Different strategies have been used in the absence of gluten in order to mimic its
viscoelastic properties. According to Gallagher (2009), rice flour which is also gluten-
free, is unable to form a dense gluten-like protein network when the rice flour is kneaded
with water. In a study on roti, an unleavened bread made from sorghum, the authors
stated that although sorghum grains do not contain gluten, when sorghum flour is mixed
with water and kneaded it produces a sticky dough. They further stated that good quality
dough should be sticky and easily rollable without breaking. Renzetti and Arendt (2009)
improved the breadmaking performance of gluten-free flours from corn and sorghum that
they attributed to protein polymerization, which can enhance elastic-like behavior of
batters. A study by Edema et al. (2013) on fonio and sorghum flours showed that
sourdough fermentation of these flours substantially changed the rheological behaviors of
their doughs under kneading conditions, making the dough properties more similar to
those of wheat flour and rice flour which were improved by addition of soy protein

19
isolates and hydroxypropylmethylcellulose (HPMC) in a study by Marco and Rosell
(2008). Traditionally in Ethiopia, tef dough is kneaded (Girma et al. 2013; Zegeye, 1997)
and this forms a dense sticky mass. It is however unknown whether this dense mass is as
a result of network formation by tef proteins.
The various proteolytic activities induced by fermentation hydrolyze cereal
proteins to produce free amino acids (Spicher and Nierle, 1988; Thiele et al., 2002).
Cereal flour, yeasts, and lactic acid bacteria contain proteases and peptidases that can
contribute in different ways to these proteolytic events. According to Renzetti and Arendt
(2009), lower molecular weight proteins resulting from hydrolysis by proteases affected
the resistance of brown rice flour batters during proofing, and increased batter elasticity
and paste stability. Higher proteolytic activities are encountered for brans and whole
grain flour compared to white flour (Loponen et al., 2004), and this is likely to have an
effect on injera prepared from tef flour since it contains bran. In a study conducted by
Salmenkallio-Marttila et al. (2001) on wheat bran, they found that the positive effect of
fermentation of bran on bread quality was evident when comparing the well-developed
protein network structure of the breads baked with fermented bran and the control bread
containing unfermented bran. Protein degradation in sourdough fermentation is among
the key phenomena that affect overall quality of sourdough breads according to Ganzle et
al. (2008). The functionality of the cross-linking enzymes such as transglutaminases and
tyrosinases in gluten-free breadmaking is also comparable to that in wheat breadmaking.
According to Renzetti and Arendt (2009), in the absence of other hydrocolloids, protein
structures are important to ensure the textural quality of gluten-free breads. It has
however not been proven that proteins contribute to the elastic texture in injera.

20
In a study on the proteins found in sorghum and millet, Belton and Taylor (2004)
stated that full analysis and sequencing of the main storage proteins is yet to be carried
out and very little work exists on their functional properties. The results from a study by
Schober et al. (2007) suggested that proteases mainly degrade proteins that are already
soluble at the beginning of fermentation, and degradation of those proteins soluble in the
dough liquid (supernatant after centrifugation) to smaller peptides may well explain why
they can no longer cross-link and therefore do not aggregate upon baking. According to
Schober et al. (2007) , it remains unclear whether and according to which
physicochemical mechanism protein degradation and bread quality are related in a
gluten-free system. Parker et al. (1989) observed that tef storage proteins played no part
in the structural integrity of cooked injera, although they may add to the texture. This
statement is however not clear as structural integrity of a material is related to its texture.
Parker et al. (1989) also found out that total protein levels decreased slightly during the
preparation of injera. It is therefore necessary to understand the contribution of proteins
to the quality of injera.
2.3.2 Starch
Starch is made up of amylose and amylopectin. The inherent molar masses and
fine structures of amylose (AM) and amylopectin (AP) are the primary determinants of
starch properties and functionalities (Bultosa et al., 2008). A study by Parker et al. (1989)
on injera showed that during cooking, the starch within the injera is totally gelatinized to
form a steam-leavened, spongy starch matrix, in which fragments of bran and embryo,
21
micro-organisms and organelles are embedded. Petrofsky and Hoseney (1995) indicated
that increased starch-gluten interaction increased the viscoelasticity of gluten dough.
Petrofsky and Hoseney (1995) further stated that starch had an active role in determining
dough rheological characteristics. The role of starch in the texture of injera is further
substantiated by Taylor and Emmambux (2008), who stated that good injera making
quality seems to be related to the starch found in tef and finger millet and that it is
probably of great significance that both of these cereals have compound, and not simple
type, starch granules. Hamada et al. (2013) also reported that the rheological properties of
rice batter facilitated adequate gas retention during yeast fermentation, which was caused
by protein-starch interaction that resulted from the partial degradation of storage proteins
surrounding the starch granules. Furthermore, Edwards et al. (2002) concluded that starch
measurably contributes to durum dough rheological properties and also that increased
proportions of smaller granules increased dough elastic character. Umeta and Faulks
(1988) stated that tef starch has a smaller granule size of 2-6 µm compared to sorghum
starch (approximately 20 µm) and according to Yetneberk et al. (2004), the relative
softness of tef injera compared to sorghum injera could be related to starch granule size.
They further stated that the cell wall and aleurone components of tef could affect the
texture of injera positively. It is proposed that tef starch forms networks which might
have a significant role to play in the elasticity of injera.
The pasting properties of tef starch have an effect on the texture of injera.
According to Ekris and Gamboa (2008), this property is important and helps to predict
the behavior of the flour in baking. Ekris and Gamboa (2008) compared the pasting
properties of tef and maize and observed that the breakdown viscosity of tef starch paste
22
was considerably lower than that of maize starch paste. The breakdown viscosity is the
decrease in viscosity of the paste as a result of the rupturing of starch granules at high
temperatures (Sciarini et al., 2008). This gives an indication of the shear-thinning
behavior of the pastes. Yetneberk et al. (2004) stated that the difference in pasting
properties of sorghum and tef flours could also be related to inherent morphological
differences in their starches. More syneresis is likely to be seen in a viscous fluid with a
high setback viscosity. The study on tef starch by Bultosa et al. (2002) reported a low
setback viscosity and slow syneresis. Yetneberk et al. (2004) hence stated that this
finding by Bultosa et al. (2002) is probably related to the softer texture of tef injera
compared with sorghum injera. According to Bultosa (2007), tef starch and its flour
pasting are shear tolerant and thus have a potential for use in foods processed under high
shear conditions.
The absit (pre-gelatinized starch) added to the tef batter after primary
fermentation is known to enhance the texture of injera. According to Taylor and
Emmambux (2008), the increased viscosity of the tef batter resulting from cooking the
absit seems to enable it to better hold the carbon dioxide produced during fermentation.
Zannini et al. (2012) stated in their paper that starch gelatinization could play an
important role in gluten-free formulation because of the ability of starch pastes to trap air
bubbles that aid the gas-holding capacity of batter. According to Abdel-Aal (2009),
modified starches such as partially cross-linked and pre-gelatinized starches could play
an important role in gluten-free bakery formulations due to their ability to form highly
viscous slurries and pastes. Native and modified starches are added to batter formulations
in order to soften crumb texture, improve batter consistency and control starch

23
gelatinization during baking (Abdel-Aal, 2009). The absit therefore plays an important
role in the formulation of good quality injera.
2.3.3 Hemicelluloses
Since the grains of tef are extremely small, less than 1.5 mm in length (Parker et
al., 1989), the whole tef grain is milled into flour. Hemicelluloses are found in the bran or
outer layer of grains. Hemicelluloses are generally classified according to the main sugar
residue in the backbone, e.g., xylans, mannans, and glucans, with xylans and mannans
being the most prevalent in plant tissues (Wyman et al., 2005). Izydorczyk et al. (2001)
stated that both beta-glucans and arabinoxylans may influence barley dough properties by
affecting water distribution in the dough and may form elastic networks and contribute to
overall elasticity and strength of the dough under conditions of restricted water
availability. However, a study by Hung et al. (2005) showed that dietary fibers in baked
products increase water absorption and decreased dough elasticity. According to Parker et
al. (1989), the thin bran layers and endosperm cell walls in tef probably account for the
lower levels of dietary fiber of less than 5% compared with 14% in wheat, however, these
components appear to be unaffected by fermentation.
2.3.4 Exopolysaccharides
Lactic acid bacteria are responsible for the sour taste in sourdough fermentations
like that of injera. Many lactic acid bacteria (LAB) can produce a wide variety of long-

24
chain sugar polymers called exopolysaccharides (EPS), which are varied in their
chemical composition, structure and physical properties (Moroni et al., 2011). According
to Arendt et al. (2007), polymers produced from lactobacilli may be expected to
beneficially affect a number of technological properties of bread, including water
absorption of the dough, dough machinability, increased loaf volume, and retarded bread
staling. These studies provide evidence that EPS produced by sourdough LAB have the
potential to improve dough rheology and bread texture, and show that EPS produced by
LAB may be used to replace or reduce more expensive hydrocolloids used to improve
bread texture.
In a study by Rühmkorf et al. (2012), they observed that the higher the sucrose
concentration in tef flour, the more EPS was produced. EPS production also correlated
strongly to cell counts at beginning of fermentation but not to highest cell counts reached
after 24 hour of fermentation (Rühmkorf et al., 2012). The application of EPS forming
starter cultures in sourdoughs is a promising approach to improve gluten-free breads,
since EPS is produced in situ and can act as a hydrocolloid and does not have to be
declared (Rühmkorf et al., 2012).
2.4 The effect of other components in fermented tef on injera quality
2.4.1 Fermentable sugars
The level of sugar in tef flour is known to decrease during fermentation as lactic acid
bacteria acts on it to produce lactate. Sugar has been shown to have an effect on injera

25
quality as most Ethiopians prefer the characteristic sour taste of injera. The aflegna injera
(baked at 24 hours) is sweet and is preferred by some Ethiopians, but is not as pliable as
fully fermented injera.
During fermentation, amylase breaks down starch into dextrins, which increases
levels of fermentable sugars in the wheat dough (Goesaert et al., 2006) and hence,
increases bread volume. Umeta and Faulks (1988) studied two varieties of tef and
observed that both varieties contained free sugars that were predominantly sucrose (95%)
with fructose being the principal free sugar in the fermenting batter and cooked product
Baye et al. (2013) showed glucose to be the main fermentable sugar in a tef-white
sorghum composite injera. Free sugars may also have an effect on the texture of injera as
Rühmkorf et al. (2012) showed in their study that the higher the sucrose concentration at
the beginning of fermentation, the higher the amount of exopolysaccharides produced.
The free sugars in fermented tef may also have an effect on the glass transition
temperature (Tg) of injera. Tg defines a transition from brittle, metastable amorphous
solid to a rubbery, unstable, amorphous liquid (Kaletunc and Breslauer, 1993). According
to Lasekan and Khalil (2010), amorphous sugar particles are highly hygroscopic and will
absorb water at higher humidity resulting in plasticization that lowers the Tg of the
particles significantly. There is limited study on the Tg of tef, however, a study by
Adebowale et al. (2011) reported that tef prolamin has a relatively low thermal stability
compared to kafirin and this may be related to the good bread making functionality of tef
flour. Lawton (1992) in a study on zein dough observed that it exhibited good
viscoelastic properties above its Tg. According to Welti-Chanes et al. (2008), a polymer
is brittle (a glassy solid state) below its Tg but above Tg, it is flexible and malleable. The
26
flexibility of injera is an important attribute as it relates to its elasticity. As mentioned in
previous paragraphs, the pliability of injera enables it to be used as a utensil to scoop up
wot. It is however unknown whether Tg of the prolamins, starches or sugars in tef have a
significant effect on the texture of injera.
2.4.2 Polyphenols
Antioxidant activity is a fundamental property important for life (Velioglu et al.,
1998). Polyphenols are known to have nutritional properties because of their antioxidant
characteristics. Phenolic compounds such as flavonoids, phenolic acids, and tannins are
considered to be major contributors to the antioxidant capacity of plants (Boka et al.,
2013). Tannins are known to cause bitterness in foods prepared from some cereals. A
comparison of white tef, brown tef and red tef by Boka et al. (2013) reported that red tef
contained the highest polyphenolic content while white tef contained the lowest.
In a study conducted by Yetneberk et al. (2005), tannins were observed to have an
inhibiting effect on fermentation. Due to this phenomenon they decorticated sorghum by
removing the bran, germ and testa (which contained tannins in some varieties of
sorghum) in order to improve the color, taste and appearance of the injera. A study by
Haslam (1974) observed that polyphenol-protein complex-formation which results in
precipitation is caused by cross-linking of separate protein molecules by the phenol.
McManus et al. (1981) also described a tendency of polyphenols to cross-link protein
molecules at higher protein concentrations in his study. He stated that where the protein
concentration is high the relatively hydrophobic surface layer is formed by complexation

27
of the polyphenol onto the protein and by cross-linking of different protein molecules by
the polyphenols. There has not been any research on tef, let alone gluten-free grains to
show whether this phenomenon occurs during fermentation or whether this contributes to
the elasticity in injera.
2.4.3 Moisture
In a study by Ashagrie and Abate (2012), the moisture content of their injera samples
ranged between 63 to 65%. Moisture in foods is known to have an effect on quality both
positively and negatively. Parker et al. (1989) likened cooking of injera to wafer
production and stated that for rapid gelatinization of starch and entrapment of gas
bubbles, the batter-like dough should have a high water content, that a steamy
atmosphere should be maintained throughout the cooking period, and that heat should be
efficiently transferred from the cooking surface.
The glass transition is strongly dependent on water content, which often causes
large differences in reported glass transition temperatures (Roos, 2010). Gelatinization of
starch is strongly affected by water content (Pyle, 2005). Pyle (2005) observed that the
structure of baked crumpets depended on a number of factors including water content of
the batter. The moisture content of injera will therefore have an effect on its texture.
28
2.5 Tef fermentation and the contribution of ‘absit’ to injera quality
The fermentation of injera begins with adding water to tef flour and mixing or
kneading it with a starter (back-slopped culture) called irsho. This process commences
the ‘primary fermentation’. According to Dobraszczyk and Morgenstern (2003), even
though it is obvious that mixing in the development of rheology and texture in wheat
dough is important, there is very little information in the literature on these changes
during the different stages in the mixing process. There is little information on mixing
and its effect on the texture of injera. In the traditional preparation of injera, the tef flour,
water and irsho are kneaded into a thick paste or dough (Zegeye, 1997; Girma et al.,
2013; Abraha et al., 2013; Ashagrie and Abate, 2012). Kneading in breadmaking is
known to aerate the dough and according to Maloney and Foy (2003), gas retention
depends on the development of the proper dough structure which requires adequate
dough mixing. According to Keiffer (2006), during kneading, the wheat dough will wind
up the hook when the kneading optimum approaches. He described this as the ‘so-called
Weissenberg effect’ and stated that it is a sign of elasticity. It is not known whether the
Weissenberg effect (rod-climbing phenomenon) occurs in gluten-free dough or whether
kneading enhances this phenomenon and hence has a significant effect on the quality of
the final baked injera.
Some studies conducted on injera reported varying amounts of tef flour to water
ratio in tef fermentation. The tef flour, water and irsho are usually mixed in different
proportions. The flour to water ratio varies in literature from 1:1 to 2:3. A flour: water
ratio of 1:1 was used by Abraha et al. (2013), 1:1.6 was used by Girma et al. (1989), 1:2

29
was used by Ashagrie and Abate (2012), Girma et al. (2013) and Abiyu et al., (2013),
while a ratio of 2:3 was used by Zegeye (1997) and (Parker et al., 1989).
According to Stewart and Getachew (1962), the time of fermentation depends on
the altitude of the area, the concentration of the irsho, and the container used. Stewart and
Getachew (1962) stated that the time for optimum fermentation, i.e. when gas production
ceases and the dough and liquid phase separate, varies depending on how the
fermentation is initiated, the numbers and type of organisms present in the irsho or flour,
ambient temperature, and the type and bacterial cleanliness of the container used.
After about 48 to 72 hours of primary fermentation, part of the fermented batter is
gelatinized by cooking to form the absit which is then added back to the fermented batter.
This step initiates the ‘secondary fermentation’. The role of the absit in injera making is
not clear. Zannini et al. (2012) stated that the functionality of absit in the injera flatbread
can be described as that of hydrocolloids in gluten-free breads, providing the batter with a
better gas-holding capacity because of increased viscosity. Ashenafi (2006) also reports
that the absit is a dough enhancer (improves the texture of the dough) and Girma et al.
(2013) also mentioned that the absit is a dough binder, but did not define these terms or
suggest a mechanism for the effect. It is believed that the main function of a dough
enhancer and dough binder is to enhance the viscosity of batters. Other possible functions
of the absit are that it activates yeasts responsible for CO2 production (Abiyu et al.,
2013) and the development of eyes during baking of injera. Ashenafi (2006) mentioned
that injera baked without absit or with less absit than required will have a lesser amount
of eyes on the upper surface. Also according to Stewart and Getachew (1962), injera
made from batter lacking absit has a powdery look and lacks the air spaces or the so-

30
called eyes of the injera which give it an “inviting look”. Yetneberk et al. (2004) stated
that the objective of gelatinization is primarily to bring about cohesiveness of the batter
and secondly to provide easily fermentable carbohydrate to leaven the injera. Yetneberk
(2004) reported that by cooking part of the fermented batter to gelatinize the starch, the
carbon dioxide produced by the fermentation is trapped and leavens the injera on baking.
Umeta and Parker (1996) stated that an objective of cooking part of the batter is to
increase the amount of gluey material between the batter particles to form more cohesive
starch matrix in the injera. It is still not known whether the absit has all these functions or
whether other processes during fermentation are responsible for eye formation and
elasticity of injera during baking. However, from all the different functions of the absit it
is very clear that it helps to improve the quality of injera.
From studies on injera, the amount of absit to use for secondary fermentation
varies. Ten percent (10%) (Ashenafi , 2006; Girma et al., 2013; Umeta and Faulks, 1988;
Zegeye, 1997) of the weight of the fermented batter is commonly used to make absit.
However other amounts such as 5%, 15% and 20% (Zannini et al., 2012) of the
fermented batter are sometimes used. There are no studies on injera elasticity or any
research to show whether absit contributes to this elasticity. Parker et al. (1989) stated in
their study that the major contributor to the injera matrix is gelatinised starch.
2.6 Viscosity of tef batter
The overall effect of batter viscosity on the quality of baked injera has not been studied.
Zannini et al. (2012) stated that the absit added back to the fermented batter increases the

31
viscosity of the batter and provides the batter with a better gas-holding capacity.
According to Shelke et al. (1992), the minimum viscosity maintained by a wheat flour
batter during heating is considered to be important because it reflects the ability of the
batter to retain gas bubbles and to resist settling of starch. A study conducted by Schober
et al. (2007) on sorghum flour, showed that during fermentation the sourdough becomes
thinner. They observed that the extrusion force between a fresh (2 h) and ripe (24 h)
sourdough differed significantly by 48% ( 4.6 N for fresh vs 2.4 N for ripe sourdough),
and described the drop in consistency of the batters as being due to degradation of
mechanically damaged starch by amylases from sorghum and the degradation of proteins.
Degradation of starch and proteins of tef flour occurs during fermentation. It is however
unknown whether a similar effect observed in the sorghum flour is likely to be seen in tef
flour as both cereals are gluten-free.
Hamada et al. (2013) related kneading of rice flour dough to the viscosity of
batter. They observed that if rice flour is kneaded with water, the dough has greater
fluidity than wheat dough and its viscosity resembles that of cake batter. According to
Admassu (2006), injera generally requires a batter mixture that is viscous enough (200-
1500 centipoise) to retain leavening gasses while cooking, but the batter must also be
thin enough so as to result in a finished injera which is one centimeter or less in
thickness. Gebrekidan and GebreHiwot (1982) in their study on sorghum injera reported
that normal injera should be thin, about 6 mm, the same thickness reported by Kamal-
Eldin and Chiwona-Karltun (2008). The viscosity range of 200-1500 cP appears to be a
wide range as tef batter used in preparing injera usually has a thin pancake-like
consistency. According to Sahi (1999), the increase in batter consistency, as observed by
32
increase in elastic and viscous moduli would be expected to slow down the migration of
air bubbles in the batter. Sahi (1999) further stated that this would slow down the rate of
disproportionation of the bubbles and improve batter stability.
Shear thinning behavior is observed with structured foods, where viscosity
decreases with applied shear (Cullen and Connelly, 2009). Tef batter is expected to
exhibit shear thinning or non-Newtonian behavior at increasing shear rates. A study by
Bhattacharya and Bhat (1997) on rice-blackgram suspensions used to make ‘dosa’, a
popular Indian dish similar to injera, showed that it exhibited shear-thinning behavior
and the Herschel-Bulkley model fit the shear rate and shear stress data of the suspensions
better than the power law model or the Casson model. The behavior of materials is
described by three Herschel–Bulkley parameters (Mullineux, 2008): the consistency
coefficient (k), flow behavior index (n) and yield stress (σo). This is represented by the
equation:
σ = σo + kγn
Considering the effect that the consistency of batters have on air bubble
migration, it is believed that determining the viscosity of tef batter before baking is very
crucial in ensuring that good quality injera is produced.
2.7 Impact of pH and temperature on injera quality
The pH, fermentation temperature and baking temperature of fermented tef batter may
also have an effect on the quality of injera. Cereal mashes with a pH of 5-6.2, which are
rich in fermentable carbohydrates, will be preferentially fermented by LAB, at least to a

33
pH below 4, and below this point, acid-tolerant yeasts dominate the fermentation (Stolz,
2003). Ashagrie and Abate (2012) determined the pH of injera to be 3.4. Rühmkorf et al.
(2012) analyzed pH and titratable acidity (TA) in fermented rice, buckwheat and quinoa
and stated that these parameters are an important control for contaminations. Also in their
study, Rühmkorf et al. (2012) observed that the higher the inoculated cell counts, the
faster the pH decreased and TA and lactate amounts increased.
Fermentation temperature has been found to impact the pH of spontaneous tef
fermentations and quality of injera. According to Valjakka et al. (2003), temperature
control is critical in sourdough production as changes in fermentation temperature may
cause variation in microflora of sourdough and thus variation in sourdough and final
bread quality and flavor. The optimum temperature range for yeasts is 20-30 °C. Most
lactic acid bacteria work best at temperatures of 18 to 22 °C but temperatures above 22
°C favor lactobacillus species (FAO, 1999). Ashagrie and Abate (2012) stated that
temperature in the highlands of Ethiopia is generally between 17 and 25 °C, hence, injera
made at these temperatures should still have the desirable quality characteristics.
During the baking process, heat is transferred from the hot pan to the surface of
the food material, while moisture is transferred from the interior to the surface of the
product and then evaporates. As a result, changes in temperature and moisture conditions
develop as cooking proceeds, and bring about the desirable characteristics (color, texture,
and flavor) of the food (Getenet, 2011). Pyle (2005) stated that a typical temperature
range for baking crumpets is 200-230°C, and observed that baking temperature increased
the elasticity of the crumpets. While most studies conducted on injera do not state the

34
temperature at which injera was baked, a study by Tsegay (2011) observed that the
baking of injera starts after the baking pan surface temperature reached 215 °C and
dropped to about 92 °C when the batter was poured onto the pan surface. They measured
the baking pan surface temperature in the experiment and registered a temperature of
about 215 °C on the pan surface in order to make it possible to bake ‘nice injera’.
According to Ashenafi (2006), the temperature in the middle of the injera during the
baking process would reach around 90 °C. Because baking temperature of injera varies in
the literature it will be necessary to obtain a standard temperature at which injera can be
baked in order to obtain proper eye formation and elastic texture of injera.
2.8 Summary
Physicochemical characteristics of tef and their effect on injera quality have not
been well documented. The objectives of this study are to determine the effect of
fermentation time and viscosity of tef batter on eye formation and elasticity of injera and,
furthermore, to understand the mechanism of eye formation and elasticity development.
The study of the effect of processing parameters on the quality of injera will help to
determine how the components of the tef flour affect eye formation and elasticity of
injera.

35
CHAPTER 3
MATERIALS AND METHODS
3.1. Materials
Ivory tef flour was purchased from The Teff Company (Nampa, ID). All reagents
were purchased from either VWR (Randor, PA) or Sigma Aldrich Chemical Company
(St Louis, MO) and were of analytical reagent grade. The irsho was obtained from
Ethiopia (NutrAfrica, Debre Zeit) and was maintained at 4°C by regular feeding with tef
flour and water.
3.2. Fermentation of tef flour
Tef flour was fermented by mixing with tap water in a ratio of 1:1.6 (w/w) and
20% of starter from a previous fermentation batch (irsho) by weight of tef flour was
added. The mixture was fermented for 72 hours at ambient temperature (22-25°C). After
72 hours of primary fermentation, the liquid that settled on the surface of the fermented
batter was decanted and its volume measured. Ten (10) % by weight of the fermented tef
was mixed with water at ratios from 1:2 to 1:7, but typically 1:3 (w/w). This mixture was
heated to boiling in an aluminum saucepan over a hotplate until thickened (usually about
5 minutes) to form the absit. After boiling, the absit was cooled to below 50°C, and then
mixed thoroughly with the rest of the batter to initiate secondary fermentation, which
usually lasted for 4 hours at ambient temperature. Secondary fermentation may last for

36
more than 4 hours. The end of secondary fermentation was determined by the appearance
of bubbles in the tef batter.
3.3 Baking of injera
Baking of the injera was done after about 4 hours of secondary fermentation.
Twenty (20) mL of the fermented tef batter was poured into 9 cm diameter tinplated steel
crumpet rings placed on a non-stick griddle (Heritage Model 735, Bethany Housewares,
Cresco, IA) set to 215°C. Baking was done for 2 minutes and 30 seconds. A lid was used
to cover the injera during baking after eyes started forming on the surface. This was to
allow steam to cook the upper surface of the injera and prevent it from drying out. The
baking temperature was between 200 and 230 °C.
The Heritage griddle with a thermocouple connected to it (Figure 3.1) was used to
bake injera in the experiment on the effect of fermentation time on elasticity and eye
formation of injera. Because there were large variations in surface temperature, a new
baking set up was subsequently built (Figure 3.2), comprising a 6 x 6 x 0.16 inch
aluminum plate placed on a hot plate/stirrer (7X7 CER Hot/Stir, VWR, Radnor, PA). A
thermocouple was inserted into a hole drilled in the plate at approximately the center in
order to control the temperature of the plate using a temperature controller (Extech
48VTR, Nashua, NH). To minimize sticking of the injera to the plate, an oven liner
(NORPRO, Everett, WA) was place on top of the plate before baking. The tinplated steel
crumpet rings were placed at the center of the plate and 20 mL tef batter was poured into
it. Baking of the injera samples was done for 2 minutes at a baking temperature of
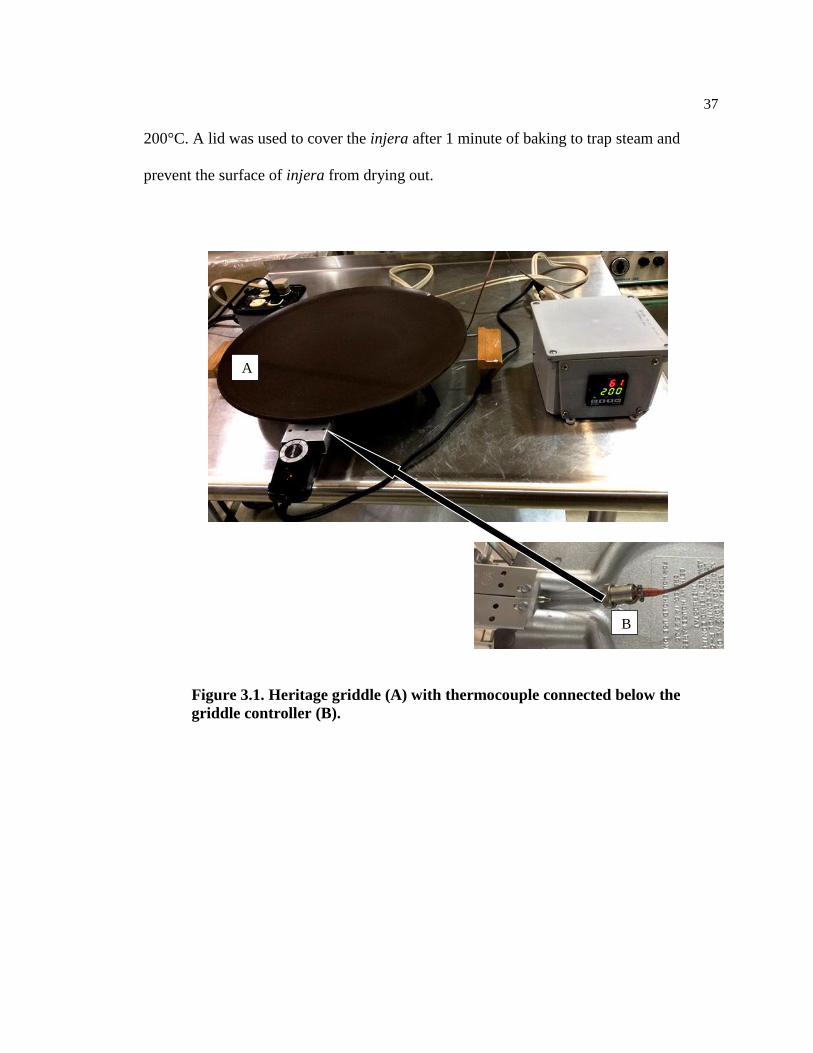
37
200°C. A lid was used to cover the injera after 1 minute of baking to trap steam and
prevent the surface of injera from drying out.
Figure 3.1. Heritage griddle (A) with thermocouple connected below the
griddle controller (B).
A
B

38
Figure 3.2 Injera baking setup consisting of a hotplate/stirrer, temperature
controller and an aluminum plate with a thermocouple connected to the center of
the plate.
3.4 pH
The pH of the fermented tef batter was determined directly using a glass electrode
attached to a pH meter (SevenEasy S220, Mettler-Toledo Inc., Columbus, OH). The
injera samples (10 g) were mixed with 100 mL of distilled water that was boiled and
cooled, and the pH of the supernatant was immediately measured after decanting into a
250 mL beaker (AOAC, 1995).

39
3.5 Titratable acidity
Ten (10) g of the tef batter was mixed with 100 mL of distilled water and titrated
with 0.1 N NaOH to an end point pH of 8.2 using an auto-titrator (Titroline Alpha Plus
TA 20, S.I. GmbH, Mainz, Germany). The volume of NaOH used for each titration was
recorded and titratable acidity was expressed as % lactic acid (AOAC, 1995)) using the
formula below:
3.6 Moisture content
The moisture content of the injera samples (1 g) were determined by drying for
10 minutes at a temperature of 115 °C using a moisture analyzer (model MB45, OHAUS
Corporation, Parsippany, NJ).
3.7 Glucose concentration
The glucose concentration of tef batter samples was determined using the Glucose
Oxidase test kit (Sigma-Aldrich Inc., Saint Louis, Missouri). One (1) mL of distilled
water was added to 0.1 g of sample and 1 mL of the assay reagent was added to the
sample at 37 °C. After 30 minutes, 1 mL 12 N H2SO4 was added to stop the reaction. The
absorbance of the sample was measured at 540 nm using a spectrophotometer (Thermo
40
Spectronic Helios alpha, Thermo Electron Corporation, Cambridge, United Kingdom)
and glucose content was obtained from the glucose standard curve (Appendix A).
3.7 Total phenolic content
Total phenolic content was assayed by the Folin–Ciocalteu colorimetric method
adapted from Boka et al. (2013) with slight modification. Aliquots (0.5 mL) of
appropriately diluted extracts or standard solutions were mixed with 0.5 mL 0.5 N Folin–
Ciocalteu reagent and the reaction was neutralized with 0.5 mL of saturated sodium
carbonate (75 g/L). The absorbance of the resulting blue color was measured at 725 nm
using a spectrophotometer (Thermo Spectronic Helios alpha, Thermo Electron
Corporation, Cambridge, United Kingdom) after incubation for 90 minutes in the dark. A
calibration curve was prepared using gallic acid solution (Appendix B). Total phenolic
content of the tef batter samples were expressed as milligrams of gallic acid equivalent
per g of dry weight (mg GAE/g).
3.8 Flow behavior
In the experiment to understand the effects of fermentation time on elasticity and
eye formation of injera, a digital viscometer (model DV 11, Brookfield Engineering
Laboratories, Middleboro, MA) was used to determine the apparent viscosity in
centipoise (cP) of the tef batters at a rotational speed of 10 rpm using a spindle # 2.

41
In order to determine the rheological behavior of the tef batter samples at low
shear rates, a rheometer (ARES, TA instrument, New Castle, DE) was used in subsequent
experiments. The steady shear rate sweep method with a cone and plate geometry (50
mm diameter and 0.0396 rad cone angle) was used at a temperature of 20 °C. The
Herschel-Bulkley model was used for fitting the shear stress and shear rate data
(Bhattacharya and Bhat, 1997). From this model, the yield stress (σo), consistency
coefficient (k) and flow behavior index (n) of the different batters were obtained.
3.9 Modulus of elasticity
The injera samples baked from tef batter were analyzed using dynamic
mechanical analysis (DMA) (Q800, TA Instruments, New Castle, DE). The samples were
cut into 42 mm diameter discs using a specially made stainless steel punch for the
analysis. The multi-strain compression mode with frequency of 1 Hz, amplitude of 1 to
50 m and force of 0.1 N was used to determine the elastic modulus of the injera samples
at 0.2% strain from stress-strain curves obtained from the analysis (Figure 3.3).
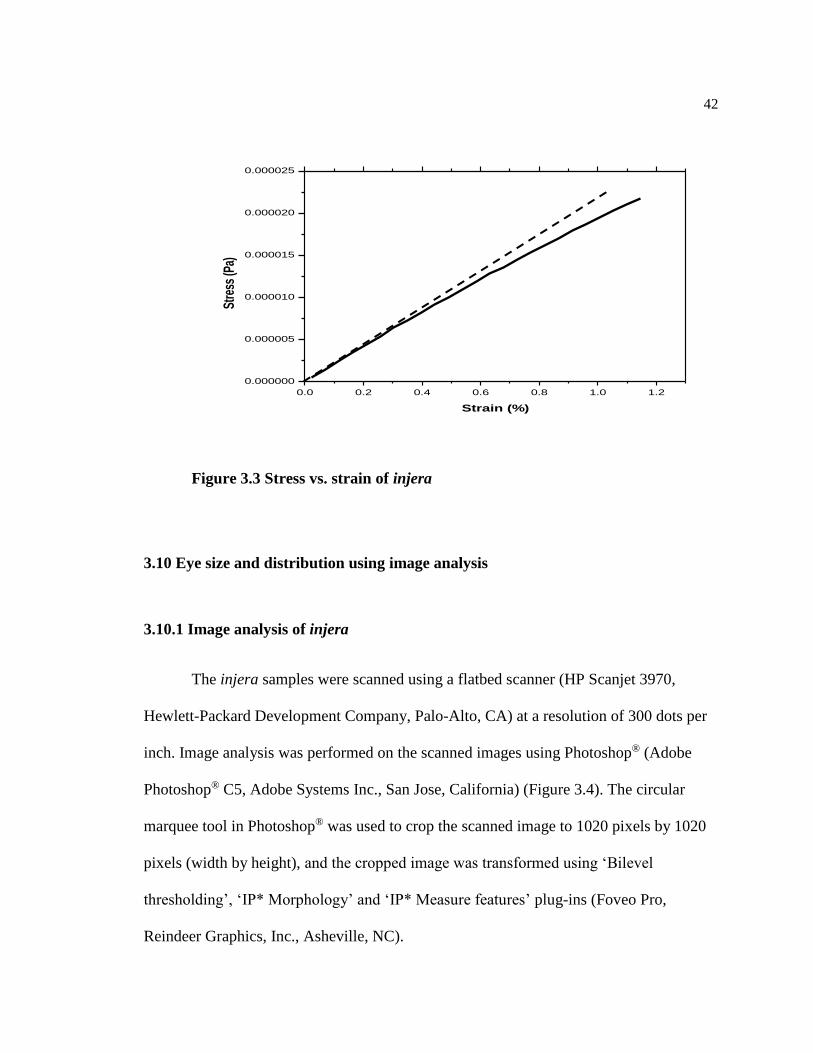
42
0.0 0.2 0.4 0.6 0.8 1.0 1.2
0.000000
0.000005
0.000010
0.000015
0.000020
0.000025
Stre
ss (P
a)
Strain (%)
Figure 3.3 Stress vs. strain of injera
3.10 Eye size and distribution using image analysis
3.10.1 Image analysis of injera
The injera samples were scanned using a flatbed scanner (HP Scanjet 3970,
Hewlett-Packard Development Company, Palo-Alto, CA) at a resolution of 300 dots per
inch. Image analysis was performed on the scanned images using Photoshop® (Adobe
Photoshop® C5, Adobe Systems Inc., San Jose, California) (Figure 3.4). The circular
marquee tool in Photoshop® was used to crop the scanned image to 1020 pixels by 1020
pixels (width by height), and the cropped image was transformed using ‘Bilevel
thresholding’, ‘IP* Morphology’ and ‘IP* Measure features’ plug-ins (Foveo Pro,
Reindeer Graphics, Inc., Asheville, NC).

43
Figure 3.4 Steps used in image analysis
3.10.2 Number, mean equivalent diameter, % total area and distribution of eyes on
injera
The number, mean equivalent diameter and % total area of ‘eyes’ on the injera
were determined after excluding all features (eyes) with an equivalent diameter of less
than 0.05 cm. The mean equivalent diameter of eyes on the surface of the injera samples
was obtained by dividing the sum of equivalent diameters of all the eyes by number of
eyes:
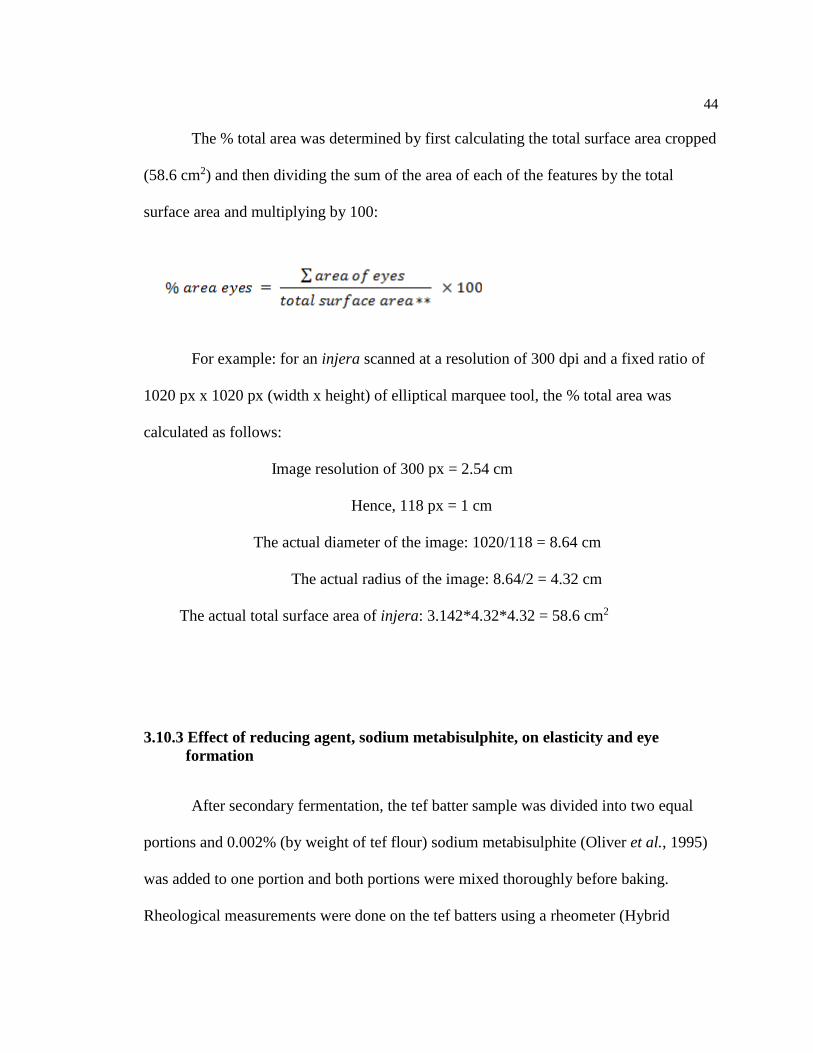
44
The % total area was determined by first calculating the total surface area cropped
(58.6 cm2) and then dividing the sum of the area of each of the features by the total
surface area and multiplying by 100:
For example: for an injera scanned at a resolution of 300 dpi and a fixed ratio of
1020 px x 1020 px (width x height) of elliptical marquee tool, the % total area was
calculated as follows:
Image resolution of 300 px = 2.54 cm
Hence, 118 px = 1 cm
The actual diameter of the image: 1020/118 = 8.64 cm
The actual radius of the image: 8.64/2 = 4.32 cm
The actual total surface area of injera: 3.142*4.32*4.32 = 58.6 cm2
3.10.3 Effect of reducing agent, sodium metabisulphite, on elasticity and eye
formation
After secondary fermentation, the tef batter sample was divided into two equal
portions and 0.002% (by weight of tef flour) sodium metabisulphite (Oliver et al., 1995)
was added to one portion and both portions were mixed thoroughly before baking.
Rheological measurements were done on the tef batters using a rheometer (Hybrid

45
Discovery HR-3, TA Instruments, New Castle, DE). Storage and loss moduli were
measured on the tef batter samples using a 40 mm parallel plate geometry (gap = 1000
µm) at a frequency of 1 Hz. An oscillation sweep was used to measure change in storage
and loss moduli with temperature and time. The tef batter was heated from 20 to 200°C
(in approximately 200s), cooled to 20°C (in approximately 200s), and held at 20°C for
600 s. The number, mean equivalent diameter, and % total area of eyes formed on the
surface of the injera samples were determined using image analysis described in section
3.10. The elastic moduli of the injera samples were determined using dynamic
mechanical analysis (DMA) described in section 3.9.
3.11 Statistical analyses
All measurements were made in triplicate and analyzed using either regression,
one-way, two-way or repeated measures (general linear model) analyses in Minitab 16
Statistical Analysis Package (State College, PA). Multiple comparisons of mean values
were done using the Tukey’s family error rate with a significance level of 0.05. All
experiments (except experiment on effect of fermentation time on eye formation and
elasticity of injera) were replicated twice.

46
CHAPTER 4
RESULTS AND DISCUSSION
Processing parameters such as viscosity and fermentation time have an effect on
the quality of injera. Experiments were conducted to determine how these parameters
affect eye formation and elasticity of injera which are important quality attributes. The
size and number of eyes on the surface of 4 brands of injera already on the market were
compared in order to be used as a benchmark and also to determine the acceptable
quality. Studies were also conducted on the effect of fermentation time and viscosity on
the quality of injera. Lastly, in order to understand the mechanism of eye formation and
elasticity of injera, two experiments were conducted to determine whether carbon dioxide
has a significant effect on eye formation on injera and also to understand whether
disulfide bond linkage of proteins contribute to the elasticity of injera.
4.1 Analysis of commercial injera products
Wub, Gebeta, Kare and Mena brands of injera (Figure 4.1) were obtained from
Kare International Ethiopian market (Alexandria, VA) and stored at 4°C. These samples
were analyzed to determine the number, mean equivalent diameter and % total area of
‘eyes’, pH and moisture content. Replicates of the injera samples were obtained from
different pieces in the same package of each of the brands. Results obtained (Table 4.1)
showed that the mean equivalent diameter and number of eyes on the surface of each of
the injera were not significantly different (p>0.05) from each other. However the % total
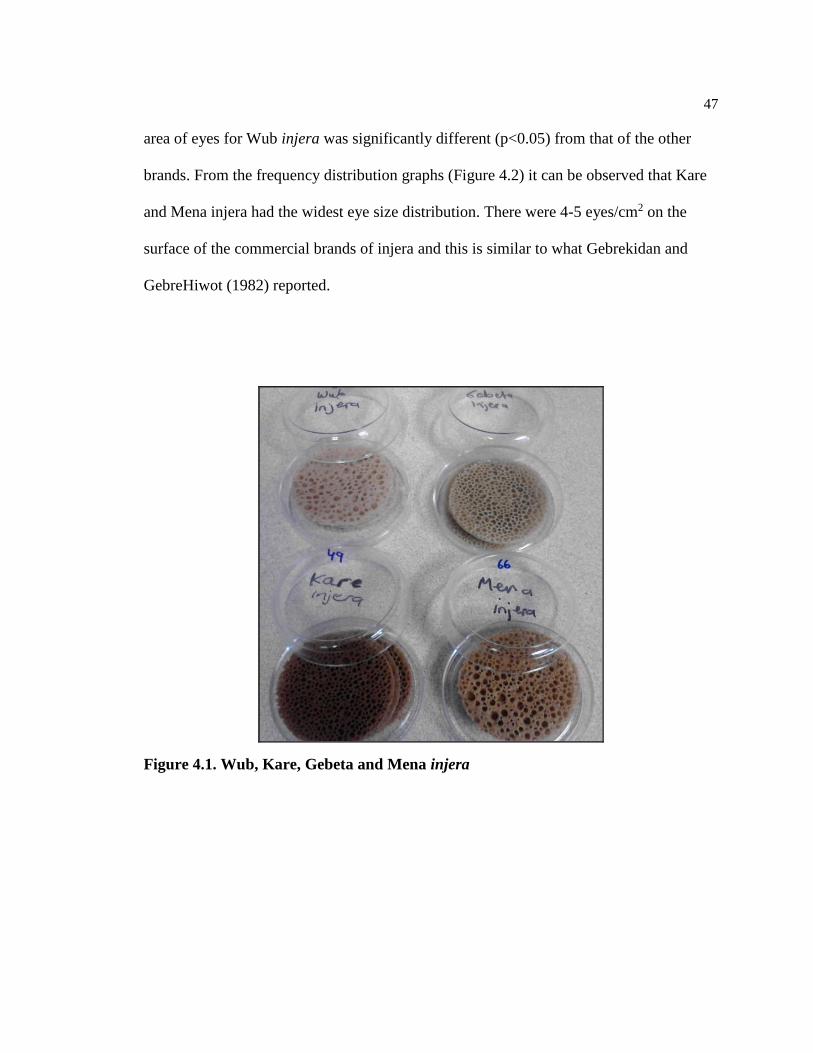
47
area of eyes for Wub injera was significantly different (p<0.05) from that of the other
brands. From the frequency distribution graphs (Figure 4.2) it can be observed that Kare
and Mena injera had the widest eye size distribution. There were 4-5 eyes/cm2 on the
surface of the commercial brands of injera and this is similar to what Gebrekidan and
GebreHiwot (1982) reported.
Figure 4.1. Wub, Kare, Gebeta and Mena injera
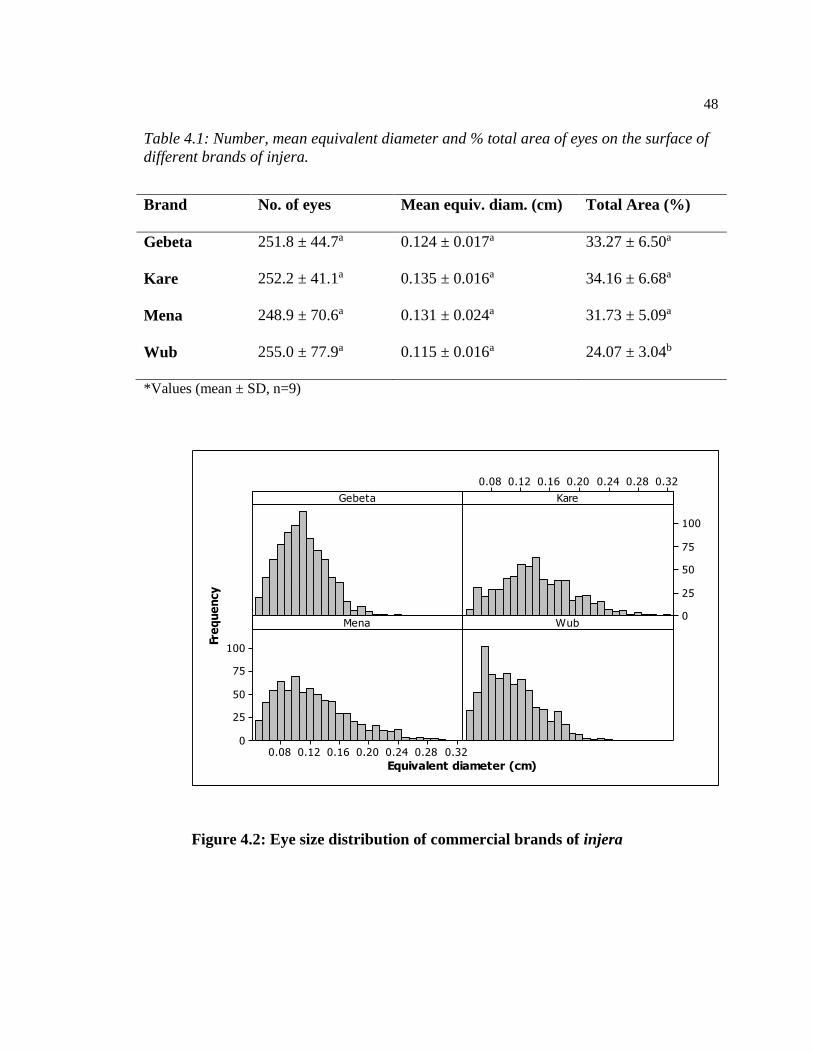
48
Table 4.1: Number, mean equivalent diameter and % total area of eyes on the surface of
different brands of injera.
*Values (mean ± SD, n=9)
0.320.280.240.200.160.120.08
100
75
50
25
0
0.320.280.240.200.160.120.08
100
75
50
25
0
Gebeta
Equivalent diameter (cm)
Fre
qu
en
cy
Kare
Mena Wub
Figure 4.2: Eye size distribution of commercial brands of injera
Brand No. of eyes Mean equiv. diam. (cm) Total Area (%)
Gebeta 251.8 ± 44.7a 0.124 ± 0.017a 33.27 ± 6.50a
Kare 252.2 ± 41.1a 0.135 ± 0.016a 34.16 ± 6.68a
Mena 248.9 ± 70.6a 0.131 ± 0.024a 31.73 ± 5.09a
Wub 255.0 ± 77.9a 0.115 ± 0.016a 24.07 ± 3.04b
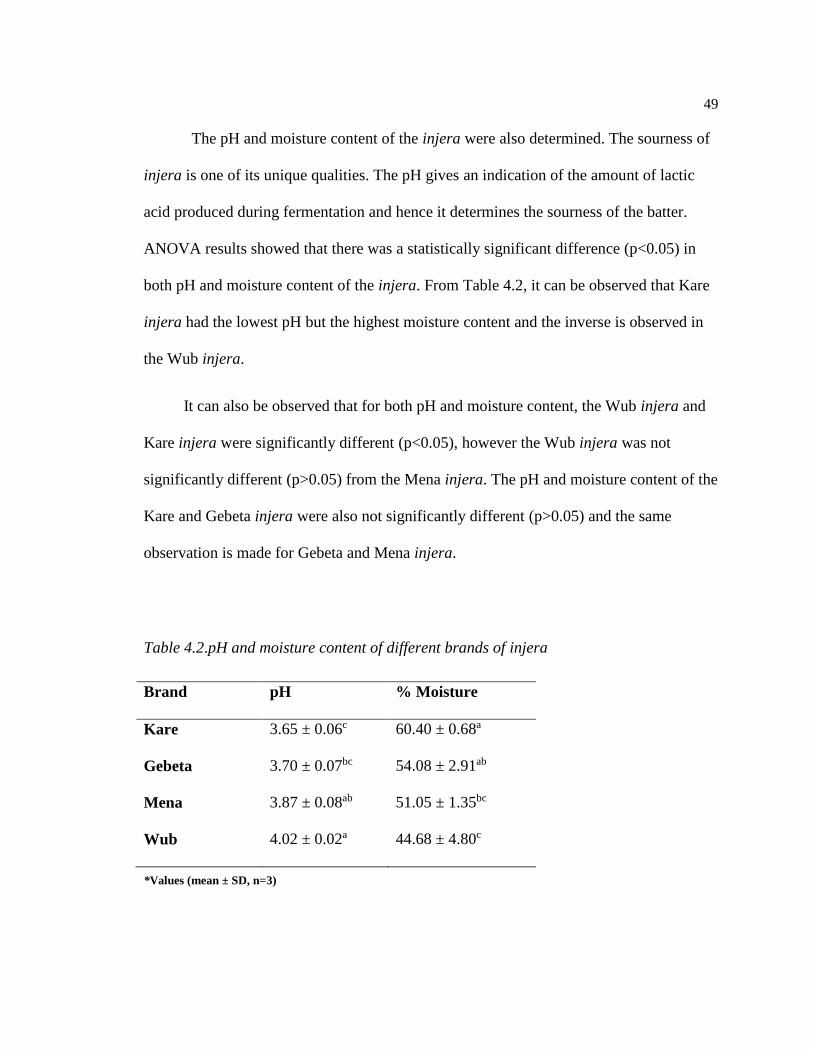
49
The pH and moisture content of the injera were also determined. The sourness of
injera is one of its unique qualities. The pH gives an indication of the amount of lactic
acid produced during fermentation and hence it determines the sourness of the batter.
ANOVA results showed that there was a statistically significant difference (p<0.05) in
both pH and moisture content of the injera. From Table 4.2, it can be observed that Kare
injera had the lowest pH but the highest moisture content and the inverse is observed in
the Wub injera.
It can also be observed that for both pH and moisture content, the Wub injera and
Kare injera were significantly different (p<0.05), however the Wub injera was not
significantly different (p>0.05) from the Mena injera. The pH and moisture content of the
Kare and Gebeta injera were also not significantly different (p>0.05) and the same
observation is made for Gebeta and Mena injera.
Table 4.2.pH and moisture content of different brands of injera
*Values (mean ± SD, n=3)
Brand pH % Moisture
Kare 3.65 ± 0.06c 60.40 ± 0.68a
Gebeta 3.70 ± 0.07bc 54.08 ± 2.91ab
Mena 3.87 ± 0.08ab 51.05 ± 1.35bc
Wub 4.02 ± 0.02a 44.68 ± 4.80c

50
4.2 Effect of fermentation time on physical and chemical properties of tef batter and
injera
Fermentation is time dependent and known to cause changes in the
physicochemical and structural properties of food materials. To observe whether there are
any significant changes in pH, titratable acidity, viscosity, glucose content and total
phenolic content of tef batter and elasticity, eye formation, and moisture of injera, it was
necessary to monitor fermentation at different times. Tef flour was fermented for 72
hours at ambient temperature (22-25°C). Tef batter samples were collected every 4 hours
and the pH, titratable acidity, viscosity and glucose content. Total phenolic content of the
tef batter was determined at 0 and 72 hours. At 0, 24, 48 and 72 hours of primary
fermentation, 300 g tef batter samples were collected and injera (3) prepared from them.
Moisture content, elasticity, number, mean equivalent diameter and % total area of eyes
for each of the injera were determined. It was hypothesized that fermentation time would
have a significant effect on the physicochemical and structural properties of tef batter and
injera.
4.2.1 pH and titratable acidity
The pH and titratable acidity give an indication of the sourness of a food product.
A characteristic sensory quality of injera is its sour taste. Analysis of the different brands
of injera in earlier experiments showed that the pH of the injera samples were between
3.65 and 4.02. In Figure 4.3, it can be observed that as lactic acid is produced during
fermentation, the tef batter becomes more acidic leading to a decrease in pH. According

51
to Sahlin (1999), the content of lactic acid at a certain pH is very much dependent on the
raw material. Furthermore, environmental conditions such as the pH and moisture content
may increase the activity of the flour amylases as well as starch hydrolyzing bacteria.
This in turn increases the amounts of fermentable sugars and acid production causing a
further decrease in pH. Urga and Narasimha (1997) conducted a 96-hour tef fermentation
and observed that the pH of the tef batter decreased to a value of 3.83 with a
corresponding increase in titratable acidity to a value of 1.31%. pH and titratable acidity
values measured in this study were 3.73 and 2.33% respectively.
-10 0 10 20 30 40 50 60 70 800.0
0.5
1.0
1.5
2.0
2.5
3.0
3.5
4.0
4.5
5.0
5.5
6.0
pH
TA (Lactic acid %)
pH
/TA
Fermentation Time (h)
Figure 4.3. Effect of fermentation time on pH and titratable acidity of tef batters

52
4.2.2 Apparent viscosity
A single measurement of apparent viscosity of the tef batter samples was made at
each sampling time. Figure 4.4 shows what appears to be a peak in apparent viscosity of
tef batter at 24 hours of fermentation and then a gradual decrease in viscosity after 30
hours. A study by Wehrle and Arendt (1998) on wheat sourdough showed that after 2
hours of fermentation, viscosity of the sourdough decreased with ongoing fermentation.
This peak is likely due to the higher gas evolution (increase in air bubbles) observed in
the tef batter at 24 hours of primary fermentation. The increase in viscosity and gas
evolution around 24 hours lead us to investigate the effect viscosity of tef batter would
have on eye size and elasticity of injera in later experiments. Due to variability in the
measurement of apparent viscosity of tef batter using the Brookfield viscometer in this
experiment, an ARES rheometer was used in subsequent viscosity experiments.
0 10 20 30 40 50 60 70 80
0
2000
4000
6000
8000
10000
12000
Ap
par
ent
visc
osi
ty (
CP
)
Fermentation Time (h)
Figure 4.4: Effect of fermentation time on apparent viscosity of tef batters
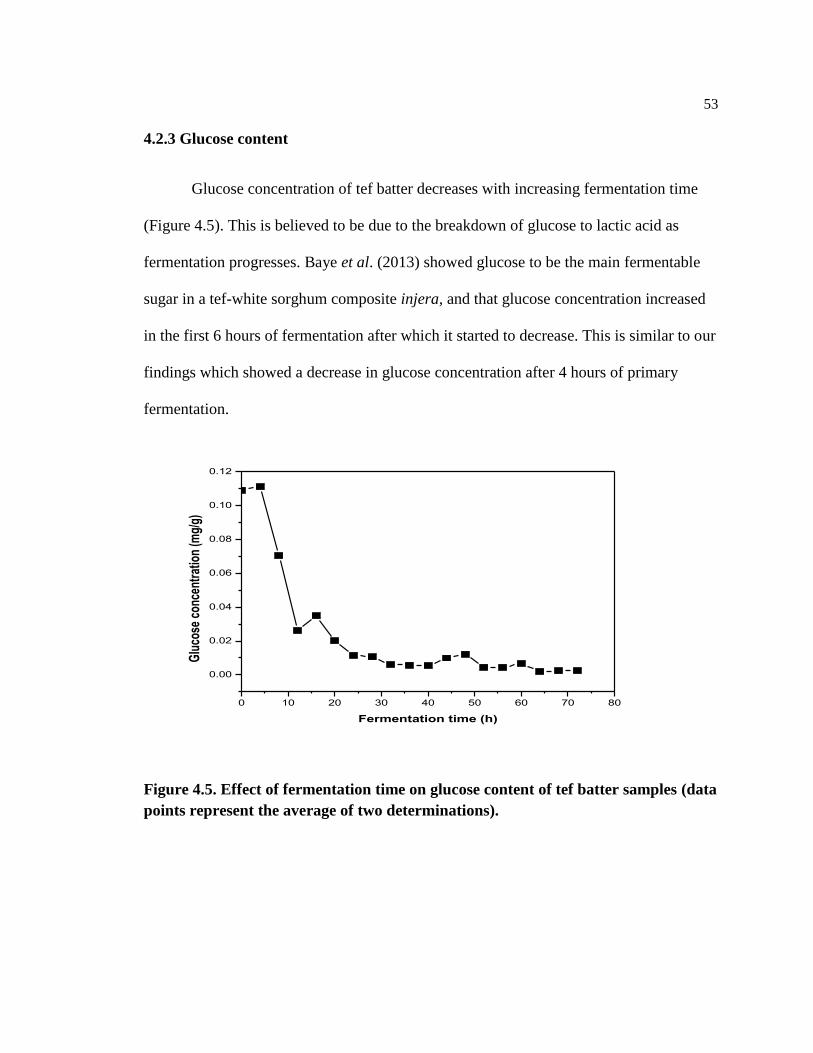
53
4.2.3 Glucose content
Glucose concentration of tef batter decreases with increasing fermentation time
(Figure 4.5). This is believed to be due to the breakdown of glucose to lactic acid as
fermentation progresses. Baye et al. (2013) showed glucose to be the main fermentable
sugar in a tef-white sorghum composite injera, and that glucose concentration increased
in the first 6 hours of fermentation after which it started to decrease. This is similar to our
findings which showed a decrease in glucose concentration after 4 hours of primary
fermentation.
0 10 20 30 40 50 60 70 80
0.00
0.02
0.04
0.06
0.08
0.10
0.12
Glu
cose
con
cent
ratio
n (m
g/g)
Fermentation time (h)
Figure 4.5. Effect of fermentation time on glucose content of tef batter samples (data
points represent the average of two determinations).
54
4.2.4 Total phenolic content
The total phenolic content (TP) of the tef batter samples was determined at 0 and
72 h in order to observe whether there was a significant difference in polyphenolic
content of the tef batter at the beginning and end of fermentation. TP at 0 h was
1.57±0.35 mg GAE/g while that at 72 h was 1.69±0.66 mg GAE/g. Forsido et al. (2013)
reported the TP of tef flour to be 123.6 mg GAE/100 g DM (i.e. 1.24 mg GAE/g) of tef
flour. Statistical analysis showed no significance difference (p<0.05) between TP tef
batter at the beginning of fermentation and at 72 hours of fermentation. Fermentation is
known to decrease phytic acid and polyphenols during fermentation of cereals (Oyewole,
1997). This was however not the case in our study as a slightly higher amount of total
phenolic content was obtained for 72 hours. Kheterpaul and Chauhan (1991) also
observed an increase in the polyphenol content of fermented pearl millet flour, which
they attributed to natural lactic acid fermentation which has been known to increase the
polyphenol content of pearl millet. The higher amount of TP may have been due to an
easier extraction of the polyphenols and not an actual increase in the amount of
polyphenols in the tef batter. Acidified methanol is used to extract bound polyphenols in
food materials and because after fermentation the tef batter is acidic, it is likely that more
of the bound polyphenols were extracted. Further research may be necessary in order to
determine both the total bound and free phenolic content in tef batter samples at the
beginning and end of tef fermentation.

55
4.2.5 Moisture content of injera
One of the most important ingredients in any gluten-free formulation is water.
From Table 4.3, it can be observed that there was a significant difference (p<0.05) in
moisture content of injera baked at 0, 24, 48 and 72 hours. During baking, the injera
samples were covered with the lid of the griddle when eyes covered the whole surface of
the injera. Injera baked at 48 hours was probably covered at a later time compared to
injera baked at 24 hours. Due to this variability, the time of covering injera during
baking was standardized in later tests (1 minute).
Table 4.3. Effect of fermentation time on moisture content of injera
Time (h) Moisture content (%)
0 67.91 ± 1.37 ab
24 74.18 ± 6.40 a
48 46.74 ± 2.15 c
72 65.23 ± 0.69 b *Values (mean ± SD, n=3)
4.2.6 Elastic modulus of injera
There was a significant difference (p<0.05) in elastic modulus of injera baked at
0, 24, 48 and 72 hours (Table 4.4). Injera baked at 72 hours had the highest modulus and
this may be due to more bacterial exopolysaccharides produced after 72 hours of
fermentation compared to earlier fermentation times, though no measurements of EPS
were made. Exopolyssachides can act as hydrocolloids in situ (Rühmkorf et al., 2012)
and hence may have contribute to the elastic texture of injera. Fermentation is also

56
known to breakdown protein and starch and these changes may have resulted in the
different elastic moduli at the different fermentation times.
Table 4.4. Effect of fermentation time on elasticity of injera
Time (h) Elastic modulus (Pa)
0 2378.67 ± 807.67 ab
24 1339.33 ± 170.15b
48 1497.33 ± 90.96 ab
72 3181.67± 1265.76 a
*Values (mean ± SD, n=3)
4.2.6 Eye formation of injera
4.2.6.1 Number of ‘eyes’ on the injera surface
There was a significant difference (p<0.05) in the number of eyes formed on the
surface of injera baked at 0, 24, 48 and 72 h. It was observed that numerous eyes were
formed on injera baked at 24 and 48 hours compared to those baked at 0 and 72 hours
(Table 4.5). This is likely due to the vigorous gas evolution observed during fermentation
at around 24 hours and 48 hours. This gas evolution then subsided towards the end of
fermentation which explains the decrease in number of eyes on the injera from 48 to 72
hours. Pyle (2005) stated that the small bubbles of carbon dioxide (CO2) resulting from
fermentation play a crucial role in as nuclei for pore development and without these
nuclei a porous structure in the final product will not be formed. The CO2 nuclei formed
during primary fermentation could possibly be the main determinant of the number of
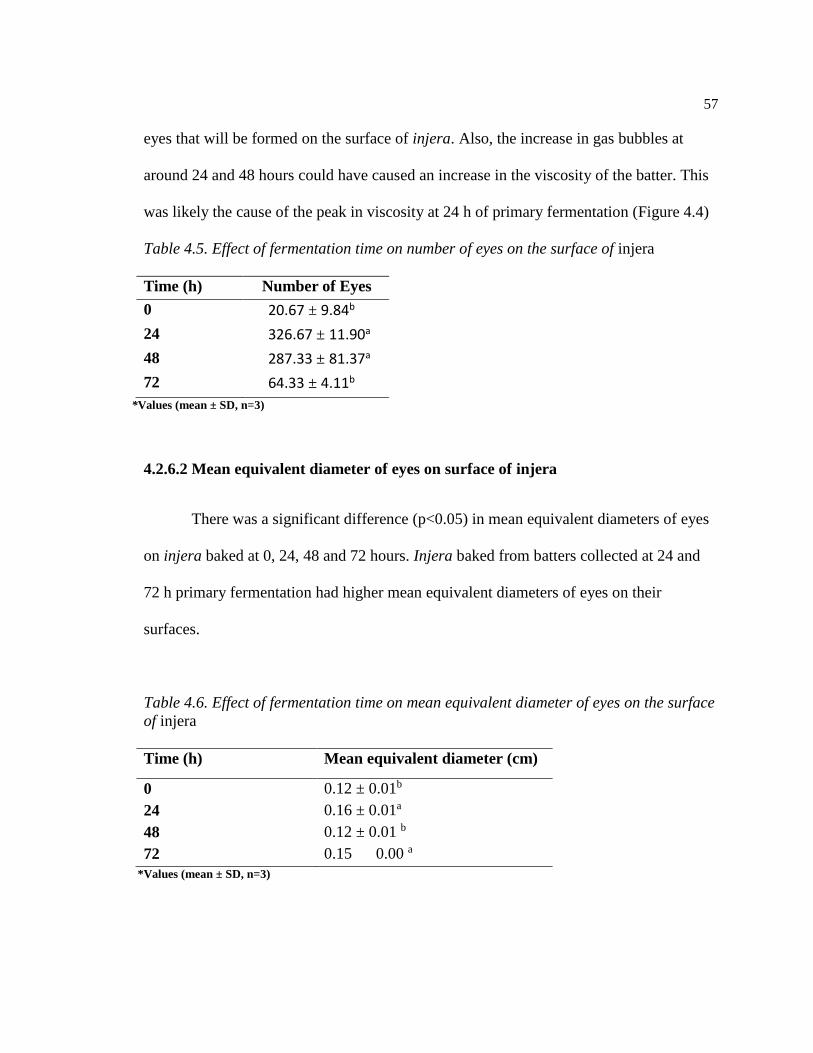
57
eyes that will be formed on the surface of injera. Also, the increase in gas bubbles at
around 24 and 48 hours could have caused an increase in the viscosity of the batter. This
was likely the cause of the peak in viscosity at 24 h of primary fermentation (Figure 4.4)
Table 4.5. Effect of fermentation time on number of eyes on the surface of injera
Time (h) Number of Eyes
0 20.67 ± 9.84b
24 326.67 ± 11.90a
48 287.33 ± 81.37a
72 64.33 ± 4.11b
*Values (mean ± SD, n=3)
4.2.6.2 Mean equivalent diameter of eyes on surface of injera
There was a significant difference (p<0.05) in mean equivalent diameters of eyes
on injera baked at 0, 24, 48 and 72 hours. Injera baked from batters collected at 24 and
72 h primary fermentation had higher mean equivalent diameters of eyes on their
surfaces.
Table 4.6. Effect of fermentation time on mean equivalent diameter of eyes on the surface
of injera
Time (h) Mean equivalent diameter (cm)
0 0.12 ± 0.01b
24 0.16 ± 0.01a
48 0.12 ± 0.01 b
72 0.15 0.00 a
*Values (mean ± SD, n=3)

58
4.2.6.3 Percent (%) total area of eyes on surface of injera
The % total area represents the total area covered by ‘eyes’ on the surface of injera. There
was a statistically significant difference in % total area of eyes of injera baked from tef batter
samples collected at 0, 24, 48 and 72 h. There was a higher percentage of total area of eyes on
injera baked at 24 compared to 0, 48 and 72 h. During fermentation, it was observed that there
was vigorous gas evolution around 24 h and this may have resulted in higher number of eyes on
the surface of the injera. Gas evolution became lower towards the end of primary fermentation
and this could have accounted for the low % total area.
Table 4.7. Effect of fermentation time on % total area of eyes on the surface of injera
Time(hr) Total area (%)
0 0.55 ± 0.38 a
24 14.98 ± 1.28 b
48 7.93 3.50 c
72 2.46 ± 0.33 c
*Values (mean ± SD, n=3)

59
4.3 Effect of viscosity on eye formation and elasticity of injera
Absit added back to the fermented batter increases the viscosity of batter and
provides the batter with a better gas-holding capacity (Zannini et al., 2012). This
experiment was conducted to determine the effect of different viscosities of tef batter on
elasticity and eye formation of injera. Tef batter was divided into 6 equal portions and 10
% by weight of each of the tef batter portions was used to prepare absit in different tef
batter to water ratios: 1:2, 1:3, 1:4, 1:5, 1:6, 1:7 (w/w). This experiment was replicated
twice.
4.3.1 Flow behavior of tef batter
The viscosity of the batter and the amount of carbon dioxide produced during
fermentation play a fundamental role in the formation of the cellular structure of leavened
bread (Bloksma, 1990). The mean yield stress, consistency coefficient, flow index and
apparent viscosity (shear rate of 1 s-1) of each of the tef batter samples were determined
(Table 4.8). Shear thinning behavior was observed in all samples except the 1:2 batter at
a shear rate range of 0.1 to 10 s-1.

60
Table 4.8: Apparent, viscosity, yield stress, consistency coefficient and flow index of tef
batter samples
Batter-to- water ratio in absit
Apparent Viscosity at 1 s-1(Pa.s)
Yield Stress (Pa)
Consistency Coefficient (Pa.sn)
Flow Index
1:2 1.59 ± 0.17 0.81±0.12 0.74±0.06 1.18±0.33 1:3 1.47±0.13 0.78±0.14 0.69±0.04 0.93±0.10 1:4 1.37±0.09 0.67±0.07 0.71±0.04 0.81±0.06 1:5 1.27±0.06 0.55±0.06 0.72±0.05 0.71±0.027 1:6 1.13±0.08 0.39±0.09 0.74±0.11 0.63±0.07 1:7 1.06±0.09 0.26±0.07 0.80±0.05 0.50±0.04
*Values (mean ± SD, n=6)
The Herschel-Bulkley model used to fit the shear stress data showed a high
(0.986-0.997) coefficient of determination (R2) for all samples. The apparent viscosity of
the samples decreased with increasing amount of water used to prepare the absit. The
magnitude of the consistency coefficient of a material is related to its viscosity
(Mukprasirt et al., 2000). According to D’Silva (2009), the consistency coefficient is an
indication of viscous behavior. Hence, a batter that is thick will likely have a higher
consistency coefficient compared to a thinner batter. It can be observed from Table 4.8
that the consistency coefficient was higher in the batter with lower amount of water (1:2)
and decreased at the tef batter-to-water ratio of 1:3. The consistency coefficient increased
again at the tef batter-to-water ratio of 1:4 to the highest water content (1:7). Consistency
coefficient values are more sensitive to solid concentration in suspensions, and an
increase in solid level markedly increases the consistency values (Bhattacharya and Bhat,
1997).The magnitude of the consistency coefficient is not directly comparable unless the
flow index is constant, since the units of k are Pa.sn. Since n changed with the water
content in the absit, the values of k in Table 4.8 are not directly comparable. The batter

61
with the lowest apparent viscosity exhibited high consistency, low yield stress and low
flow index properties, and therefore was closer in character to a pseudoplastic fluid.
The flow behavior index (n) indicates the type of behavior in response to different
shear rates (D’Silva, 2009). A value of n< 1 indicates shear thinning behavior, n > 1
indicates shear thickening behavior and n = 1 indicates Newtonian behavior. Hence, as
the flow index tends towards 1, shear thinning properties become less pronounced. It can
be observed that the flow index for all the samples except the batter with the highest
viscosity (1.59 ± 0.17 Pa.s) were below 1 (Table 4.8), with this batter having the highest
flow behavior index hence approaching shear thickening behavior. Kim et al.(2002)
stated that under shear, starch from microscopic regions of highly concentrated clusters
would be dispersed into solution raising the starch concentration and viscosity of the
suspension. This results in the shear thickening of the concentrated starch suspension. A
study by Bhattacharya and Bhat (1997) on rice-blackgram suspensions reported that the
Herschel-Bulkley model yields slightly higher flow index values than the power law
model. They stated that this is due to the existence of a yield stress term in the nature of
Herschel-Bulkley model which predicts a lesser pseudoplastic nature of the suspensions.
From Table 4.8, it can also be observed that the yield stress values decreased with
increasing water content. Bhattacharya and Bhat (1997) observed a decrease in yield
stress with increasing moisture content in rice-blackgram suspensions. The yield stress of
a material describes the force that must be exceeded to cause the material to flow. Hence,
it shows that the thinner the batter the lower the force needed for it to flow. According to
Bhattacharya and Bhat (1997), the high yield stress for concentrated suspensions occurs
due to the crowding of the continuous phase. This implies that the lower the apparent
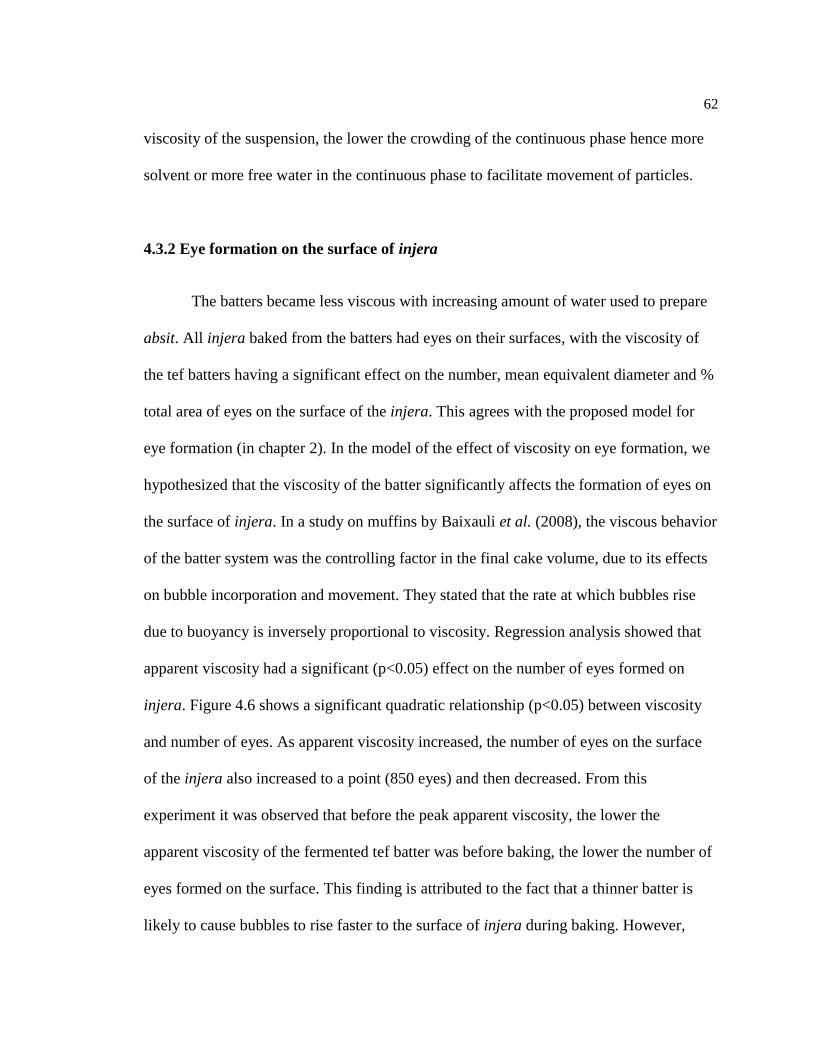
62
viscosity of the suspension, the lower the crowding of the continuous phase hence more
solvent or more free water in the continuous phase to facilitate movement of particles.
4.3.2 Eye formation on the surface of injera
The batters became less viscous with increasing amount of water used to prepare
absit. All injera baked from the batters had eyes on their surfaces, with the viscosity of
the tef batters having a significant effect on the number, mean equivalent diameter and %
total area of eyes on the surface of the injera. This agrees with the proposed model for
eye formation (in chapter 2). In the model of the effect of viscosity on eye formation, we
hypothesized that the viscosity of the batter significantly affects the formation of eyes on
the surface of injera. In a study on muffins by Baixauli et al. (2008), the viscous behavior
of the batter system was the controlling factor in the final cake volume, due to its effects
on bubble incorporation and movement. They stated that the rate at which bubbles rise
due to buoyancy is inversely proportional to viscosity. Regression analysis showed that
apparent viscosity had a significant (p<0.05) effect on the number of eyes formed on
injera. Figure 4.6 shows a significant quadratic relationship (p<0.05) between viscosity
and number of eyes. As apparent viscosity increased, the number of eyes on the surface
of the injera also increased to a point (850 eyes) and then decreased. From this
experiment it was observed that before the peak apparent viscosity, the lower the
apparent viscosity of the fermented tef batter was before baking, the lower the number of
eyes formed on the surface. This finding is attributed to the fact that a thinner batter is
likely to cause bubbles to rise faster to the surface of injera during baking. However,

63
once the bubbles rupture at the surface of the injera the batter flows and fills the pores
formed, resulting in fewer eyes on the surface of the injera. It was also observed that
thicker batters had fewer ‘eyes’ on their surfaces. This may be due to gelatinization of the
batter surrounding the bubble thereby slowing down the rise of the bubble. This results in
fewer bubbles rising to the surface and more bubbles getting trapped in the batter at the
end of baking. According to Lakshminarayan et al. (2006), a sufficiently high batter
viscosity in a cake batter might keep the air bubbles from rising out of the batter. Also it
was observed from a cross-sectional view of cut injera (Figure 4.7) that these bubbles
create tunnels in the batter during baking and these tunnels appeared to be more
pronounced in thicker batters. Pyle (2005) also observed similar columnar structures in
baked crumpets after 75 s of baking.
0.9 1.0 1.1 1.2 1.3 1.4 1.5 1.6 1.7
300
400
500
600
700
800
900
R-Square = 0.9610
Avg. no. of Eyes = -7864 + 12557 App. Visc.
- 4532 App. Visc.**2
Ave
rag
e N
o. o
f E
yes
Apparent Viscosity (Pa.s)
Figure 4.6. Effect of apparent viscosity on the number of eyes on the surface of
injera (error bars represent the standard deviation of the mean no. of eyes and
apparent viscosity)
64
Figure 4.7. Columnar structures (tunnels) in cross-sectional view of injera
Apart from the number of eyes formed, the size of the eyes was also affected. The
mean equivalent diameter of the eyes formed on the surface of injera were significantly
(p<0.05) affected by the viscosity of the batters from which they were baked. Lower
viscosity batters had smaller eyes compared to batters with higher viscosities. Figure 4.8
shows a quadratic relationship between apparent viscosity and eye size on the surface of
injera.
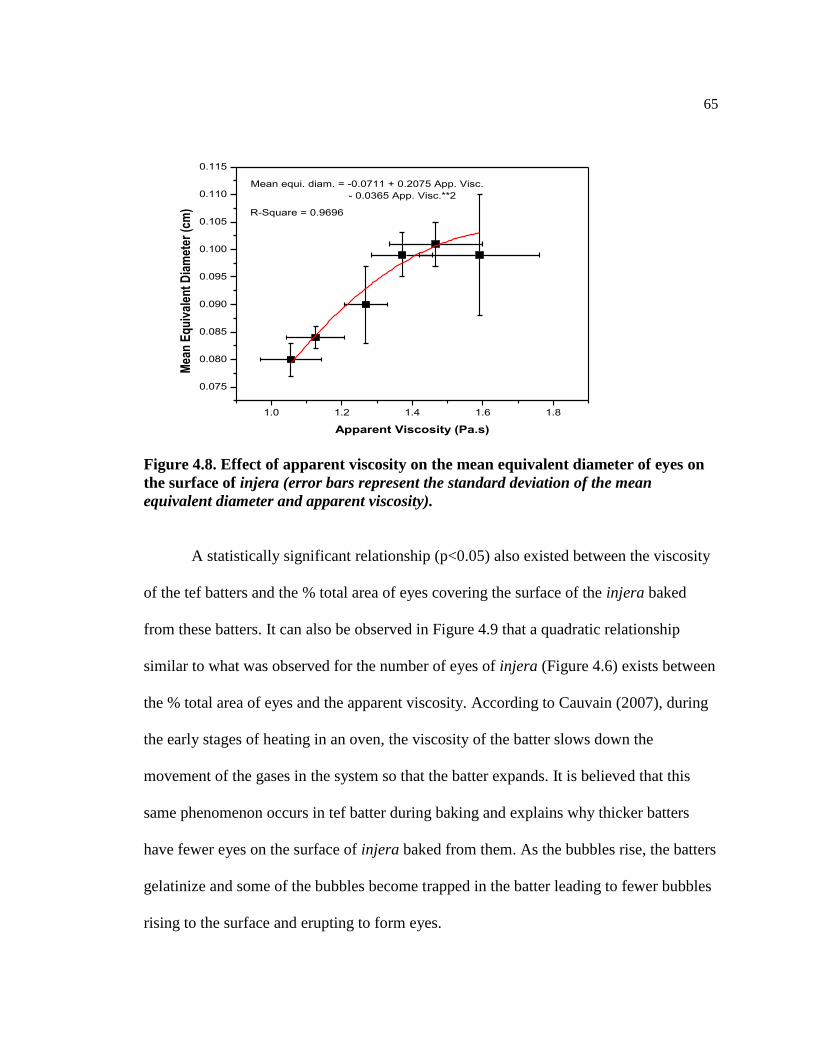
65
1.0 1.2 1.4 1.6 1.8
0.075
0.080
0.085
0.090
0.095
0.100
0.105
0.110
0.115
R-Square = 0.9696
Mean equi. diam. = -0.0711 + 0.2075 App. Visc.
- 0.0365 App. Visc.**2
Mea
n E
qu
ival
ent
Dia
met
er (
cm)
Apparent Viscosity (Pa.s)
Figure 4.8. Effect of apparent viscosity on the mean equivalent diameter of eyes on
the surface of injera (error bars represent the standard deviation of the mean
equivalent diameter and apparent viscosity).
A statistically significant relationship (p<0.05) also existed between the viscosity
of the tef batters and the % total area of eyes covering the surface of the injera baked
from these batters. It can also be observed in Figure 4.9 that a quadratic relationship
similar to what was observed for the number of eyes of injera (Figure 4.6) exists between
the % total area of eyes and the apparent viscosity. According to Cauvain (2007), during
the early stages of heating in an oven, the viscosity of the batter slows down the
movement of the gases in the system so that the batter expands. It is believed that this
same phenomenon occurs in tef batter during baking and explains why thicker batters
have fewer eyes on the surface of injera baked from them. As the bubbles rise, the batters
gelatinize and some of the bubbles become trapped in the batter leading to fewer bubbles
rising to the surface and erupting to form eyes.
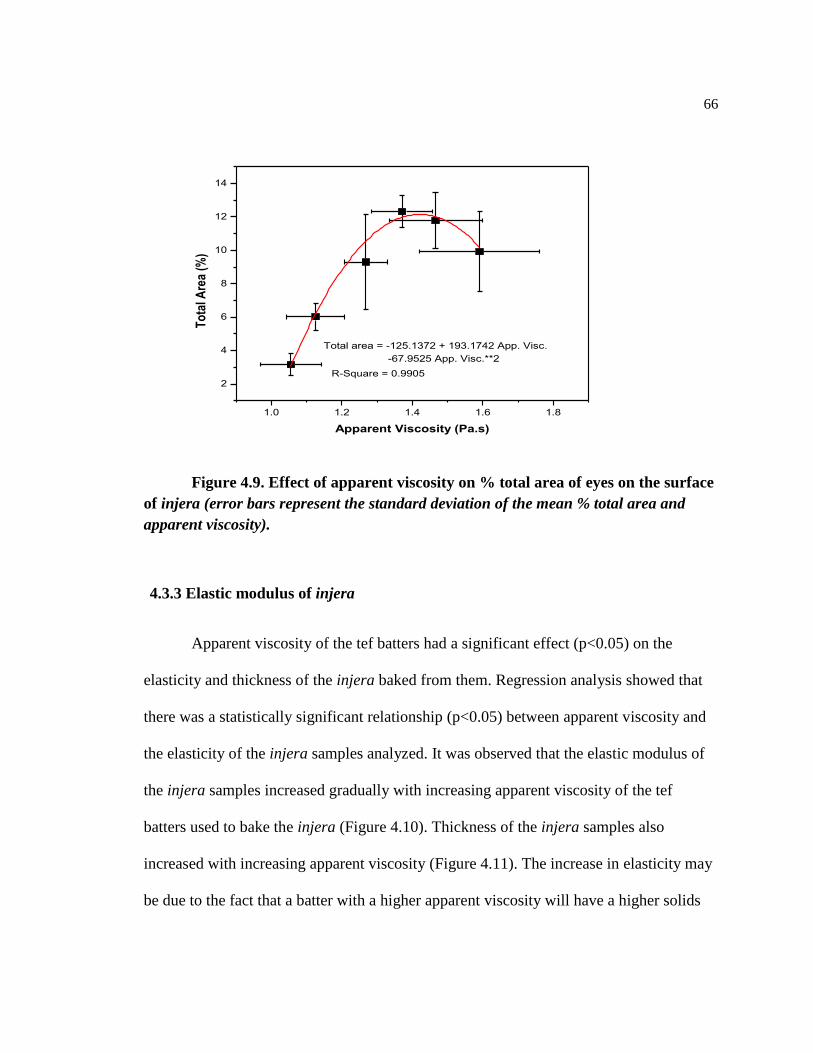
66
1.0 1.2 1.4 1.6 1.8
2
4
6
8
10
12
14
R-Square = 0.9905
Total area = -125.1372 + 193.1742 App. Visc.
-67.9525 App. Visc.**2
To
tal A
rea
(%)
Apparent Viscosity (Pa.s)
Figure 4.9. Effect of apparent viscosity on % total area of eyes on the surface
of injera (error bars represent the standard deviation of the mean % total area and
apparent viscosity).
4.3.3 Elastic modulus of injera
Apparent viscosity of the tef batters had a significant effect (p<0.05) on the
elasticity and thickness of the injera baked from them. Regression analysis showed that
there was a statistically significant relationship (p<0.05) between apparent viscosity and
the elasticity of the injera samples analyzed. It was observed that the elastic modulus of
the injera samples increased gradually with increasing apparent viscosity of the tef
batters used to bake the injera (Figure 4.10). Thickness of the injera samples also
increased with increasing apparent viscosity (Figure 4.11). The increase in elasticity may
be due to the fact that a batter with a higher apparent viscosity will have a higher solids

67
content and will be dense. The increase in thickness with increasing tef batter-to-water
ratio was likely due to more air bubbles being trapped in the injera at higher viscosities.
1.0 1.2 1.4 1.6 1.8
600
800
1000
1200
1400
1600
1800
2000
2200
2400
R-Square = 0.4695
Elasticity = 4332.3443 -5876.6065 App. Visc.
+ 2623.0771 App. Visc.**2
Ela
stic
mo
du
lus
(Pa)
Apparent Viscosity (Pa.s)
Figure 4.10. Effect of apparent viscosity on elastic modulus of injera (error bars
represent the standard deviation of the mean elastic modulus and apparent
viscosity).
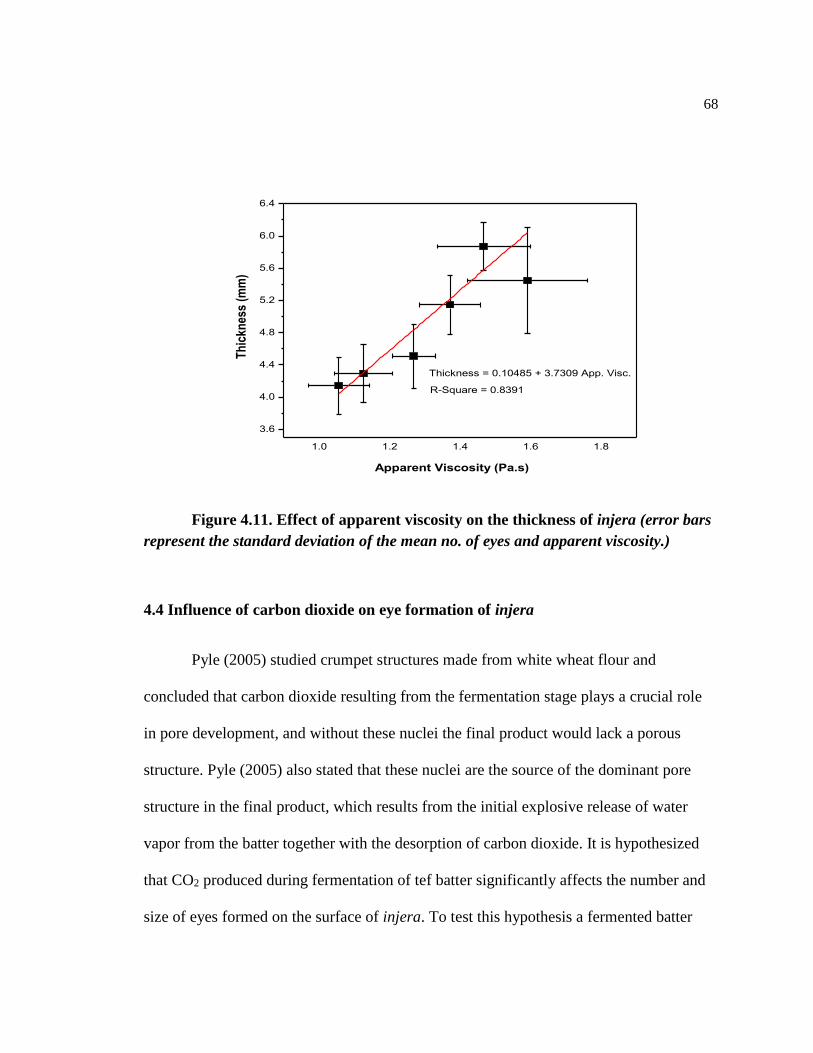
68
1.0 1.2 1.4 1.6 1.8
3.6
4.0
4.4
4.8
5.2
5.6
6.0
6.4
R-Square = 0.8391
Thickness = 0.10485 + 3.7309 App. Visc.
Th
ickn
ess
(mm
)
Apparent Viscosity (Pa.s)
Figure 4.11. Effect of apparent viscosity on the thickness of injera (error bars
represent the standard deviation of the mean no. of eyes and apparent viscosity.)
4.4 Influence of carbon dioxide on eye formation of injera
Pyle (2005) studied crumpet structures made from white wheat flour and
concluded that carbon dioxide resulting from the fermentation stage plays a crucial role
in pore development, and without these nuclei the final product would lack a porous
structure. Pyle (2005) also stated that these nuclei are the source of the dominant pore
structure in the final product, which results from the initial explosive release of water
vapor from the batter together with the desorption of carbon dioxide. It is hypothesized
that CO2 produced during fermentation of tef batter significantly affects the number and
size of eyes formed on the surface of injera. To test this hypothesis a fermented batter
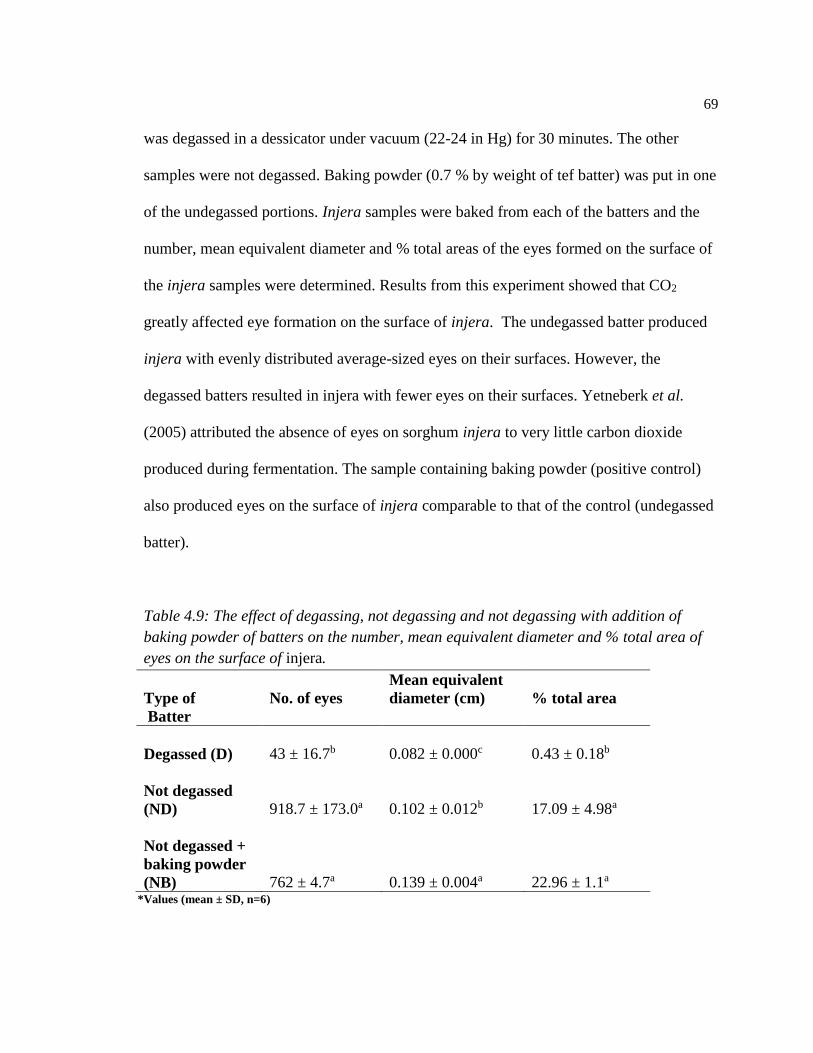
69
was degassed in a dessicator under vacuum (22-24 in Hg) for 30 minutes. The other
samples were not degassed. Baking powder (0.7 % by weight of tef batter) was put in one
of the undegassed portions. Injera samples were baked from each of the batters and the
number, mean equivalent diameter and % total areas of the eyes formed on the surface of
the injera samples were determined. Results from this experiment showed that CO2
greatly affected eye formation on the surface of injera. The undegassed batter produced
injera with evenly distributed average-sized eyes on their surfaces. However, the
degassed batters resulted in injera with fewer eyes on their surfaces. Yetneberk et al.
(2005) attributed the absence of eyes on sorghum injera to very little carbon dioxide
produced during fermentation. The sample containing baking powder (positive control)
also produced eyes on the surface of injera comparable to that of the control (undegassed
batter).
Table 4.9: The effect of degassing, not degassing and not degassing with addition of
baking powder of batters on the number, mean equivalent diameter and % total area of
eyes on the surface of injera.
Type of
Batter
No. of eyes
Mean equivalent
diameter (cm)
% total area
Degassed (D) 43 ± 16.7b 0.082 ± 0.000c
0.43 ± 0.18b
Not degassed
(ND) 918.7 ± 173.0a 0.102 ± 0.012b
17.09 ± 4.98a
Not degassed +
baking powder
(NB) 762 ± 4.7a 0.139 ± 0.004a 22.96 ± 1.1a *Values (mean ± SD, n=6)
70
From Table 4.9, it can be observed that the number, mean equivalent diameter and
% total area for both the undegassed batter with baking powder (NB) and the undegassed
batter (ND) were greater than that of the degassed batters (D). The eyes formed on the
injera baked from the degassed batter are as a result of pores created by water vapor
during heating. Analysis of variance performed on the number of eyes and % total area of
eyes on the injera showed that the ND and NB batters are not significantly different but
are both significantly different from the mean no. of eyes and % total area of the D
batters. However the average mean equivalent diameter for the injera baked from the D,
ND and NB batters were significantly different. Eyes on the injera baked from the NB
batters were bigger in size compared to eyes on the injera baked from D and ND batters
with the eyes on the D batters having the smallest diameter among the 3 types of batters.
According to Cauvain (2007), carbon dioxide gas is generated by the addition of baking
powder and this will add to the inflation of the initial air bubbles in the case of cake
batters. This could explain why the NB batter had a higher mean equivalent diameter
compared to the other batters.
In conclusion, it is very clear from the results that CO2 had a significant effect
(p<0.05) on eye formation on the surface of injera.
71
4.5 Influence of a reducing agent, sodium metabisulfite (SMBS) on elasticity or
storage modulus of injera
4.5.1 Rheological behavior of tef batter
Sodium metabisulfite (SMBS) acts as a source of sulfur (IV) oxoanions which
modifies the rheology of the dough by breaking some of the disulfide bridges present in
proteins (Oliver et al., 1995). Pyle (2005) observed an increase in elastic modulus of
crumpet batters with increasing temperature. The storage and loss moduli for both the tef
batter with SMBS and tef batter without SMBS showed similar trends with increasing
temperature. A short plateau was observed in both storage and loss moduli curves for tef
batter without SMBS but not for tef batter with SMBS. This shows that there was some
effect of SMBS on disulfide bonds of proteins in the tef batter with SMBS. None of the
samples showed a significant elastic response during the dynamic shearing test at
temperatures below 80°C (Figures 4.12 and 4.13). However, an increase in elastic
modulus was observed for all batters from 80 to 120 °C. Bultosa et al. (2002) reported a
starch gelatinization temperature of raw tef in the range 68-80°C. Xue and Ngadi (2006)
studied the rheological properties of different gluten-free flour batters and attributed an
increase in elastic modulus with increasing temperature of the batters to starch
gelatinization. It can be observed from both graphs of storage modulus versus
temperature (Figures 4.12 and 4.13) that batters without SMBS showed higher elastic
modulus than the batters with SMBS.
The effect of storage modulus with respect to time at 20°C showed different
trends in the samples containing the SMBS and samples not containing SMBS. For the

72
tef batters with SMBS it was observed that the storage and loss moduli merged together
resulting in a more viscous behavior of the batter towards the end of cooling. Biliaderis
(1991) stated that amylose gels generally exhibit a rapid rise in storage modulus (G'),
followed by a phase of much slower increase at longer times. This behavior was observed
in tef batter without SMBS. At the end of cooling at 20 °C, the storage modulus of tef
batter without SMBS was higher than that of tef batter with SMBS (Figure 4.12 and
4.13) meaning that the SMBS possibly had an effect on the disulfide bonds of the
proteins resulting in a product of lower elasticity.
0 100 200 300 400 500 600 700
0
5000
10000
15000
20000
25000
30000
35000
40000
Storage Modulus
Loss Modulus
Time at 20°C (s)Temperature (°C)
Mo
du
lus
(Pa)
Figure 4.12. Effect of temperature and time (at 20°C) on storage and loss modulus
of tef batter without SMBS
without SMBS
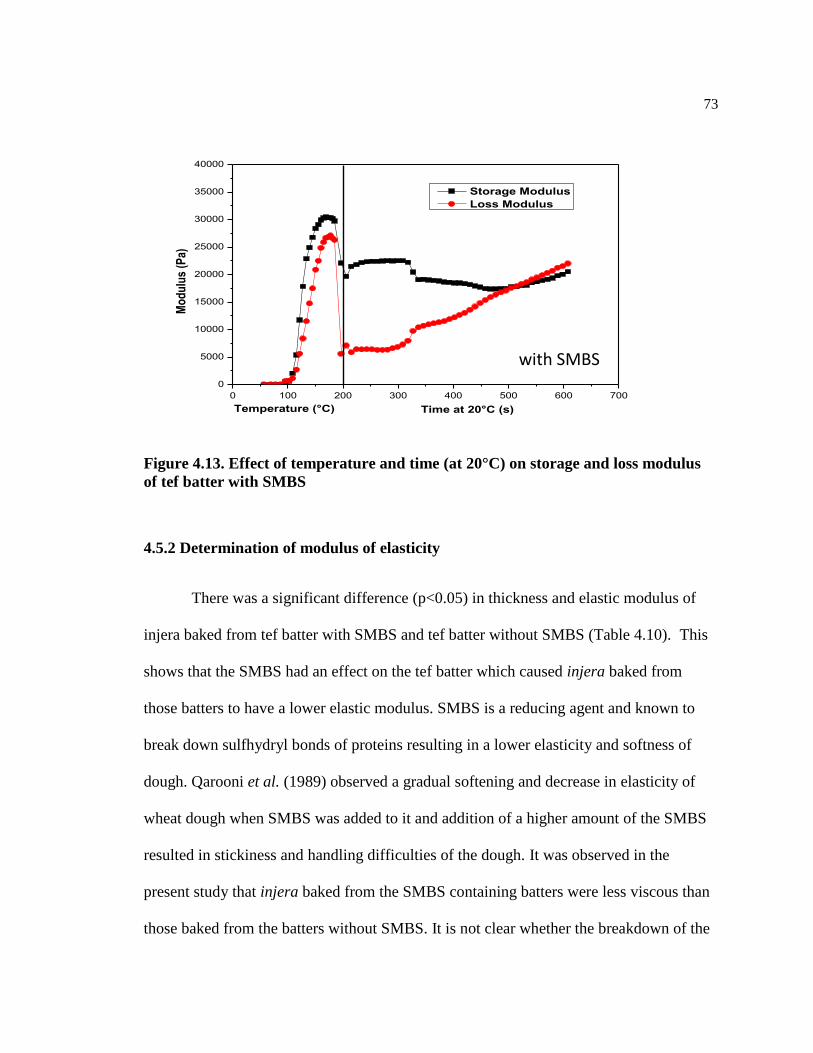
73
0 100 200 300 400 500 600 700
0
5000
10000
15000
20000
25000
30000
35000
40000
Time at 20°C (s)
Mo
du
lus
(Pa)
Temperature (°C)
Storage Modulus
Loss Modulus
Figure 4.13. Effect of temperature and time (at 20°C) on storage and loss modulus
of tef batter with SMBS
4.5.2 Determination of modulus of elasticity
There was a significant difference (p<0.05) in thickness and elastic modulus of
injera baked from tef batter with SMBS and tef batter without SMBS (Table 4.10). This
shows that the SMBS had an effect on the tef batter which caused injera baked from
those batters to have a lower elastic modulus. SMBS is a reducing agent and known to
break down sulfhydryl bonds of proteins resulting in a lower elasticity and softness of
dough. Qarooni et al. (1989) observed a gradual softening and decrease in elasticity of
wheat dough when SMBS was added to it and addition of a higher amount of the SMBS
resulted in stickiness and handling difficulties of the dough. It was observed in the
present study that injera baked from the SMBS containing batters were less viscous than
those baked from the batters without SMBS. It is not clear whether the breakdown of the
with SMBS

74
sulfhydryl bonds of tef proteins resulted in a thinner batter or whether the reduction in
thickness and elastic modulus was due to a viscosity effect alone.
Table 4.10. Effect of SMBS on the thickness and elastic modulus of injera
Sample Thickness (mm) Elastic modulus (Pa)
Tef batter without
SMBS (control)
6.59 ± 0.61a
1375.88 ± 395.76a
Tef batter with
SMBS
4.54 ± 0.23b
1203.483 ± 388.81b
*Values (mean ± SD, n=6)
4.5.3 Determination of the effect of SMBS on eye formation of injera
ANOVA results showed that there was a significant difference (p<0.05) in the
number of eyes of injera baked from tef batter containing SMBS and tef batter without
SMBS. The same observation was made for the mean equivalent diameter and % total
area of the eyes formed on the surface of the injera. It is uncertain what may have caused
a decrease in the number of eyes of injera baked from the SMBS containing batters.
Sulfites are used as antimicrobial and antioxidants in food preservation (Schimz, 1980).
Gesellschaft (1980) studied the effect of sulfites on Saccharomyces cerevisiae and
observed that they inhibited colony formation of yeasts. Hence, the SMBS might have
inactivated the yeasts in the batter and this prevented gas evolution in the batter. Because
the SMBS batters were also less viscous than the batters without SMBS, it is possible that
the tef batter covered the eyes that were being formed on the surface of the injera during
baking thereby resulting in fewer eyes being formed on the surface.

75
Table 4.11. Effect of SMBS on number, mean equivalent diameter and % total area of
eyes on the surface of injera
Sample Number of eyes Mean Equivalent Diameter (cm)
% total area
Tef batter without SMBS (control)
859.2 ± 65.5a
0.118 ± 0.010a
18.33 ± 2.29a
Tef batter with SMBS
587.5 ± 170.7b 0.090 ± 0.003b
7.50 ± 2.54b
*Values (mean ± SD, n=6)
76
CHAPTER 5
CONCLUSIONS AND RECOMMENDATIONS
5.1 Conclusions
Elasticity and eye formation are important quality attributes of injera. Hence, an
injera which lacks these attributes is not acceptable to the Ethiopian consumer. The main
objective of this study was to determine the effect of viscosity of tef batter and
fermentation time on elasticity and eye formation of injera. From the results it was
observed that viscosity and fermentation time have a significant effect on elasticity and
eye formation. These are factors which should be controlled during processing of injera
to ensure that good quality injera is produced.
From the results of this study, we were able to show that eyes are formed by
dissolved gases, likely carbon dioxide produced during fermentation of tef batter. We
were also able to show that injera baked from very low viscosity batters will have fewer
eyes on their surfaces and those baked from higher viscosity batters will also have fewer
but bigger eyes on their surfaces compared to the low viscosity batters. From this finding,
we were able to obtain an optimal viscosity range of 1.1 to 1.4 Pa.s for baking injera with
numerous, evenly distributed eyes. This fell within the tef batter viscosity range (0.2-1.5
Pa.s) stated by Admassu (2004). Results from rheological measurements to determine the
effect of SMBS on the elasticity of injera showed that the tef batters containing SMBS
had a lower storage modulus at the different heating temperatures compared to tef batters

77
without SMBS. SMBS also had a significant effect on elasticity and eye formation of the
injera indicating that proteins may have contributed to the elasticity of injera even
though it is still uncertain whether they are the sole contributors to injera elasticity.
From the tests conducted we have been able to show that processing parameters
such as viscosity and fermentation time have a significant effect on elasticity and eye
formation of injera. These findings will play an important role in improving the quality
of injera and gluten-free breads in general.
5.2 Recommendations
1. Sensory tests should be conducted on injera samples using the apparent viscosity
range to determine acceptability among Ethiopian consumers
2. A study comparing different varieties of tef should be conducted to determine their
effect on eye formation and of injera among other quality attributes.
3. A more in depth analysis on the role of proteins, starch, hemicellulose and
exopolysaccharides for a better understanding of the structure-property relationships
in injera.

78
REFERENCES
Abdel-Aal, E.-S.M., 2009. Functionality of Starches and Hydrocolloids in Gluten-Free
Foods, in: Gallagher, E. (Ed.), Gluten-Free Food Science and Technology.
Blackwell Publishing Limited, United Kingdom, pp. 200–224.
Abiyu, H.T., Zewdu, A.W., Haki, G.D., 2013. Preparation of injera from pre-fermented
flour: nutritional and sensory quality. Int. J. Sci. Innov. Discov. 3, 165–175.
Abraha, A., Uhlen, A.K., Abay, F., Sahlstrøm, S., Bjørnstad, Å., 2013. Genetic variation
in barley enables a high quality, the Ethiopian staple flat bread, comparable to tef.
Crop Sci. 53, 2040.
Adebowale, A.-R.A., Emmambux, M.N., Beukes, M., Taylor, J.R.N., 2011. Fractionation
and characterization of teff proteins. J. Cereal Sci. 54, 380–386.
Admassu, W., 2006. Injera manufacturing system. United States Patent US 7063008 B2.
Alemayehu, R., 2001. TEF : Post-harvest Operations. Holetta Genet, Ethiopia.
AOAC, 1995. Official Methods of Analysis of AOAC International. AOAC International,
Arlington, Virginia.
Arendt, E.K., Ryan, L. a M., Dal Bello, F., 2007. Impact of sourdough on the texture of
bread. Food Microbiol. 24, 165–74.
Ashagrie, Z., Abate, D., 2012. Improvement of injera shelf life through the use of
chemical preservatives. African J. Food, Agric. Nutr. Dev. 12, 6409–6423.
Ashenafi, M., 2006. A review article on the microbiology of indigenous fermented foods.
Ethiop. J. Biol. Sci. 5, 189–245.
Assefa, K., Aliye, S., Belay, G., Metaferia, G., Tefera, H., Sorrells, M.E., 2011. Quncho:
the first popular tef variety in Ethiopia. Int. J. Agric. Sustain. 9, 25–34.
Autio, K., Laurikainen, T., 1997. Relationships between flour dough microstructure and
dough handling and baking properties. Trends Food Sci. Technol. 8, 181–185.
Baixauli, R., Sanz, T., Salvador, A., Fiszman, S.M., 2008. Muffins with resistant starch:
Baking performance in relation to the rheological properties of the batter. J. Cereal
Sci. 47, 502–509.
79
Baye, K., Mouquet-Rivier, C., Icard-Vernière, C., Picq, C., Guyot, J.-P., 2013. Changes
in mineral absorption inhibitors consequent to fermentation of Ethiopian injera:
implications for predicted iron bioavailability and bioaccessibility. Int. J. Food Sci.
Technol. 1–7.
Belitz, H.-D., Keiffer, R., Seilmeier, W., Weiser, H., 1986. structure and function of
gluten proteins. Cereal Chem. 63, 336–341.
Belton, P.S., Taylor, J.R.N., 2004. Sorghum and millets: protein sources for Africa.
Trends Food Sci. Technol. 15, 94–98.
Bhattacharya, S., Bhat, K.K., 1997. Steady shear rheology of rice-blackgram suspensions
and suitability of rheological models. J. Food Eng. 32, 241–250.
Biliaderis, C.G., 1991. The structure and interactions of starch with food constituents.
Can. J. Physiol. Pharmacol. 69, 60–78.
Blandino, A., Al-Aseeri, M.E., Pandiella, S.S., Cantero, D., Webb, C., 2003. Cereal-
based fermented foods and beverages. Food Res. Int. 36, 527–543.
Bloksma, A.H., 1990. Rheology of the breadmaking process. Cereal. Foods World 35,
226–236.
Boka, B., Woldegiorgis, A.Z., Haki, G.D., 2013. Antioxidant properties of Ethiopian
traditional bread (Injera) as affected by processing techniques and tef grain
(Eragrostis tef (Zucc.)) varieties. Can. Chem. Trans. 1, 7–24.
Bultosa, G., 2007. Physicochemical characteristics of grain and flour in 13 tef [
Eragrostis tef ( Zucc .) Trotter ] grain varieties. J. Appl. Sci. Res. 3, 2042–2050.
Bultosa, G., Hall, A.N., Taylor, J.R.N., 2002. Physico-chemical characterization of grain
tef [Eragrostis tef (Zucc.) Trotter] starch. Starch - Stärke 54, 461–468.
Bultosa, G., Hamaker, B.R., BeMiller, J.N., 2008. An SEC-MALLS study of molecular
features of water-soluble amylopectin and amylose of Tef [. Starch-Starke 60, 8–22.
Bultosa, G., Taylor, J.R.N., 2004. Paste and gel properties and in vitro digestibility of tef
[Eragrostis tef (Zucc.) Trotter] starch. Starch - Stärke 56, 20–28.
Cauvain, S.P., 2007. Other cereals in breadmaking, in: Cauvain, S.P., Young, L.S. (Eds.),
Technology of Breadbaking. Springer, United Kingdom, pp. 371–388.
Cherinet, H., 1988. Development of flours using traditional food crops for making injera.
FAO Library AN:281301, Awassa.

80
Cherinet, H., 1993. Composite flour development for injera. Ethiop. J. Heal. Dev. 7, 71–
77.
Cullen, P.J., Connelly, R.K., 2009. Rheology and Mixing, in: Cullen, P.J. (Ed.), Food
Mixing-Principles and Applications. Wiley-Blackwell, Dublin, pp. 50–72.
D’Silva, T.V., 2009. Modification of the paste properties of maize and teff starches using
stearic acid. MSc thesis, University of Pretoria, South Africa.
Damodaran, S., Parkin, K.L., Fennema, O.R., 2008. Fennema’s Food Chemistry, fourth.
ed. CRC Press/Taylor & Francis, Portland.
Dobraszczyk, B.., Morgenstern, M.., 2003. Rheology and the breadmaking process. J.
Cereal Sci. 38, 229–245.
Dong, W., Hoseney, R.C., 1995. Effect of certain breadmaking oxidants and reducing
agents on dough rheological properties. Cereal Chem. 72, 58–64.
Duncan, J., 2007. Principles and Applications of Mechanical Thermal Analysis, in:
Gabbott, P. (Ed.), Principles and Application of Thermal Analysis. Wiley-
Blackwell, New Jersey, pp. 120–163.
Edema, M.O., Emmambux, M.N., Taylor, J.R.N., 2013. Improvement of fonio dough
properties through starch modification by sourdough fermentation. Starch - Stärke
65, 730–737.
Edwards, N.M., Dexter, J.E., Scanlon, M.G., 2002. Starch participation in durum dough
linear viscoelastic properties. Cereal Chem. 79, 850–856.
Ekris, L., Gamboa, P., 2008. Teff (Survey on the nutritional and health aspects of teff
(Eragrostis Tef)). Cartagena.
FAO, 1999. Fermented Cereals- A Global Perspective. FAO Agric. Serv. Bull. No 138
138.
Forsido, S.F., Ramaswamy, H.S., 2011. Protein rich extruded products from tef , corn and
soy protein isolate blends. Ethiop. J. Appl. Sci. Technol 2, 75–90.
Forsido, S.F., Rupasinghe, H.P.V., Astatkie, T., 2013. Antioxidant capacity, total
phenolics and nutritional content in selected ethiopian staple food ingredients. Int. J.
Food Sci. Nutr. 7486, 1–6.
Fufa, B., Bhute, B., Simons, R., Tareke, B., 2011. Strengthening the Tef Value Chain in
Ethiopia. Ethiopian Agricultural Transformation Agency.

81
Gallagher, E., 2009. Gluten-free Food Science and Technology. Blackwell Publishing
Ltd., Iowa.
Ganzle, M.G., Loponen, J., Gobbetti, M., 2008. Proteolysis in sourdough fermentations:
mechanism and potential for improved bread quality. Trends Food Sci. Technol. 19,
513–521.
Gashe, A., 1985. Involvement of lactic acid bacteria in the fermentation of tef (Eragrosfis
tef), an Ethiopian fermented food. J. Food Sci. 50, 800–801.
Gebrekidan, B., GebreHiwot, B., 1982. Sorghum Injera Preparations and Quality
Parameters, in: Rooney, L.W., Murty, D. (Eds.), International Symposium on
Sorghum Grain Quality. J. V. Mertin, Patansheru, India, pp. 55–66.
Gebremariam, M.M., Zarnkow, M., Becker, T., 2012. Teff (Eragrostis tef) as a raw
material for malting, brewing and manufacturing of gluten-free foods and beverages:
a review. J. Food Sci. Technol. 1–15.
Getenet, G., 2011. Heat Transfer Analysis during the Process of Injera Baking by Finite
Element Method. MSc thesis, Addis Ababa University.
Girma, M., Gashe, B.A., Lakew, B., 1989. The effect of fermentation on the growth and
survival of Salmonella typhimurium , Staphylococcus aureus , Bacillus cereus and
Pseudomonas aeruginosa in fermenting tef ( Eragrostis tef ). M1RCEN Journal, 5,
61–66.
Girma, T., Bultosa, G., Bussa, N., 2013. Effect of grain tef [ Eragrostis tef (Zucc.)
Trotter] flour substitution with flaxseed on quality and functionality of injera. Int. J.
Food Sci. Technol. 48, 350–356.
Goesaert, H., Gebruers, K., Courtin, C.M., Brijs, K., Delcour, J.A., 2006. Enzymes in
breadmaking, in: Hui, Y.H. (Ed.), Bakery Products: Science and Technology.
Blackwell Publishing Limited, Ames, Iowa, pp. 337–364.
Hamada, S., Suzuki, K., Aoki, N., Suzuki, Y., 2013. Improvements in the qualities of
gluten-free bread after using a protease obtained from Aspergillus oryzae. J. Cereal
Sci. 57, 91–97.
Haslam, E., 1974. Polyphenol-proetin interactions. Biochem.J. 139, 285–288.
Hopman, E., Dekking, L., Blokland, M.-L., Wuisman, M., Zuijderduin, W., Koning, F.,
Schweizer, J., 2008. Tef in the diet of celiac patients in The Netherlands. Scand. J.
Gastroenterol. 43, 277–82.

82
Hung, P.V., Yamamori, M., Morita, N., 2005. Formation of enzyme-resistant starch in
bread as affaceted by high-amylase wheat flour substitution. Cereal Chem. 82, 690–
694.
Izydorczyk, M.S., Hussain, A., Macgregor, A.W., 2001. Effect of barley and barley
components on rheological properties of wheat dough. J. Cereal Sci. 34, 251–260.
Jansen, G.R., DiMaio, L.R., Hause, N.L., 1962. Amino acid composition and lysine
supplementation of teff. J Agric Food Chem 10, 62–64.
Kaletunc, G., Breslauer, K.J., 1993. Glass transition of extrudates - relationship with
processing-induced fragmentation and end-product attributes. Cereal Chem. 70,
548–552.
Kamal-Eldin, A., Chiwona-Karltun, L., 2008. Products from traditional grains in Africa,
in: Proceedings from the Second MISTRA Workshop on African Traditional
Products for Health. SIK, Goteborg 23-24 September.
Keiffer, R., 2006. The Role of Gluten Elasticity in the Baking Quality of Wheat, in:
Popper, L., Schäfer, W., Freund, W. (Eds.), Future of Flour-A Compendium of Flour
Improvement. Verlag Agrimedia, pp. 169–178.
Kheterpaul, N., Chauhan, B.M., 1991. Effect of natural fermentation on phytate and
polyphenolic content and in-vitro digestibility of starch and protein of pearl millet
(Pennisetum typhoideum). J. Sci. Food Agric. 55, 189–195.
Kim, S., Willett, J.L., Carriere, C.J., Felker, F.C., 2002. Shear-thickening and shear-
induced pattern formation in starch solutions. Carbohydr. Polym. 47, 347–356.
Lakshminarayan, S.M., Rathinam, V., KrishnaRau, L., 2006. Effect of maltodextrin and
emulsifiers on the viscosity of cake batter and on the quality of cakes. J. Sci. Food
Agric. 86, 706–712.
Lasekan, O., Khalil, S.K., 2010. The significance of glass transition temperature in
processing of selected fried food products : a review. Mod. Appl. Sci. 4, 3–21.
Lawton, J.W., 1992. Viscoelasticity of zein-starch doughs. Cereal Chem. 69, 351–355.
Loponen, J., Mikola, M., Katina, K., Sontag-Strohm, T., Salovaara, H., 2004. Wheat
dough fermentations. Cereal Chem. 81, 87–93.
Maloney, D., Foy, J., 2003. Yeast Fermentations, in: Kulp, K., Lorenz, K. (Eds.),
Handbook of Dough Fermentations. Marcel Dekker, Inc., New York, pp. 43–60.
83
Marco, C., Rosell, C.M., 2008. Breadmaking performance of protein enriched, gluten-
free breads. Eur. Food Res. Technol. 227, 1205–1213.
McManus, J.P., Davis, K.G., Lilley, T.H., Haslam, E., 1981. The association of proteins
with polyphenols. J. Chem. Soc. Chem. Commun. 309b.
Mehta, B.M., Kamal-Eldin, A., Iwanski, R.Z., 2012. Fermentation: Effects on Food
properties. CRC Press, Boca Raton, Florida.
Moore, M.M., Heinbockel, M., Dockery, P., Ulmer, H.M., Arendt, E.K., 2006. Network
formation in gluten-free bread with application of transglutaminase. Cereal Chem.
83, 28–36.
Moroni, A. V., Bello, F.D., Zannini, E., Arendt, E.K., 2011. Impact of sourdough on
buckwheat flour, batter and bread: Biochemical, rheological and textural insights. J.
Cereal Sci. 54, 195–202.
Mukprasirt, A., Herald, T.J., Flores, R., 2000. Rheological characterization of rice flour-
based batters food engineering and physical properties. J. Food Prot. 65, 1194–1199.
Mullineux, G., 2008. Non-linear least squares fitting of coefficients in the Herschel–
Bulkley model. Appl. Math. Model. 32, 2538–2551.
Niranjan, K., Silva, S.F.J., 2008. Food Materials Science Principles and Practice.
Springer Science+ Business Media, LLC, New York.
Oliver, G., Thacker, D., Wheeler, R.J., 1995. Semi-sweet biscuits : 1 . the influence of
sodium performance. J Sci Food Agric 69, 141–150.
Oyewole, O.B., 1997. Lactic fermented foods in Africa and their benefits. Food Control
8, 289–297.
Parker, M., Umeta, M., Faulks, R.M., 1989. The Contribution of flour components to the
structure of injera, an Ethiopian fermented bread made from tef ( Eragrostis tef). J.
Cereal Sci. 10, 93–104.
Petrofsky, K.E., Hoseney, R.C., 1995. Rheological properties of dough made with starch
and gluten from several cereal sources. Cereal Chem. 72, 53–58.
Pyle, D.L., 2005. Crumpet structures-experimental and modelling studies. Food Bioprod.
Process. 83, 81–88.
Qarooni, J., Woottonb, M., Mcmaster, G., 1989. Factors affecting the quality of Arabic
bread - Additional Ingredients. J Sci Food Agric 48, 235–244.

84
Ramachandran, K., Bolodia, G., 1984. The effect of fermentation on the iron,
phosphorous and zinc content of tef (Eragrostis tef). Ethiop. Med. J. 22, 45–48.
Renzetti, S., Arendt, E.K., 2009. Effects of oxidase and protease treatments on the
breadmaking functionality of a range of gluten-free flours. Eur Food Res Technol
229, 307–317.
Renzetti, S., Arendt, E.K., 2009. Effect of protease treatment on the baking quality of
brown rice bread: From textural and rheological properties to biochemistry and
microstructure. J. Cereal Sci. 50, 22–28.
Roos, Y.H., 2010. Glass transition temperature and its relevance in food processing.
Annu. Rev. Food Sci. Technol. 1, 469–96.
Rosell, C.M., Aja, S., Bean, S., Lookhart, G., 2002. Effect of Aelia spp and Eurygaster
spp damage on wheat proteins. Cereal Chem. 79, 801–805.
Rühmkorf, C., Jungkunz, S., Wagner, M., Vogel, R.F., 2012. Optimization of
homoexopolysaccharide formation by lactobacilli in gluten-free sourdoughs. Food
Microbiol. 32, 286–94.
Russ, J.C., 2005. Image analysis of food microstructure. CRC Press LLC, Boca Raton,
Florida.
Sahi, S.S., 1999. Influence of aeration and emulsifiers on cake batter rheology and
textural properties of cakes, in: Campbell, G.M., Webb, C., Pandiella, S.S.,
Niranjan, K. (Eds.), Bubbles in Food. American Association of Cereal Chemists, St
Paul, Minnesota, USA, pp. 263–271.
Sahlin, P., 1999. Fermentation as a method of food processing in fermenting cereals.
Licentiate thesis, Lund Institute of Technology, Lund University, Sweden.
Salmenkallio-Marttila, M., Katina, K., Autio, K., 2001. Effects of bran fermentation on
quality and microstructure of high-fiber wheat bread. Cereal Chem. 78, 429–435.
Schimz, K., 1980. The effect of sulfite on the yeast Saccharomyces cerevisiae. Arch.
Microbiol. 125, 89–95.
Schober, T.J., Bean, S.R., Boyle, D.L., 2007. Gluten-free sorghum bread improved by
sourdough fermentation: biochemical , rheological, and microstructural background.
J. Agric. Food Chem. 55, 5137–5146.
Sciarini, L.S., Ribotta, P.D., León, A.E., Pérez, G.T., 2008. Influence of gluten-free
flours and their mixtures on batter properties and bread quality. Food Bioprocess
Technol. 3, 577–585.
85
Shelke, K., C., H., Faubion, J.M., Curran, S.P., 1992. Age-related changes in the
properties of batters made from flour milled from freshly harvested soft wheat.
Cereal Chem. 69, 145–147.
Shewry, R.P., Tatham, A.S., Barro, F., Barcelo, P., Lazzeri, P., 1995. Biotechnology of
breadmaking: unraveling and Mmnipulating the multi-protein gluten complex.
Biotechnology 13, 1185–1190.
Spaenij-Dekking, L., Kooy-Winkelaar, Y., Koning, F., 2005. The Ethiopian cereal tef in
celiac disease. N. Engl. J. Med. 353, 1748–9.
Spicher, G., Nierle, W., 1988. Proteolytic activity of sourdough bacteria. Appl.
Microbiol. Biotechnol. 28, 487–492.
Stanley, D.W., Baker, K.W., 2002. A Simple Laboratory Exercise in Food
Structure/Texture Relationships Using a Flatbed Scanner. J. Food Sci. Educ. 1, 6–9.
Steinkraus, K.H., 1996. Handbook of indigenous fermented foods, second. ed, Handbook
of indigenous fermented foods. Marcel Dekker, New York.
Stewart, R.B., Getachew, A., 1962. Investigations of the nature of injera. Econ. Bot. 16,
127–130.
Stolz, P., 2003. Biological fundamentals of yeast and lactobacilli fermentation in bread
dough, in: Kulp, K., Lorenz, K. (Eds.), Handbook of Dough Fermentations. Marcel
Dekker, Inc., New York.
Taylor, J.R.N., Emmambux, M.N., 2008. Gluten-free foods and beverages from millets,
in: Arendt, E.K., Bello, F.D. (Eds.), Gluten-Free Cereal Products and Beverages.
Academic Press, Burlington, Masachusettes, pp. 119–148.
Thiele, C., Ganzle, M.G., Vogel, R.F., 2002. Contribution of sourdough lactobacilli, yeast
and cereal enzymes to the generation of amino acids in dough relevant for bread
flavour. Cereal Chem. 79, 45–51.
Tsegay, M., 2011. Design and manufacture of laboratory model for solar powered injera
baking Oven. MSc thesis, Addis Ababa Institute of Technology.
Umeta, M., Faulks, R.M., 1988. The effect of fermentation on carbohydrates in tef
(Eragrostis tef). Food Chem. 27, 181–189.
Umeta, M., Parker, M., 1996. Microscopic studies of the major macro-components of
seeds, dough and injera from tef (Eragrostis tef). SINET Ethiop. J. Sci. 19, 141–148.
86
Umeta, M., West, C.E., Fufa, H., 2005. Content of zinc, iron, calcium and their
absorption inhibitors in foods commonly consumed in Ethiopia. J. Food Compos.
Anal. 18, 803–817.
Urga, K., Narasimha, H.V., 1997. Effect of natural fermentation on HCL-extractability of
minerals from tef (Eragrostis tef). Bull. Chem. Soc. Ethiop. 11, 3–10.
Valjakka, T., Kerojoki, H., Katina, K., 2003. Sourdough bread in Finland and Eastern
Europe, in: Kulp, K., Lorenz, K. (Eds.), Handbook of Dough Fermentations. Marcel
Dekker, New York, pp. 269–303.
Vallons, K.J.R., Ryan, L. a. M., Arendt, E.K., 2011. Promoting structure formation by
high pressure in gluten-free flours. LWT - Food Sci. Technol. 44, 1672–1680.
Velioglu, Y.S., Mazza, G., Gao, L., Oomah, B.D., 1998. Antioxidant activity and total
phenolics in selected fruits, vegetables, and grain products. J. Agric. Food Chem. 46,
4113–4117.
Wang, F.C., Sun, X.S., 2002. Frequency dependence of viscoelastic properties of bread
crumb and relation to bread staling. Cereal Chem. 79, 108–114.
Wehrle, K., Arendt, E.K., 1998. Rheological changes in wheat sourdough during
controlled and spontaneous fermentation. Cereal Chem. 75, 882–886.
Welti-Chanes, J., Vergara-Balderas, F., Perez, E., Bermudex, D., Valdex-Fragose, A.,
Mujica-Paz, H., 2008. Phase transitions and hygroscopicity in chewing gum
manufacture, in: Gutierrez-Lopez, G.F., Barbosa-Canovas, G.V., Welti-Chanes, J.,
Para-Arias, E. (Eds.), Food Engineering: Integrated Approaches. Springer, New
York, pp. 139–153.
Wyman, C.E., Decker, S.R., Himmel, M.E., Brady, J.W., Skopec, C.E., 2005. Hydrolysis
of Cellulose and Hemicellulose, in: Demetriu, S. (Ed.), Polysaccharides: Structural
Diversity and Functional Versatility. Marcel Dekker, New York, pp. 1–39.
Xue, J., Ngadi, M., 2006. Rheological properties of batter systems formulated using
different flour combinations. J. Food Eng. 77, 334–341.
Yetneberk, S., 2004. Sorghum injera quality improvement through processing and
development of cultivar selection criteria. PhD thesis, University of Pretoria, South
Africa.
Yetneberk, S., de Kock, H.L., Rooney, L.W., Taylor, J.R.N., 2004. Effects of sorghum
cultivar on injera quality. Cereal Chem. 81, 314–321.

87
Yetneberk, S., Rooney, L.W., Taylor, J.R., 2005. Improving the quality of sorghum injera
by decortication and compositing with tef. J. Sci. Food Agric. 85, 1252–1258.
Zannini, E., Jones, J.M., Renzetti, S., Arendt, E.K., 2012. Functional replacements for
gluten. Annu. Rev. Food Sci. Technol. 3, 227–45.
Zegeye, A., 1997. Acceptability of injera with stewed chicken. Food Qual. Prefer. 8,
293–295.
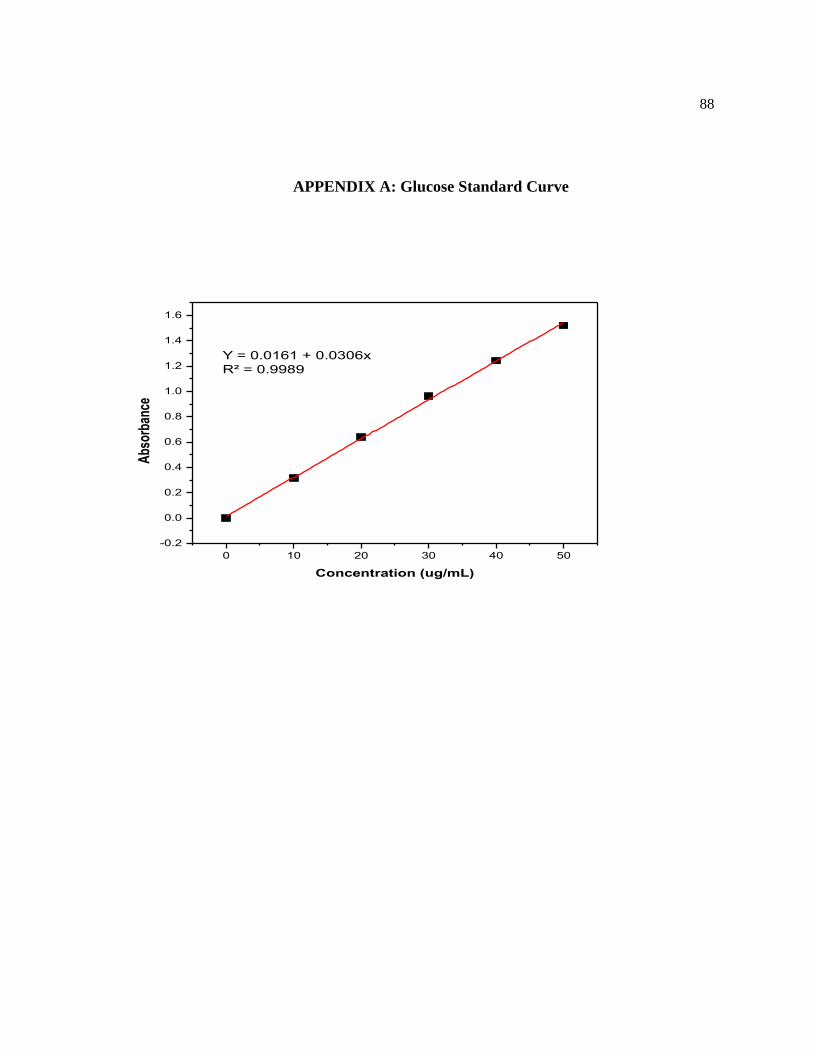
88
APPENDIX A: Glucose Standard Curve
0 10 20 30 40 50
-0.2
0.0
0.2
0.4
0.6
0.8
1.0
1.2
1.4
1.6
Y = 0.0161 + 0.0306x
R² = 0.9989
Abs
orba
nce
Concentration (ug/mL)
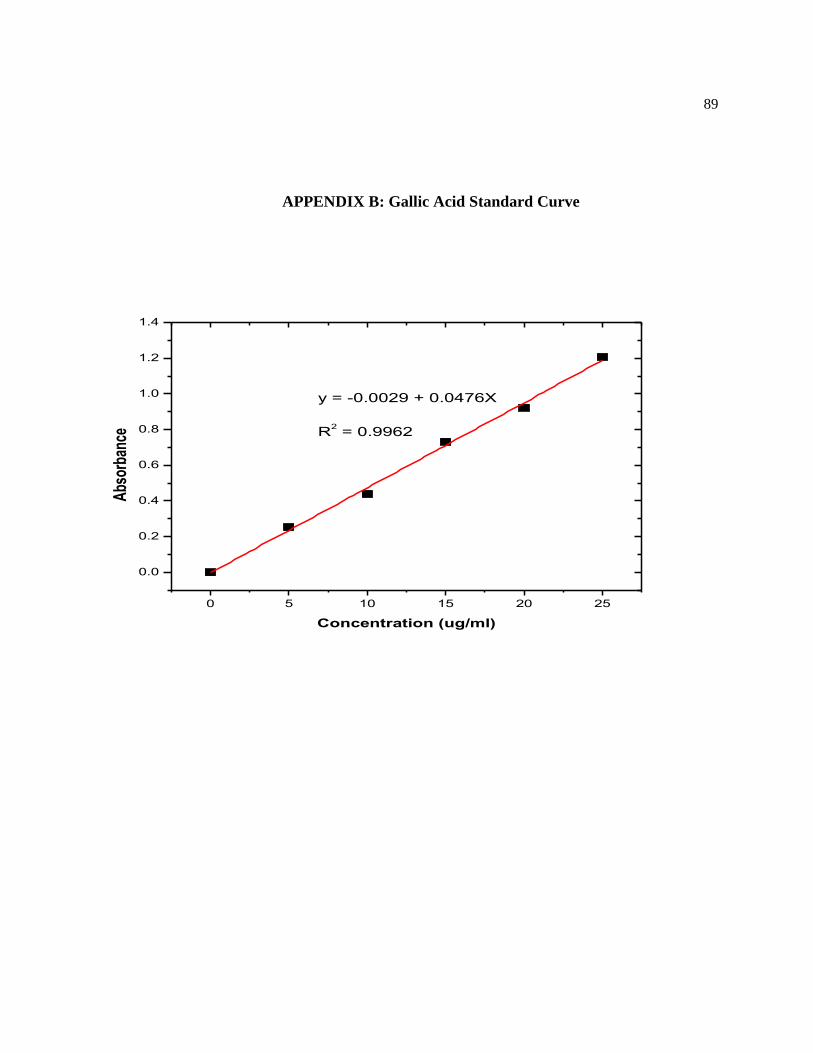
89
APPENDIX B: Gallic Acid Standard Curve
0 5 10 15 20 25
0.0
0.2
0.4
0.6
0.8
1.0
1.2
1.4
y = -0.0029 + 0.0476X
R2 = 0.9962
Abs
orba
nce
Concentration (ug/ml)
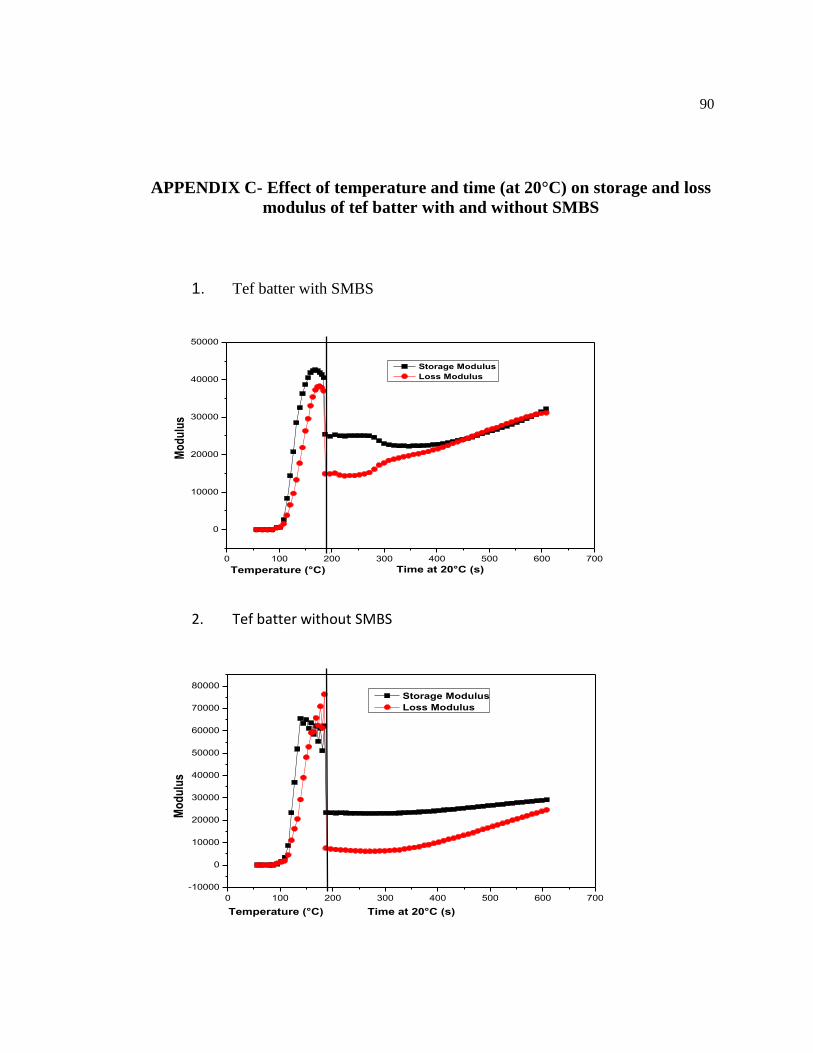
90
APPENDIX C- Effect of temperature and time (at 20°C) on storage and loss
modulus of tef batter with and without SMBS
1. Tef batter with SMBS
0 100 200 300 400 500 600 700
0
10000
20000
30000
40000
50000
Storage Modulus
Loss Modulus
Mo
du
lus
Time at 20°C (s)Temperature (°C)
2. Tef batter without SMBS
0 100 200 300 400 500 600 700
-10000
0
10000
20000
30000
40000
50000
60000
70000
80000
Storage Modulus
Loss Modulus
Mo
du
lus
Time at 20°C (s)Temperature (°C)