Embed Size (px)
Citation preview

Influence of initial power stabilization over crystalline-Si photovoltaic modules maximum power M.A. Munoz1*, F. Chenlo2 and M.C. Alonso-García2
1 EUlTAgrícola, UPM, Madrid, Spain 2 PVLabDER, CIEMAT, Madrid, Spain
ABSTRACT
Measurements that suppliers offer in specification sheets are not always close to the actual power measured in independent laboratories such as CIEMAT. Independent measurements tend to be lower than those printed on the label sometimes even lower than the allowed tolerance indicated by the manufacturer on the same label. Furthermore, a potentially significant power reduction has been reported when Standard EN50380 (which requires photovoltaic (PV) modules to be exposed to more than 20kWh/m2 of sunlight prior to taking the measurements that appear on the label) is followed. This is the initial power stabilization and this work studies the power stabilization that tends to appear in crystalline PV modules. Crystalline PV modules usually decrease in power around 1 %, but decreases >4% have also been reported. These power losses are only detected after the mentioned power stabilization.
KEYWORDS
photovoltaic module; light-soaking; power conditioning; power stabilization
'Correspondence
M.A. Munoz, EUIT Agrícola, Dep. Ingeniería Rural, Electrotecnia, UPM, Avda. Complutense s/n, 28040 Madrid, Spain.
E-mail: [email protected]
1. INTRODUCTION
The Spanish photovoltaic (PV) market has expanded tremendously in the last few years. At the end of 2007, installed PV power was around 750 MW. Two years later, at the end of 2009, cumulated installed capacity was 3520.1 MW [1]. Most of the PV modules installed were of crystalline Si technology and this work is focused in crystalline Si technology.
One of the consequences of the massive installation of PV modules has been the rise of new companies, dealers, and manufacturers. Following the ASIF report [2], PV Spanish industry in 2009 had a PV production capacity of 1071 MW (an increase of 180MW with respect to 2008). This increase is explained because of the setting up of new manufacturers in national territory, some of them starting their production in year 2009, and the production capacity variations of consolidated manufacturers. The customer needs to know, as early as possible, the power that PV modules will provide when the plant is under operation. In order to fulfill this requirement, suppliers offer the list of electrical characteristics of PV modules, known as the "flash list," where customers can see the power that the module is expected to provide. The initial calibration of the
supplier's measurement method may ensure that the total PV modules' power bought to a supplier is accurate. This calibration should be performed in an independent laboratory, such as CIEMAT PV laboratory, that has the proper infrastructure to determine the I-V curve at standard test conditions (STC) [3-6]. If the measurements are taken indoors in other conditions different to STC, corrections procedures are necessary to apply in order to extrapolate power readings to STC [5-7].
In order to calibrate and tune the supplier and the independent laboratory devices for measurements, a population sample no smaller than 10 PV modules should be used to determine whether the supplier is using a correct method of measurement. If a population sample is not tested, non-correlated differences may appear between measurements given by the flash list and those taken in an independent system [8].
Even when the mentioned method is observed, suppliers often do not take into account several variables that may affect the power that a PV panel actually provides under operation. One of these variables is the Light Soaking Effect, which affects the PV modules maximum power and results in less power than expected. As the manufacturers' measurements tend to lie closer to the lower limit of the

allowed margin of power supplied, the result of the Light Soaking Effect is that the power level may fall below the margin [9].
Some owners do not know the actual power of their PV modules until they have been installed in the plant because these losses are not taken into account. In the case of PV modules made of technologies such as CdTe and CIS, the measured maximum power supplied increases after the modules have been exposed to sunlight for a few hours. In such cases, many manufacturers have an interest in testing PV modules after stabilization.
It is necessary to establish a unique measuring protocol and to observe EN 50380 [10]. It is necessary to observe not only the quantity of sunlight exposure, but also how the light is applied to the PV module, paying special attention to the time that passes between the light exposure and the measurement.
The actual peak power of PV modules is related to the peak power of the whole plant. In order to know the real cause of a lower-than-expected measurement of energy supplied by the PV plant, it is essential to know whether modules installed in the plant will suffer a significant power decrease in their initial days of operation.
It is necessary to differentiate between stabilization and degradation. Power stabilization is the period in which power levels often drop from an initial power level within the first few days of sunlight exposure (according to EN 50380 20kWh/m2 of sunlight exposure are necessary prior to power measurements taken by the manufacturer). However, manufacturers often consider this initial decrease in power to be part of the assumed degradation of long-term sunlight exposure. There are many studies on long-term degradation [11-13]. Some of them present models to predict the future power that PV modules will supply [14]. These studies usually consider power loss as a lineal effect. However, in their discussions of power loss, many of these studies fail to recognize that the initial power stabilization concludes within the first few days of the PV module's usage. Thus, the power lost during the initial power stabilization should not be considered part of the long-term power degradation.
Within this context, this paper shows several different cases of stabilization for different PV module types from different manufacturers. The power losses after the stabilization have been quantified in terms of percentage over initial power. Some suggestions are also provided for minimizing power calculation errors when calculating the actual peak power offered by a PV module.
2. MATERIALS AND METHODS
2 .1 . The solar simulator
The solar simulator, a class AAA single pulse flash solar simulator, allowed the acquisition of the I-V electrical characteristic curve of a PV module situated vertically in front of the light source.
The device was manufactured by Pasan/Belval (Valan-gin, Switzerland; www.belval.com) and consisted of specially developed Xenon lamps and light box, a flash generator, an electronic load, and a PC-based data processing. Its light source, formed by four xenon lamps, allowed a good simulation of the actual solar radiation. Additionally, filters were used in order to improve the spectral distribution. Xenon lamps were powered by a battery of capacitors that could supply the energy necessary to generate a light pulse of 10 ms where the illuminated area could receive 1000 W/m2. The light source was situated inside a full black tunnel to avoid reflections. The generated light should pass through a collimator and a distance of 8 m between flashlamp and device under test was observed in order to obtain the desired uniformity.
A light pulse illuminated the PV module under test. The electronic load connected to the PV module swept the voltage from a reverese-bias condition and beyond Voc, thus a data of I-V curve were obtained and registered by a PC-based data processing. The resulting measurements were extrapolated into Standard Conditions of Measurement consisting of:
• Solar irradiance: 1000 W/m . • Solar cell temperature: 25 °C • Spectral distribution of irradiance: AM1.5G (IEC
60904-3) • Normal incidence over the cell.
Inside the simulator, conditions were very close to STC with little deviation (25 ± 2 °C and 1000 ± 5 W/m2). Using module temperature coefficients (a and ¡3) and irradiance correction factors, the obtained measurements were extrapolated to STC (see IEC 60891 Standard [6]). Special care was taken in ensuring that PV modules had not received direct solar light before the first round of measurements.
A calibrated reference cell was used to measure solar simulator irradiance at the moment of the measurements. Stability of the flash pulse was also measured. Besides, in order to determine if the simulator and every element involved in the measurement were operating correctly, two reference modules were used. A measurement was taken from both of them. These measurements should not have a difference >0.5% than the real known value. Each reference module was made of a different material, i.e., one was made of monocrystalline silicon cells and the other one of multicrystalline cells.
2.2. Method
The method consisted of the testing different set of modules. Each set was considered a sample. All the samples were composed of a minimum of four modules that had not been previously exposed to sunlight. An initial power measurement of each module was taken inside the simulator to obtain the initial power level before any

sunlight exposure. Once the initial results were obtained, a subset of two modules was selected from each set to be exposed to natural sunlight; the selected modules remained under exposure for a varying period of time depending on the season in order to receive between 20 and 40 kWh/m of cumulative solar radiation (see EN 50380 Standard). The subset of non-exposed modules served as control group.
Once exposed PV modules had received enough cumulative radiation, a new measurement was taken. This measurement was once again performed under STC inside the solar simulator (see Figure 1). In order to determine the measurements' validity, the electrical characteristic curve of non-exposed modules was taken as well, verifying that the solar simulator measurements remained constant and thus avoiding uncontrolled changes in the measuring conditions.
An average power loss was obtained from each subset of exposed modules. The average power loss must be >2% to be considered significant. Power losses of lesser value should not be considered significant due to uncertainty in the measurement process. However, when larger samples were available to be analyzed, power losses between 1% and 2% should be considered a valuable tendency. Such was the case in this analysis.
In this study, 64 samples were tested. Modules forming a sample were of the same model and thus made of the same technology and by the same manufacturer. Usually each sample was formed of four modules and measurements of two of these modules were obtained before and after being exposed to sunlight. However, sometimes it was possible to use sets of more than four modules and in these cases, it was possible to obtain measurements before and after sunlight exposure of up to six modules of the same kind.
The 64 samples consisted of 37 samples of m-Si and 27 samples of mc-Si. Samples of the same manufacturer and the same technology were grouped resulting in 24 grouped-samples (101 modules) of m-Si and 22 grouped-samples (78 modules) of mc-Si from different manufacturers. In total 46 grouped-samples consisting of a total of 179 PV modules were tested.
• •>•!• I'll! vjtiaki PY mEXJLUs !:n;iL ulion a l impia al n: * twcwMHl ia i le ,us l ! * • stínuH be Iflkefl In mdtt |Q «níb/rt fl ptMWB
pfotrsn ol pcaK pawci1055. I
Nominal power of the analyzed modules varied from 150 to 240 Wp. A comparative analysis was carried out, taking into consideration the following aspects:
• Type of technology: monocrystalline versus multicrys-talline silicon.
• Manufacturers of the modules.
When a significant power loss was detected after sunlight exposure higher than 20 kWh/m2, it could be said that the PV module presented a problem of power loss during initial power stabilization. Even if power losses were not reported, PV modules may still present stabilization effects: without knowing a module's history, it was impossible to determine whether a module had previously been exposed to sunlight for enough time to reach its definitive power stabilization. In order to minimize this problem, it is recommended that these measurements are performed over the largest possible samples.
3. RESULTS AND DISCUSSION
Some conclusions can be obtained from the analysis of this study's results. For instance, it can be determined if different types of technology present different responses to the initial power stabilization and also whether valuable differences between different PV module manufacturers are registered.
3.1 . Monocrystalline versus multicrystalline silicon
Measurement results clearly indicate a tendency for monocrystalline silicon PV modules to show a greater initial power loss than that of multicrystalline silicon PV modules (see Figure 2). The average difference between the two kinds of technology is about 1%. This does not imply that monocrystalline technology presents a worse quality level, but rather that the final stabilized power should always be measured after the mentioned initial sunlight exposure. On the other hand, the initial power loss must be considered. This initial loss will be higher in monocrystalline silicon PV modules and will also vary from one manufacturer to another.
Feah EOA^r fl3ci&¿5^rtfi staljiliiJíl --• • i. I . I -> . y< m:-^:
ntmtm] umpu
Figure 1. A scheme of the method. Figure 2. Different technologies comparison.
Variations al power' alter Initial exposure Tor m-3l Modules
2SFÜ
1 . 0 *
0,0%
-1,01%
-2,0%
-3,Críó
-4,9%
•5.0%
-«.0%
-7JJ*
>v V * . \ •* »
A
A
• m-Si modules
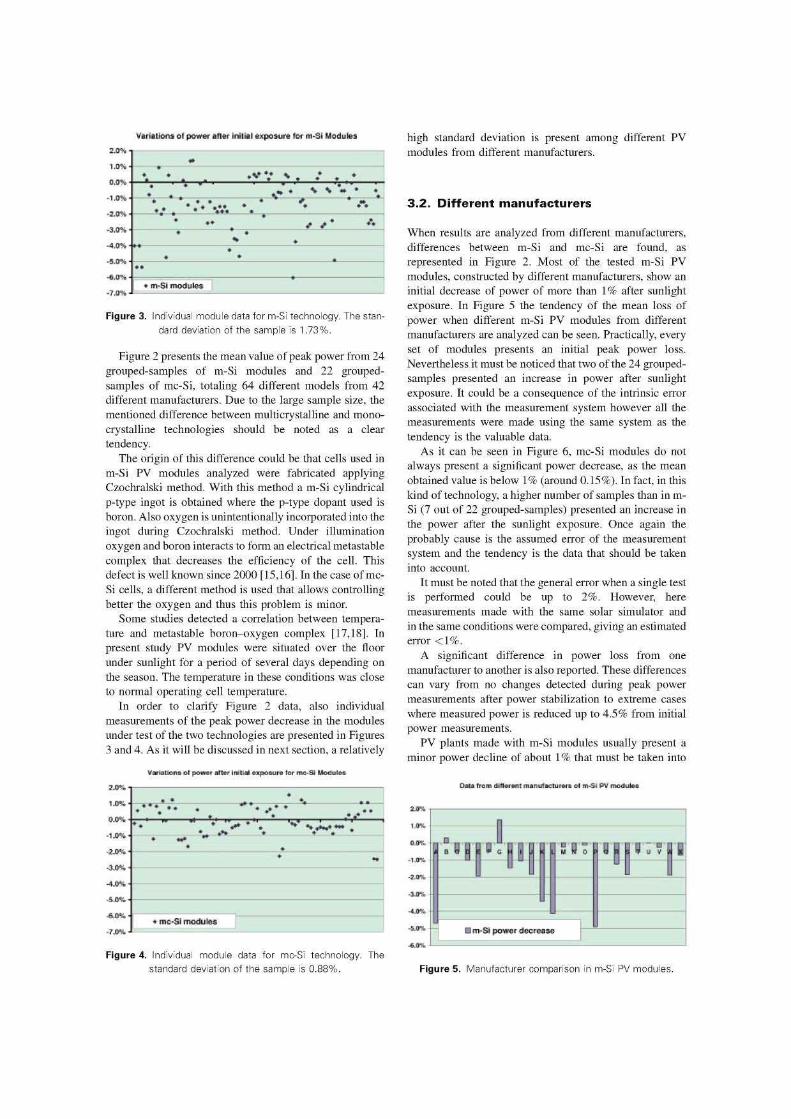
Figure 3. Individual module data for m-Si technology. The stan
dard deviation of the sample is 1.73%.
Figure 2 presents the mean value of peak power from 24 grouped-samples of m-Si modules and 22 grouped-samples of mc-Si, totaling 64 different models from 42 different manufacturers. Due to the large sample size, the mentioned difference between multicrystalline and mono-crystalline technologies should be noted as a clear tendency.
The origin of this difference could be that cells used in m-Si PV modules analyzed were fabricated applying Czochralski method. With this method a m-Si cylindrical p-type ingot is obtained where the p-type dopant used is boron. Also oxygen is unintentionally incorporated into the ingot during Czochralski method. Under illumination oxygen and boron interacts to form an electrical metastable complex that decreases the efficiency of the cell. This defect is well known since 2000 [15,16]. In the case of mc-Si cells, a different method is used that allows controlling better the oxygen and thus this problem is minor.
Some studies detected a correlation between temperature and metastable boron-oxygen complex [17,18]. In present study PV modules were situated over the floor under sunlight for a period of several days depending on the season. The temperature in these conditions was close to normal operating cell temperature.
In order to clarify Figure 2 data, also individual measurements of the peak power decrease in the modules under test of the two technologies are presented in Figures 3 and 4. As it will be discussed in next section, a relatively
Variations of power aliar Initial exposure tor mc-St Modules
2.0%
1J0%
U A
• I J O %
?.(i = :.
-3.0%
-4J0%
-5jy%
*J*%
•7.0%
* —• H i — V •• » •> "HT—• ^
• mc-Si modules
high standard deviation is present among different PV modules from different manufacturers.
3.2. Different manufacturers
When results are analyzed from different manufacturers, differences between m-Si and mc-Si are found, as represented in Figure 2. Most of the tested m-Si PV modules, constructed by different manufacturers, show an initial decrease of power of more than 1% after sunlight exposure. In Figure 5 the tendency of the mean loss of power when different m-Si PV modules from different manufacturers are analyzed can be seen. Practically, every set of modules presents an initial peak power loss. Nevertheless it must be noticed that two of the 24 grouped-samples presented an increase in power after sunlight exposure. It could be a consequence of the intrinsic error associated with the measurement system however all the measurements were made using the same system as the tendency is the valuable data.
As it can be seen in Figure 6, mc-Si modules do not always present a significant power decrease, as the mean obtained value is below 1% (around 0.15%). In fact, in this kind of technology, a higher number of samples than in m-Si (7 out of 22 grouped-samples) presented an increase in the power after the sunlight exposure. Once again the probably cause is the assumed error of the measurement system and the tendency is the data that should be taken into account.
It must be noted that the general error when a single test is performed could be up to 2%. However, here measurements made with the same solar simulator and in the same conditions were compared, giving an estimated error <1%.
A significant difference in power loss from one manufacturer to another is also reported. These differences can vary from no changes detected during peak power measurements after power stabilization to extreme cases where measured power is reduced up to 4.5% from initial power measurements.
PV plants made with m-Si modules usually present a minor power decline of about 1% that must be taken into
Dala Tram dure* anl nnanüTKlutfer* or m-Si PV medula*
2J>%
1,0%
O-fPS.
-1-0%
-Í.IFS.
•3jyr¿
-uní.
-5JJ%
* n %
9fifj^p[ W H O ¡ y jt s u L v w '*.
n • m-Si power decrease
Figure 4. Individual module data for mc-Si technology. The
standard deviation of the sample is 0.88%. Figure 5. Manufacturer comparison in m-Si PV modules.

Data (rom diffenenl manufacturers ol mc-Si PV mn-diiles
1 0 %
-SJIH
. . l l 1 2 S A
•--•-. .1 M 11 • .• is 'i ••- 14 •: lit -il <u 2i a
• mc-Si power decrease
Figure 6. Manufacturer comparison in mc-S¡ PV modules.
account. In some cases, a greater power decline could also occur during the initial days of operation due to initial power stabilization. According to the previously mentioned results (Figure 7) it sometimes reached >4%.
In order to detect a power decline, it is necessary to perform power stabilization over a sample selected from the total population of modules to be installed. If a power decline is detected, a claim should be made to the manufacturers prior to the installation of the total population of PV modules.
flash list. According to Alonso-Abellá et al. [8], the mean value of this difference is —1.6%, but it may vary from +4% to —12%. This implies that the real power may not fall inside the allowed margin.
Furthermore, the measured power values appearing on the flash list were taken prior to the sunlight exposure required by EN 50380. This is particularly problematic in modules made of monocrystalline technology; in the case of these modules, the final power may be much lower than the values on the flash list. If data from the mentioned study and the mean power loss value detected in this study for monocrystalline modules are taken into account, the difference between flash list measurements and the actual power obtained from a PV module in STC after the sunlight exposure needed for power stabilization could be around -2.5%.
The measurements appearing on the flash list are taken in a solar simulator. Logically, a manufacturer cannot expose all of the modules to sunlight before taking the flash list measurements. A good method, nevertheless, would be to expose a sample of the total population in order to know if a power stabilization effect will appear within the initial days of operation.
4. CONCLUSIONS
3.3. Problem with measurements in flash lists
When an independent PV laboratory performs measurements on a sample of PV modules to be installed in a PV plant, there are often differences between laboratory results and power values indicated by manufacturers in the list of electrical characteristics of supplied PV modules (flash list). Beyond the indicated nominal power listed on the module's label, there is an allowed tolerance, or margin of power. If the difference between the nominal power and the power indicated on the flash list is lower than the allowed power tolerance, manufacturers may argue that the difference does not comprise a problem. However, the power of a PV module measured in an independent laboratory is usually lower than the power indicated on the
ÜSÍÍL^Siíí^íi^
- Btfore exposire * Pin an before
- Alter exposure • Pin a* after
Figure 7. Example of high peak power loss.
Generally, PV modules made of monocrystalline silicon cells and also those made of multicrystalline cells suffer an initial small peak power loss that is known as power stabilization. According to the results of this paper, the mentioned peak power loss is slightly higher in mono-crystalline PV modules. In multicrystalline technology, the power loss is not significant (>1%) and in monocrystalline PV modules it is slightly >1%. Additionally, significant differences can be found between manufacturers. In some cases the initial nominal power loss is >4%.
In order to determine a reliable value for the real nominal power of the modules and also of the whole plant, an initial analysis of a sample of modules that will be used in the plant is recommended. Modules in the sample should be randomly chosen. The analysis must take into account that modules should not be exposed to sunlight prior to the analysis. Finally, the analysis should include a power stabilization test so that the costumer can know the mean value of the peak power loss after the first exposure to sunlight in which the modules receive between 20 and 40kWh/m cumulative solar radiation.
REFERENCES
1. Eurobserv'er. Photovoltaic barometer. Systémes Solaires le journal du photovoltai'que 2010; 3: 131— 133.
2. Asociación de la Industria Fotovoltaica (ASIF). Hacia la implantación de la fotovoltaica española. Informe anual, 2010.

3. International Electrotechnical Commission. Standard IEC 60904-1: Photovoltaic Devices. Part 1: Measurement of Photovoltaic Current-Voltage Characteristics. IEC Central Office: Geneva, Switzerland, 2006.
4. International Electrotechnical Commission. Standard IEC 60904-3: Photovoltaic Devices. Part 3: Measurement Principles for Terrestrial Photovoltaic (PV) Solar Devices with Reference Spectral Irradiance Data. IEC Central Office: Geneva, Switzerland, 2008.
5. International Electrotechnical Commission. Standard IEC 60904-9: Photovoltaic Devices. Part 9: Solar Simulator Performance Requirements. IEC Central Office: Geneva, Switzerland, 2007.
6. International Electrotechnical Commission. Standard IEC-60891. Procedures for Temperature and Irradiance Corrections to Measured I-V Characteristics of Crystalline Silicon PV Devices (1st edition). IEC Central Office: Geneva, Switzerland, 1987.
7. Marion B. A method for modeling the current-voltage curve of a PV module for outdoor conditions. Progress in Photovoltaics: Research and Applications 2002; 10: 205-214.
8. Alonso-Abellá M, Silva JP, Fabero F, Vela N, Chenlo F. PV Module Peak Power: Comparison Between Manufacturer Data and Laboratory Results. Proceedings of the 23th European Photovoltaic Solar Energy Conference and Exhibition, 2008; 2837-2840.
9. Fabero F, Vela N, Chenlo F. Analysis by sampling of large-scale commercial production of PV modules. Proceedings of the 19th European Photovoltaic Solar Energy Conference and Exhibition, June, Paris, 2004; 2701-2704.
10. European Committee for Electrotechnical Standariza-tion, CENELEC "Standard EN 50380: Datasheet and Nameplate Information for Photovoltaic Modules" CENELEC Central Secretariat: Rue de Stassart 35, B 1050 Brussels, 2003.
11. Vazquez M, Rey-Stolle I. Photovoltaic module reliability model based on field degradation studies. Progress in Photovoltaics: Research and Applications 2008; 16: 419^133.
12. Osterwald CR, Benner JP, Pruett J, Anderberg A, Rummeland S, Ottoson L. Degradation in weathered crystalline-silicon PV modules apparently caused by UV radiation. Third World Conference on Photovoltaic Energy Conversion, Osaka, Japan, 2003; 2911— 2915.
13. Reis AM, Coleman NT, Marshall MW, Lehman PA, Chamberlain CE. Comparison of PV module performance before and after 11-years of field exposure. Proceedings of the 29th IEEE Photovoltaic, 2002; 1432-1435.
14. Coit DW, Evans JL, Vogt NT, Thomson JR. A method for correlating field life degradation with relaibility prediction for electronic modules. Quality and Reliability Engineering International 2005; 21: 715-726.
15. Green MA. Crystalline and thin-film silicon solar cells: state of the art and future potential. Solar Energy 2003; 74: 181-192.
16. Rein S, Warta W, Glunz SW. Investigation of carrier lifetime in P-type CZ-silicon: specific limitations and realistic prediction of cell performance. Conference Proceedings of the 28th IEEE Specialists Conference, Anchorage, Alaska, 2000; 57-60.
17. Bothe K, Hezel R, Schmidt J. Recombination-enhanced formation of the metastable boron-oxygen complex in crystalline silicon. Applied Physics Letters 2003; 83(6): 1125-1127.
18. Schmidt J, Bothe K, Hezel R. Formation and annihilation of the metastable defect in boron-doped Czochralski silicon. Proceedings of the 29th IEEE PVSC, 2002; 178-181.