Embed Size (px)
Citation preview

Engle, R. J. Maddock and A. J. SmartT. J. Koger, D. M. Wulf, A. D. Weaver, C. L. Wright, K. E. Tjardes, K. S. Mateo, T. E.
acid profile of longissimus musclesteers on carcass characteristics, meat quality, retail-case life of ground beef, and fatty
Influence of feeding various quantities of wet and dry distillers grains to finishing
doi: 10.2527/jas.2009-2708 originally published online June 18, 20102010, 88:3399-3408.J ANIM SCI
http://jas.fass.org/content/88/10/3399the World Wide Web at:
The online version of this article, along with updated information and services, is located on
www.asas.org
at Magrath Library, Serials Department on May 16, 2012jas.fass.orgDownloaded from

ABSTRACT: Two hundred forty Angus crossbred steers were used to determine the influence of feeding various quantities of wet and dry distillers grains to finishing steers on carcass characteristics, meat quality, retail-case life of ground beef, and fatty acid profile of LM. Three replications of 5 dietary treatments were randomly applied to 15 pens in each of 2 yr. A finish-ing diet containing dry-rolled corn, soybean meal, and alfalfa hay was fed as the control diet. Wet distillers grains with solubles (DGS) or dry DGS was added to the finishing diets at either 20.0 or 40.0% of the dietary DM to replace all soybean meal and part of the cracked corn in treatment diets. Carcasses of steers fed DGS had greater (P < 0.05) fat thickness (1.47 vs. 1.28 cm), greater (P < 0.05) USDA yield grades (3.23 vs. 2.94), and smaller (P < 0.05) percentage of yield grades 1 and 2 (41.1 vs. 60.4%) than carcasses of steers fed the con-trol diet. Longissimus muscle from steers fed dry DGS had greater (P < 0.05) ultimate pH values (5.52 vs. 5.49) than LM from steers fed wet DGS. Ground beef
from steers fed DGS had greater (P < 0.05) concentra-tions of α-tocopherol (1.77 vs. 1.43 µg/g) than ground beef from steers fed the control diet. Ground beef from steers fed 40% DGS had greater (P < 0.05) thiobar-bituric acid-reactive substances (2.84 vs. 2.13 mg/kg) on d 2 of retail display than ground beef from steers fed 20% DGS. Longissimus muscle of steers fed DGS had less (P < 0.05) C17:0 and more (P < 0.05) C18:0, C18:1t, C16:1c9, C18:2c9c12 (where t is trans and c is cis), and total PUFA than LM of steers fed the control diet. Feedlot steers fed DGS may need to be marketed earlier than normal to avoid excess external fat and carcasses with a greater numerical yield grade. These data suggest feeding DGS to finishing steers will have no adverse or beneficial effects on glycolytic variables (dark cutters), retail display life of ground beef, or meat tenderness. However, beef from cattle finished on diets containing DGS will likely have a greater proportion of PUFA and therefore may be more susceptible to oxida-tive rancidity.
Key words: beef, carcass quality, distillers grains, retail display
©2010 American Society of Animal Science. All rights reserved. J. Anim. Sci. 2010. 88:3399–3408 doi:10.2527/jas.2009-2708
INTRODUCTION
From 1999 through 2008, the production capacity of the fuel ethanol industry in the United States increased from 1.5 million gallons (5.68 million liters) per year to approximately 9 million gallons (34.1 million liters) per year (Renewable Fuels Association, 2009). This in-crease in production capacity has resulted largely from the development of dry-milling production facilities. Distillers grains with solubles (DGS) is the primary coproduct feed generated during the dry-milling pro-duction process.
Previous research has clearly demonstrated the util-ity and limitations of DGS inclusion in the diets of growing and finishing cattle with respect to animal
Influence of feeding various quantities of wet and dry distillers grains to finishing steers on carcass characteristics, meat quality, retail-case
life of ground beef, and fatty acid profile of longissimus muscle1
T. J. Koger,*2 D. M. Wulf,* A. D. Weaver,*3 C. L. Wright,* K. E. Tjardes,*4 K. S. Mateo,* T. E. Engle,† R. J. Maddock,*5 and A. J. Smart*
*Department of Animal and Range Sciences, South Dakota State University, Brookings 57007; and †Department of Animal Sciences, Colorado State University, Ft. Collins 80523
1 Published with approval of the director of the South Dakota Ag-ric. Exp. Stn. as Publ. No. 3640 of the Journal Series. This research was funded in part by a grant from the South Dakota Beef Industry Council (Pierre), the South Dakota Corn Utilization Council (Sioux Falls), and POET Nutrition (Scotland, SD). Salaries and research support provided by state and federal funds appropriated to South Dakota State University.
2 Present address: National Steak and Poultry, Owasso, OK 74055.
3 Corresponding author: [email protected] Present address: Land O’Lakes Purina Feed LLC, Omaha, NE
68124.5 Present address: Department of Animal Sciences, North Dakota
State University, Fargo 58108.Received November 30, 2009.Accepted June 4, 2010.
3399
at Magrath Library, Serials Department on May 16, 2012jas.fass.orgDownloaded from

performance and carcass characteristics (Reinhardt et al., 2007; Klopfenstein et al., 2008). However, literature reporting the effects of DGS on meat quality and retail-case life is limited (Roeber et al., 2005; Gill et al., 2008; Depenbusch et al., 2009b). Roeber et al. (2005) deter-mined that a greater percentage of steaks from Holstein steers fed wet distillers grains or dry distillers grains at 40% of their dietary DM were considered moderately unacceptable during retail display when compared with steers fed less distillers grains. Steaks from cattle fed distillers grains at 25% of their dietary DM had greater a* values (more red) than steaks from steers fed 0 or 50% distillers grains (Roeber et al., 2005). Depenbusch et al. (2009b) reported that myofibrillar tenderness and overall tenderness increased linearly as dietary DGS in-creased from 0 to 75% of the dietary DM. Furthermore, concentrations of linoleic acid (C18:2n-6c, where c is cis), total n-6 fatty acids, and total PUFA in cooked ribeye steaks increased as dietary DGS increased (De-penbusch et al., 2009b). The objective of this research was to determine the influence of feeding various quan-tities of wet and dry distillers grains to finishing steers on carcass characteristics, meat quality, retail-case life of ground beef, and fatty acid profile of LM.
MATERIALS AND METHODS
Experimental procedures were conducted using pro-tocols approved by the South Dakota State University Animal Care and Use Committee.
Animals and Feeding
Two hundred forty Angus crossbred steers (BW: 349 ± 25 kg in yr 1 and 336 ± 20 kg in yr 2) were allot-ted randomly to 15 pens (8 steers per pen) in each of 2 yr at the South Dakota State University Southeast Research Farm near Beresford. Steers were implanted on d 28 with 120 mg of trenbolone acetate and 24 mg of estradiol-17β (Revalor-S, Intervet Inc., Millsboro, DE) and housed in outside pens. Three replications of 5 dietary treatments were applied randomly to the 15 pens for each of the 2 yr. A finishing diet containing dry-rolled corn, soybean meal, and alfalfa hay was fed as the control diet (Table 1). Wet distillers grains plus solubles (WDGS) or dry distillers grains plus solubles (DDGS) was added to the finishing diets at either 20.0 or 40.0% of the dietary DM to replace all the soybean meal and part of the dry-rolled corn in the treatment diets. The percentage of fat in the treatment diets aver-aged across both years was 4.5 ± 0.7, 6.2 ± 0.8, 7.5 ± 0.7, 5.3 ± 0.7, and 5.5 ± 0.6 for the control, and 20% DDGS, 40% DDGS, 20% WDGS, and 40% WDGS di-ets, respectively. See Mateo et al. (2004) for the com-plete chemical composition of the treatment diets. All DGS were purchased from POET Nutrition (Scotland, SD). Steers were fed once daily and had ad libitum ac-cess to their diets. The animals were weighed every 28 d during the entire finishing period.
When cattle reached approximately 1 cm of backfat, as estimated by visual appraisal, they were processed at a commercial packing plant. In yr 1, cattle were
Table 1. Composition of the control, dried distillers grains with solubles (DDGS), and wet distillers grains with solubles (WDGS) diets fed to finishing steers
Item, % of dietary DM Control 20% DDGS 20% WDGS 40% DDGS 40% WDGS
Ingredient Alfalfa hay 10.0 10.0 10.0 10.0 10.0 DDGS — 20.0 — 40.0 WDGS — — 20.0 — 40.0 Dry-rolled corn 73.5 64.0 64.0 43.5 43.5 Soybean meal 10.5 — — — — Wet molasses 4.0 4.0 4.0 4.0 — Dry molasses — — — — 4.0 Limestone — — — 0.45 0.45 Supplement1 2.0 2.0 2.0 2.0 2.0Nutrient composition, yr 1 DM 88.3 88.4 68.4 88.7 55.4 CP 13.6 13.5 13.9 17.6 18.4 NDF 16.7 19.6 28.3 22.4 28.6 ADF 7.4 9.8 8.8 12.5 9.4 Ether extract 4.4 6.0 5.0 7.2 5.2Nutrient composition, yr 2 DM 87.8 88.0 67.6 88.5 54.5 CP 14.1 13.9 15.1 17.6 20.0 NDF 16.0 23.0 26.8 29.8 36.6 ADF 6.3 8.5 9.9 11.2 13.2 Ether extract 4.5 6.3 5.6 7.7 6.1
1Composition: ground corn, 0.446%; limestone, 0.830%; trace mineralized salt, 0.700%; Rumensin 80 (Elanco Animal Health, Greenfield, IN), 0.014%; vitamin A, 0.001%; CuSO4, 0.013%; vitamin E, 0.001%.
Koger et al.3400
at Magrath Library, Serials Department on May 16, 2012jas.fass.orgDownloaded from

slaughtered in 3 groups at a commercial packing plant in West Point, NE, on d 136, 137, and 138. In yr 2, cattle were slaughtered in a single group at a commer-cial packing plant in Dakota City, NE, on d 129.
Slaughter and Meat Quality Evaluation
Carcass data were collected by experienced person-nel after a 24-h chill. Data collected at the packing plant for each carcass included HCW, subcutaneous fat thickness, LM area, KPH, USDA yield grade, matu-rity score, marbling score, dark-cutting discount, and USDA quality grade. Colorimeter measurements were recorded (approximately 20 min after ribbing for yr 1, and approximately 11 min after ribbing for yr 2) on the exposed LM between the 12th and 13th ribs using a Minolta Chroma Meter CR-310 (Minolta Corp., Ram-sey, NJ) with a 50-mm-diameter measurement area us-ing a D65 illuminant. A 5-cm-thick sample was excised from the 13th-rib location of the LM and transported to the South Dakota State University Meat Laboratory for further analyses.
Sample Preparation
Muscle pH was measured on each individual LM sam-ple, 7 d postmortem, before fabrication using a pH Star probe (Model 5000, SFK Technology, Herlev, Denmark) equipped with a puncture-type combination pH elec-trode (LoT406-M6-DXK-S7/25, Mettler-Toledo GmbH, Urdorf, Switzerland). Longissimus muscle samples were trimmed of excess fat and bone. After fabrication of the LM samples, 2.5-cm-thick steaks were cut on a slicer, vacuum packaged, allowed to age for 14 d at 4°C, and placed in frozen storage (−20 to −22°C) for later analy-sis of Warner-Bratzler shear force. Samples of LM for glycolytic potential determination and fatty acid pro-file analysis were also collected, vacuum packaged, and placed in frozen storage (−86°C). During fabrication, lean trimmings (longissimus costarum, serratus dor-salis, multifidus dorsi, and intercostale muscles) were pooled by pen (8 steers per pen) and vacuum packaged. Trimmings from yr 1 were frozen (−20 to −22°C) at 7 d postmortem, and trimmings from yr 2 were kept fresh and placed in cold storage (2 to 3°C). Year 1 trim-mings were thawed (2 to 4°C) for 24 h before d 0 of the case life simulation. Trimmings from both years were ground 19 d from each slaughter date. Trimmings for each pen were coarsely ground (1.5-cm plate), mixed, and then finely ground (0.32-cm plate) in a grinder (Hobart II, Model 4822, Hobart Corporation, Troy, OH). The meat was formed into three 114-g patties using a 3-piece Tupperware Hamburger Press [Model 1925 (press), 1926 (keeper), 1927 (press ring), Tupper-ware, Orlando, FL]. The patties were placed on 14 × 20 cm polystyrene trays and retail wrapped (Stretch Meat Film, Clear RMF-61HY, Heartland Paper Co., Sioux Falls, SD) to simulate typical packaging at retail stores. Immediately after wrapping, the patties were placed
randomly on tables in a cooler at 3.9 ± 2°C (Audits International, 1999) under cool fluorescent lighting. A fourth patty (114 g) was formed and used for analysis of thiobarbituric acid-reactive substances (TBARS; 28.3 g frozen on d 0, 2, and 7) and α-tocopherol analy-sis (28.3 g frozen on d 0).
Oxidation Measurements
Ground beef patties were evaluated subjectively and objectively for color at approximately the same time each day for 8 d of retail display. Subjective evalua-tion was performed by a 6-member trained panel in yr 1 and a 7-member trained panel in yr 2. Panelists were trained using the process of open discussion and a procedure similar to that outlined by Lavelle et al. (1995). Evaluators assigned scores to ground beef pat-ties for lean muscle color and percentage of surface dis-coloration at each evaluation time. Lean muscle color (oxygenated pigment) and percentage of surface dis-coloration were characterized on 8-point scales (8 = bright cherry red, 7 = moderately bright cherry red, 6 = cherry red, 5 = slightly dark red, 4 = moderately dark red or brown, 3 = dark red or brown, 2 = very dark brown, 1 = extremely dark brown or green; and 8 = none, 7 = 1 to 5%, 6 = 6 to 10%, 5 = 11 to 25%, 4 = 26 to 50%, 3 = 51 to 75%, 2 = 76 to 99%, 1 = complete, respectively). All patties were evaluated until at least 80% of the patties had been assigned a percentage sur-face discoloration score of 1 (complete discoloration). Concurrent with visual scoring, objective evaluation of color was accomplished on each ground beef patty us-ing a Minolta Chroma Meter CR-310 (Minolta Corp.) with a 50-mm-diameter measurement area using a D65 illuminant to determine values for L* (brightness; 0 = black, 100 = white), a* (redness/greenness; positive values = red, negative values = green), and b* (yellow-ness/blueness; positive values = yellow, negative values = blue). All values for L*, a*, and b* were determined by computing the average of 3 readings obtained from the center of each ground beef patty.
To assess lipid oxidation, TBARS were determined in duplicate by distillation as described by Tarladgis et al. (1960), with few alterations. Ten grams of cooked meat sample was homogenized with 50 mL of distilled water for 2 min and washed with 47.5 mL of distilled water into a 1,000-mL round-bottom flask. A solution of HCl (2.5 mL, 4 N) was added to the meat slurry and 2 drops of Antifoam A emulsion (Sigma-Aldrich, St. Louis, MO) was added to the lower neck of the flask to prevent foaming. The meat slurry was distilled for approximately 10 min to obtain 50 mL of distillate. Five milliliters of distillate was transferred into 25-mL test tubes, and 5 mL of 2-thiobarbituric acid (TBA) reagent (0.02 M TBA in 90% glacial acetic acid) was added. The TBA mixture was heated in boiling water for 35 min and cooled in a cold-water bath for 10 min. Absorbance of the colored mixture was read at 538 nm on a spectrophotometer and TBARS were calculated
Distillers grains and meat characteristics 3401
at Magrath Library, Serials Department on May 16, 2012jas.fass.orgDownloaded from

by multiplying absorbance at 538 nm by K (constant), which was obtained by the following equation, accord-ing to the method of Tarladgis et al. (1960):
K (distillation) = (concentration in moles/5 mL of distillate) × molecular weight of malondialdehyde
× (107/weight of sample) × (100% recovery).
The resulting TBARS were expressed as milligrams per kilogram of sample.
α-Tocopherol Determination
Concentrations of feed and muscle α-tocopherol were assessed for each pen. Ground beef samples were frozen on d 0 of grinding and placed in frozen storage. These samples were then packed on dry ice and shipped to the University of Wisconsin Soil and Plant Analysis Laboratory (Madison, WI) for analysis. Procedures for determining α-tocopherol were performed according to the method of Liu et al. (1996b).
Glycolytic Potential Determination
One gram of each LM was used to determine glycolyt-ic potential, in duplicate for each animal, as described by McKeith et al. (1998). Briefly, perchloric acid was used to deproteinate the muscle samples. Resulting ex-tracts were used to quantify glycogen, glucose, glucose-6-phosphate, and lactate. Glycolytic intermediates were catalyzed to glucose-6-phosphate using hexokinase, and then into 6-phosphogluconate in the presence of NADP+, which was reduced to NADPH, and then ab-sorbance was measured spectrophotometrically at 340 nm. Lactate was measured by adding excess NAD+ in a glycine and hydrazine buffer solution with lactate dehy-drogenase, resulting in NADH being formed. Differenc-es in absorbance were measured at 340 nm. Glycolytic potential was expressed in micromoles of lactate per gram and was determined by 2 × (glycogen + glucose + glucose-6-phosphate) + lactate.
Warner-Bratzler Shear Force Determination
Frozen steaks were thawed for 24 h at 1°C before cook-ing. All steaks were cooked on a belt-fed impingement oven (Model 1132-000-A, Lincoln Foodservice Products Inc., Fort Wayne, IN) for 13.5 min at 190.5°C. Prelimi-nary test cooking was done to determine appropriate cooking times to reach an internal temperature of 71°C. Shear force was measured after the cooked steaks cooled to room temperature (approximately 21°C) by remov-ing 6 cores from each steak parallel to the muscle fiber orientation and shearing each core once on a Warner-Bratzler shear machine (G-R Electric Manufacturing Company, Manhattan, KS) equipped with a Warner-Bratzler attachment, as described by Wheeler et al. (1997). An average Warner-Bratzler shear force value was calculated and recorded for each steak. Steaks were
weighed before and after cooking to determine cooking loss. Cooking loss was expressed as a percentage of raw steak weight.
Fatty Acid Profile
Fatty acid composition of the LM was determined by gas chromatography, as described by Johnson and Engle (2003). Fatty acids were identified by comparing the relative retention times of sample fatty acid methyl ester peaks with those of standards. The methyl ester peaks were calculated as normalized area percentages of fatty acids.
Statistical Analysis
Data (except frequency data) were analyzed as a randomized complete block design (block = year) us-ing the GLM procedure (SAS Inst. Inc., Cary, NC). The model included the main effects of dietary treat-ment (5 levels) and year (2 levels). For all variables except α-tocopherol and those associated with retail display (percentage of discoloration, lean color, a*, and TBARS), pen was used as the experimental unit, with pen means calculated using individual animal data. The α-tocopherol and retail display variables were ana-lyzed with pen as the experimental unit because ground beef trimmings from each of the animals within each pen were physically pooled before analysis. Multivari-ate repeated measures analysis (REPEATED option in the GLM procedure) was used for retail display vari-ables (percentage of discoloration, lean color, a*, and TBARS) that were measured across several days of dis-play. Least squares means were calculated and separat-ed using preplanned contrasts (control vs. DGS, 20 vs. 40% DGS, and DDGS vs. WDGS) if the main effect of dietary treatment was significant at the 0.10 level. Chi-squared analysis was used to analyze frequency data (i.e, percentage of USDA Choice or greater). An α-level of 0.05 was used for means separation and χ2 analysis.
RESULTS AND DISCUSSION
The effects of dietary treatment on carcass measure-ments and grade distribution are presented in Tables 2 and 3 respectively. Fat thickness at the 12th rib was greater (P = 0.019) for steers fed DGS than steers fed the control diet. Feeding DGS compared with the con-trol diet also resulted in greater (P = 0.022) mean nu-merical USDA yield grades and a smaller (P = 0.016) percentage of USDA yield grades 1 and 2. These results are similar to those reported previously for cattle fed WDGS. Al-Suwaiegh et al. (2002) determined that the 12th-rib fat thickness of carcasses from yearling steers fed corn WDGS at 15% of their dietary DM was 15.2% greater than that of steers not fed WDGS. A meta-analysis conducted by Klopfenstein et al. (2008) re-ported that increasing dietary concentrations of WDGS from 10 to 50% of the dietary DM resulted in a qua-
Koger et al.3402
at Magrath Library, Serials Department on May 16, 2012jas.fass.orgDownloaded from

dratic effect on predicted 12th-rib fat thickness. Results suggest that predicted 12th-rib fat thickness would be greatest for cattle consuming WDGS at 20 and 30% of their dietary DM. In contrast to the findings of the current experiment, Depenbusch et al. (2009a) reported that heifers fed increasing concentrations of DDGS in steam-flaked corn-based diets experienced a linear de-crease in 12th-rib fat depth. Klopfenstein et al. (2008) determined in a meta-analysis that feeding cattle DDGS at concentrations ranging from 0 to 40% of the dietary DM had no effect on predicted 12th-rib fat thickness. Other researchers have found no differences in fat thick-ness or yield grade of steers (Ham et al., 1994; Lodge et al., 1997; Vander Pol et al., 2004) or heifers (Vander Pol et al., 2004) when distillers grains was included in the diets. The reason for differential responses in 12th-rib fat thickness with variable dietary concentrations of DGS, either wet or dry, remains to be elucidated.
The main effect of dietary treatment was not a sig-nificant source of variation for marbling score (P > 0.10). These findings agree with those of Al-Suwaiegh et al. (2002) and Depenbusch et al. (2009b), who ob-served no effect of DGS on marbling in dry-rolled or steam-flaked corn-based diets, respectively. In contrast, Depenbusch et al. (2008) reported a reduction in mar-bling in yearling heifers fed WDGS at 25.5% of their dietary DM. Klopfenstein et al. (2008) predicted by meta-analysis that marbling would be greatest in cattle fed 20 or 30% WDGS, but marbling decreased linearly in cattle fed DDGS at concentrations ranging from 0 to
40% of their dietary DM. Owens and Gardner (1999) established that little research attention had been given to the relationship between marbling and dietary fat or energy source. Generally, heavier carcass weights and longer feeding times are associated with increased mar-bling scores. In addition, increased dietary fat often (Brandt and Anderson, 1990; Brandt et al., 1992; Pa-til et al., 1993), but not always (Dubeski and Owens, 1992), increased marbling scores of feedlot cattle. The other carcass measurements did not differ (P > 0.10) among dietary treatments.
Least squares means of glycolytic variables of LM are presented in Table 4. Postmortem decrease in ulti-mate muscle pH is the result of lactic acid production from glycogen (Lawrie, 1998); thus, ultimate muscle pH depends on the amount of glycogen present in muscle at the time of slaughter. Therefore, increased glyco-gen content would produce decreased ultimate mus-cle pH values. In the current study, ultimate muscle pH values of LM were greater (P < 0.035) for steers fed DDGS compared with those fed WDGS, indicat-ing that glycogen content should have been less when steers were fed DDGS. However, in the present study, feeding DGS had no effect (P > 0.10) on glycolytic potential of LM. Hartschuh et al. (2002) reported that glycolytic potential is sensitive to antemortem nutrition because nutrition can alter glycogen or lactate content, or both. Equivalently, glycogen content is influenced by the energy concentration in the diet the animal has been eating in the month before slaughter, with
Table 2. Least squares means of carcass and meat quality characteristics of steers fed the control, dried distillers grains with solubles (DDGS), and wet distillers grains with solubles (WDGS) diets
Item Control20%
DDGS40%
DDGS20%
WDGS40%
WDGSPooled SEM
P-value
Control vs. DDGS
20 vs. 40%
DDGS vs. WDGS
n 48 47 46 46 46 HCW, kg 349 351 354 351 352 8.0 0.423 0.723 0.82212th-rib fat, cm 1.28 1.47 1.43 1.56 1.43 0.03 0.019 0.236 0.506LM area, cm2 84.77 83.68 82.97 84.39 84.19 0.18 0.487 0.686 0.425KPH, % 2.20 2.43 2.26 2.26 2.29 0.07 0.167 0.360 0.353USDA yield grade 2.94 3.25 3.24 3.27 3.16 0.10 0.022 0.576 0.810Marbling score1 528 544 528 557 520 16.6 0.619 0.133 0.901
1Small0 = 500.
Table 3. Frequency distribution of USDA yield and quality grades of steers fed the control, dried distillers grains with solubles (DDGS), and wet distillers grains with solubles (WDGS) diets
Item, % Control20%
DDGS40%
DDGS20%
WDGS40%
WDGS χ2χ2
P-value
Contrast P-value
Control vs.
DDGS
20 vs. 40%
DDGS vs.
WDGS
USDA yield grades 1 and 2 60.42 44.68 36.96 39.13 43.48 6.50 0.165 0.016 0.812 0.951USDA yield grades 4 and 5 8.33 19.15 17.39 17.39 15.22 6.50 0.165 0.126 0.722 0.722USDA Choice and greater 60.42 59.57 58.70 69.57 60.87 1.52 0.824 0.824 0.507 0.394USDA upper 2/3 Choice and greater
18.75 23.40 19.57 26.09 15.22 2.02 0.733 0.722 0.221 0.887
USDA Prime 0.00 4.26 2.17 4.35 0.00 4.12 0.390 0.250 0.178 0.659
Distillers grains and meat characteristics 3403
at Magrath Library, Serials Department on May 16, 2012jas.fass.orgDownloaded from

cattle receiving increased nutrition from feedlot rations having greater glycogen content and cattle receiving a low-quality feedstuff having significantly less glycogen content. Immonen et al. (2000a,b) reported that high-energy diets increased glycogen stores and decreased ultimate muscle pH compared with roughage-based, low-energy diets. We hypothesized that DGS would reduce glycolytic potential because of the removal of starch from DGS during fermentation. Ultimate muscle pH can affect lean color and tenderness (Dutson, 1983), given that postmortem muscle color is directly associ-ated with muscle glycogen content and ultimate muscle pH (Lawrie, 1998). Color is one of the most important aspects of beef quality (Gordon et al., 2002), and, ac-cording to Kropf (2003), meat color is affected by nu-merous antemortem factors, including nutrition. These data suggest that inclusion of DGS at up to 40% of the dietary DM in dry-rolled, corn-based finishing diets provides sufficient carbohydrate to provide a normal ultimate meat pH.
The results of an early study by Smith et al. (1977), along with the results of a later study by Coleman et al. (1995), indicated that tenderness, as measured by shear force, was sensitive to diet effects. Gordon et al. (2002b) noted improvements, as detected by a trained sensory panel, in overall tenderness of ribeye steaks from heifers fed DDGS increased in the diet up to 75%. Along with diet, ultimate muscle pH can influence meat tender-ness. In the present study, feeding DGS did not affect (P > 0.10) tenderness, as measured by Warner-Bratzler shear force, or cooking loss (Table 5), although differ-ences in ultimate muscle pH were observed.
According to Liu et al. (1995), visual appearance is one of the most critical properties influencing the purchasing decision of consumers. The ability of meat to stabilize and maintain color is the most important quality attribute contributing to shelf life. Further, consumers relate the bright red color of oxymyoglobin with freshness (Renerre et al., 1996). The oxidation of oxymyoglobin to metmyoglobin is a primary motive for consumer rejection of beef (Ledward et al., 1992). As lipids oxidize, free radicals are produced that advance the oxidation of oxymyoglobin and deoxymyoglobin to metmyoglobin, resulting in a brownish discoloration as well as the development of rancid off-flavors and odors during retail display (Lynch et al., 2000; Yang et al., 2002). Previous studies (Arnold et al., 1993; Liu et al., 1996a; Faustman et al., 1998) have shown that supplementing vitamin E in the diet increases the con-centrations of α-tocopherol in the muscle, thus extend-ing the retail display time by prolonging color stability. Greater concentrations of α-tocopherol are known to stabilize oxymyoglobin and therefore extend the retail-case life of ground beef (Faustman et al., 1998). In the present study, greater (P = 0.003) concentrations of α-tocopherol were observed in the DDGS diets com-pared with the WDGS diets; however, no differences (P > 0.10) in α-tocopherol concentrations were detected in ground beef samples from DDGS-fed steers compared with WDGS-fed steers (Table 6).
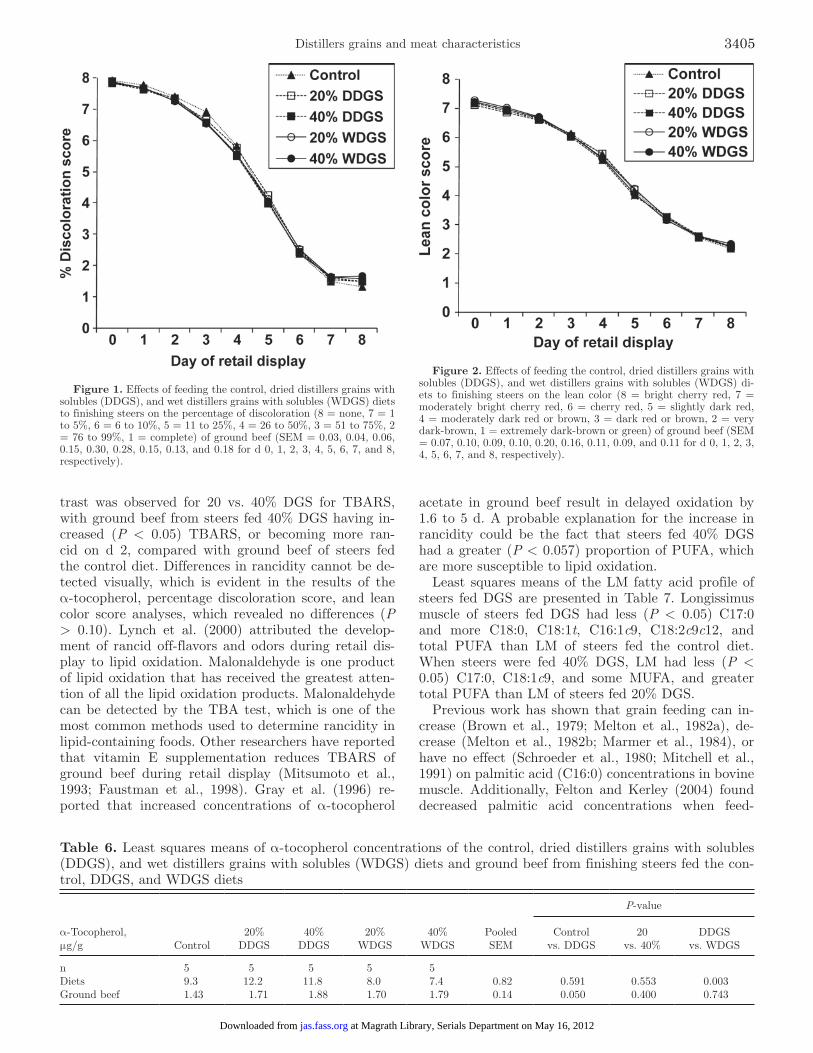
Results of ground beef color evaluations are present-ed in Figures 1, 2, 3, and 4. No differences (P > 0.10) were detected in percentage of discoloration scores, lean color scores, or a* values of ground beef patties from steers fed DGS during retail display. A significant con-
Table 4. Least squares means of glycolytic variables of LM from finishing steers fed the control, dried distillers grains with solubles (DDGS), and wet distillers grains with solubles (WDGS) diets
Item Control20%
DDGS40%
DDGS20%
WDGS40%
WDGSPooled SEM
P-value
Control vs. DDGS
20 vs. 40
DDGS vs. WDGS
n 47 46 46 46 L* 40.12 40.08 40.41 40.49 40.25 0.29 0.559 0.880 0.676a* 22.58 22.91 23.09 22.68 22.94 0.22 0.159 0.294 0.351b* 8.83 9.03 9.16 8.95 9.06 0.15 0.219 0.459 0.553pH 5.508 5.518 5.511 5.491 5.493 0.017 0.599 0.847 0.035GP1 182.8 181.9 184.7 185.3 179.8 6.3 0.701 0.510 0.810
1GP (glycolytic potential) = 2([glycogen] + [glucose] + [glucose-6-phosphate]) + [lactate]; measured in micromoles of lactate per gram.
Table 5. Least squares means of Warner-Bratzler shear force and cooking loss of LM from finishing steers fed the control, dried distillers grains with solubles (DDGS), and wet distillers grains with solubles (WDGS) diets
Item Control20%
DDGS40%
DDGS20%
WDGS40%
WDGSPooled SEM
P-value
Control vs. DDGS
20 vs. 40%
DDGS vs. WDGS
n 47 46 46 46 Shear force, kg 2.89 2.99 2.88 2.94 2.91 0.10 0.385 0.431 0.993Cooking loss, % 17.94 17.71 17.84 17.83 17.31 0.32 0.463 0.569 0.539
Koger et al.3404
at Magrath Library, Serials Department on May 16, 2012jas.fass.orgDownloaded from
trast was observed for 20 vs. 40% DGS for TBARS, with ground beef from steers fed 40% DGS having in-creased (P < 0.05) TBARS, or becoming more ran-cid on d 2, compared with ground beef of steers fed the control diet. Differences in rancidity cannot be de-tected visually, which is evident in the results of the α-tocopherol, percentage discoloration score, and lean color score analyses, which revealed no differences (P > 0.10). Lynch et al. (2000) attributed the develop-ment of rancid off-flavors and odors during retail dis-play to lipid oxidation. Malonaldehyde is one product of lipid oxidation that has received the greatest atten-tion of all the lipid oxidation products. Malonaldehyde can be detected by the TBA test, which is one of the most common methods used to determine rancidity in lipid-containing foods. Other researchers have reported that vitamin E supplementation reduces TBARS of ground beef during retail display (Mitsumoto et al., 1993; Faustman et al., 1998). Gray et al. (1996) re-ported that increased concentrations of α-tocopherol
acetate in ground beef result in delayed oxidation by 1.6 to 5 d. A probable explanation for the increase in rancidity could be the fact that steers fed 40% DGS had a greater (P < 0.057) proportion of PUFA, which are more susceptible to lipid oxidation.
Least squares means of the LM fatty acid profile of steers fed DGS are presented in Table 7. Longissimus muscle of steers fed DGS had less (P < 0.05) C17:0 and more C18:0, C18:1t, C16:1c9, C18:2c9c12, and total PUFA than LM of steers fed the control diet. When steers were fed 40% DGS, LM had less (P < 0.05) C17:0, C18:1c9, and some MUFA, and greater total PUFA than LM of steers fed 20% DGS.
Previous work has shown that grain feeding can in-crease (Brown et al., 1979; Melton et al., 1982a), de-crease (Melton et al., 1982b; Marmer et al., 1984), or have no effect (Schroeder et al., 1980; Mitchell et al., 1991) on palmitic acid (C16:0) concentrations in bovine muscle. Additionally, Felton and Kerley (2004) found decreased palmitic acid concentrations when feed-
Table 6. Least squares means of α-tocopherol concentrations of the control, dried distillers grains with solubles (DDGS), and wet distillers grains with solubles (WDGS) diets and ground beef from finishing steers fed the con-trol, DDGS, and WDGS diets
α-Tocopherol, µg/g Control
20% DDGS
40% DDGS
20% WDGS
40% WDGS
Pooled SEM
P-value
Control vs. DDGS
20 vs. 40%
DDGS vs. WDGS
n 5 5 5 5 5 Diets 9.3 12.2 11.8 8.0 7.4 0.82 0.591 0.553 0.003Ground beef 1.43 1.71 1.88 1.70 1.79 0.14 0.050 0.400 0.743
Figure 1. Effects of feeding the control, dried distillers grains with solubles (DDGS), and wet distillers grains with solubles (WDGS) diets to finishing steers on the percentage of discoloration (8 = none, 7 = 1 to 5%, 6 = 6 to 10%, 5 = 11 to 25%, 4 = 26 to 50%, 3 = 51 to 75%, 2 = 76 to 99%, 1 = complete) of ground beef (SEM = 0.03, 0.04, 0.06, 0.15, 0.30, 0.28, 0.15, 0.13, and 0.18 for d 0, 1, 2, 3, 4, 5, 6, 7, and 8, respectively).
Figure 2. Effects of feeding the control, dried distillers grains with solubles (DDGS), and wet distillers grains with solubles (WDGS) di-ets to finishing steers on the lean color (8 = bright cherry red, 7 = moderately bright cherry red, 6 = cherry red, 5 = slightly dark red, 4 = moderately dark red or brown, 3 = dark red or brown, 2 = very dark-brown, 1 = extremely dark-brown or green) of ground beef (SEM = 0.07, 0.10, 0.09, 0.10, 0.20, 0.16, 0.11, 0.09, and 0.11 for d 0, 1, 2, 3, 4, 5, 6, 7, and 8, respectively).
Distillers grains and meat characteristics 3405
at Magrath Library, Serials Department on May 16, 2012jas.fass.orgDownloaded from

ing additional fat. An increase in odd-chain fatty acid concentration could be attributed to some alteration in ruminal fermentation products. An increased odd-chain fatty acid concentration has been attributed to the substitution of propionate for acetate in de novo fatty acid synthesis (Marmer et al., 1985; Gilka et al., 1989). The present study revealed no difference (P > 0.10) in C16:0 concentrations.
Previous studies have shown that oleic (C18:1) acid concentrations in beef lipid have been increased (Brown et al., 1979; Melton et al., 1982a), decreased (Brown et
al., 1979), or not affected (Mitchell et al., 1991) by diet. The present study revealed no difference (P > 0.10) in C18:1c9 but increased (P < 0.05) C18:0 and C18:1t in the LM of steers fed DGS compared with the LM of steers fed the control diet. As animals become fatter, an increasing proportion of the fat deposited is in the form of MUFA (Leat, 1978); thus, changes in fatness because of differences in energy intake can confound effects of ration type on fatty acid composition in intramuscular fat.
Conjugated linoleic acid is produced in the rumen as an intermediate in the biohydrogenation of dietary
Figure 3. Effects of feeding the control, dried distillers grains with solubles (DDGS), and wet distillers grains with solubles (WDGS) diets to finishing steers on a* values (larger values = more red, smaller val-ues = more green) of ground beef (SEM = 0.20, 0.21, 0.54, 0.60, 0.37, 0.49, 0.44, and 0.60 for d 1, 2, 3, 4, 5, 6, 7, and 8, respectively).
Figure 4. Effects of feeding the control, dried distillers grains with solubles (DDGS), and wet distillers grains with solubles (WDGS) diets to finishing steers on thiobarbituric acid-reactive substances (TBARS) in ground beef (SEM = 0.06, 0.34, and 0.61 for d 0, 2, and 7, respec-tively).
Table 7. Least squares means of fatty acid concentrations in LM from finishing steers fed the control, dried distill-ers grains with solubles (DDGS), and wet distillers grains with solubles (WDGS) diets
Fatty acid,1 mg/100 g of wet tissue Control
20% DDGS
40% DDGS
20% WDGS
40% WDGS
Pooled SEM
P-value
Control vs. DDGS
20 vs. 40%
DDGS vs. WDGS
n 48 43 44 46 45 C14:0 2.93 2.95 2.85 3.19 2.96 0.11 0.457 0.134 0.144C16:0 21.90 21.66 20.91 22.53 21.95 0.47 0.909 0.154 0.062C17:0 1.015 0.959 0.767 0.904 0.906 0.049 0.020 0.046 0.311C18:0 10.48 11.71 11.36 11.29 11.78 0.32 0.006 0.859 0.956C18:1t 0.0224 0.0252 0.0278 0.0258 0.0280 0.0017 0.032 0.189 0.817C16:1c9 2.87 3.22 3.59 3.35 3.36 0.16 0.006 0.221 0.706C18:1c9 28.8 28.1 25.9 28.3 27.3 0.75 0.171 0.030 0.242C18:2c9t11 0.254 0.215 0.243 0.198 0.249 0.024 0.314 0.127 0.837C18:2c9c12 2.63 3.21 3.69 3.18 3.28 0.16 0.001 0.063 0.158C18:3c9c12c15 0.162 0.156 0.162 0.158 0.154 0.015 0.939 0.881 0.737C20:4 0.375 0.296 0.316 0.301 0.323 0.040 0.131 0.586 0.898SFA 36.3 37.3 35.9 37.9 37.6 0.77 0.192 0.248 0.143UFA2 35.1 35.2 33.9 35.5 34.7 0.73 0.981 0.117 0.411MUFA 31.7 31.3 29.5 31.7 30.7 0.73 0.473 0.052 0.272PUFA 3.42 3.88 4.41 3.83 4.01 0.19 0.0102 0.057 0.214
1c = cis; t = trans.2UFA = unsaturated fatty acids.
Koger et al.3406
at Magrath Library, Serials Department on May 16, 2012jas.fass.orgDownloaded from

linoleic acid to stearic acid (Bauman et al., 2000) and is known to prevent arteriosclerosis and act as an anticar-cinogen in human diets. Duckett et al. (2002) reported that CLA concentrations were greater for diets with greater lipid content. However, in the present study, no increase in the cis-9, trans-11 isomer of CLA was revealed. This result mirrors previous observations by Beaulieu et al. (2002), Felton and Kerley (2004), and Gill et al. (2008), illustrating that altering the diet of feedlot steers had little effect on CLA content. How-ever, others have noted increases in CLA content when feeding DDGS (Depenbusch et al., 2009a), whole cot-tonseed (Huerta-Leidenz et al., 1991), or unsaturated rumen-protected lipids (Dinius et al., 1975; Garrett et al., 1976). One explanation for the present result is that less linoleic acid reached the small intestine, because of increased ruminal biohydrogenation, and therefore was not available for absorption and deposition. Unsaturat-ed fatty acids are ultimately saturated by rumen micro-organisms; therefore, they need to be either protected from ruminal biohydrogenation or present in amounts large enough to result in sufficient escape to the intes-tinal tract for absorption (Duckett et al., 2002). Rule et al. (1994) demonstrated that the muscle fatty acid profile was more sensitive to dietary lipid when the dietary lipid was somewhat resistant to ruminal biohy-drogenation.
Collectively, these data suggest steers fed DGS may require earlier marketing than steers fed conventional diets to prevent excess subcutaneous fat development, which may result in market discounts associated with a greater percentage of USDA yield grade 4. Feeding DGS to finishing steers will likely result in no adverse or beneficial effects on glycolytic variables (dark cut-ters), retail display life of ground beef, or meat tender-ness. Beef from cattle finished on diets containing DGS may have a greater proportion of PUFA and therefore may be more susceptible to oxidative rancidity. Fur-ther, the effects of including 20% DGS, either wet or dry, in finishing steer diets has little to no effect on meat quality, retail display life of ground beef, or fatty acid profile of LM.
LITERATURE CITED
Al-Suwaiegh, S., K. C. Fanning, R. J. Grant, C. T. Milton, and T. J. Klopfenstein. 2002. Utilization of distillers grains from the fermentation of sorghum or corn in diets for finishing beef and lactating dairy cattle. J. Anim. Sci. 80:1105–1111.
Arnold, R. N., S. C. Arp, K. K. Scheller, S. N. Williams, and D. M. Schaefer. 1993. Tissue equilibration and subcellular distribu-tion of vitamin E relative to myoglobin and lipid oxidation in displayed beef. J. Anim. Sci. 71:105–118.
Audits International. 1999. U.S. Cold Temperature Evaluation. http://www.foodrisk.org/exclusives/audits/downloads/Audits-FDA_temp_study.pdf Accessed May 2, 2000.
Bauman, D. E., L. H. Baumgard, B. A. Corl, and J. M. Griinari. 2000. Biosynthesis of conjugated linoleic acid in ruminants. J. Anim. Sci. 77(E-Suppl.):1–15.
Beaulieu, A. D., J. K. Drackley, and N. R. Merchen. 2002. Concen-trations of conjugated linoleic acid (cis-9, trans-11-octadeca-
dienoic acid) are not increased in tissue lipids of cattle fed a high-concentrate diet supplemented with soybean oil. J. Anim. Sci. 80:847–861.
Brandt, R. T., Jr., and S. J. Anderson. 1990. Supplemental fat source affects feedlot performance and carcass traits of finishing yearling steers and estimated diet net energy value. J. Anim. Sci. 68:2208–2216.
Brandt, R. T., Jr., G. L. Kuhl, R. E. Campbell, C. L. Kastner, and S. L. Stroda. 1992. Effects of steam-flaked sorghum grain or corn and supplemental fat on feedlot performance carcass traits, longissimus composition, and sensory properties of steers. J. Anim. Sci. 70:343–348.
Brown, H. G., S. L. Melton, M. J. Riemann, and W. R. Backus. 1979. Effects of energy intake and feed source on chemical changes and flavor of ground beef during frozen storage. J. Anim. Sci. 48:338–347.
Coleman, S. W., R. H. Gallavan, C. B. Williams, W. A. Phillips, J. D. Volesky, S. Rodriguez, and G. L. Bennett. 1995. Silage or limit-fed grain growing diets for steers: I. Growth and carcass quality . J. Anim. Sci. 73:2609–2620.
Depenbusch, B. E., C. M. Coleman, J. J. Higgins, and J. S. Drouil-lard. 2009a. Effects of increasing levels of dried corn distillers grains with solubles on growth performance, carcass charac-teristics, and meat quality of yearling heifers. J. Anim. Sci. 87:2653–2663.
Depenbusch, B. E., J. S. Drouillard, E. R. Loe, J. J. Higgins, M. E. Corrigan, and M. J. Quinn. 2008. Efficacy of monensin and tylosin in finishing diets based on steam-flaked corn with and without corn wet distillers grains with solubles. J. Anim. Sci. 86:2270–2276.
Depenbusch, B. E., E. R. Loe, J. J. Sindt, N. A. Cole, J. J. Higgins, and J. S. Drouillard. 2009b. Optimizing the use of distillers grains in finishing diets containing steam-flaked corn. J. Anim. Sci. 87:2644–2652.
Dinius, D. A., L. F. Edmondson, W. Kimoto, and R. R. Oltjen. 1975. Growth, blood parameters and tissue lipids of finishing cattle fed a formaldehyde treated casein-safflower oil complex. J. Anim. Sci. 40:358–365.
Dubeski, P. L., and F. N. Owens. 1992. Feeding protected fat to Holstein steers during the last 3 weeks on feed to enhance mar-bling. Oklahoma Agric. Exp. Stn. MP-136:214–218.
Duckett, S. K., J. G. Andrae, and F. N. Owens. 2002. Effect of high-oil corn or added corn oil on ruminal biohydrogenation of fatty acids and conjugated linoleic acid formation in beef steers fed finishing diets. J. Anim. Sci. 80:3353–3360.
Dutson, T. R. 1983. The measurement of pH in muscle and its im-portance to meat quality. Pages 92–97 in Proc. 36th Recip. Meat Conf., Fargo, ND. Natl. Livest. Meat Board, Chicago, IL.
Faustman, C., W. K. M. Chan, D. M. Schaefer, and A. Havens. 1998. Beef Color Update: The role for vitamin E. J. Anim. Sci. 76:1019–1026.
Felton, E. E. D., and M. S. Kerley. 2004. Performance and carcass quality of steers fed different sources of dietary fat. J. Anim. Sci. 82:1794–1805.
Garrett, W. N., Y. T. Yang, W. L. Dunkley, and L. M. Smith. 1976. Energy utilization, feedlot performance and fatty acid composi-tion of beef steers fed protein encapsulated tallow or vegetable oils. J. Anim. Sci. 42:1522–1533.
Gilka, J., P. Jelinek, B. Jankova, P. Krejci, and J. Habrda. 1989. Amino acid composition of meat, fatty acid composition of fat and content of some chemical elements in the tissues of male lambs fed monensin or lasalocid. Meat Sci. 25:273–280.
Gill, R. K., D. L. VanOverbeke, B. Depenbusch, J. S. Drouilard, and A. DiCostanzo. 2008. Impact of beef cattle diets containing corn or sorghum distillers grains on beef color, fatty acid pro-files, and sensory attributes. J. Anim. Sci. 86:923–935.
Gordon, C. M., J. S. Drouillard, R. K. Phebus, K. A. Hachmeister, M. E. Dikeman, J. J. Higgins, and A. L. Reicks. 2002. The ef-fect of Dakota Gold®-brand dried distiller’s grains with solubles of varying levels on sensory and color characteristics of ribeye
Distillers grains and meat characteristics 3407
at Magrath Library, Serials Department on May 16, 2012jas.fass.orgDownloaded from

steaks. Pages 72–74 in Cattlemen’s Day, Manhattan, KS. Kan-sas State Univ., Manhattan.
Gray, J. I., E. A. Gomaa, and D. J. Buckley. 1996. Oxidative quality and shelf life of meats. Meat Sci. 43:S111–S123.
Ham, G. A., R. A. Stock, T. J. Klopfenstein, E. M. Larson, D. H. Shain, and R. P. Huffman. 1994. Wet corn distillers byprod-ucts compared with dried corn distillers grains with solubles as a source of protein and energy for ruminants. J. Anim. Sci. 72:3246–3257.
Hartschuh, J. K., J. Novakofski, and F. K. McKeith. 2002. Practical aspects of the glycolytic potential assay. Pages 39–42 in Proc. 55th Recip. Meat Conf., Lansing, MI. Natl. Livest. Meat Board, Chicago, IL.
Huerta-Leidenz, N. O., H. R. Cross, D. K. Lunt, L. S. Pelton, J. W. Savell, and S. B. Smith. 1991. Growth, carcass traits, and fatty acid profiles of adipose tissues from steers fed whole cottonseed. J. Anim. Sci. 69:3665–3672.
Immonen, K., M. Ruusunen, K. Hissa, and E. Poulanne. 2000a. Bo-vine muscle glycogen concentration in relation to finishing diet, slaughter and ultimate pH. Meat Sci. 55:25–31.
Immonen, K., D. M. Schaefer, E. Puolanne, R. G. Kauffman, and E. V. Nordheim. 2000b. The relative effect of dietary energy density on repleted and resting muscle glycogen concentrations. Meat Sci. 54:155–162.
Johnson, L. R., and T. E. Engle. 2003. The effect of copper source and concentration on lipid metabolism in growing and finishing Angus steers. Asian-australas. J. Anim. Sci. 16:1131–1136.
Klopfenstein, T. J., G. E. Erickson, and V. R. Bremer. 2008. BOARD-INVITED REVIEW: Use of distillers by-products in the beef cattle feeding industry. J. Anim. Sci. 86:1223–1231.
Kropf, D. H. 2003. Enhancing meat color stability. Pages 73–75 in Proc. 56th Recip. Meat Conf., Columbia, MO. Natl. Livest. Meat Board, Chicago, IL.
Lavelle, C. L., M. C. Hunt, and D. H. Kropf. 1995. Display life and internal cooked color of ground beef from vitamin E-supple-mented steers. J. Food Sci. 60:1175–1178.
Lawrie, R. A. 1998. Lawrie’s Meat Science. 6th ed. Woodhead Pub. Limited, Cambridge, UK.
Leat, W. M. 1978. Factors affecting the fatty acid composition of depot fats of cattle and other ruminants. Page 231–241 in Pat-terns of Growth and Development in Cattle, Current Topics in Veterinary Medicine. Martinus Nijhoff, The Hague, the Neth-erlands.
Ledward, D. A., D. E. Johnston, and M. K. Knight. 1992. The Chemistry of Muscle-Based Foods. Royal Soc. Chem., Cam-bridge, UK.
Liu, Q., M. C. Lanari, and D. M. Schaefer. 1995. A review of dietary vitamin E supplementation for improvement of beef quality. J. Anim. Sci. 73:3131–3140.
Liu, Q., K. K. Scheller, S. C. Arp, D. M. Schaefer, and M. Frigg. 1996a. Color coordinates for assessment of dietary vitamin E effects on beef color stability. J. Anim. Sci. 74:106–116.
Liu, Q., K. K. Scheller, and D. M. Schaefer. 1996b. Technical note: A simplified procedure for vitamin E determination in beef muscle. J. Anim. Sci. 74:2406–2410.
Lodge, S. L., R. A. Stock, T. J. Klopfenstein, D. H. Shain, and D. W. Herold. 1997. Evaluation of wet distillers composite for fin-ishing ruminants. J. Anim. Sci. 75:44–50.
Lynch, A., J. P. Kerry, M. G. O’Sullivan, J. B. P. Lawlor, D. J. Buck-ley, and P. A. Morrissey. 2000. Distribution of α-tocopherol in beef muscles following dietary α-tocopherol acetate supplemen-tation. Meat Sci. 56:211–214.
Marmer, W. N., R. J. Maxwell, and D. G. Wagner. 1985. Effects of dietary monensin on bovine fatty acid profiles. J. Agric. Food Chem. 33:67–70.
Marmer, W. N., R. J. Maxwell, and J. E. Williams. 1984. Effects of dietary regimen and tissue site on bovine fatty acid profiles. J. Anim. Sci. 59:109–121.
Mateo, K. S., K. E. Tjardes, C. L. Wright, T. J. Koger, and B. D. Rops. 2004. Evaluation of wet distillers grains with solubles as
compared to dry distillers grains with solubles fed to growing and finishing steers. Pages 14–16 in South Dakota State Univ. Beef Rep. South Dakota State Univ., Brookings.
McKeith, F. K., M. Ellis, K. D. Miller, and D. S. Sutton. 1998. The effect of RN genotype on pork quality. Pages 118–124 in Proc. 51st Recip. Meat Conf., Storrs, CT. Natl. Livest. Meat Board, Chicago, IL.
Melton, S. L., M. Amiri, G. W. Davis, and W. R. Backus. 1982a. Flavor and chemical characteristics of ground beef from grass-, forage-grain- and grain-finished steers. J. Anim. Sci. 55:77–87.
Melton, S. L., J. M. Black, G. W. Davis, and W. R. Backus. 1982b. Flavor and selected chemical components of ground beef from steers backgrounded on pasture and fed corn up to 140 days. J. Food Sci. 47:699–704.
Mitchell, G. E., A. W. Reed, and S. A. Rogers. 1991. Influence of feeding regimen on the sensory qualities and fatty acid contents of beef steaks. J. Food Sci. 56:1102–1103.
Mitsumoto, M., R. N. Arnold, D. M. Schaefer, and R. G. Cassens. 1993. Dietary versus postmortem supplementation of vitamin E on pigment and lipid stability in ground beef. J. Anim. Sci. 71:1812–1816.
Owens, F. N., and B. A. Gardner. 1999. Ruminant nutrition and meat quality. Pages 25–36 in Proc. 52nd Recip. Meat Conf., Stillwater, OK. Natl. Livest. Meat Board, Chicago, IL.
Patil, A. R., A. L. Goetsch, P. K. Lewis Jr., and C. E. Heird. 1993. Effects of supplementing growing steers with high lev-els of partially hydrogenated tallow on feed intake, digestibil-ity, live weight gain, and carcass characteristics. J. Anim. Sci. 71:2284–2292.
Reinhardt, C. D., A. DiCostanzo, and G. Milliken. 2007. Distillers byproducts alters carcass fat distribution of feedlot cattle. J. Anim. Sci. 85(Suppl. 2):132. (Abstr.)
Renerre, M., F. Dumont, and P. Gatellier. 1996. Antioxidant enzyme activities in beef in relation to oxidation of lipid and myoglobin. Meat Sci. 43:111–121.
Renewable Fuels Association. 2009. Ethanol industry statistics. Re-newable Fuels Association, Washington, DC. http://www.etha-nolrfa.org/pages/statistics Accessed Mar. 30, 2010.
Roeber, D. L., R. K. Gill, and A. DiCostanzo. 2005. Meat quality re-sponses to feeding distiller’s grains to finishing Holstein steers. J. Anim. Sci. 83:2455–2460.
Rule, D. C., J. R. Busboom, and C. J. Kercher. 1994. Effect of di-etary canola on fatty acid composition of bovine adipose tissue, muscle, kidney, and liver. J. Anim. Sci. 72:2735–2744.
Schroeder, J. W., D. A. Cramer, R. A. Bowling, and C. W. Cook. 1980. Palatability, shelflife and chemical differences between forage- and grain-finished beef. J. Anim. Sci. 50:852–859.
Smith, G. M., J. D. Crouse, R. W. Mandigo, and K. L. Neer. 1977. Influence of feeding regimen and biological type on growth, com-position and palatability of steers. J. Anim. Sci. 45:236–253.
Tarladgis, B. G., B. M. Watts, M. T. Younathanm, and L. Dugan Jr. 1960. A distillation method for the quantitative determina-tion of malonaldehyde in rancid foods. J. Am. Oil Chem. Soc. 37:44–48.
Vander Pol, K. J., G. E. Erickson, T. J. Klopfenstein, and C. N. Macken. 2004. Effect of wet and dry distillers grains plus sol-ubles and supplemental fat level on performance of yearling finishing cattle. Pages 45–48 in Neb. Beef Cattle Rep., Lincoln, NE. Univ. Nebraska, Lincoln.
Wheeler, T. L., S. D. Shackelford, L. P. Johnson, M. F. Miller, R. K. Miller, and M. Koohmaraie. 1997. A comparison of Warner-Bratzler shear force assessment within and among institutions. J. Anim. Sci. 75:2423–2432.
Yang, A., M. J. Brewster, M. C. Lanari, and R. K. Tume. 2002. Effect of vitamin E supplementation of α-tocopherol and β-carotene concentrations in tissues from pasture- and grain-fed cattle. Meat Sci. 60:35–40.
Koger et al.3408
at Magrath Library, Serials Department on May 16, 2012jas.fass.orgDownloaded from

Referenceshttp://jas.fass.org/content/88/10/3399#BIBLThis article cites 48 articles, 33 of which you can access for free at:
Citationshttp://jas.fass.org/content/88/10/3399#otherarticlesThis article has been cited by 1 HighWire-hosted articles:
at Magrath Library, Serials Department on May 16, 2012jas.fass.orgDownloaded from