Embed Size (px)
Citation preview

Influence and Correlation in
Social Networks
Mohammad Mahdian
Yahoo! Research
Joint work with Aris Anagnostopoulos and Ravi Kumar
to appear in KDD’08.

Social systems
Social network: graph that represents relationships
between independent agents.
Social networks are everywhere and are shaping
our lives:
Network of professional contacts (e.g., for finding jobs)
Network of colleagues (e.g., for learning new techniques)
Web 2.0 systems:
Online social networks: facebook, myspace, orkut, IM,
linkedIn, twitter, …
Content sharing: flickr, del.icio.us, youtube, weblogs, …
Content creation: wikipedia, …
Research on Social Networks
The Online Revolution:
People switch more and more of their interactions
from offline to online
Pushing the # of contacts we can keep track of
Redefining privacy
Ideal for experiments in social sciences:
Ability to measure and record all activities
Massive data sets
Social correlation
Role of social ties in shaping the behavior of
users
Examples:
Joining LiveJournal communities [Backstrom et al.]
Publishing in conferences [Backstrom et al.]
Tagging vocabulary on flickr [Marlow et al.]
Adoption of paid VOIP service in IM
…

Joining communities [Backstrom et al]
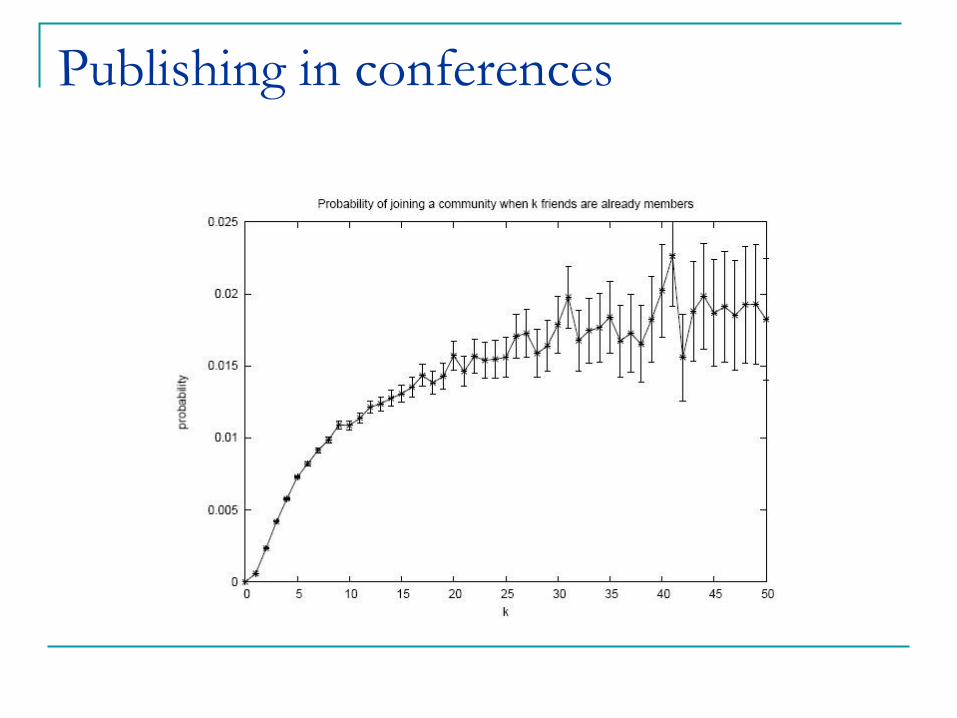
Publishing in conferences
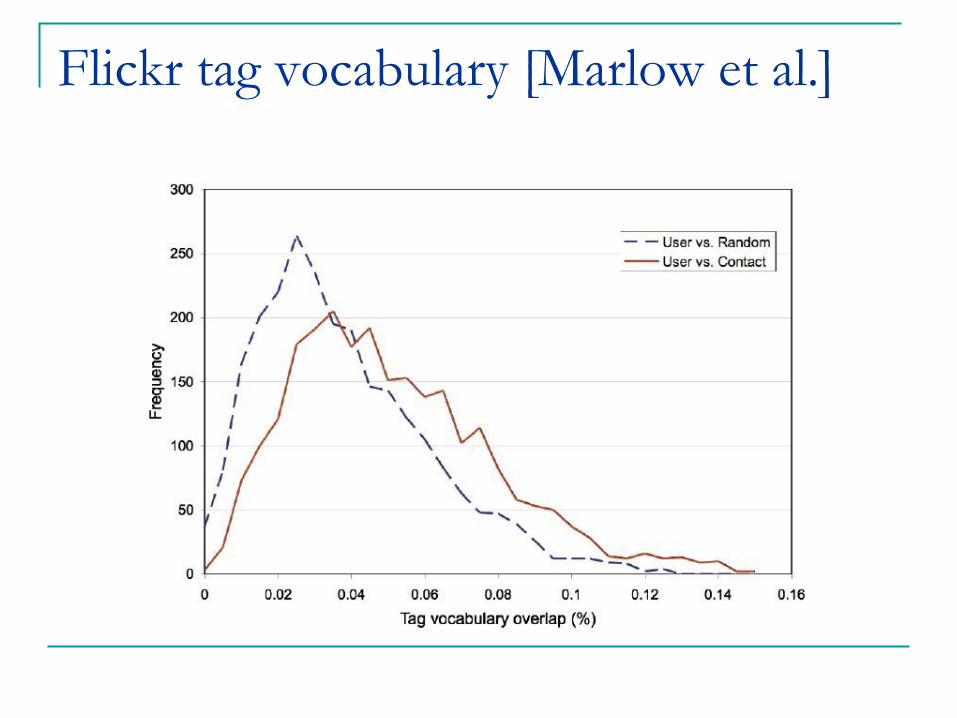
Flickr tag vocabulary [Marlow et al.]
Sources of correlation
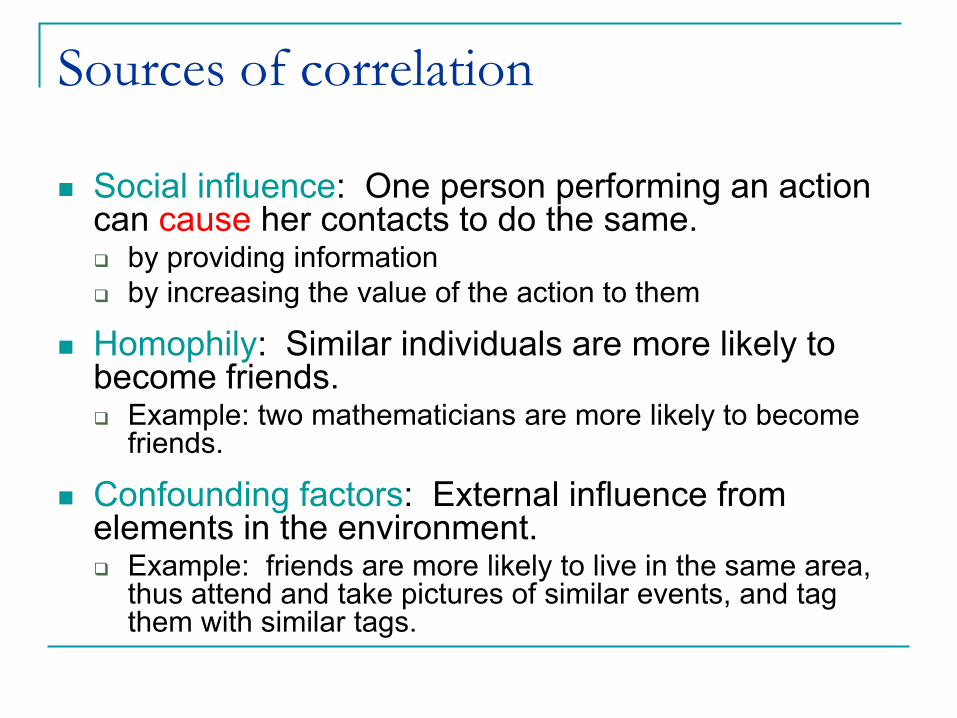
Social influence: One person performing an action can cause her contacts to do the same. by providing information
by increasing the value of the action to them
Homophily: Similar individuals are more likely to become friends. Example: two mathematicians are more likely to become
friends.
Confounding factors: External influence from elements in the environment. Example: friends are more likely to live in the same area,
thus attend and take pictures of similar events, and tag them with similar tags.
Social influence
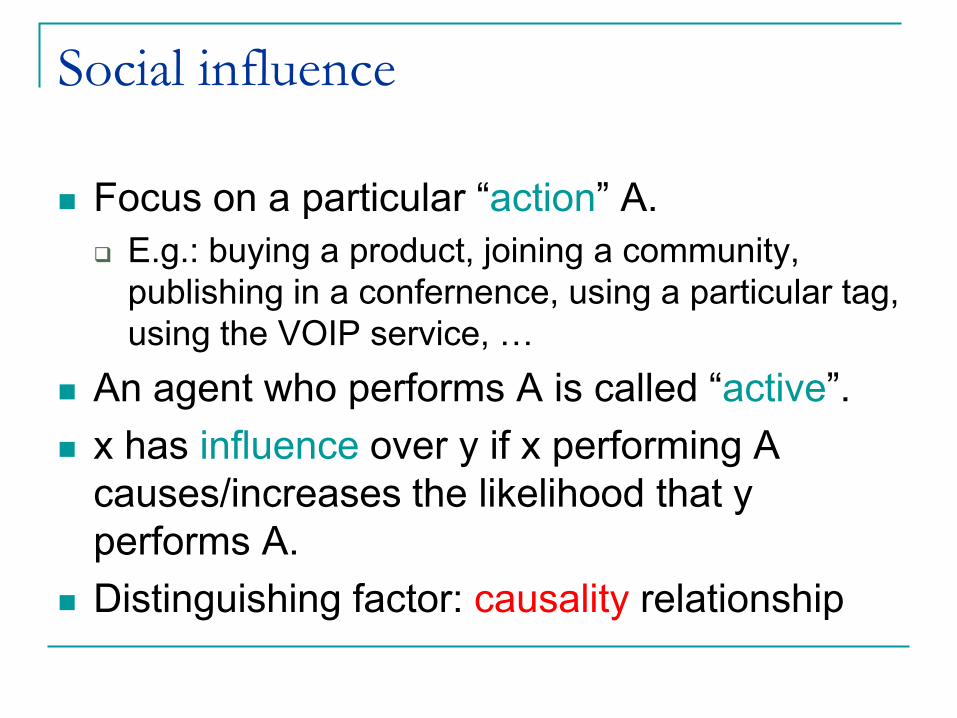
Focus on a particular “action” A.
E.g.: buying a product, joining a community,
publishing in a confernence, using a particular tag,
using the VOIP service, …
An agent who performs A is called “active”.
x has influence over y if x performing A
causes/increases the likelihood that y
performs A.
Distinguishing factor: causality relationship

Identifying social influence
Why is it important?
Analysis: predicting the dynamics of the system. Whether a new norm of behavior, technology, or idea can diffuse like an epidemic.
Design: for designing a system to induce a particular behavior, e.g.:
vaccination strategies (random, targeting a demographic group, random acquaintances, etc.)
viral marketing campaigns
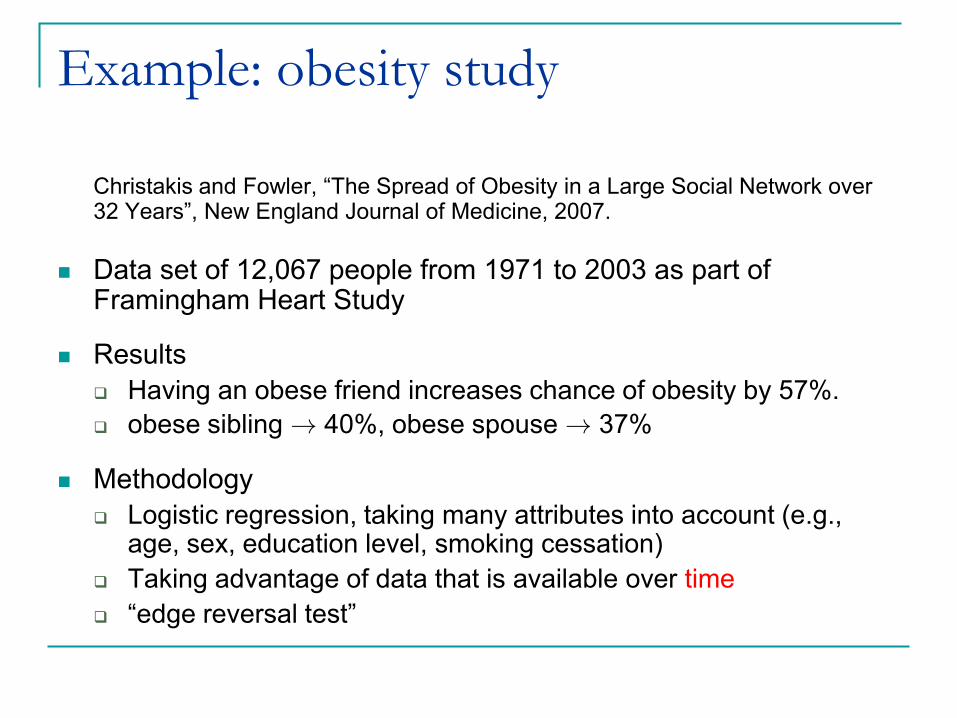
Example: obesity study
Christakis and Fowler, “The Spread of Obesity in a Large Social Network over 32 Years”, New England Journal of Medicine, 2007.
Data set of 12,067 people from 1971 to 2003 as part of Framingham Heart Study
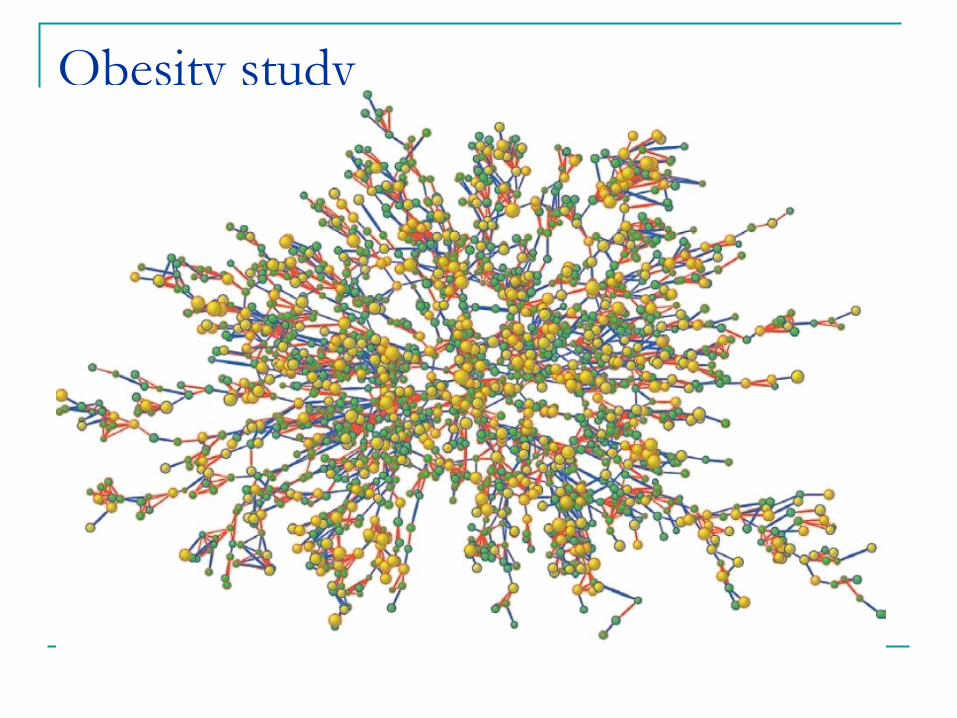
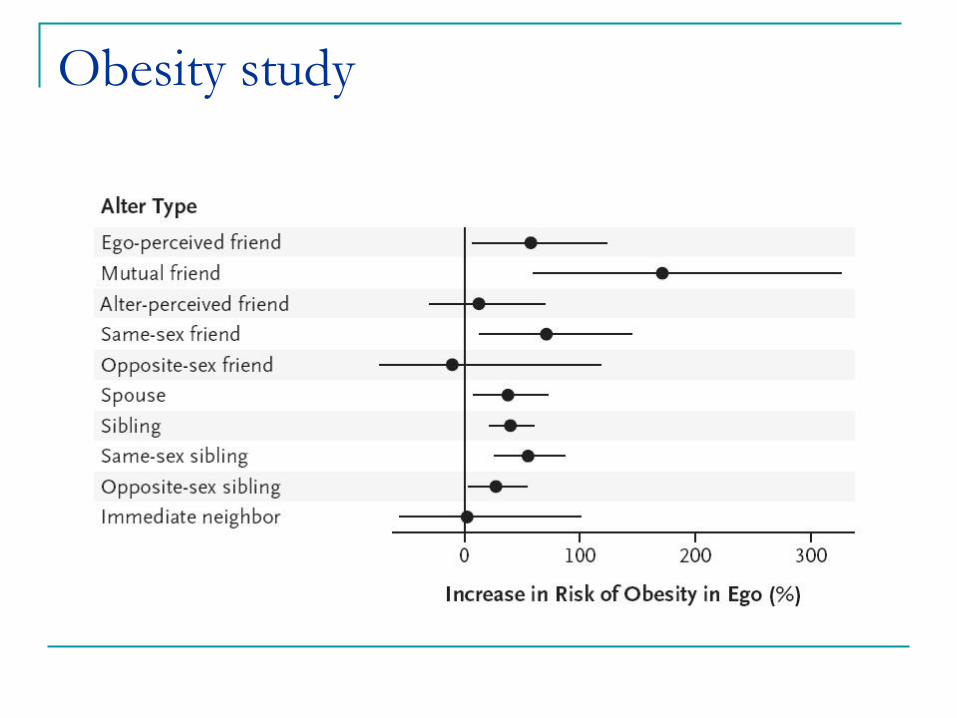
Obesity study
Example: obesity study
Christakis and Fowler, “The Spread of Obesity in a Large Social Network over 32 Years”, New England Journal of Medicine, 2007.
Data set of 12,067 people from 1971 to 2003 as part of Framingham Heart Study
Results
Having an obese friend increases chance of obesity by 57%.
obese sibling ! 40%, obese spouse ! 37%
Methodology
Logistic regression, taking many attributes into account (e.g., age, sex, education level, smoking cessation)
Taking advantage of data that is available over time
“edge reversal test”
Obesity study

Many models proposed in different settings
Game-theoretic models
Each agent modeled as a player in a “game”.
The utility that an agent derives depends on what his/her
friends do.
Agents decide whether to become active to maximize
their utility.
Example: adoption of a comm tech, e.g., cell-phone, IM
[Morris’00], [Immorlica et al.’07]
Probabilistic models
Many models proposed in different settings
Game-theoretic models
Probabilistic models
Independent cascade model [Kempe et al.]
Every neighbor u of v who becomes active gets an
independent chance to influence v with probability puv.
Linear threshold model [Kempe et al.]
Each node has a random threshold, becomes active if
sum of weights of active friends exceeds threshold.
Ising-type models from physics
Models of social influence
Models of social influence
Probabilistic models are more predictive
allows optimization (find the best “seed set”)
allows fitting the data to estimate parameters of
the system
Our model also includes the element of time
Graph G; Time period [0,T]
At any time period a number of agents can
become active
Let W be the set of active nodes at the end.

Model
Influence model: each agent becomes active in each time step independently with probability p(a), where a is the # of active friends.
Natural choice for p(a): logistic regression function:
with ln(a+1) as the explanatory variable. I.e.,
Coefficient ® measures social correlation.

Measuring social correlation
We compute the maximum likelihood estimate for parameters ® and ¯.
Let Ya = # pairs (user u, time t) where u is not active and has a active friends at the beginning of time step t, and becomes active in this step.
Let Na = …… does not become active in this step.
Find ®, ¯ to maximize
For convenience, we cap a at a value R.

The max likelihood problem
Lemma. There is a unique solution (®,¯) that
maximizes the likelihood function.
Proof idea. Assume (®,¯) and (®’,¯’) both maximize
this function. We give a path between these two
points such that the likelihood function is concave
along this path.
Same proof can be used to show that estimated (®,¯) is a continuous function of Ya’s and Na’s.
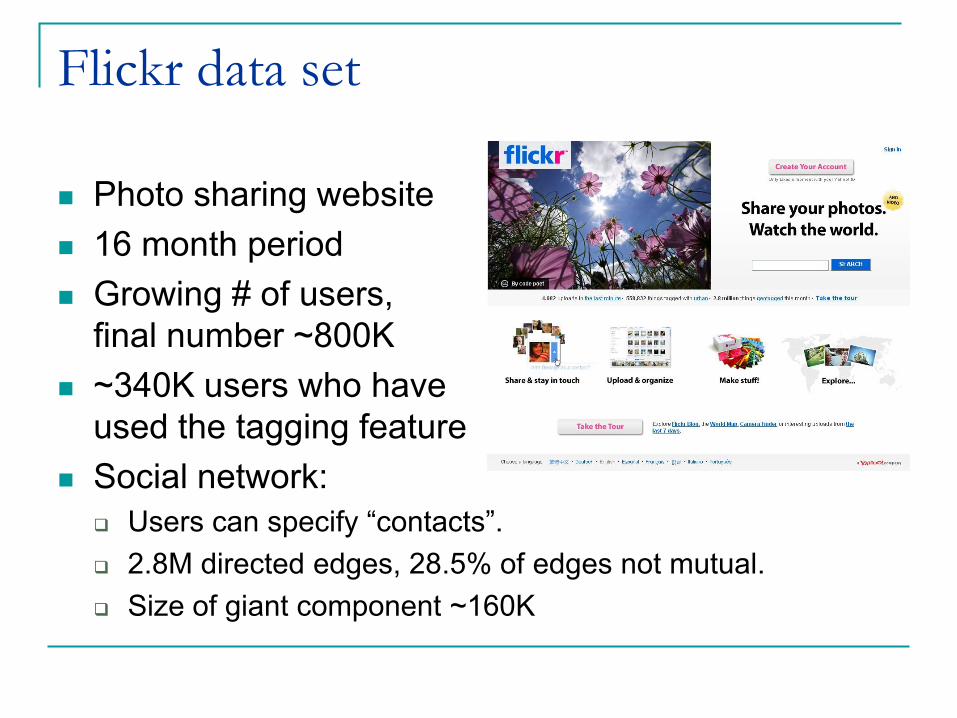
Flickr data set
Photo sharing website
16 month period
Growing # of users,
final number ~800K
~340K users who have
used the tagging feature
Social network:
Users can specify “contacts”.
2.8M directed edges, 28.5% of edges not mutual.
Size of giant component ~160K


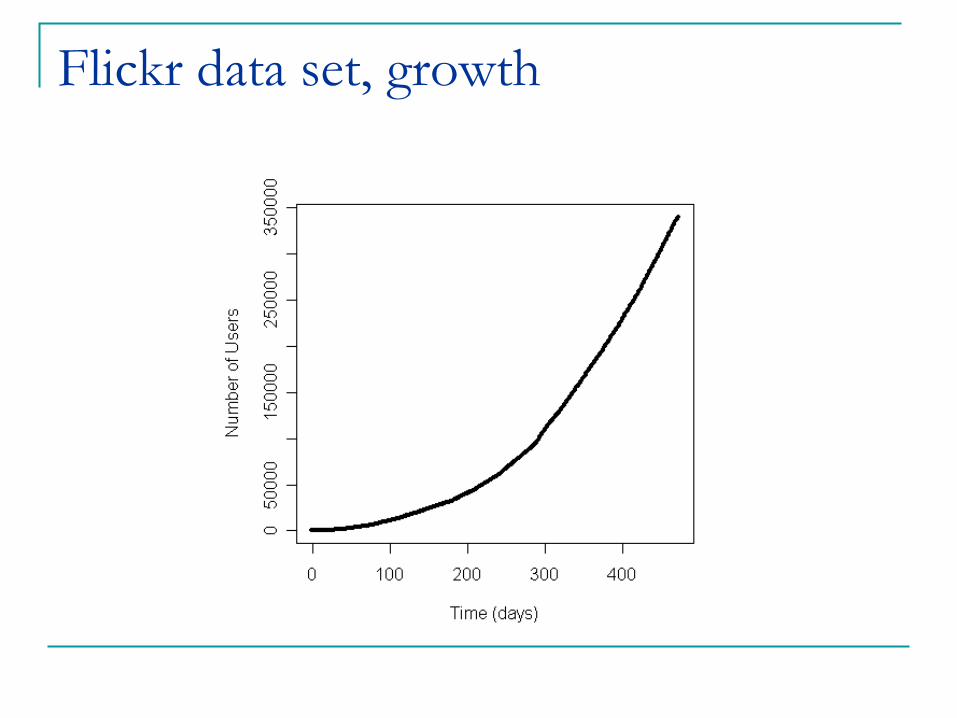
Flickr data set, growth
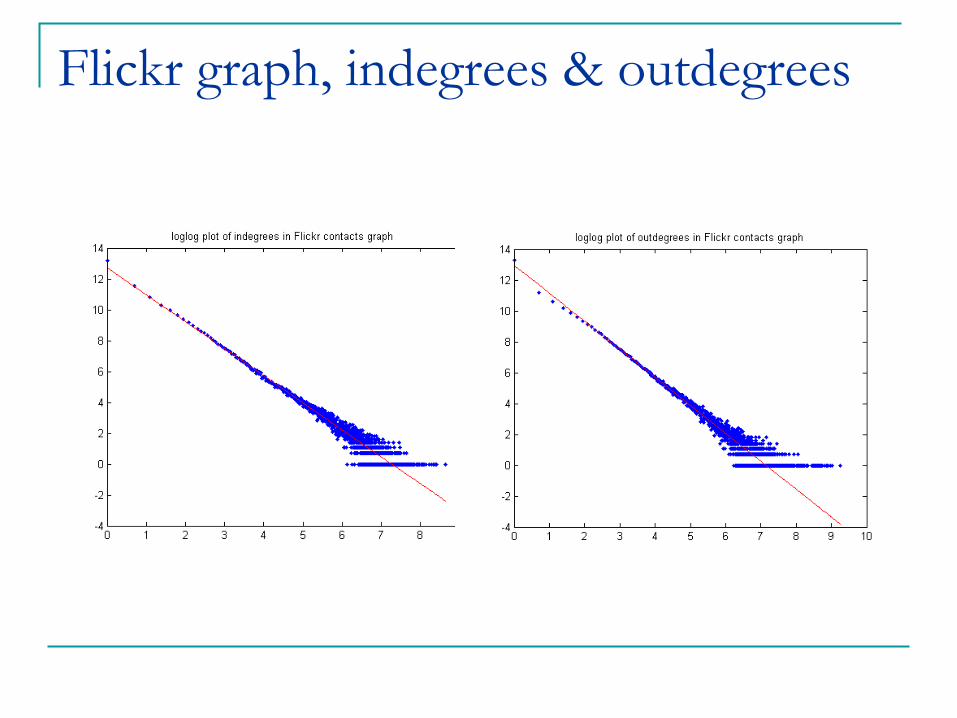
Flickr graph, indegrees & outdegrees

Flickr tags
~10K tags
We focus on a set of 1700
Different growth patterns:
bursty (“halloween” or “katrina”)
smooth (“landscape” or “bw”)
periodic (“moon”)
For each tag, define an action corresponding
to using the tag for the first time.
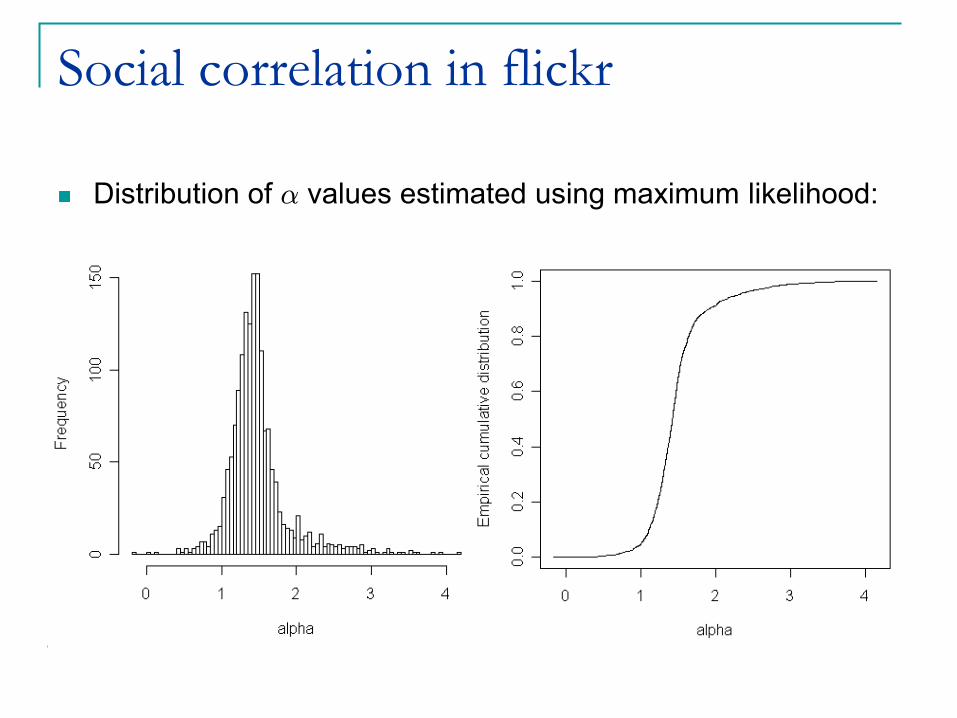
Social correlation in flickr
Distribution of ® values estimated using maximum likelihood:

Distinguishing influence
Recall: graph G, set W of active nodes
Non-influence models
Homophily: first W is picked, then G is picked from a distribution that depends on W
Confounding factors: both G and W are picked from distributions that depend on another var X.
Generally, we consider this correlation model:
(G,W) are selected from a joint distribution
Each agent in W picks an activation time i.i.d. from a distribution on [0,T].

Testing for influence
Simple idea: even though an agent’s probability of
activation can depend on friends, her timing of
activation is independent
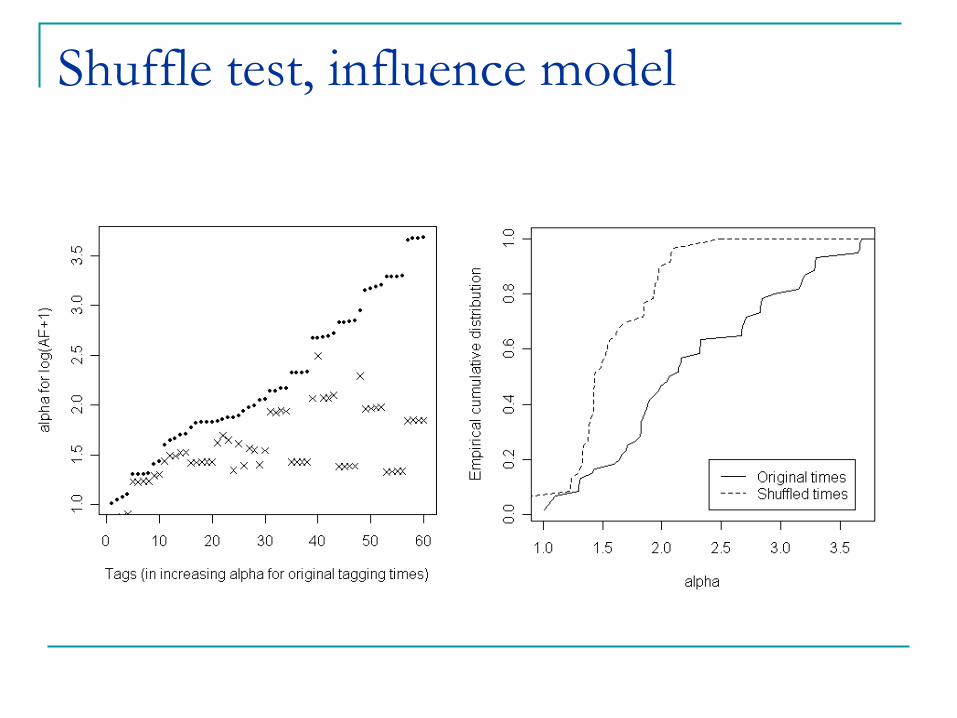
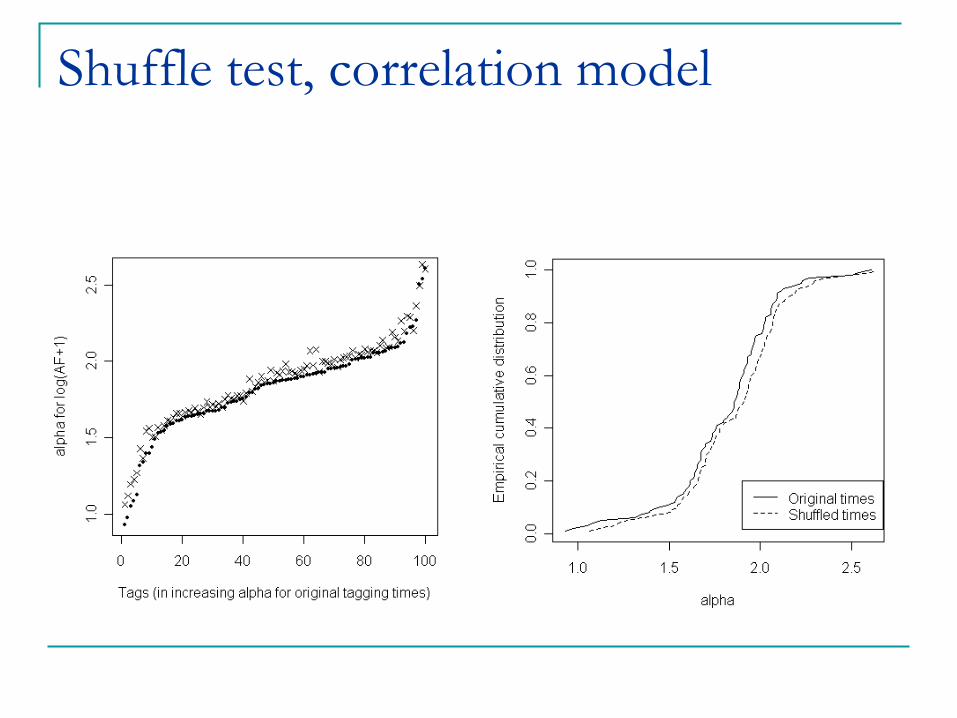
Shuffle Test: re-shuffle the time-stamp of all actions, and re-estimate the coefficient ®. If
different from original ®, social influence can’t be
ruled out.
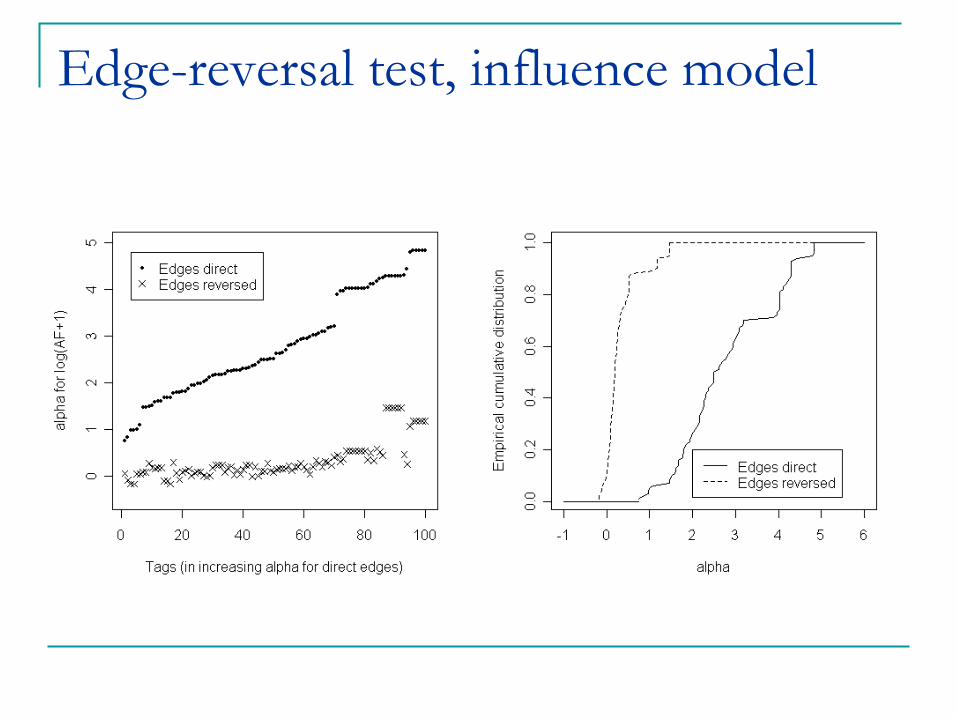
Edge-Reversal Test: reverse the direction of all edges, and re-estimate ®.
Shuffle Test, Theoretical Justification
Theorem. If the graph is large enough, time-shuffle test rules out the general model of correlation.
Intuition: in correlation model, the distribution of the data remains the same if time-stamps are shuffled.
Challenge: prove concentration.
Proof sketch: First use Azuma’s martingale inequality to show that Ya’s
and Na’s are concentrated.
Then show that the maximum likelihood estimate for ® is a continuous function of Ya’s and Na’s.
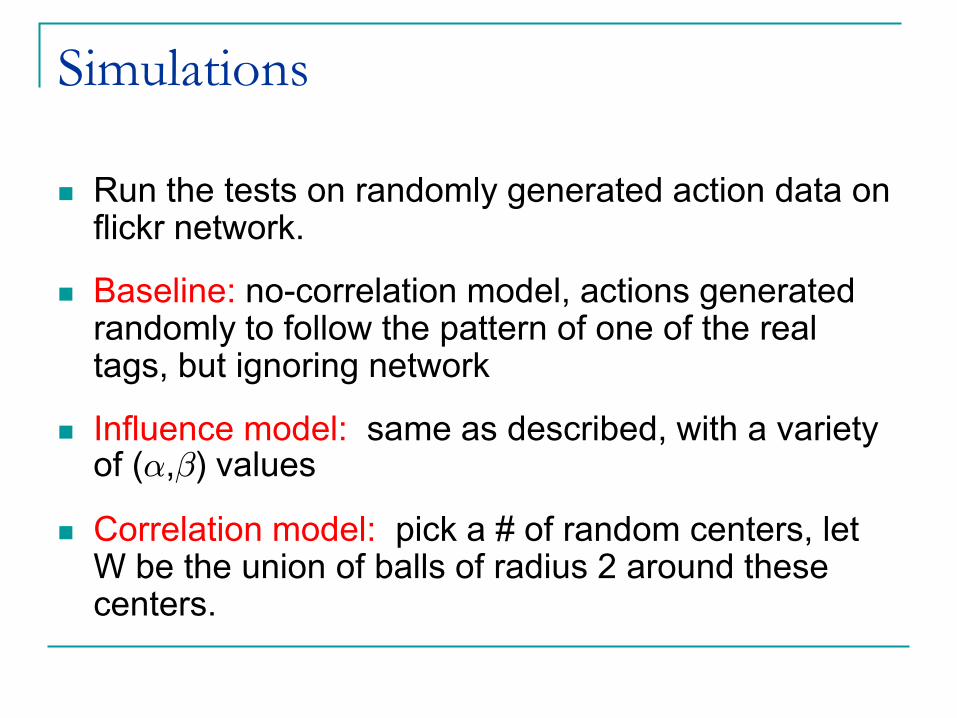
Simulations
Run the tests on randomly generated action data on flickr network.
Baseline: no-correlation model, actions generated randomly to follow the pattern of one of the real tags, but ignoring network
Influence model: same as described, with a variety of (®,¯) values
Correlation model: pick a # of random centers, let W be the union of balls of radius 2 around these centers.

Simulation results, baseline
Shuffle test, influence model
Shuffle test, correlation model
Edge-reversal test, influence model
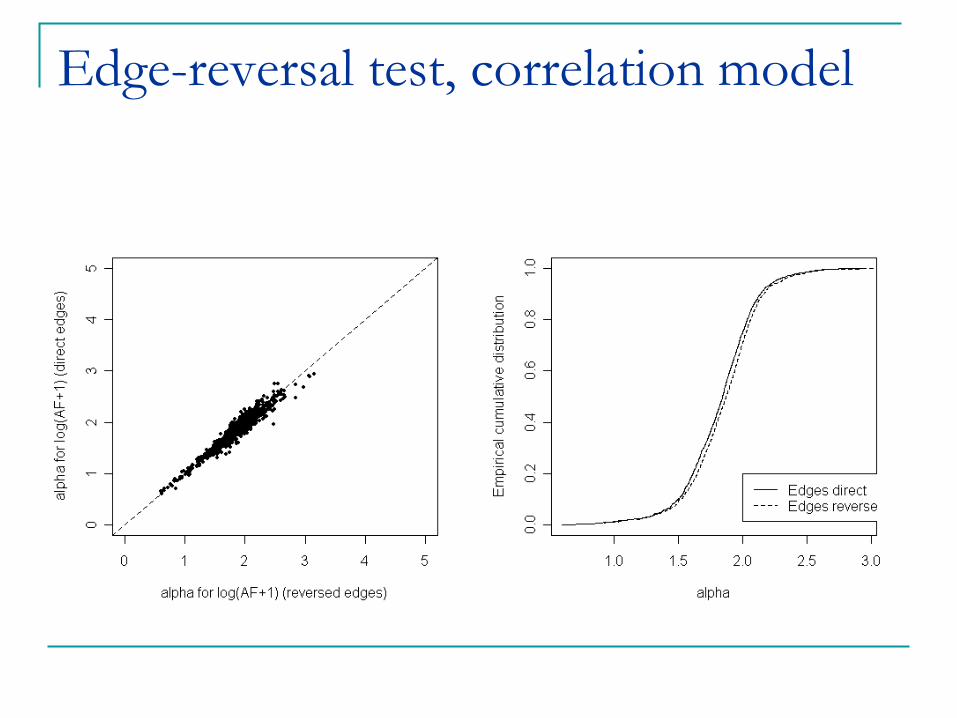
Edge-reversal test, correlation model
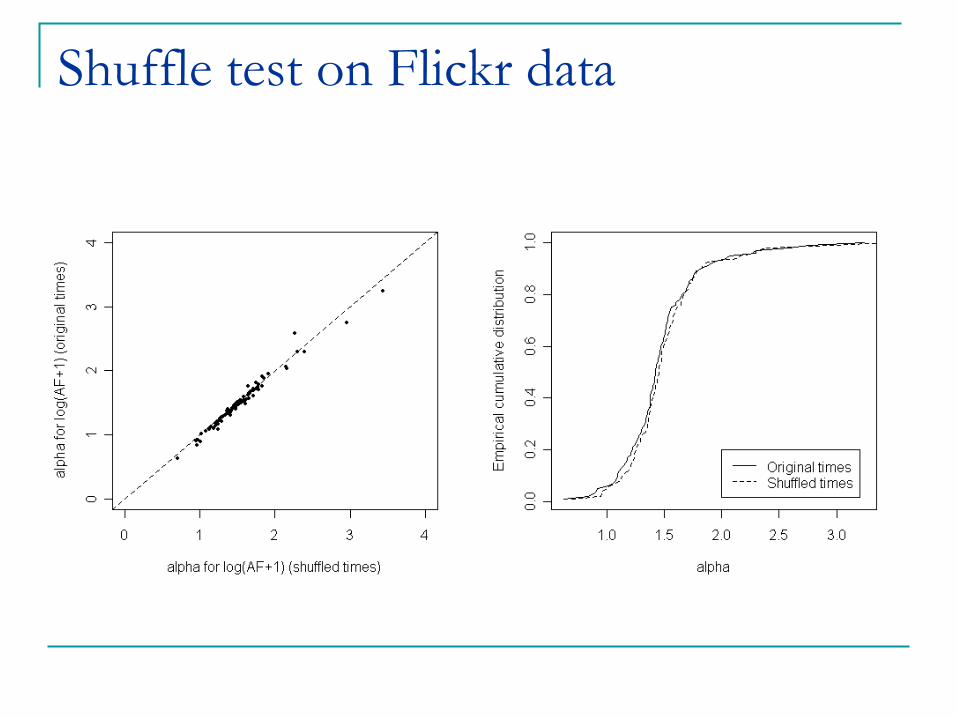
Shuffle test on Flickr data
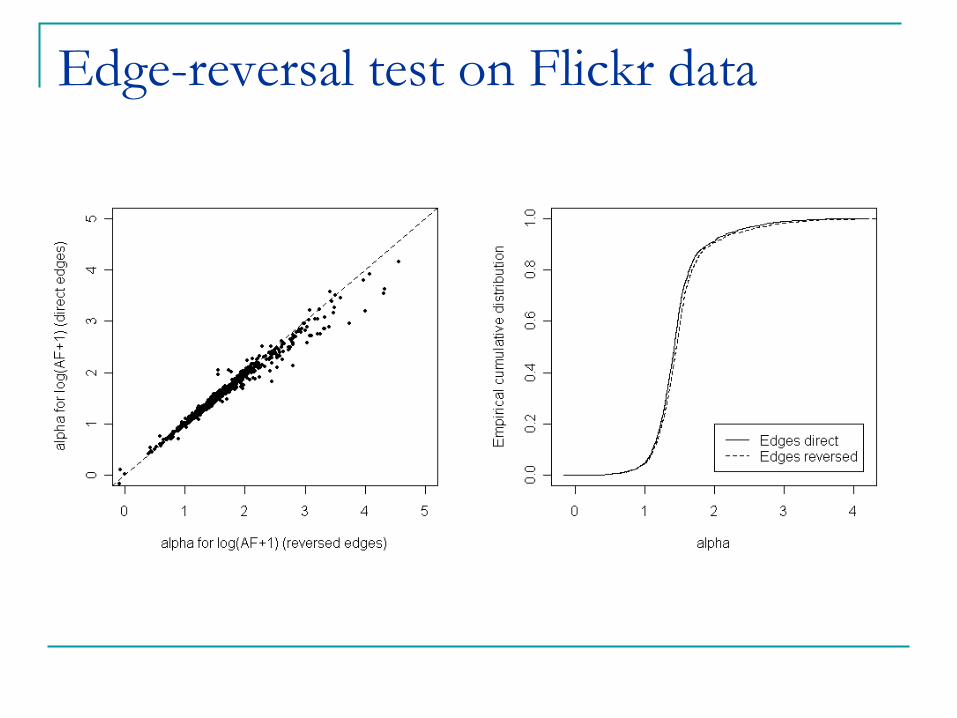
Edge-reversal test on Flickr data
Conclusions
Our contributions
Defined two models that exhibit correlation, one with and the other without social influence.
Developed statistical tests to distinguish the two
Theoretical justification for one of the tests.
Simulations suggest that the tests “work” in practice.
On Flickr, we conclude that despite considerable correlation, no social influence can be detected.
Discussion
cannot conclusively say there is influence without controlled experiments (example: flu shot)
still can rule out potential candidates
Open: develop algorithms to find “influential” nodes/communities given a pattern of spread.