Embed Size (px)
Citation preview
Inflation Report November 2011
Costs and prices

Chart 4.1 Measures of annual inflation(a)
(a) Data are non seasonally adjusted.

Chart 4.2 Direct contribution of energy prices to CPI inflation and Bank staff’s central estimate of VAT contribution(a)
Sources: Bloomberg, Department of Energy and Climate Change, ONS and Bank calculations.
(a) Contributions to annual CPI inflation. Data are non seasonally adjusted.(b) The estimate is based on Bank staff’s assessment that three quarters of the increase in VAT in January 2011 was passed into consumer prices by the end of 2011 Q1. The VAT contribution is adjusted to allow for the fact that changes in VAT are already incorporated in the fuels and lubricants contribution.(c) Bank staff estimates. Electricity, gas and other fuels estimates are based on price increases announced by utility companies. Fuels and lubricants estimates use Department of Energy and Climate Change petrol price data for October and are then based on the November 2011 sterling oil futures curve shown in Chart 4.4.

Chart 4.3 Sterling wholesale gas prices(a)
Sources: Bloomberg, Thomson Reuters Datastream and Bank calculations.
(a) The futures prices shown are averages during the fifteen working days to 9 November 2011 and 3 August 2011.(b) One-day forward price of UK natural gas.
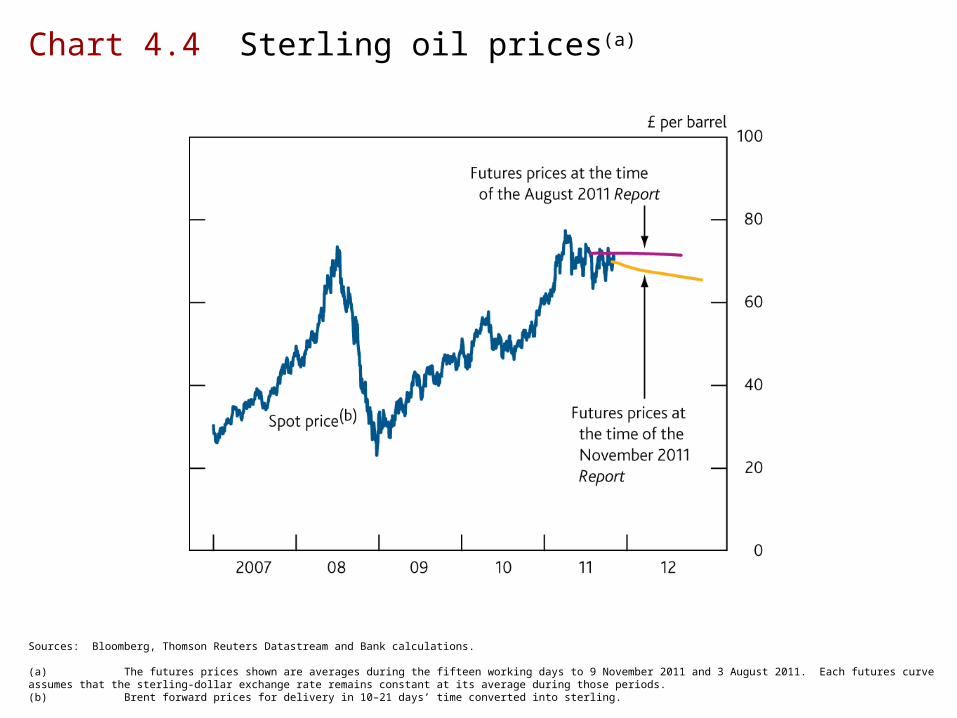
Chart 4.4 Sterling oil prices(a)
Sources: Bloomberg, Thomson Reuters Datastream and Bank calculations.
(a) The futures prices shown are averages during the fifteen working days to 9 November 2011 and 3 August 2011. Each futures curve assumes that the sterling-dollar exchange rate remains constant at its average during those periods.(b) Brent forward prices for delivery in 10–21 days’ time converted into sterling.

Chart 4.5 Dollar oil and industrial metals prices
Sources: Bloomberg, Standard & Poor’s, Thomson Reuters Datastream and Bank calculations.
(a) Brent forward prices for delivery in 10–21 days’ time in dollars. (b) S&P (dollar) commodity price index.
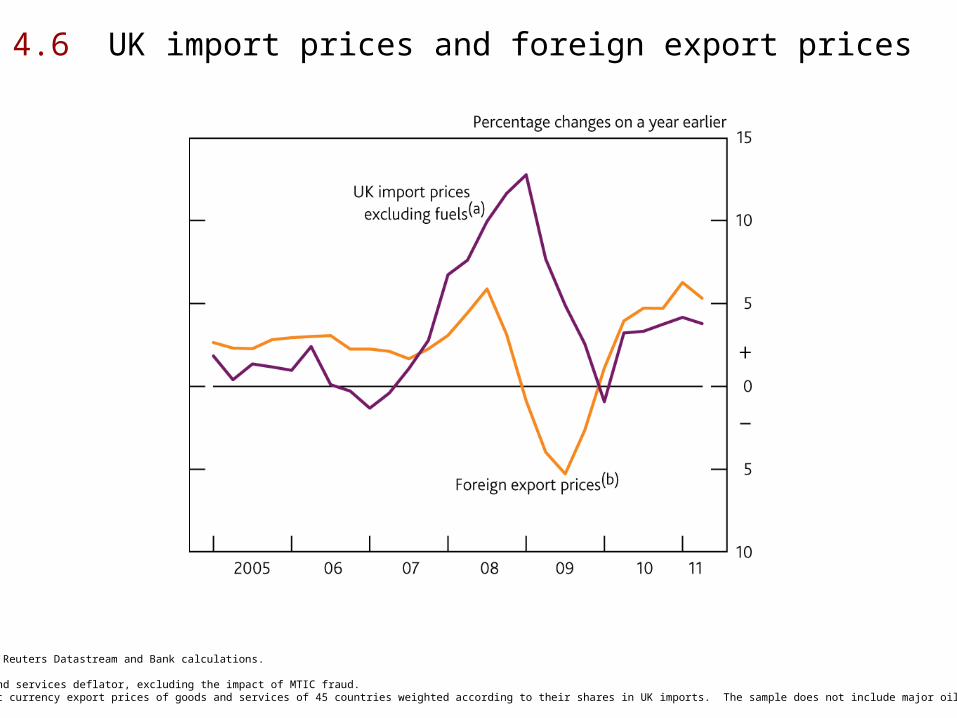
Chart 4.6 UK import prices and foreign export prices
Sources: ONS, Thomson Reuters Datastream and Bank calculations.
(a) Goods and services deflator, excluding the impact of MTIC fraud.(b) Domestic currency export prices of goods and services of 45 countries weighted according to their shares in UK imports. The sample does not include major oil exporters.

Chart 4.7 Sterling food prices
Sources: Department for Environment, Food and Rural Affairs, ONS, Standard & Poor’s, Thomson Reuters Datastream and Bank calculations.
(a) The latest observation is September 2011.(b) Monthly average of daily S&P (dollar) commodity price index, converted into sterling using monthly average of market exchange rates. The latest observation is October 2011.(c) The latest observation is August 2011.

Chart 4.8 Measures of domestically generated inflation
Sources: ONS (including the Labour Force Survey) and Bank calculations.
(a) Export prices include a contribution from imported components, so this measure uses an estimate of export prices excluding the contribution from import prices.(b) Calculated using average weekly earnings data, adjusted using the ratio of National Accounts compensation and wages and salaries data, and divided by output per worker.

Chart 4.9 Corporate profit share (excluding financial corporations and the oil sector)
Sources: ONS and Bank calculations.
(a) A recession is defined as at least two consecutive quarters of falling output (at constant market prices) estimated using the latest data. The recession is assumed to end once output began to rise.(b) PNFCs’ gross operating surplus (excluding the alignment adjustment) minus the gross trading profits of continental shelf companies, divided by gross value added at factor cost.

Chart 4.10 Whole-economy regular pay, labour productivity and the unemployment rate
Sources: ONS (including the Labour Force Survey) and Bank calculations.

Tables

Table 4.A Private sector earnings(a)
Sources: Bank of England, Incomes Data Services, the Labour Research Department, ONS and XpertHR.
(a) Based on quarterly data unless otherwise stated.(b) Data in the two months to August.(c) Average over the past twelve months, based on monthly data.(d) Percentage points.

Table 4.B Indicators of longer-term inflation expectations
Sources: Bank of England, Barclays Capital, Bloomberg, Citigroup, GfK NOP, HM Treasury, YouGov and Bank calculations.
(a) Since 2009 Q1 for Bank/NOP data. Since 2008 Q3 for Barclays Basix data.(b) YouGov/Citigroup data are for October. RPI implied from swaps data are averages from 1 October to 9 November.(c) The questions ask about expected changes in prices, but do not reference a specific price index. Measures are based on the median estimated price change. (d) Taken from Forecasts for the UK economy: a comparison of independent forecasts. Based on the average of medium-term projections.(e) Five-year, five-year forward RPI inflation implied from swaps.