Embed Size (px)
Citation preview

BANK OF MAURITIUS
INFLATION REPORT
November 2009

All rights reserved. No part of this publication may be reproduced, stored in any retrieval systemor transmitted by any mechanical, electronic or digital means or otherwise without the priorpermission of the publisher, the Bank of Mauritius.The contents of this publication are intended for general information only and are not intendedto serve as financial or other advice. While every precaution is taken to ensure the accuracy ofinformation, the Bank of Mauritius shall not be liable to any person for inaccurate informationor opinions contained in this publication.
The Report is available in PDF format on the Bank’s website at http://bom.intnet.mu under themenu item Research and Publications. The Bank of Mauritius welcomes any comments orsuggestions on this publication. You may send your e-mails to [email protected].
Inflation Report November 2009 | Issue No. 3
© Bank of Mauritius 2009
Conception and Design by Khalil Muthy.
Printed by LOVELLS PRINTING AND ARTWORK LTD.
ISBN : 978-99949-27-90-6
The Inflation Report is published twice a year by the Bank of Mauritius in accordance withsection 33(2)(b) of the Bank of Mauritius Act 2004. It provides an analysis of inflationdevelopments as well as the assessment underpinning monetary policy, and concludes with theoutlook for inflation. This issue of the Inflation Report refers to information for the semesterended 30 June 2009 unless otherwise stated.
Acknowledgement
The preparation of this Report was led by Mr W. Khodabocus, Chief-Monetary Policy Unit,with assistance from Ms M. Mudhoo, Analyst. Mr V. Punchoo, Head-Economic AnalysisDivision, edited the draft Report before it was cleared by the Publications Review Committeeof the Bank of Mauritius. Substantive contributions were made by the following officers:Mr W. Khodabocus, Mr S. Ramrutton, Mr N. Daworaz, Ms M. Mudhoo, Mr I. Ramlall andMr F. Sooklall for the chapter on Overview; Mr G. Beegoo and Mr M. H. Gendoo for thechapter on Recent Developments in Inflation; Mr A. Haulkhory, Ms M. Jhamna, Mr S. Jugooand Ms M. Mudhoo for the chapter on Demand and Output; Mrs P. Lo Tiap Kwong,Mr C. Ellapah, Mr S. Ramrutton, Mr N. Daworaz, Mr M. H. Gendoo, Mr M. Mohesh andMr I. Ramlall for the sections on Monetary and Financial Developments; Mr W. Khodabocusand Mr G. Beegoo for the chapter on The Outlook for Inflation.
The following officers contributed to the Boxes in the Report: Mr G. Beegoo - Evolution of thePrices of Mogas and Diesel Oil under the Automatic Pricing Mechanism and InflationExpectations; and, Mr F. Sooklall - The Impact of the Global Crisis on Trade.

INFLATION REPORT
November 2009 | Issue No. 3
pageList of Tables, Charts and Boxes viList of Acronyms vii1 Overview 1
1.1 The External Environment 11.2 The Domestic Environment 51.3 Monetary Policy 7
2 Recent Developments in Inflation 92.1 Global Inflation and Costs 92.2 Inflation: Headline and Core 112.3 Evolution of Major Commodity Group Indices 122.4 Evolution of Other Price/Cost Indices 13
3 Demand and Output 173.1 Consumption 183.2 Investment 193.3 Foreign Trade and External Demand 193.4 Labour Market 23
4 Monetary and Financial Developments 254.1 Monetary and Credit Developments 254.2 Money Market 274.3 Interest Rates 294.4 Foreign Exchange Market and Exchange Rates 29
5 The Outlook for Inflation 335.1 Risks to the Inflation Outlook 33
Contents

vi
List of Tables, Charts and BoxesPage
TablesTable 1.1 Real Growth Rates in Selected Economies 2Table 1.2 Consumer Prices 4Table 1.3 Decisions of the MPC on the Key Repo Rate 8Table 2.1 Non-energy Commodities 10Table 2.2 Food and Non-food Inflation 12Table 2.3 Goods and Services Inflation 13Table 2.4 Import Price Index 14Table 2.5 Producer Price Inflation 14Table 2.6 Changes in the Wage Rate Index by Industry Group 15Table 3.1 Components of Aggregate Demand - Real Growth Rate 19Table 3.2 Balance of Payments Summary 21Table 3.3 Unemployment Rate 23Table 4.1 Broad Money Liabilities, Domestic Credit and Net Foreign Assets 26
ChartsChart 1.1 Equity Indices of Selected Major International Stock Markets 3Chart 1.2 Equity Indices of Selected Emerging Stock Markets 4Chart 1.3 Selected Central Banks’ Policy Interest Rates 5Chart 1.4 SEMDEX and SEM-7 6Chart 1.5 Inflation Rate 7Chart 2.1 Inflation in Selected Countries 9Chart 2.2 Oil Prices 10Chart 2.3 FAO Food Price Index and Other Food Commodity Price Indices 10Chart 2.4 Inflation - twelve-month average and year-on-year 11Chart 2.5 Inflation and Core Inflation - twelve-month average 11Chart 2.6 Inflation and Core Inflation - year-on-year 12Chart 2.7 Weighted Contribution of Main Divisions to the Change in the CPI 12Chart 2.8 Weighted Contribution of Main Divisions of the CPI Basket to Inflation 12Chart 2.9 Headline, Food and Non-food Inflation - twelve-month average 13Chart 2.10 Headline, Food and Non-food Inflation - year-on-year 13Chart 2.11 Goods and Services Inflation - twelve-month average 13Chart 2.12 Goods and Services Inflation - year-on-year 13Chart 2.13 Producer Price Inflation for Manufacturing and Agriculture -
twelve-month average 14Chart 2.14 Producer Price Inflation for Manufacturing and Agriculture - year-on-year 15Chart 3.1 Real Economic Growth Rate 17Chart 3.2 Real Economic and Consumption Growth Rates 18Chart 3.3 Real Household Consumption Growth Rate and Real Growth Rate in
Credit to Households 19

vii
Chart 3.4 Imports, Exports and Net Exports of Goods and Services as a Percentage of GDP 20
Chart 3.5 Main Export Destinations in the First Semester of 2009 21Chart 3.6 Main Sources of Imports in the First Semester of 2009 22Chart 3.7 Quarterly Value of Nominal Exports and Imports of Goods 22Chart 3.8 Quarter-on-quarter Seasonally-adjusted GDP and
Employment Growth Rates 23Chart 4.1 Growth Rates of Monetary Base and Broad Money Liabilities 25Chart 4.2 Growth Rates of Broad Money Liabilities and Credit to
Private Sector and Inflation 25Chart 4.3 Distribution of the Increase in Banks’ Credit to the Private Sector 27Chart 4.4 Banks’ Daily Excess Reserves 27Chart 4.5 Overnight Weighted Average Interbank Interest Rate 28Chart 4.6 Movements in Yields on Treasury/Bank of Mauritius Bills 28Chart 4.7 Evolution of Yields on Treasury Notes 28Chart 4.8 Key Repo Rate and Deposit and Lending Rates 29Chart 4.9 Evolution of the US dollar against the Pound sterling and the euro 29Chart 4.10 Exchange Rate Movements 30Chart 4.11 MERI1 and MERI2 31Chart 4.12 Movements in the Real Effective Exchange Rate 31Chart 5.1 Inflation Fan Chart 34
BoxesBox 1 Evolution of the Prices of Mogas and Diesel Oil under the
Automatic Pricing Mechanism 16Box 2 The Impact of the Global Crisis on Trade 24Box 3 Inflation Expectations 35
List of Acronyms
APM Automatic Pricing MechanismBML Broad Money LiabilitiesBSE Bombay Stock ExchangeCPI Consumer Price indexCSO Central Statistics OfficeECB European Central BankEIA Energy Information Administration (of the US Department of Energy)FAO Food and Agriculture Organisation FDI Foreign Direct Investment
FPI Food Price Index (FAO)GDP Gross Domestic ProductIMF International Monetary FundIPE International Petroleum ExchangeIPI Import Price IndexIRS Integrated Resort SchemeMERI Mauritius Exchange Rate IndexMPC Monetary Policy CommitteeNYMEX WTI New York Mercantile Exchange West Texas IntermediateODC Other Depository CorporationsOECD Organisation for Economic Co-operation and DevelopmentPLR Prime Lending RatePPI-A Producer Price Index-AgriculturePPI-M Producer Price Index-ManufacturingSEMDEX Stock Exchange of Mauritius Index SSEC Shanghai Stock ExchangeWEO (IMF’s) World Economic OutlookWRI Wage Rate Index
viii

Global economic and financial conditionsremained weak during the first semester of 2009.Most major economies were still in economicrecession, although signs that they were pullingout of the recession started to emerge. Thecontraction of economic activity and trade hadseverely undermined labour market conditions aswell as business and consumer confidence. Financial markets conditions continued to worseninitially. Unprecedented interventions bygovernments and central banks worldwide andhopes of economic recovery in the second quarterof 2009 led to some gradual improvement. Thesupply of credit eased to some extent but overallfinancial conditions remained relatively tight.Major stock markets began recovering towardsthe end of the first quarter of 2009.Global disinflationary pressures that had gatheredmomentum from late 2008 onwards partly as aresult of the substantial economic slack graduallystabilised around the second quarter of 2009.Consequently, the synchronised fall in inflation inmost advanced as well as emerging and developingeconomies slowed down. Rising oil and food priceson international markets in the second quarter of2009 had but a limited impact on global inflation. The global economic crisis adversely affected theMauritian economy after September 2008. Theexport sector, specifically textile and tourism, washard hit as demand from main export markets -chiefly the United Kingdom, the euro area and theUnited States - weakened significantly. Thedomestic economy is forecast to grow by 2.7 percent in 2009, well below the trend growth ofaround 5 per cent in the past five years.1
Weaker economic prospects amid an improvedinflation outlook in the first semester of 2009 ledthe Bank of Mauritius and the government topursue expansionary economic policies further ina coordinated response to shore up the domesticeconomy. The government announced additionalmeasures in its 2009 budget aimed at saving jobs,protecting people and preparing for recovery witha view to consolidating the fiscal stimuluspackage of December 2008. While the full effectsof the fiscal stimulus and the easing of themonetary policy stance were yet to be felt, theymay have contributed to upholding business aswell as consumer confidence.
1.1 THE EXTERNAL ENVIRONMENTGlobal economic performance amidsigns of recoveryDuring the first semester of 2009, large areas ofthe global economy continued to contractalthough the rate of decline had started tomoderate significantly in the second quarter. Afew advanced economies including Japan, Franceand Germany recovered in the second quarter,albeit moderately, while economic prospectsbrightened in major emerging economies.Financial markets conditions also improved. Atthis juncture, the global economy is still verymuch vulnerable and dependent on theextraordinary macroeconomic policy stimulusacross the world. The global economy is expectedto contract in 2009 but recover in 2010. Real economic activity in G-7 countries as agroup contracted further by 2.2 per cent in thefirst quarter of 2009 but recorded zero growth inthe second quarter. Towards the end of the firstquarter and during the second quarter of 2009, asfinancial strains and the pace of economic declinebegan to ease, an increasing number of developedand emerging economies had started to showsigns of recovery. Developing economies were hitharder due to weaker external demand, fallingcommodity prices and lower capital flows amidrising concerns about national economicprospects, particularly in economies that hadpreviously relied extensively on externalfinancing. The global economic adjustment led toa broad-based deterioration of labour markets andunemployment worldwide rose significantly. According to the forecast of the InternationalMonetary Fund (IMF) released in its WorldEconomic Outlook (WEO) of October 2009,world output is projected to contract by 1.1 percent in 2009 but expand by 3.1 per cent in 2010.The IMF revised its growth forecast for 2010upward by 0.6 percentage point compared to itsprevious forecast made in July 2009. With theexception of Japan, growth rates were marked upfor all other G-7 economies. The growth rate ofemerging and developing economies wasprojected at 0.4 percentage point higher thaninitially forecast. Table 1.1 provides details ongrowth rates in selected economies.
1
1. OVERVIEW
1 The CSO’s latest growth projection for 2009 is around 2.8 per cent, asannounced in the 2010 Budget Speech.

The contraction in real output in the United Statesslowed from an annual rate of 6.4 per cent in thefirst quarter of 2009 to a surprising 0.7 per cent inthe second quarter. Private consumption,investment, exports and inventories continued tohave negative contributions to growth in thesecond quarter, but their pace of contraction easedrelative to the first quarter. Housing marketconditions were improving: existing home salesrose for the third month in a row and house priceshit their highest level since October 2008 in June2009. The labour market, which tends to lag therest of the economy, remained underminedalthough the pace of deterioration moderated asthe unemployment rate edged up slightly in June2009 to 9.5 per cent from 9.4 per cent in May.Financial markets tensions and risk aversioneased and consumers felt less pessimistic aboutthe economy. According to the IMF’s October2009 WEO, the US economy is projected tocontract by 2.7 per cent in 2009 but will recoverin 2010 growing at a rate of 1.5 per cent.Japan’s economy contracted by 3.3 per cent in thefirst quarter of 2009 compared to the previousquarter, but recovered in the second quarter topost a positive growth of 0.7 per cent. Afterfalling in the first quarter of 2009, industrialproduction was bolstered in the second quarter,posting strong gains in May. Exports started tostrengthen in the second quarter of 2009 and were
expected to boost industrial production, as firmshad almost completed their destocking cycle.However, public spending remained constrainedby soaring public debt. Further export growthappeared increasingly unsustainable, given thedegree to which deleveraging was stifling demandfor foreign goods from the United States andEurope. In October 2009, the IMF projected thatJapan’s economy would contract by 5.4 per centin 2009 but grow by 1.7 per cent in 2010.The euro zone economy contracted as well, butthe pace of contraction slowed as Germany andFrance unexpectedly pulled out of recession in thesecond quarter of 2009. Real output in the eurozone shrunk quarter-on-quarter by 2.5 per cent inthe first quarter of 2009 and by 0.2 per cent in thesecond quarter aided by the still fragile recoveryof its two largest economies in that quarter.Germany and France posted growth rates of 0.4per cent and 0.3 per cent, respectively, in thesecond quarter of 2009 against contractions of 3.5per cent and 1.4 per cent, respectively, in the firstquarter of 2009. Economic conditions elsewherein the euro zone also improved with lower rates ofcontraction and even small positive growth ratesfor a few member countries. Germany was thehardest hit in the first quarter of 2009 as itsexports fell drastically on slumping globaldemand. Further signs of improvement emerged,such as slower declines in retail sales and
Inflation Report Bank of Mauritius
2
Table 1.1: Real Growth Rates in Selected Economies

industrial production. However, financialconditions remained weak and unemploymentwas on the rise hitting 9.4 per cent in June 2009.In October 2009, the IMF projected the euro zoneeconomy to contract by 4.2 per cent in 2009 butgrow by 0.3 per cent in 2010. The economy of the United Kingdom contractedconsiderably in the first semester of 2009, withGDP contracting by 2.5 per cent and 0.6 per centin the first and second quarters of 2009,respectively. The continuing contraction in globaleconomic activity led to a fall in UK exports andfurther cutbacks in domestic spending. Householdspending fell as consumers were confronted withrising unemployment, tighter credit conditionsand falling real and financial asset prices.According to the IMF’s estimates released inOctober 2009, the UK economy is expected tocontract by 4.4 per cent in 2009 but grow by 0.9per cent in 2010.In emerging economies, export growthdecelerated rapidly and capital inflows fellsignificantly. Lower international demand formanufactured goods had a particularly severeeffect on the Asian region, with some countriesrecording double-digit percentage declines inexports and industrial production. Growth inChina’s economy slowed in the first quarter of2009 to 6.1 per cent, but aggressive policystimulus measures boosted domestic demand andgrowth accelerated to 7.9 per cent in the secondquarter. In June 2009, manufacturing surveysindicated expansion, residential property marketshowed signs of stabilisation, and fixedinvestment started to surge. The Indian economywas estimated to slow down in 2009 in the wakeof the prolonged global economic downturn,reflecting slowdown of growth in all itsconstituent sectors. In October 2009, the IMFestimated that China would register growth ratesof 8.5 per cent and 9.0 per cent and India, growthrates of 5.4 per cent and 6.4 per cent in 2009 and2010, respectively.
InflationThe decline in inflation that started in late 2008was sustained in the first half of 2009 partly dueto the economic slowdown and the relative
stabilisation of oil and food prices at lower levelsrelative to a year ago. Several economies,especially advanced economies such as the UnitedStates, the euro zone and Japan, even entereddeflation territory. Inflation in the euro area, theUnited Kingdom and the United States fell to -0.1per cent, 1.8 per cent and -1.4 per cent,respectively, in June 2009. Inflation also declined in emerging economies,with China and Singapore, whose economies wereseverely hit by falling exports, experiencingdeflation. Likewise, Thailand had deflation forthe sixth straight month to June 2009. Coreinflation also continued to fall in most economies.The inflation rates in selected economies areshown in Table 1.2.
International stock marketsInternational equity markets posted, broadly, aV-shaped performance during the period Januaryto June 2009. From the start of the year to thebeginning of March, stock markets followed adownward trend amid mounting worries aboutthe global economic outlook and reduced riskappetite. On 9 March 2009, markets recordedtheir lowest performance due to deepeningconcerns about the health of the world economywith rising fears of a collapse of bankingsystems worldwide. Thereafter, internationalstock markets both in advanced as well as inemerging market economies gradually climbedto higher levels. Chart 1.1 shows movements inmajor international stock market indices.Chart 1.1: Equity Indices of Selected MajorInternational Stock Markets
Source: Reuters.
1. Overview
3

The effects of fiscal and monetary policymeasures taken to mitigate the global downturn,with interest rates dropping to very low levels,helped bolster investors’ sentiment. The appetiteof investors grew over the three-month period toJune 2009. Further, broadly positive corporateannouncements boosted stock markets with hopesthat the worst might be over though growthprospects were still considered to be anaemic. With the exception of Shanghai Stock Exchange(SSEC), major emerging stock markets posted anegative performance in the period January toMarch 2009, reaching their lowest in the secondweek of March 2009. Thereafter, their performanceimproved consistently till the end of June. India andChina were the best performers among emergingeconomies, recording performances of 63.0 per centand 50.0 per cent, respectively, in the six months toJune 2009. Chart 1.2 shows the evolution ofselected emerging stock market indices.Chart 1.2: Equity Indices of Selected EmergingStock Markets
Source: Reuters.
Monetary policy in selected economiesCentral banks in a large number of advanced aswell as emerging and developing countriescontinued to loosen their monetary policy stancein the first semester of 2009, as global financialand economic conditions remained severelyundermined. Policy interest rates were furtherreduced to new historical lows, close to zero in anumber of cases. Where key interest rates hadreached near-zero levels, central banks wereapplying quantitative easing by purchasingsecurities and bonds to ease monetary conditionsand support credit markets. As a consequence, thecredit crunch in advanced economies graduallyeased by June 2009. Simultaneously, risk appetiteof financial investors, in general, improved.However, growth in bank credit continued to slowin advanced economies. The US Federal Reserve maintained the federalfunds rate in the target range of zero to 0.25 percent but continued to ease monetary conditions bypurchasing securities and lending to depositoryand other financial institutions. However, asfinancial markets showed signs of stabilising, theUS Federal Reserve outlined a series of specificrequirements for banks to exit the Troubled AssetRelief Program in order to promote a smoothtransition in markets.The European Central Bank (ECB) and the Bankof England aggressively reduced their respectivepolicy interest rates by 150 basis points to 1.0 percent and 0.5 per cent, respectively, in the firstsemester of 2009. The Bank of England had been
Inflation Report Bank of Mauritius
4
Table 1.2: Consumer Prices

5
1. Overview
simultaneously injecting liquidity into themonetary system by purchasing securities andbonds from the market. In June 2009, the ECBannounced, among non-standard measures, thepurchase of euro-denominated covered bondsissued in the euro area. The aim was to improveliquidity in the private debt security markets andencourage a further easing of credit conditions.Central banks in other advanced as well asemerging and developing economies - such as inAustralia, Canada, India, Malaysia, New Zealand,Norway, Sweden and Thailand - also reducedtheir key interest rates significantly to supporttheir economies. Chart 1.3 shows end-of-monthpolicy interest rates of selected central banks. Chart 1.3: Selected Central Banks’ Policy Interest Rates
Source: Reuters and central banks’ websites.
The outlook on monetary policy in most majoreconomies is likely to stay focused on low levelinterest rates for some time as economicprospects and labour markets remain vulnerable.However, while a few central banks alreadystarted tightening monetary policy as fromAugust 2009, some other central banks areexpected to begin adjusting their key interest rateupward early in 2010. The implementation of anexit strategy at the appropriate time remains animportant consideration for monetary policy inorder to prevent the resurgence of inflationarypressures following the low interest rateenvironment over a protracted period and theincrease in global money supply.
1.2 THE DOMESTIC ENVIRONMENTGrowthEconomic conditions in Mauritius were weak inthe first semester of 2009. Seasonally-adjusted
data showed that the quarter-on-quarter realoutput growth rate contracted by 0.8 per cent inthe first quarter of 2009 before recovering to 0.6per cent in the three months to June 2009.Disaggregated and unadjusted expenditure dataindicate that the contraction in real output in thefirst semester of 2009 relative to the secondsemester of 2008 was attributable to the marginalcontraction in domestic demand - reflecting lowerreal spending on final consumption expenditureand on gross fixed capital formation - and to asharp deceleration in net external demand ofgoods and non-factor services. On the supply side, output growth in the firstsemester of 2009 was dragged down by thecontraction in real activity of several key sectorsnamely manufacturing, construction, distributivetrade, and hotels and restaurants and thedeceleration of financial intermediation and realestate, renting and business activities. Therecovery of the sugar sector and robustperformance of transport, storage andcommunications helped contain the downsiderisks to the growth picture. Within themanufacturing sector, textile, which had startedto shrink as early as in the second quarter of2008, witnessed a sharper contraction in theperiod under review. Output in food processingslowed down while activity in othermanufacturing declined significantly. Quarterly data, however, indicated that the textileand hotels and restaurants sectors may havepassed their trough in the second quarter of 2009as the pace of contraction of real output in thesesectors has slowed down and the outlook in thesecond semester of 2009 is improving. Incontrast, the decline in real output in othermanufacturing and construction aggravated in thesecond quarter of 2009. Amid improving global conditions, the domesticeconomic outlook for the remaining of the yearbrightened up but the recovery to trend growthwill be slow. Trade-exposed sectors like textileand hotels and restaurants could recover muchfaster than others as these sectors have alreadyundertaken the necessary adjustment efforts tostay competitive. Sectors dependent on domestic
Inflation Report Bank of Mauritius
6
demand may, however, take longer to return to‘normal’ conditions. For 2009, the CentralStatistics Office (CSO) has revised upwards itsforecast for overall growth rate to 2.7 per centfrom an initial forecast of 2.5 per cent.The coordinated approach by government and thecentral bank in the last quarter of 2008 favouringan expansionary fiscal and monetary policycontinued during the six months to June 2009.The government consolidated the fiscal stimulusmeasures it announced in December 2008 in itsMay 2009 Budget, which made provision for anestimated total amount of Rs14.2 billion to bespent on infrastructure works, structuraladjustment measures and financial aid to theprivate sector over a period of eighteen months.The key Repo Rate was reduced by another 100basis points to a historical low 5.75 per cent inMarch 2009.
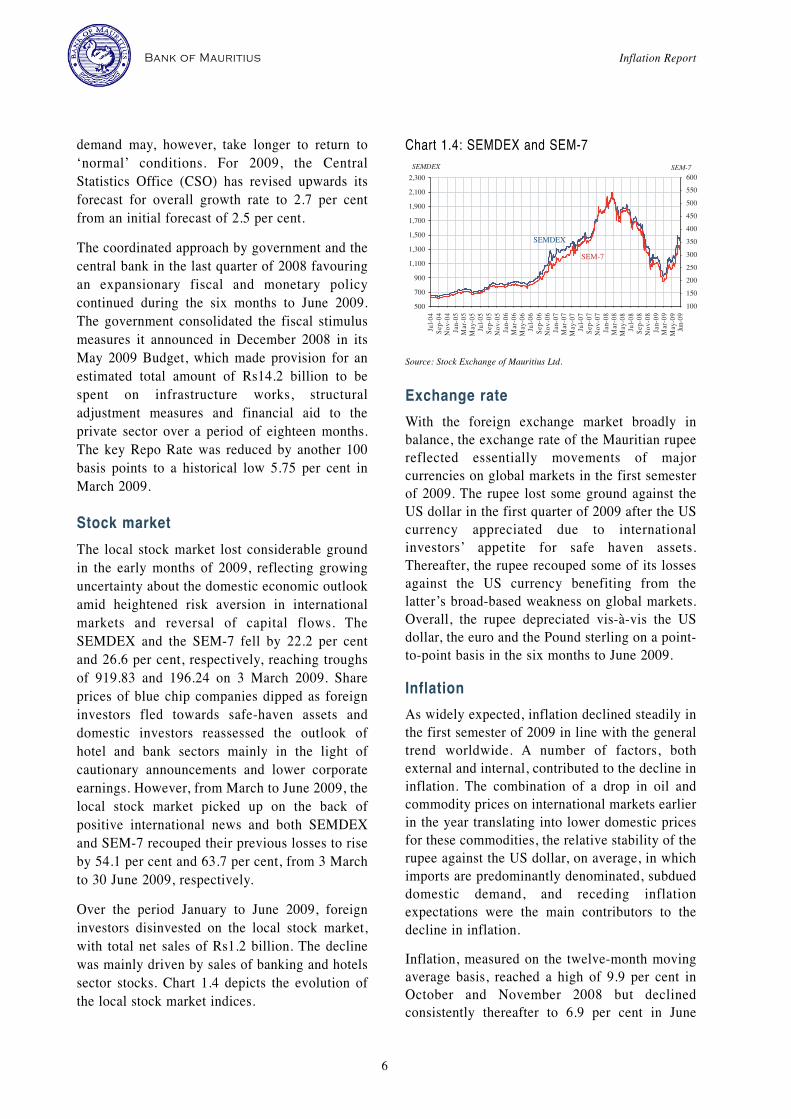
Stock marketThe local stock market lost considerable groundin the early months of 2009, reflecting growinguncertainty about the domestic economic outlookamid heightened risk aversion in internationalmarkets and reversal of capital flows. TheSEMDEX and the SEM-7 fell by 22.2 per centand 26.6 per cent, respectively, reaching troughsof 919.83 and 196.24 on 3 March 2009. Shareprices of blue chip companies dipped as foreigninvestors fled towards safe-haven assets anddomestic investors reassessed the outlook ofhotel and bank sectors mainly in the light ofcautionary announcements and lower corporateearnings. However, from March to June 2009, thelocal stock market picked up on the back ofpositive international news and both SEMDEXand SEM-7 recouped their previous losses to riseby 54.1 per cent and 63.7 per cent, from 3 Marchto 30 June 2009, respectively.Over the period January to June 2009, foreigninvestors disinvested on the local stock market,with total net sales of Rs1.2 billion. The declinewas mainly driven by sales of banking and hotelssector stocks. Chart 1.4 depicts the evolution ofthe local stock market indices.
Chart 1.4: SEMDEX and SEM-7
Source: Stock Exchange of Mauritius Ltd.
Exchange rateWith the foreign exchange market broadly inbalance, the exchange rate of the Mauritian rupeereflected essentially movements of majorcurrencies on global markets in the first semesterof 2009. The rupee lost some ground against theUS dollar in the first quarter of 2009 after the UScurrency appreciated due to internationalinvestors’ appetite for safe haven assets.Thereafter, the rupee recouped some of its lossesagainst the US currency benefiting from thelatter’s broad-based weakness on global markets.Overall, the rupee depreciated vis-à-vis the USdollar, the euro and the Pound sterling on a point-to-point basis in the six months to June 2009.
InflationAs widely expected, inflation declined steadily inthe first semester of 2009 in line with the generaltrend worldwide. A number of factors, bothexternal and internal, contributed to the decline ininflation. The combination of a drop in oil andcommodity prices on international markets earlierin the year translating into lower domestic pricesfor these commodities, the relative stability of therupee against the US dollar, on average, in whichimports are predominantly denominated, subdueddomestic demand, and receding inflationexpectations were the main contributors to thedecline in inflation.Inflation, measured on the twelve-month movingaverage basis, reached a high of 9.9 per cent inOctober and November 2008 but declinedconsistently thereafter to 6.9 per cent in June

1. Overview
7
2009. The drop in year-on-year inflation wassharper, falling from 6.7 per cent to 3.3 per centfrom December 2008 to June 2009. The evolutionof inflation is depicted in Chart 1.5.Chart 1.5: Inflation Rate
Source: CSO, Government of Mauritius, and Bank calculations.
1.3 MONETARY POLICYThe central bank further eased monetary policyagainst the backdrop of a rapidly declininginflation rate and weak economic conditions.There were two important developments in theformulation of monetary policy during the periodunder review. First, the Governor announcedduring a press conference held on 23 June thatsection 5(2)(a) of the Bank of Mauritius Act 2004would be considered for implementation. The lawprovides that the Bank shall “... determine, withthe concurrence of the Minister [Minister ofFinance and Economic Empowerment], theaccepted range of the rate of inflation during agiven period consistent with the pursuit of theprice stability objective”. The fulfilment of thisrequirement will foster the anchoring of inflationexpectations. The wide-ranging benefits of well-anchored inflation expectations over the mediumto long term will accrue to businesses, householdsas well as the government and, ultimately,favourably influence economic progress.Second, the May 2009 Budget made provision forthe Monetary Policy Committee (MPC) to bestrengthened by expanding its membership tobring in more expertise.2 The number of external
members was raised to four from three previously.Since its establishment on 23 April 2007, theMPC has been striving to improve the quality ofits evaluation of the international and domesticenvironment and the outlook as well as thecommunication of the assessment underpinningits decision.
Monetary Policy Committee meetingsThe MPC of the Bank of Mauritius held tworegular meetings during the first semester of2009, the thirteenth on 26 March and thefourteenth on 22 June 2009.There was no change in the communication policyfor announcing the decision and assessment of theMPC. However, a new feature is the announcementof the subsequent meeting of the MPC in theMonetary Policy Statement released a week after ameeting as per the established practice.
Monetary policy decisionsThe global economic and financial situation hadfurther weakened when the MPC met on 26 March2009. Economic contraction, poor consumer andbusiness confidence, rising unemployment,financial markets strains and wealth destructionhad been afflicting major economies. The IMFhad downgraded its global growth outlook in itsWEO Update of January 2009 and was about todowngrade it further in the April 2009 WEO to aglobal economic slump that was going to be deepand protracted.Preliminary data suggested that domesticeconomic conditions had worsened significantlyon account of weakening external demand fortextiles and tourism services. The economicslowdown, which started in 2008, was expectedto continue in the first half of 2009. Meanwhile,the rapid decline in global inflation and the nearstabilisation of food and oil prices had led to areduction of domestic inflationary pressures aswell as to a marked fall in domestic inflation. TheMPC decided to further ease the monetary policystance with a view to further supporting theGovernment’s policy to stimulate the domesticeconomy. The MPC reduced the policy interestrate by 100 basis points on 26 March 2009 to anall-time low of 5.75 per cent per annum.
2 The Bank of Mauritius Act 2004 stands amended effective 30 July 2009providing for four external members to sit on the MPC.

Inflation Report Bank of Mauritius
8
Since the March 2009 MPC meeting, leadingindicators in major economies suggested thatglobal economic conditions were stabilisingalthough the global growth outlook remainedvulnerable. The unparalleled fiscal stimulus andmonetary policy easing implemented in a largenumber of countries together with the support tomajor financial systems were seen as a catalyst.Global inflation was stabilising at a low level.Domestically, exports of goods and services hadcontracted further in the second quarter of 2009and overall economic conditions had remainedweak while the inflation rate had continued todecline. The economic slowdown was expectedto have worsened in the second quarter of 2009given the weight of exports of goods and services
in the domestic economy. Amid a great deal ofuncertainty, the MPC considered that the fulleffects of the coordinated expansionaryeconomic policies were yet to be felt andanticipated a reversal of the declining trend inquarterly growth rate in the second half of 2009.The MPC, however, assessed that the inflationoutlook was clouded by uncertainties regardingthe future direction of commodity prices,particularly oil, on international markets andexchange rate movements and judged that, onbalance, the current stance of monetary policyremained appropriate. It decided to leave the keyRepo Rate on hold.The decisions on the key Repo Rate aresummarised in Table 1.3.
Table 1.3: Decisions of the MPC on the Key Repo Rate
As the international prices of most commoditiesdrifted downwards in the wake of lower demandemanating from the global economic slowdown,pressure on prices originating from importeditems continued to ease during the first half of2009. As a result, domestic inflation, both interms of year-on-year and twelve-month average,fell rapidly also benefiting from the base effectfrom past upswings in these prices anddevelopments in domestic demand conditions.
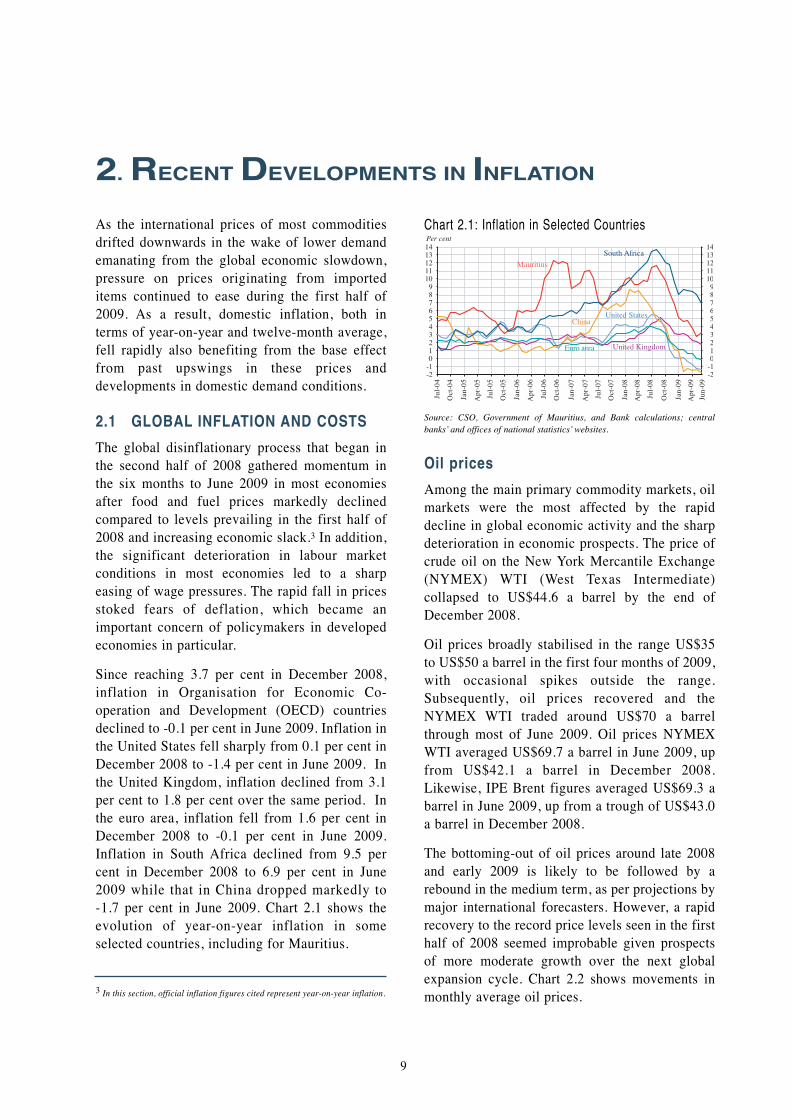
2.1 GLOBAL INFLATION AND COSTSThe global disinflationary process that began inthe second half of 2008 gathered momentum inthe six months to June 2009 in most economiesafter food and fuel prices markedly declinedcompared to levels prevailing in the first half of2008 and increasing economic slack.3 In addition,the significant deterioration in labour marketconditions in most economies led to a sharpeasing of wage pressures. The rapid fall in pricesstoked fears of deflation, which became animportant concern of policymakers in developedeconomies in particular.Since reaching 3.7 per cent in December 2008,inflation in Organisation for Economic Co-operation and Development (OECD) countriesdeclined to -0.1 per cent in June 2009. Inflation inthe United States fell sharply from 0.1 per cent inDecember 2008 to -1.4 per cent in June 2009. Inthe United Kingdom, inflation declined from 3.1per cent to 1.8 per cent over the same period. Inthe euro area, inflation fell from 1.6 per cent inDecember 2008 to -0.1 per cent in June 2009.Inflation in South Africa declined from 9.5 percent in December 2008 to 6.9 per cent in June2009 while that in China dropped markedly to-1.7 per cent in June 2009. Chart 2.1 shows theevolution of year-on-year inflation in someselected countries, including for Mauritius.
Chart 2.1: Inflation in Selected Countries
Source: CSO, Government of Mauritius, and Bank calculations; centralbanks’ and offices of national statistics’ websites.
Oil pricesAmong the main primary commodity markets, oilmarkets were the most affected by the rapiddecline in global economic activity and the sharpdeterioration in economic prospects. The price ofcrude oil on the New York Mercantile Exchange(NYMEX) WTI (West Texas Intermediate)collapsed to US$44.6 a barrel by the end ofDecember 2008. Oil prices broadly stabilised in the range US$35to US$50 a barrel in the first four months of 2009,with occasional spikes outside the range.Subsequently, oil prices recovered and theNYMEX WTI traded around US$70 a barrelthrough most of June 2009. Oil prices NYMEXWTI averaged US$69.7 a barrel in June 2009, upfrom US$42.1 a barrel in December 2008.Likewise, IPE Brent figures averaged US$69.3 abarrel in June 2009, up from a trough of US$43.0a barrel in December 2008.The bottoming-out of oil prices around late 2008and early 2009 is likely to be followed by arebound in the medium term, as per projections bymajor international forecasters. However, a rapidrecovery to the record price levels seen in the firsthalf of 2008 seemed improbable given prospectsof more moderate growth over the next globalexpansion cycle. Chart 2.2 shows movements inmonthly average oil prices.
9
2. RECENT DEVELOPMENTS IN INFLATION
3 In this section, official inflation figures cited represent year-on-year inflation.

Chart 2.2: Oil Prices
Source: Reuters.
Food pricesFood prices on the global market easedsignificantly following slowing demand andimproved supply prospects particularly foroilseeds and grains in major producing countries,as shown in Chart 2.3. The easing of marketconditions was reflected in the benchmark FoodPrice Index (FPI) compiled by the Food andAgriculture Organisation (FAO), which fell byaround 71 per cent in June 2009 from highsattained a year earlier.The FPI dropped in the first quarter of 2009,reaching nearly a two-year trough of 139 points inFebruary 2009, but recovered thereafter to 151points in June 2009. The rise in the FPI in thesecond quarter reflected renewed surge ininternational prices of several major agriculturalcommodities composing the FPI against thebackdrop of strong demand for grains, weatherconcerns and cultivation delays.Growing linkages between the agricultural,energy, financial and currency markets renderedfood prices increasingly exposed to externalshocks. Thus, a weak US dollar and a rebound inenergy prices could exert renewed upwardpressure on international food prices. However,with world staple food stocks at more comfortablelevels than in 2008 and barring any setback in cropproduction as well as a sharp rebound in energyprices, market conditions for food appear lessvulnerable to shocks than was the case in 2008.
Chart 2.3: FAO Food Price Index and Other FoodCommodity Price Indices
Source: FAO website.
Other commodity pricesPrices of non-energy commodities – such ascotton, timber and metals and minerals – declinedin the first six months of 2009 owing to theglobal economic downturn. Table 2.1 shows theannual averages of selected non-energycommodities for the years 2007 and 2008 and thefirst six months of 2009.Table 2.1: Non-energy Commodities
Source: World Bank’s Commodity Price Data.
Freight costsThe London-based Baltic Dry Index (BDI), whichis the benchmark for tracking commodity shippingcosts, bottomed out early in 2009 and startedrising by end-June 2009. The BDI hit a low of 774points on 24 December 2008 and thereafter, roseto 1,786 points on 30 April 2009 and further to3,757 points on 30 June 2009. Given that the BDI
Inflation Report Bank of Mauritius
10

2. Recent Developments in Inflation
11
is a measure of shipping rates, the increase in theBDI is regarded as an important indicator of animproving global economy.
2.2 INFLATION: HEADLINE AND CORE In the six months to June 2009, headlineinflation, both year-on-year and twelve-monthaverage, as well as core inflation have beenmoderating rapidly, as shown in Charts 2.4, 2.5and 2.6. The year-on-year inflation, defined asthe percentage change in the Consumer PriceIndex (CPI) in a given month compared to thesame month of the preceding year, was on a cleardowntrend up to June 2009 although itincreased on two occasions in between butremaining well below the rate of December 2008.From 6.7 per cent in December 2008, theinflation rate declined to 4.6 per cent in Februarybut edged up to 4.8 per cent in March. In Apriland May, it resumed its downward trend but roseagain in June to 3.3 per cent. The cumulativeeffect of administered price cuts in governmentimported flour, reduction in the price of breadand in cooking gas in early January 2009 werepartly offset by the subsequent hikes in domesticfuel prices under the Automatic PricingMechanism (APM).4
Chart 2.4: Inflation - twelve-month average andyear-on-year
Source: CSO, Government of Mauritius, and Bank calculations.
Inflation, as measured by the percentage changebetween the average CPI during a twelve-monthperiod and the average CPI during thecorresponding previous twelve-month period,also declined but not to the same extent as year-on-year inflation. It maintained a steady
downward path falling from 9.7 per cent inDecember 2008 to 8.5 per cent in March 2009 andfurther to 6.9 per cent in June 2009.
Core inflationThe measures of underlying inflation mirrored thepaths of headline inflation. The decline in CORE1and CORE2 inflation suggested a turning point inunderlying price pressures.5
Based on the twelve-month average methodology,CORE1 inflation dropped from 8.7 per cent inDecember 2008 to 8.4 per cent in January 2009and further to 6.1 per cent in June 2009. CORE2inflation fell from 6.1 per cent in December 2008to 6.0 per cent in January 2009 and further to 5.5per cent in June 2009. In contrast, TRIM10inflation also fell from 3.5 per cent in December2008 to 2.3 per cent in January 2009 but edged upto 2.8 per cent in June 2009. Chart 2.5: Inflation and Core Inflation - twelve-month average
Source: CSO, Government of Mauritius, and Bank calculations.
On a year-on-year basis, CORE1 inflation droppedfrom 5.9 per cent in December 2008 to 4.0 per centin January 2009 and further to 3.6 per cent in June2009, while CORE2 inflation declined further to4.5 per cent in June 2009, from 6.2 per cent inDecember 2008 and 5.0 per cent in January 2009.
4 Refer to Box 1 on page 16.
5 Core inflation measures the change in average consumer prices afterexcluding from the CPI basket certain items with volatile price movementsand using statistical approaches. CORE1 is obtained using the exclusion-based approach and strips “Food, Beverages and Tobacco” components andmortgage interest on housing loan from the CPI basket. CORE2, also anexclusion-based approach, further excludes energy prices and administeredprices from the overall CPI. TRIM10 truncates 5 per cent of each tail of thedistribution of price changes.

Chart 2.6: Inflation and Core Inflation - year-on-year
Source: CSO, Government of Mauritius, and Bank calculations.
2.3 EVOLUTION OF MAJOR COMMODITYGROUP INDICESThe CPI rose from 115.3 in January 2009 to 117.1in June 2009, that is, by 1.8 index points. Thelargest increase was registered in the CPI divisionTransport, which increased by 4.8 per centbetween January and June 2009, thus contributing0.8 index point to the increase in the CPI. Foodand non-alcoholic beverages recorded the secondlargest contribution of 0.6 index point, mainly as aresult of hikes in the prices of fresh vegetables andsugar in the earlier months of 2009. The increasein the CPI was partially offset by a weighteddecline of 0.3 index point in the Housing, water,electricity, gas and other fuels division.Chart 2.7 illustrates the weighted contribution ofthe main divisions of the CPI basket to theincrease in the CPI between January 2009 andJune 2009. Chart 2.8 depicts the monthly weightedcontribution of the main components of the CPIbasket to twelve-month average inflation.Chart 2.7: Weighted Contribution of Main Divisionsto the Change in the CPI: January to June 2009
Source: CSO, Government of Mauritius, and Bank calculations.
Chart 2.8: Weighted Contribution of the MainDivisions of the CPI Basket to Inflation
Source: CSO, Government of Mauritius, and Bank calculations.
Food and non-food inflationThe food component in the CPI basket carries aweight of 26.5 per cent. As a result of thestabilisation of food prices on the internationalmarkets leading to price cuts of some key fooditems early in the year, food inflation declinedsteadily from a peak of 17.2 per cent in September2008 to 14.1 per cent in March 2009 and furtherto 11.5 per cent in June 2009. Food inflationaccounted for around half of headline inflation,more or less in line with the trend in the secondhalf of 2008. On a twelve-month average basis, non-foodinflation gradually fell from 7.2 per cent inDecember 2008 to 5.0 per cent in June 2009.Table 2.2 and Charts 2.9 and 2.10 showmovements in food and non-food inflation.Table 2.2: Food and Non-food Inflation
Source: CSO, Government of Mauritius, and Bank calculations.
Based on the year-on-year methodology, thesteady decline in food inflation was morepronounced. Food inflation fell from 12.0 per centin December 2008 to 10.2 per cent in January2009 and further to 4.7 per cent in June 2009.
Inflation Report Bank of Mauritius
12
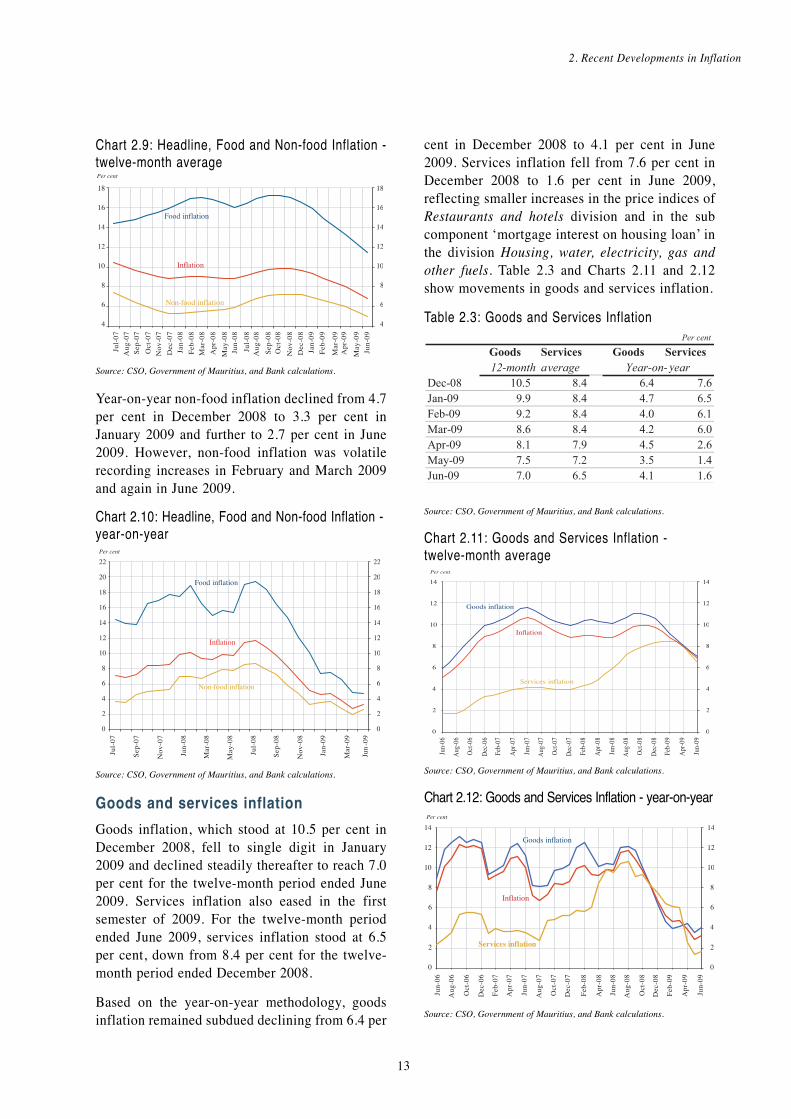
Chart 2.9: Headline, Food and Non-food Inflation -twelve-month average
Source: CSO, Government of Mauritius, and Bank calculations.
Year-on-year non-food inflation declined from 4.7per cent in December 2008 to 3.3 per cent inJanuary 2009 and further to 2.7 per cent in June2009. However, non-food inflation was volatilerecording increases in February and March 2009and again in June 2009. Chart 2.10: Headline, Food and Non-food Inflation -year-on-year
Source: CSO, Government of Mauritius, and Bank calculations.
Goods and services inflationGoods inflation, which stood at 10.5 per cent inDecember 2008, fell to single digit in January2009 and declined steadily thereafter to reach 7.0per cent for the twelve-month period ended June2009. Services inflation also eased in the firstsemester of 2009. For the twelve-month periodended June 2009, services inflation stood at 6.5per cent, down from 8.4 per cent for the twelve-month period ended December 2008.Based on the year-on-year methodology, goodsinflation remained subdued declining from 6.4 per
cent in December 2008 to 4.1 per cent in June2009. Services inflation fell from 7.6 per cent inDecember 2008 to 1.6 per cent in June 2009,reflecting smaller increases in the price indices ofRestaurants and hotels division and in the subcomponent ‘mortgage interest on housing loan’ inthe division Housing, water, electricity, gas andother fuels. Table 2.3 and Charts 2.11 and 2.12show movements in goods and services inflation.Table 2.3: Goods and Services Inflation
Source: CSO, Government of Mauritius, and Bank calculations.
Chart 2.11: Goods and Services Inflation - twelve-month average
Source: CSO, Government of Mauritius, and Bank calculations.
Chart 2.12: Goods and Services Inflation - year-on-year
Source: CSO, Government of Mauritius, and Bank calculations.
2. Recent Developments in Inflation
13

2.4 EVOLUTION OF OTHERPRICE/COST INDICESImport Price IndexThe Import Price Index (IPI), computed on aquarterly basis, measures the transaction prices ofgoods and services imported into Mauritius. Themajority of prices used in calculating the IPI,quoted Free On Board (fob), thus exclude duties,insurance and other extra charges. It is an essentialindicator for tracking changes in the prices paidfor goods imported to Mauritius. The IPI fell by7.4 per cent between the last quarter of 2008 andthe first quarter of 2009 largely as a result offalling oil and food prices on internationalmarkets. In contrast, there was an increase of 0.9per cent in the IPI between the first and thesecond quarter of 2009. The IPI dropped from109.3 in the second quarter 2008 to 104.5 in thesecond quarter 2009 representing a decline of 4.3per cent, as shown in Table 2.4.Producer Price Index The Producer Price Index-Manufacturing (PPI-M)and the Producer Price Index-Agriculture (PPI-A)are the two measures of producer prices computedby the CSO.6 PPI-M inflation for the twelve-month period ended June 2009 stood at 9.2 percent, down from 15.9 per cent in December 2008.The mitigated growth in the sub-componentsManufacture of food products, beverages andtobacco index contributed to the moderate growthin PPI-M inflation. PPI-M, based on the year-on-year methodology, dropped markedly from 14.5per cent in December 2008 to zero per cent in thesecond quarter of 2009.
PPI-A inflation picked up in the earlier months of2009, but declined subsequently during the secondquarter of 2009. PPI-A inflation reached 6.1 percent in March 2009 before declining to 3.8 percent in June 2009. On a year-on-year basis, PPI-Arose to 6.4 per cent in March 2009 beforedeclining markedly to -1.7 per cent in June 2009.The producer price inflation for manufacturingand agriculture based on twelve-month averageand year-on-year methodologies are illustrated inTable 2.5 and Charts 2.13 and 2.14.Table 2.5: Producer Price Inflation
Source: CSO, Government of Mauritius, and Bank calculations.
Chart 2.13: Producer Price Inflation forManufacturing and Agriculture - twelve-monthaverage
Source: CSO, Government of Mauritius, and Bank calculations.
Inflation Report Bank of Mauritius
14
Source: CSO, Government of Mauritius, and Bank calculations.
Table 2.4: Import Price Index
6 The PPI-M measures changes in the effective prices received byproducers for that part of their output sold on the domestic market.The PPI-A measures the average change in the selling priceswhich producers receive for their agricultural products. Theindices are measured on a monthly basis and released quarterly.
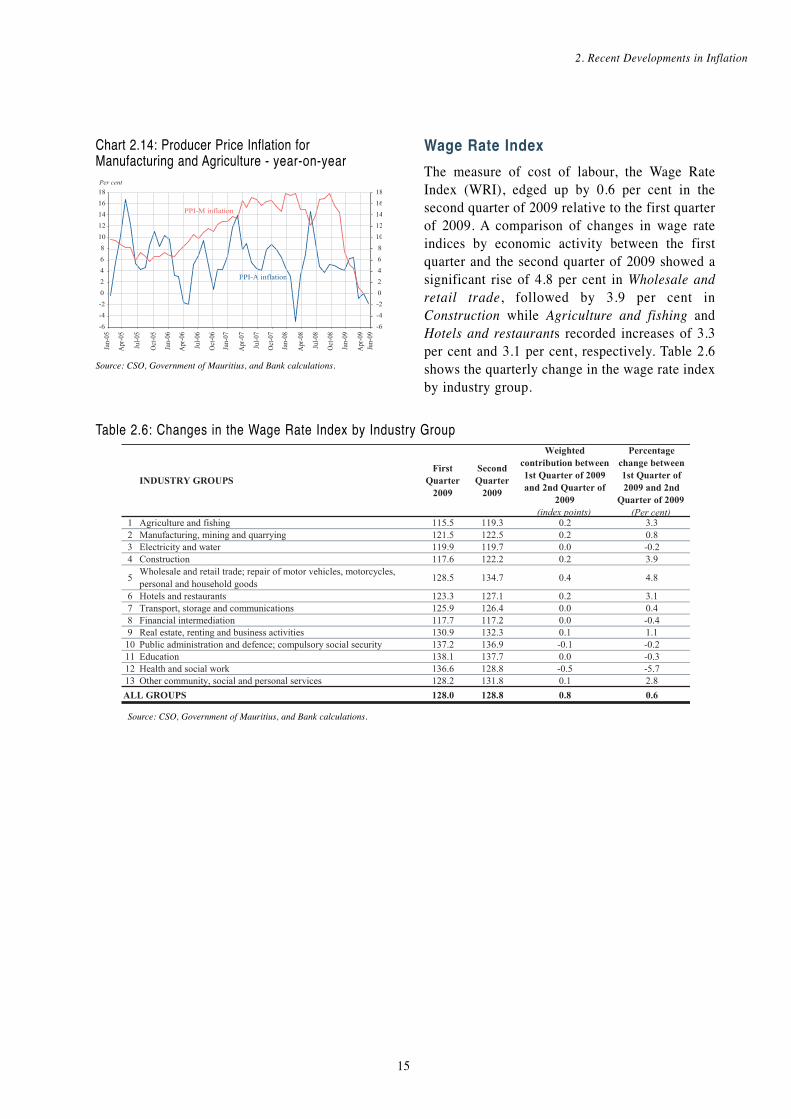
Chart 2.14: Producer Price Inflation forManufacturing and Agriculture - year-on-year
Source: CSO, Government of Mauritius, and Bank calculations.
Wage Rate IndexThe measure of cost of labour, the Wage RateIndex (WRI), edged up by 0.6 per cent in thesecond quarter of 2009 relative to the first quarterof 2009. A comparison of changes in wage rateindices by economic activity between the firstquarter and the second quarter of 2009 showed asignificant rise of 4.8 per cent in Wholesale andretail trade, followed by 3.9 per cent inConstruction while Agriculture and fishing andHotels and restaurants recorded increases of 3.3per cent and 3.1 per cent, respectively. Table 2.6shows the quarterly change in the wage rate indexby industry group.
2. Recent Developments in Inflation
15
Table 2.6: Changes in the Wage Rate Index by Industry Group
Source: CSO, Government of Mauritius, and Bank calculations.
Inflation Report Bank of Mauritius
16
Box 1: Evolution of the Prices of Mogas and Diesel Oil under the Automatic Pricing Mechanism
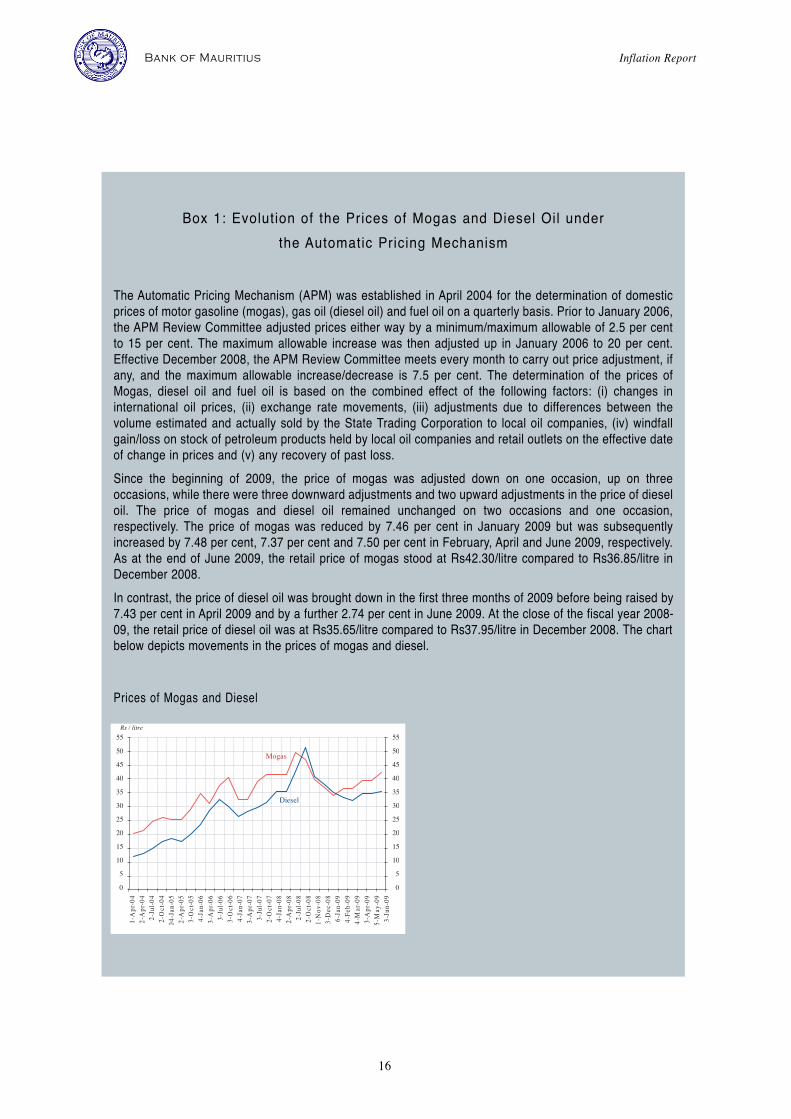
The Automatic Pricing Mechanism (APM) was established in April 2004 for the determination of domesticprices of motor gasoline (mogas), gas oil (diesel oil) and fuel oil on a quarterly basis. Prior to January 2006,the APM Review Committee adjusted prices either way by a minimum/maximum allowable of 2.5 per centto 15 per cent. The maximum allowable increase was then adjusted up in January 2006 to 20 per cent.Effective December 2008, the APM Review Committee meets every month to carry out price adjustment, ifany, and the maximum allowable increase/decrease is 7.5 per cent. The determination of the prices ofMogas, diesel oil and fuel oil is based on the combined effect of the following factors: (i) changes ininternational oil prices, (ii) exchange rate movements, (iii) adjustments due to differences between thevolume estimated and actually sold by the State Trading Corporation to local oil companies, (iv) windfallgain/loss on stock of petroleum products held by local oil companies and retail outlets on the effective dateof change in prices and (v) any recovery of past loss.Since the beginning of 2009, the price of mogas was adjusted down on one occasion, up on threeoccasions, while there were three downward adjustments and two upward adjustments in the price of dieseloil. The price of mogas and diesel oil remained unchanged on two occasions and one occasion,respectively. The price of mogas was reduced by 7.46 per cent in January 2009 but was subsequentlyincreased by 7.48 per cent, 7.37 per cent and 7.50 per cent in February, April and June 2009, respectively.As at the end of June 2009, the retail price of mogas stood at Rs42.30/litre compared to Rs36.85/litre inDecember 2008. In contrast, the price of diesel oil was brought down in the first three months of 2009 before being raised by7.43 per cent in April 2009 and by a further 2.74 per cent in June 2009. At the close of the fiscal year 2008-09, the retail price of diesel oil was at Rs35.65/litre compared to Rs37.95/litre in December 2008. The chartbelow depicts movements in the prices of mogas and diesel.
Prices of Mogas and Diesel

Effects of the global economic crisisThe continued deterioration of the internationaleconomy caused the domestic economy to slowdown further during the first quarter of 2009. Inthe second quarter, GDP growth picked up to 2.3per cent, up from 1.1 per cent in the first quarter,but lower than 4.7 per cent registered in thesecond quarter of 2008. Seasonally-adjustedquarterly GDP data showed that the growth rate inthe second quarter of 2009 was 0.6 per cent, asopposed to a contraction of 0.8 per cent in thepreceding quarter.As anticipated, persistently falling demand in ourmain export markets intensified the strains in theexternal demand-led sectors, namely the textileand tourism sectors, thereby mitigating overalleconomic activity. The textile sector contractedfor five consecutive quarters. The sharpestcontraction of 5.0 per cent was recorded in thefirst quarter of 2009 and the textile sectorcontinued to contract in the second quarter,though at a slightly slower pace of 4.0 per cent. The tourism sector, which had until the thirdquarter of 2008 recorded positive albeit slowinggrowth rates, was seriously hit in the fourthquarter, contracting by 1.6 per cent. With demandfrom main markets weakening significantly, thecontraction was even more alarming at 9.5 percent in the first quarter of 2009, plunging thetourism sector as well into recession. The sectorcontracted at a lower pace of 6.2 per cent in thesecond quarter.Growth in the Financial intermediation and Realestate, renting and business activities sectorsremained positive in spite of the economic slump,but moderated in the first and second quarters of2009, thereby contributing to the overall lowerGDP growth in those quarters. The Financialintermediation sector grew by 6.1 per cent and 5.7per cent in the first and second quarters of 2009,respectively. The Real estate, renting andbusiness activities sector grew by 3.6 per cent inthe first quarter of 2009 and picked up to 4.4 percent in the second quarter. Chart 3.1 illustratesmovements in the real growth rate.
With the deceleration in overall economic activity,preliminary estimates show that the output gap -measured as the difference between actual andpotential output - has moved into negativeterritory. Thus, the disinflationary momentumtriggered by price developments on internationalmarkets was further enhanced by domesticdemand and supply conditions. The magnitude ofthe negative output gap is, however, projected todiminish as from the second half of 2009.Chart 3.1: Real Economic Growth Rate
Source: CSO, Government of Mauritius.
Risks to growth prospectsSigns that the global economy was graduallystabilising had become increasingly visibletowards the end of the second quarter of 2009. Thepace of decline in economic activity in severalmajor advanced economies had slowed and someof them such as France and Germany resumed withpositive growth in the second quarter of 2009. Realoutput growth in major emerging economies hadstarted to gather momentum. According to latestIMF projections, the global economy is expected tocontract by 1.1 per cent in 2009 before growing by3.1 per cent in 2010. Global recovery was stillweak and vulnerable at this juncture. Although adouble-dip recession can be ruled out, downsiderisks to growth still prevailed. These favourable developments were expected toalleviate the downside risks to the domesticgrowth outlook and positively influence economicactivity in coming quarters. In line with thisrenewed optimism, the 2009 growth forecast forthe Mauritian economy has been recently
17
3. DEMAND AND OUTPUT
upgraded from an earlier figure of 2.5 per cent to2.7 per cent signalling a better economicperformance in the second half of 2009 thanpreviously estimated.
Fiscal and monetary stimulusWith a view to stimulating economic growth andmitigating the adverse effects of the globaleconomic downturn on the domestic economy, anexpansionary macroeconomic policy was pursuedin the first semester of 2009. In March 2009, thekey Repo Rate was cut by another 100 basispoints bringing the cumulative rate reductionsince October 2008 to 250 basis points.The action plan of the 2009 Budget of thegovernment, amounting to Rs14.2 billion andspanning over a period of eighteen months,reinforced measures announced in the AdditionalStimulus Package in December 2008. The Budgetfocused on massive infrastructural projects andthe preservation of jobs by shoring up theperformance of enterprises. To achieve the objectives of the Budget, an actionplan had been set up focusing on saving jobs,boosting project realisation capacity, launchingthe largest investment programme in the historyof Mauritius, protecting people and maintainingexpansionary macroeconomic policies. Targetedmeasures for key economic sectors like Small andMedium Enterprises, tourism, construction andIntegrated Resort Scheme (IRS), which have beenthe hardest hit by the crisis, were expected to helpsafeguard employment and prepare for recovery.While the positive effects of the additionalspending under the fiscal stimulus plan and theeasing of the monetary policy stance were yet tobe fully felt, they had helped in upholdingbusiness as well as consumer confidence.
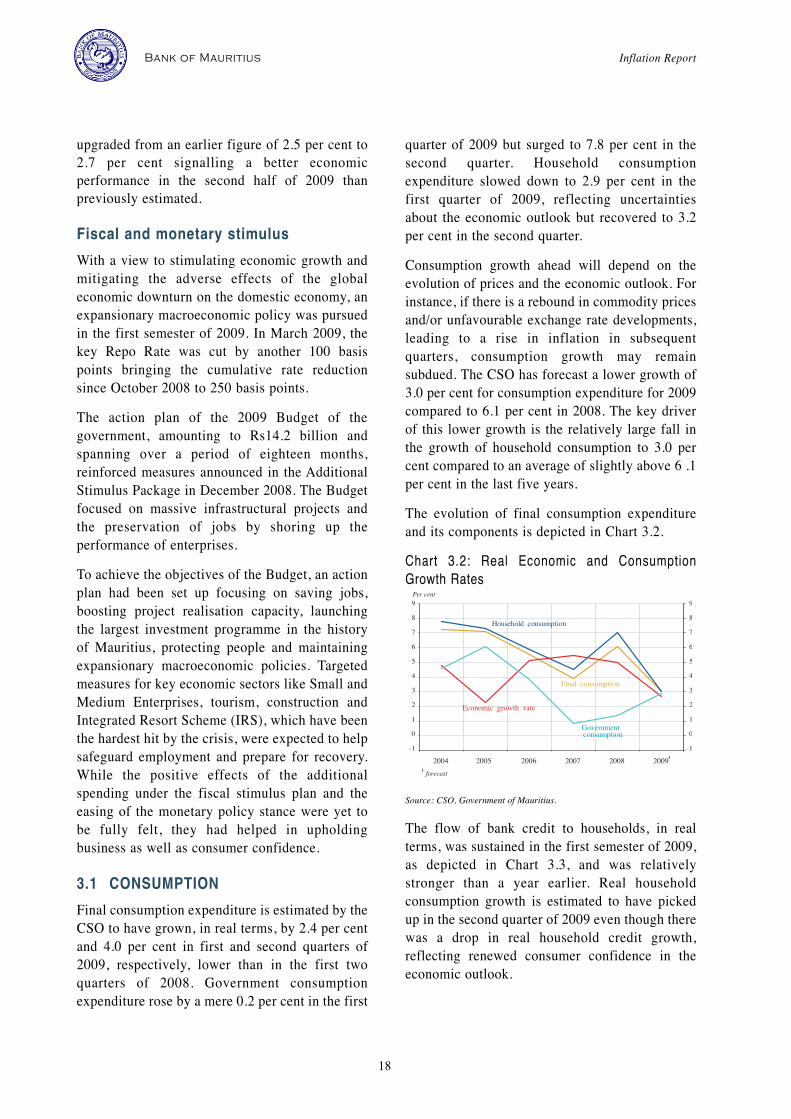
3.1 CONSUMPTIONFinal consumption expenditure is estimated by theCSO to have grown, in real terms, by 2.4 per centand 4.0 per cent in first and second quarters of2009, respectively, lower than in the first twoquarters of 2008. Government consumptionexpenditure rose by a mere 0.2 per cent in the first
quarter of 2009 but surged to 7.8 per cent in thesecond quarter. Household consumptionexpenditure slowed down to 2.9 per cent in thefirst quarter of 2009, reflecting uncertaintiesabout the economic outlook but recovered to 3.2per cent in the second quarter. Consumption growth ahead will depend on theevolution of prices and the economic outlook. Forinstance, if there is a rebound in commodity pricesand/or unfavourable exchange rate developments,leading to a rise in inflation in subsequentquarters, consumption growth may remainsubdued. The CSO has forecast a lower growth of3.0 per cent for consumption expenditure for 2009compared to 6.1 per cent in 2008. The key driverof this lower growth is the relatively large fall inthe growth of household consumption to 3.0 percent compared to an average of slightly above 6 .1per cent in the last five years. The evolution of final consumption expenditureand its components is depicted in Chart 3.2. Chart 3.2: Real Economic and ConsumptionGrowth Rates
Source: CSO, Government of Mauritius.
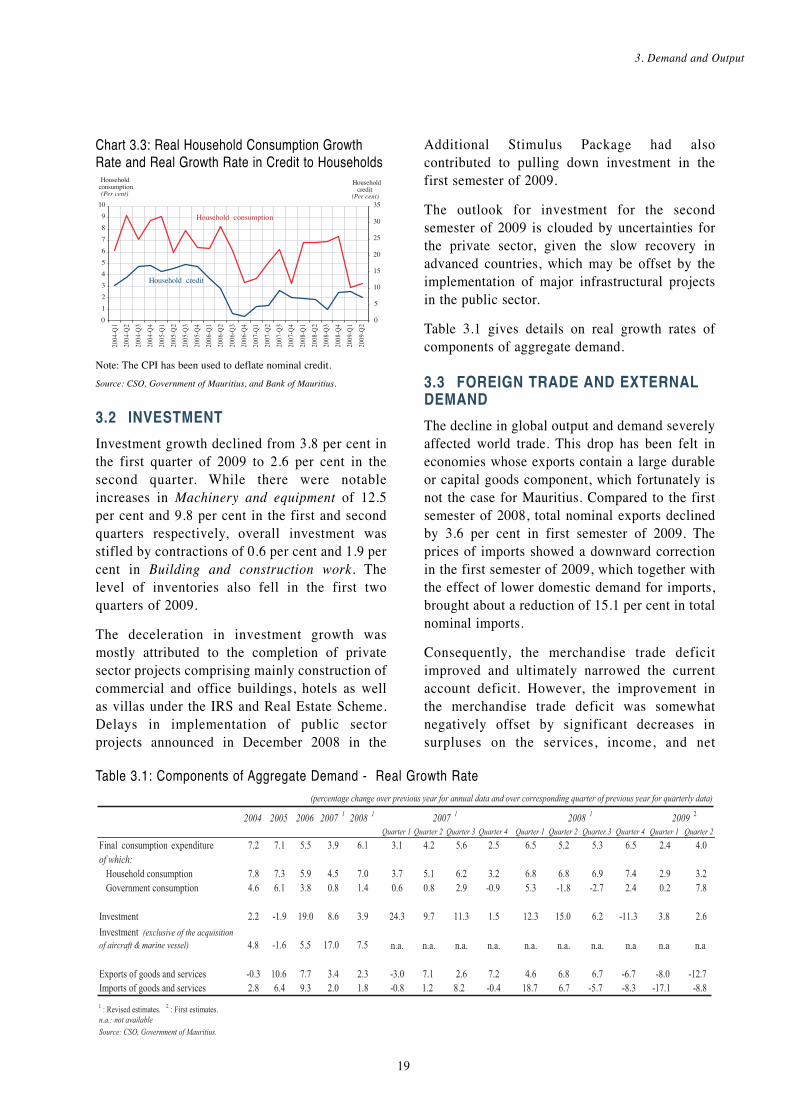
The flow of bank credit to households, in realterms, was sustained in the first semester of 2009,as depicted in Chart 3.3, and was relativelystronger than a year earlier. Real householdconsumption growth is estimated to have pickedup in the second quarter of 2009 even though therewas a drop in real household credit growth,reflecting renewed consumer confidence in theeconomic outlook.
Inflation Report Bank of Mauritius
18
3. Demand and Output
Chart 3.3: Real Household Consumption GrowthRate and Real Growth Rate in Credit to Households
Note: The CPI has been used to deflate nominal credit.Source: CSO, Government of Mauritius, and Bank of Mauritius.
3.2 INVESTMENTInvestment growth declined from 3.8 per cent inthe first quarter of 2009 to 2.6 per cent in thesecond quarter. While there were notableincreases in Machinery and equipment of 12.5per cent and 9.8 per cent in the first and secondquarters respectively, overall investment wasstifled by contractions of 0.6 per cent and 1.9 percent in Building and construction work. Thelevel of inventories also fell in the first twoquarters of 2009. The deceleration in investment growth wasmostly attributed to the completion of privatesector projects comprising mainly construction ofcommercial and office buildings, hotels as wellas villas under the IRS and Real Estate Scheme.Delays in implementation of public sectorprojects announced in December 2008 in the
Additional Stimulus Package had alsocontributed to pulling down investment in thefirst semester of 2009.The outlook for investment for the secondsemester of 2009 is clouded by uncertainties forthe private sector, given the slow recovery inadvanced countries, which may be offset by theimplementation of major infrastructural projectsin the public sector.Table 3.1 gives details on real growth rates ofcomponents of aggregate demand.
3.3 FOREIGN TRADE AND EXTERNALDEMANDThe decline in global output and demand severelyaffected world trade. This drop has been felt ineconomies whose exports contain a large durableor capital goods component, which fortunately isnot the case for Mauritius. Compared to the firstsemester of 2008, total nominal exports declinedby 3.6 per cent in first semester of 2009. Theprices of imports showed a downward correctionin the first semester of 2009, which together withthe effect of lower domestic demand for imports,brought about a reduction of 15.1 per cent in totalnominal imports.Consequently, the merchandise trade deficitimproved and ultimately narrowed the currentaccount deficit. However, the improvement inthe merchandise trade deficit was somewhatnegatively offset by significant decreases insurpluses on the services, income, and net
19
Table 3.1: Components of Aggregate Demand - Real Growth Rate

current transfers accounts. The services accountwas affected by a contraction in tourism receiptsas a result of economic crisis in our majortourist markets.As a percentage of GDP, the current accountdeficit in the first half of 2009 dropped to 8.0 percent from 10.1 per cent in the first half of 2008.Looking ahead, even if weakness in importdemand is likely to persist, the current accountdeficit might not necessarily narrow down at afast pace given that, at the current juncture, globalcommodity prices have started moving up again.Provided that foreign financial flows remainsustained to finance the current account deficit,the pressure on the exchange rate would remainmitigated, thus helping to keep inflationarypressures in check.
Current account balanceProvisional estimates for the first semester of2009 indicated that the current account deficitnarrowed substantially to Rs10,500 million,from Rs12,667 million in the correspondingperiod of 2008. The contraction in the current account deficit wasmostly due to a correction in the externalimbalance, consequent to the global economiccrisis. The merchandise trade deficit improved asnominal imports decreased at a faster pace thannominal exports. The merchandise account duringthe first semester of 2009 experienced a 27.1 percent reduction in its deficit, from Rs29,141million to Rs21,257 million. The downturn in global economic conditions alsohad a bearing on the services account. The surpluson the services account witnessed a sharp decreaseof 12.5 per cent from Rs10,002 million in the firstsemester of 2008 to Rs,8,748 million in the firstsemester of 2009, largely driven by significantdecline in tourism receipts associated with lowerrevenue from passenger fares. Furthermore, thesurplus on the income account decreasedsubstantially from Rs4,555 million in the firstsemester of 2008 to Rs335 million in the firstsemester of 2009 on account of substantial amountof profits and dividends remitted abroad. Thesurplus on the current transfers account moderatedto Rs1,674 million in the first semester of 2009,
from Rs1,917 million in the correspondingsemester of 2008. Chart 3.4 depicts the evolutionof annual imports, exports and net exports ofgoods and services as a percentage of GDP.Chart 3.4: Imports, Exports and Net Exports ofGoods and Services as a Percentage of GDP
Source: CSO, Government of Mauritius.
Capital and financial accountThe capital and financial account, inclusive ofreserve assets, recorded lower net inflows ofRs3,891 million in the first half of 2009 comparedto Rs13,816 million in the first half of 2008. Thisfollowed from a significant decline in otherinvestment net inflows due to a considerabledecrease in non-residents’ deposits.Foreign Direct Investment (FDI) registered highernet inflows of Rs2,704 million in the firstsemester of 2009 compared to Rs2,605 million infirst half of 2008. Despite the global slowdown,the Mauritian economy displayed some resilienceand continued to attract direct investment inflows.Net inward FDI remained buoyant at Rs3,194million during the first two quarters of 2009 andthe bulk of capital was mainly channelled intoHotels and restaurants and Real estate, rentingand business activities sectors with respectiveshares of 38.8 per cent and 37.5 per cent. Among debt-creating flows, portfolio investmentin the first half of 2009 recorded net outflows ofRs2,225 million, lower than the Rs2,431 millionnoted in the first half of 2008. While portfolioinvestment assets showed a decline of 43.5 percent, portfolio liabilities increased from Rs1,060million to Rs1,450 million. Non-residenttransactions in domestic money market
Inflation Report Bank of Mauritius
20
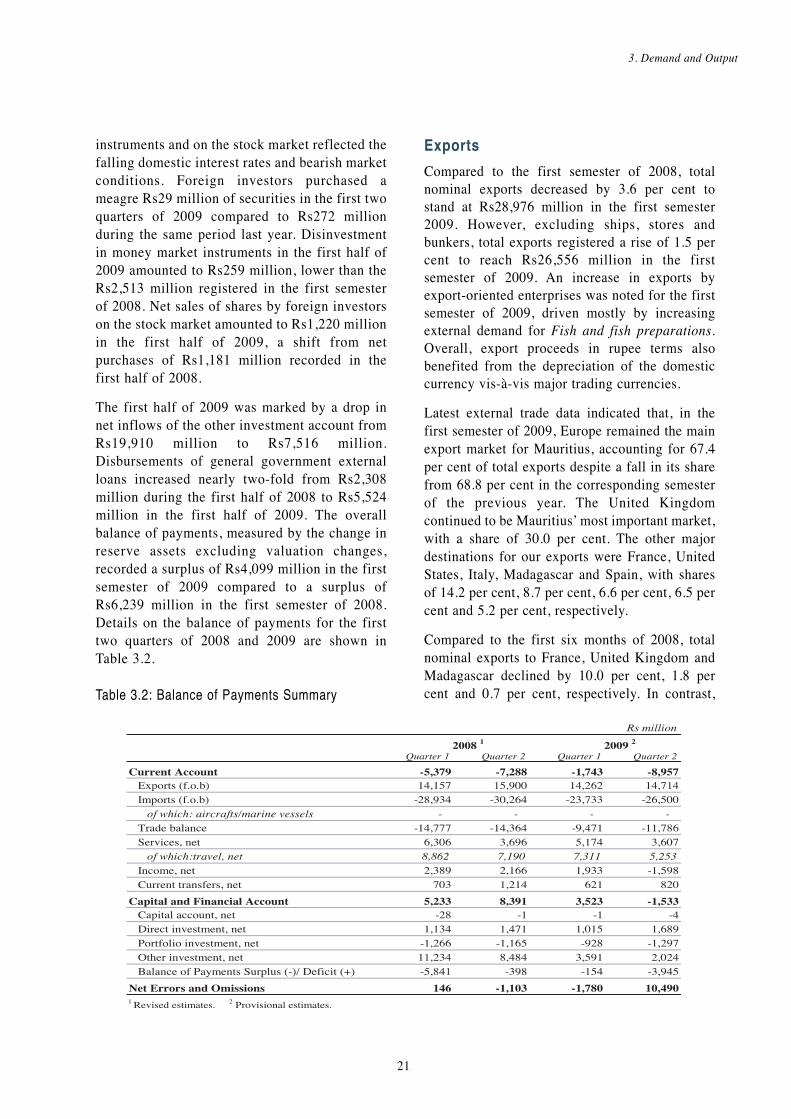
instruments and on the stock market reflected thefalling domestic interest rates and bearish marketconditions. Foreign investors purchased ameagre Rs29 million of securities in the first twoquarters of 2009 compared to Rs272 millionduring the same period last year. Disinvestmentin money market instruments in the first half of2009 amounted to Rs259 million, lower than theRs2,513 million registered in the first semesterof 2008. Net sales of shares by foreign investorson the stock market amounted to Rs1,220 millionin the first half of 2009, a shift from netpurchases of Rs1,181 million recorded in thefirst half of 2008.The first half of 2009 was marked by a drop innet inflows of the other investment account fromRs19,910 million to Rs7,516 million.Disbursements of general government externalloans increased nearly two-fold from Rs2,308million during the first half of 2008 to Rs5,524million in the first half of 2009. The overallbalance of payments, measured by the change inreserve assets excluding valuation changes,recorded a surplus of Rs4,099 million in the firstsemester of 2009 compared to a surplus ofRs6,239 million in the first semester of 2008.Details on the balance of payments for the firsttwo quarters of 2008 and 2009 are shown inTable 3.2.
Table 3.2: Balance of Payments Summary
Exports Compared to the first semester of 2008, totalnominal exports decreased by 3.6 per cent tostand at Rs28,976 million in the first semester2009. However, excluding ships, stores andbunkers, total exports registered a rise of 1.5 percent to reach Rs26,556 million in the firstsemester of 2009. An increase in exports byexport-oriented enterprises was noted for the firstsemester of 2009, driven mostly by increasingexternal demand for Fish and fish preparations.Overall, export proceeds in rupee terms alsobenefited from the depreciation of the domesticcurrency vis-à-vis major trading currencies. Latest external trade data indicated that, in thefirst semester of 2009, Europe remained the mainexport market for Mauritius, accounting for 67.4per cent of total exports despite a fall in its sharefrom 68.8 per cent in the corresponding semesterof the previous year. The United Kingdomcontinued to be Mauritius’ most important market,with a share of 30.0 per cent. The other majordestinations for our exports were France, UnitedStates, Italy, Madagascar and Spain, with sharesof 14.2 per cent, 8.7 per cent, 6.6 per cent, 6.5 percent and 5.2 per cent, respectively. Compared to the first six months of 2008, totalnominal exports to France, United Kingdom andMadagascar declined by 10.0 per cent, 1.8 percent and 0.7 per cent, respectively. In contrast,
3. Demand and Output
21
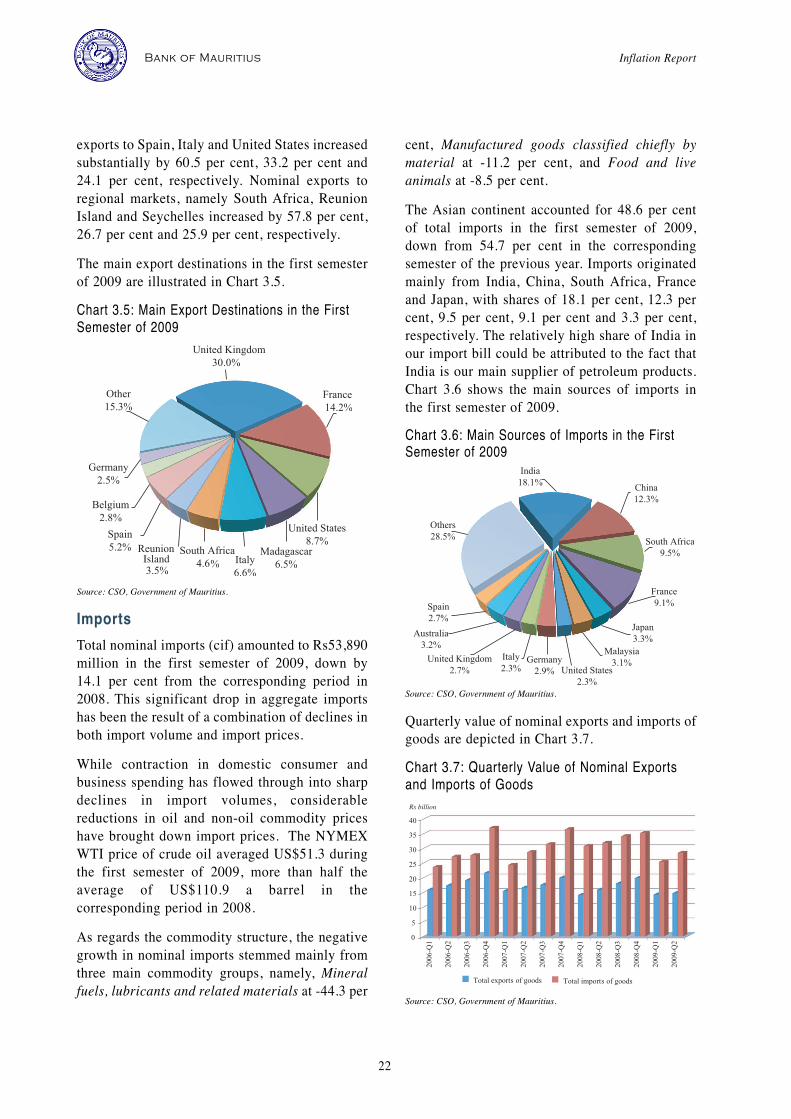
exports to Spain, Italy and United States increasedsubstantially by 60.5 per cent, 33.2 per cent and24.1 per cent, respectively. Nominal exports toregional markets, namely South Africa, ReunionIsland and Seychelles increased by 57.8 per cent,26.7 per cent and 25.9 per cent, respectively. The main export destinations in the first semesterof 2009 are illustrated in Chart 3.5.Chart 3.5: Main Export Destinations in the FirstSemester of 2009
Source: CSO, Government of Mauritius.
ImportsTotal nominal imports (cif) amounted to Rs53,890million in the first semester of 2009, down by14.1 per cent from the corresponding period in2008. This significant drop in aggregate importshas been the result of a combination of declines inboth import volume and import prices. While contraction in domestic consumer andbusiness spending has flowed through into sharpdeclines in import volumes, considerablereductions in oil and non-oil commodity priceshave brought down import prices. The NYMEXWTI price of crude oil averaged US$51.3 duringthe first semester of 2009, more than half theaverage of US$110.9 a barrel in thecorresponding period in 2008. As regards the commodity structure, the negativegrowth in nominal imports stemmed mainly fromthree main commodity groups, namely, Mineralfuels, lubricants and related materials at -44.3 per
cent, Manufactured goods classified chiefly bymaterial at -11.2 per cent, and Food and liveanimals at -8.5 per cent. The Asian continent accounted for 48.6 per centof total imports in the first semester of 2009,down from 54.7 per cent in the correspondingsemester of the previous year. Imports originatedmainly from India, China, South Africa, Franceand Japan, with shares of 18.1 per cent, 12.3 percent, 9.5 per cent, 9.1 per cent and 3.3 per cent,respectively. The relatively high share of India inour import bill could be attributed to the fact thatIndia is our main supplier of petroleum products.Chart 3.6 shows the main sources of imports inthe first semester of 2009.Chart 3.6: Main Sources of Imports in the FirstSemester of 2009
Source: CSO, Government of Mauritius.
Quarterly value of nominal exports and imports ofgoods are depicted in Chart 3.7.Chart 3.7: Quarterly Value of Nominal Exportsand Imports of Goods
Source: CSO, Government of Mauritius.
Inflation Report Bank of Mauritius
22

3.4 LABOUR MARKETThe declining trend in the unemployment ratesince the first quarter of 2007 was reversed inearly 2009. The rate of unemployment increasedsharply from 6.2 per cent in the fourth quarter of2008 to 8.0 per cent in the first quarter of 2009and further to 8.3 per cent in the second quarter.The seasonally-adjusted unemployment rate alsoincreased from 6.9 per cent in the second quarterof 2008 to 7.9 per cent in the second quarter of2009. Table 3.3 shows movements in theunemployment rate.Job losses were significant in the textile sector,which was adversely affected by weak externaldemand in the main export markets and thelifting of quota restrictions by the EuropeanUnion and the United States on China’s exportsas from 2008. The excess supply over demandexerted downward pressure on prices as firmscompeted to retain market share and cost-cutting measures had inevitably led to the lay-off of workers.
Labour market outlookEmployment in the export-oriented enterprisessector declined by 6,582 in the year to June2009, mainly as a result of a fall in employmentby 5,271 in the wearing apparel sub-sector. Inthe tourist industry, employment as at end March2009 was estimated at 26,922 compared to28,764 as at end March 2008.Labour market developments are likely to reflecttrends in the broader economy with some lag,although the labour market is not expected toweaken much further. The economic downturnhas been followed by fewer job losses thaninitially expected partly due to the fiscal stimulus
package, which ties down job preservation withthe financial and operational help the governmentgives to viable firms in difficulty. Theanticipation that the economic slowdown wouldbe short might have also induced businesses toretain labour although there were indications ofworking hours being reduced. In the short-term, prospects for job creation toregain the momentum it had prior to the globalcrisis have diminished. The anticipatedeconomic recovery to below trend growth couldbe accompanied by moderate job creation as it islikely that activity pick-up encouragesemployers to initially choose to increaseworking hours for incumbents and bring part-time workers back to full-time. Targeted activelabour market programmes would beinstrumental in promoting a quick reintegrationof job losers into employment and prevent therisk of long-term unemployment. Chart 3.8 shows the evolution of the quarter-on-quarter seasonally-adjusted GDP growth rate andthe quarter-on-quarter growth rate of employment.Chart 3.8: Quarter-on-quarter Seasonally-adjustedGDP and Employment Growth Rates
Source: CSO, Government of Mauritius.
3. Demand and Output
23
Table 3.3: Unemployment Rate
Source: CSO, Government of Mauritius.

Inflation Report Bank of Mauritius
24
Box 2: The Impact of the Global Crisis on Trade
The global economic crisis had a direct dampening impact on global trade flows. All countries, and mostlyemerging and developing countries, have already been heavily hurt by the crisis through falling exports, risingunemployment and, thus, falling income. Output and trade growth of developed economies were already slowingduring the first three quarters of 2008, but the worsening of the global financial crisis in the fourth quarter of 2008and the first quarter of 2009 accelerated this trend. The World Trade Organisation recently forecast that thecollapse in global demand brought on by the economic crisis will drive exports down by roughly 9 per cent involume terms in 2009. Other international organisations, such as the United Nations Conference on Trade andDevelopment, also estimate world merchandise trade to fall between 6 and 8 per cent in 2009, while the IMFforecasts world trade volume to shrink by around 12 per cent in 2009.Although the current crisis was initially a financial crisis and has been transmitted through the financial channelinternationally, it has an impact on both the supply-side and demand-side of trade. On the supply-side, trade hascollapsed due to the drying up of trade finance, collapse of vertical integration and the disruption in internationalcapital markets. On the demand-side, the considerable fall in demand from advanced economies has had asignificant impact on emerging market economy exports.The decrease in merchandise trade has had a negative impact on all developing regions and most types ofgoods. Moreover, South–South trade, which has been the most dynamic component of world trade for over adecade, continues to decline, especially intra-Asian trade. The quick contraction of developing countries’manufacturing trade is largely due to today’s highly globalised production and marketing schemes. Among themost affected sectors are automotive products, office and telecommunications equipment, and electronics, aswell as textiles and clothing. The global crisis has affected not only manufacturing trade, but also trade in services. Maritime transport isparticularly affected, as are tourism and construction services. There is also a growing reduction in theemployment levels of migrant workers from developing countries. This is expected to lead to a further fall inremittance inflows to developing countries, which began to slow down in 2008. Conversely, trade in ICT-enabledservices appears to be less influenced by the economic downturn, as companies see the offshoring of servicesas one method of enhancing competitiveness.
Implications of the fall in world trade for the Mauritian economyThe sharp slowdown in demand for highly-traded manufactured items has weighed on Mauritian exports, whichfell by 7.5 per cent in the second quarter of 2009 compared to the corresponding quarter of the previous year.The outlook for these exports will partly depend on the severity and persistence of the slowdown in the globaldemand for traded goods. The outlook for overall export growth for the Mauritian economy will also depend onexports of services.

4.1 MONETARY AND CREDITDEVELOPMENTSMonetary and credit developments reflected theslowdown in domestic economic activity duringthe first half of 2009. The moderate growth inmoney supply and credit was not viewed asjeopardising the attainment of price stability overthe medium term. The banking sector remainedrobust and availability of credit was not a causefor concern.
Monetary baseThe monetary base fell by 2.1 per cent in the firstsix months ended June 2009 as compared to a fallof 3.0 per cent in the previous correspondingperiod in 2008.7 The rate of growth of reservedeposits held by other depository corporations(ODCs) at the Bank increased by 22.7 per cent,higher than the growth rate of 21.0 per centregistered in the corresponding period in 2008.On the sources side of the monetary base, net foreignassets of the Bank grew by 13.0 per cent in the firstsemester of 2009 compared to 12.1 per cent in thefirst semester of 2008. Domestic claims by the Bankcontinued to contract as its net claims on budgetarycentral government declined significantly.
Broad Money LiabilitiesThe slowing growth of Broad Money Liabilities(BML) that began in the second semester of 2008persisted in the first half of 2009.8 BML growthfell to 3.4 per cent in the first semester ended June2009, from 5.3 per cent in the first semester endedJune 2008. Further moderation in money supplygrowth continued to be attributed to the slowdownin the expansion of claims on the private sector aswell as in net claims on central government.
Chart 4.1 illustrates movements in the monetarybase and BML. The evolution of BML and creditto private sector and the inflation rate is shownin Chart 4.2.Chart 4.1: Growth Rate of Monetary Base andBroad Money Liabilities
Chart 4.2: Growth Rate of Broad Money Liabilitiesand Credit to Private Sector and Inflation
Components of Broad Money LiabilitiesNarrow Money Liabilities rose by 1.4 per centfor the six months ended June 2009 as opposedto a fall of 2.6 per cent for the six months endedJune 2008. The slowdown of BML growth over the sixmonths to June 2009 was mainly on account of amoderation in the components of quasi-moneyliabilities. Quasi-money liabilities grew by 3.9per cent in the first semester ended June 2009,lower than the 7.2 per cent recorded in the firstsemester ended June 2008. The moderation in thegrowth of quasi-money liabilities reflected theslowdown in the growth of savings and time rupeedeposits, which could be partly attributable to thelower average interest rates on time deposits and
25
4. MONETARY AND FINANCIAL DEVELOPMENTS
7 The monetary base, also termed high-powered money or reserve money,comprises central bank liabilities that support the expansion of broad moneyand, thus, credit. Changes in the monetary base usually lead to increases inmoney and credit that are larger than the changes in the monetary base, dueto what is termed the money multiplier effect. The final impact of a change inmonetary base on money supply also depends on the size and stability of themoney multiplier.
8 Broad Money Liabilities include deposits of banks and non-bank deposit-taking institutions.

savings. Savings and time deposits rose by 5.0 percent and 3.0 per cent, respectively in the firstsemester of 2009 compared to 12.2 per cent and4.8 per cent in the first semester ended June 2008.Foreign currency deposits went up by 4.0 per centcompared to 4.2 per cent in the correspondingperiod in 2008.The last component of BML, Securities other thanShares, increased by 1.4 per cent in the firstsemester of 2009 as compared to 14.3 per cent inthe first semester in 2008.9 Table 4.1 providesdetails on growth rates of the components of BMLand credit.
Sources of Broad Money LiabilitiesForeign assetsThe net foreign assets of depository corporationsincreased by 8.5 per cent in the first semesterended June 2009 against a fall of 2.2 per cent inthe first semester ended June 2008, mainly onaccount of a higher growth of net foreign assetsheld by the Bank and ODCs. The net foreign assets of the Bank rose by 13.0per cent for the first semester of 2009 ascompared to an increase of 12.1 per cent in thesemester ended June 2008. Valuation changes inaddition to foreign exchange proceeds received on
behalf of Government from Agence Française deDéveloppement during the first six months of2009 and significant foreign currency purchasesfrom Government were among the factorscontributing to the rise. Net foreign assets held by ODCs rose by 1.1 percent in the first six months ended June 2009 asopposed to a fall of 23.2 per cent in the sameperiod in the previous year.
Domestic creditGrowth in domestic credit by depositorycorporations slowed from 15.1 per cent in the firstsemester of 2008 to 1.0 per cent in the firstsemester of 2009, reflecting mainly a slowdownin both net credit to central government and to theprivate sector. Net credit to budgetary central government roseby 6.0 per cent in the first semester ended June2009 compared to 16.8 per cent in the previouscorresponding period in 2008. Credit to theprivate sector by ODCs contracted by 0.01 percent in the first semester of 2009 against thesignificant rise of 14.7 per cent recorded in thefirst semester of 2008. Overall, the contributors to the 3.4 per centincrease in BML for the first semester ended June2009 were net foreign assets with 2.8 percentage
Inflation Report Bank of Mauritius
26
Table 4.1: Broad Money Liabilities, Domestic Credit and Net Foreign Assets
9 The component Securities other than Shares comprises essentiallycertificates of deposits.

points and domestic credit with 1.0 percentagepoint - of which claims on other sectorscontributed negative 0.01 percentage point andnet claims on central government contributedpositive contribution of 1.0 percentage point.
Sector-wise distribution of credit by banksTotal credit to private sector by banks rose by 2.1per cent for the six months ended June 2009,down from 7.2 per cent recorded in the first sixmonths of 2008. Construction and public non-financial sectors drove the increase in bank credit,representing respective shares of 43.0 per centand 78.0 per cent to total credit expansion in thefirst semester ended June 2009.Credit to the household sector expanded by 2.4per cent in the six months ended June 2009compared to 8.9 per cent recorded in the first sixmonths of 2008. Total lending to householdsslowed down. In terms of currency composition of credit,between the end of December 2008 and the end ofJune 2009, rupee loans and advances expanded by1.2 per cent, while foreign currency loans andadvances increased by 6.6 per cent as compared to3.8 per cent and 29.8 per cent, respectively in thecorresponding period in 2008. The distribution of the increase in bank credit tothe private sector over the period January 2009 toJune 2009 is shown in Chart 4.3. Chart 4.3: Distribution of the Increase in Banks’Credit to the Private Sector - January to June 2009
4.2 MONEY MARKET Liquidity management To avert any potential impact of the globalfinancial crisis on the economy, the Bankstepped up its monitoring of the moneymarket and the daily liquidity position ofbanks. Key developments affecting moneymarket liquidity conditions in the first half of2009 were the reduction of 0.5 percentagepoint in the minimum Cash Reserve Ratio to4.5 per cent with effect from the maintenanceperiod ended 1 January 2009.Overall, banks’ average excess reserves graduallyfell over the period January to June 2009, as shownin Chart 4.4. Average excess reserves surgedaround mid-January following the combinedeffects of a drop in currency in circulation and netmaturing securities. The Bank conducted arepurchase transaction for an amount of Rs2.5billion for a 14-day period in January 2009 tomaintain orderly conditions on the money market. Thereafter, however, average excess reservesdeclined due to the cumulative effects of net issueof securities and tax receipts accruing togovernment. The Bank conducted two 7-dayperiod reverse repurchase transactions, one inFebruary and another in March, totalling Rs1.3billion to alleviate liquidity conditions. Liquidityincreased significantly as from the second weekof June but declined towards the end of the monthfollowing the net issue of securities.Broadly, liquidity in the money market remainedat comfortable levels. Average excess reservesrose from Rs1.7 billion in the period June toDecember 2008 to Rs2.5 billion in the periodJanuary to June 2009. Chart 4.4: Banks’ Daily Excess Reserves
4. Monetary and Financial Developments
27
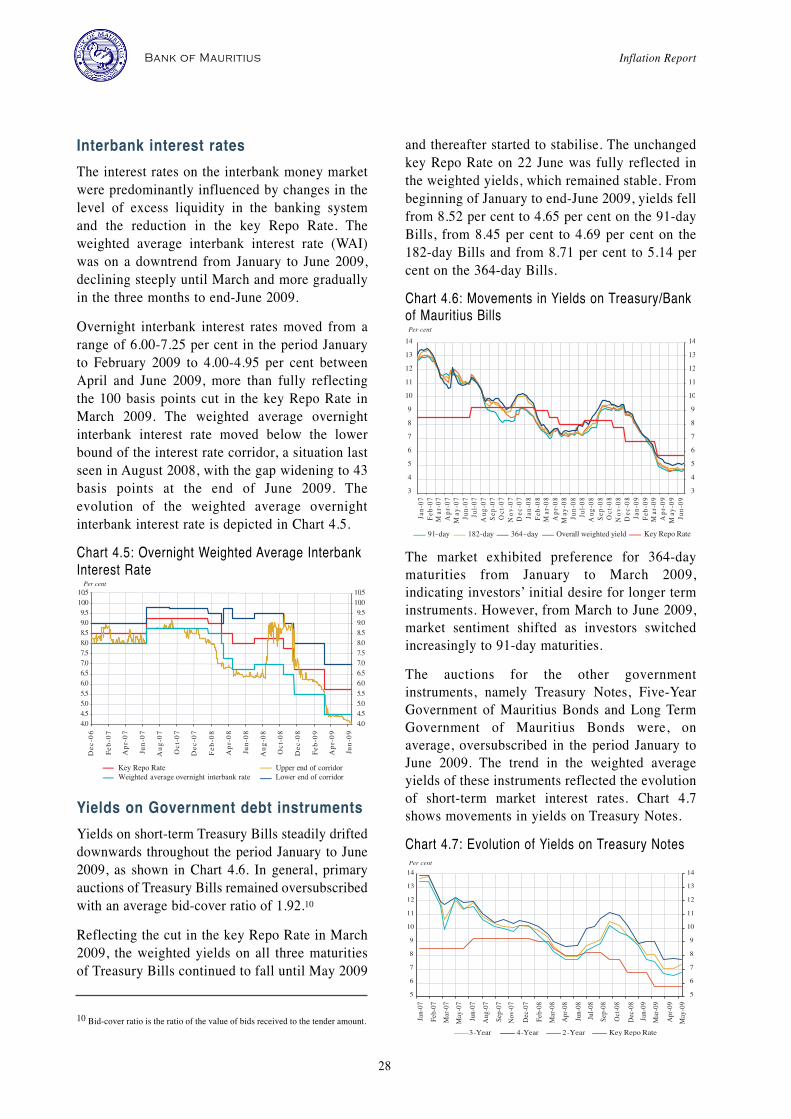
Interbank interest ratesThe interest rates on the interbank money marketwere predominantly influenced by changes in thelevel of excess liquidity in the banking systemand the reduction in the key Repo Rate. Theweighted average interbank interest rate (WAI)was on a downtrend from January to June 2009,declining steeply until March and more graduallyin the three months to end-June 2009. Overnight interbank interest rates moved from arange of 6.00-7.25 per cent in the period Januaryto February 2009 to 4.00-4.95 per cent betweenApril and June 2009, more than fully reflectingthe 100 basis points cut in the key Repo Rate inMarch 2009. The weighted average overnightinterbank interest rate moved below the lowerbound of the interest rate corridor, a situation lastseen in August 2008, with the gap widening to 43basis points at the end of June 2009. Theevolution of the weighted average overnightinterbank interest rate is depicted in Chart 4.5. Chart 4.5: Overnight Weighted Average InterbankInterest Rate
Yields on Government debt instrumentsYields on short-term Treasury Bills steadily drifteddownwards throughout the period January to June2009, as shown in Chart 4.6. In general, primaryauctions of Treasury Bills remained oversubscribedwith an average bid-cover ratio of 1.92.10
Reflecting the cut in the key Repo Rate in March2009, the weighted yields on all three maturitiesof Treasury Bills continued to fall until May 2009
and thereafter started to stabilise. The unchangedkey Repo Rate on 22 June was fully reflected inthe weighted yields, which remained stable. Frombeginning of January to end-June 2009, yields fellfrom 8.52 per cent to 4.65 per cent on the 91-dayBills, from 8.45 per cent to 4.69 per cent on the182-day Bills and from 8.71 per cent to 5.14 percent on the 364-day Bills.Chart 4.6: Movements in Yields on Treasury/Bankof Mauritius Bills
The market exhibited preference for 364-daymaturities from January to March 2009,indicating investors’ initial desire for longer terminstruments. However, from March to June 2009,market sentiment shifted as investors switchedincreasingly to 91-day maturities. The auctions for the other governmentinstruments, namely Treasury Notes, Five-YearGovernment of Mauritius Bonds and Long TermGovernment of Mauritius Bonds were, onaverage, oversubscribed in the period January toJune 2009. The trend in the weighted averageyields of these instruments reflected the evolutionof short-term market interest rates. Chart 4.7shows movements in yields on Treasury Notes.Chart 4.7: Evolution of Yields on Treasury Notes
Inflation Report Bank of Mauritius
28
10 Bid-cover ratio is the ratio of the value of bids received to the tender amount.

Non-residents’ holdings of government andcentral bank securities fell from Rs0.3 billion atthe end of December 2008 to Rs0.06 billion at theend of June 2009. Resident holders of governmentand central bank securities comprised principallybanks and pensions funds.
4.3 INTEREST RATESFollowing the reduction of 100 basis points in thekey Repo Rate on 26 March 2009, banks adjusteddownwards their lending and deposit interest ratesby similar magnitudes within a relatively shorttime lag, as depicted in Chart 4.8. From 5.50 percent at the end of January 2009, the modal savingsdeposit rate declined to 4.50 per cent by the end ofApril 2009 and remained unchanged thereafter.The interest rate on savings deposits moved froma range of 5.00-5.75 per cent at the end of January2009 to a range of 4.00-4.75 per cent at the end ofJune 2009.The modal Prime Lending Rate (PLR) movedfrom 9.50 per cent at the end of January 2009 to8.50 per cent at the end of April 2009 and wasunchanged until the end of June 2009. Banks’PLR moved from a range of 9.05-10.00 per cent atthe end of January 2009 to a range of 8.05-9.00per cent at the end of June 2009. Chart 4.8 depictsmovements in deposit and lending rates as well asthe key Repo Rate.Chart 4.8: Key Repo Rate and Deposit andLending Rates
The real rate of interest on savings depositsimproved gradually from -3.5 per cent at theend of January 2009 to -2.2 per cent at the endof June 2009, reflecting the effect of the declinein inflation which offset the drop in the keyRepo Rate.
4.4 FOREIGN EXCHANGE MARKET AND EXCHANGE RATES
Major international currenciesThe US dollar strengthened in the first two monthsof 2009 on increased risk aversion. Weakeconomic data releases undermined investors’confidence as they moved their assets andcurrency holdings into US dollar denominatedassets. The market focused on the stimuluspackage of the new US administration and rescueplans for the US financial industry. The US dollar reached a high of 1.2487 against theeuro on 4 March 2009. This trend was reversedthereafter and the US dollar lost momentum amidsigns of stabilisation of the global financial crisisand scattered evidence that the economicslowdown was bottoming out. With investors’confidence back, there was a reversal of capitalflows from US dollar and US dollar denominatedassets to riskier assets namely, stocks and higher-yielding currencies such as euro, Pound sterlingand the Australian dollar. As a result, the US dollardepreciated in the second quarter of 2009. Overall,for the six months to June 2009, the US currencydepreciated against the euro and the Pound sterlingbut appreciated vis-à-vis the Japanese yen on apoint-to-point basis. The depreciation of the euro from January 2009 toearly March 2009 was mainly due to the ECBslashing its key refinancing rate and investorsfavouring US assets. Thereafter, the euro recoveredagainst the weak US dollar on the revival ofinvestors’ risk appetite and on better-than-expecteddata releases in the euro zone. Amid hopes of aglobal recovery, the euro rebounded against majorcurrencies in the second quarter of 2009. The Pound sterling hovered in the range ofUS$1.3676 and US$1.5182 in the first quarter of2009 as the severe recession and aggressiveloosening of monetary policy pressurised thecurrency. However, general bullish sentiment forthe Pound supported by increasing signs of theUK economy stabilising and investors’perception of the Pound being undervalued led toan appreciation of the currency during thesecond quarter of 2009. Chart 4.9 shows the
4. Monetary and Financial Developments
29

evolution of the US dollar against the euro andthe Pound sterling.Chart 4.9: Evolution of the US dollar against thePound sterling and the euro
Domestic currencyOn the domestic market, the rupee depreciated, ona point-to-point basis, between 1 January 2009and 30 June 2009, against the US dollar, thePound sterling and the euro by 1.8 per cent, 14.4per cent and 1.4 per cent, respectively.The rupee hovered within the range of Rs32.48-Rs34.80 against the US dollar in the six-monthperiod ended June 2009. In the first quarter, therupee lost some ground vis-à-vis the US dollar asthe latter appreciated on international markets,reaching a trough of Rs34.80 on 4 March.Thereafter, the rupee recovered on the back ofimproving domestic market sentiment and broad-based weakness of the US dollar on globalmarkets, attaining a peak of Rs32.80 on 3 June2009. The rupee was volatile against the Pound sterlingand the euro, following more or less the samepattern in both cases. However, the depreciationof the rupee was more pronounced against thePound sterling as from February 2009 on the backof the deteriorating outlook for the euro zoneeconomies while the United Kingdom seemedmore resilient supported by proactive decisions torekindle growth.The evolution of the rupee exchange rate againstthe US dollar, the Pound sterling and the euro isshown in Chart 4.10.
Chart 4.10: Exchange Rate Movements
Activity on the domestic foreignexchange marketThere was no evidence of demand or supplypressure on the domestic foreign exchange marketin the first half of 2009. Banks maintainedcomparatively higher overbought foreignexchange position of US$77.9 million comparedto US$39.3 million in the period July toDecember 2008. The Bank did not intervene tobuy or sell foreign exchange from the foreignexchange market.The volume of transactions on the interbankforeign exchange market fell to a monthly averageof US$11.4 million in the first semester of 2009,lower than the monthly average of US$15.0million in the period July to December 2008.
Effective exchange rates The nominal effective exchange rates, asmeasured by MERI1 and MERI2, sustained theirdepreciating trend in the first three months of2009 but remained rather stable afterwards. TheMERI1, which uses the currency distribution oftrade as weights, showed a depreciation of 3.4 percent over the period January to June 2009. TheMERI2, which combined currency distribution oftrade with that of tourism receipts as weights,depreciated by 3.6 per cent over the same period.Chart 4.11 illustrates the evolution of MERI1 andMERI2.
Inflation Report Bank of Mauritius
30

Chart 4.11: Evolution of MERI1 and MERI2
The real effective exchange rate with weightsbased on trade distribution with countries thatmake up at least 80.0 per cent of total trade andadjusted for price differentials between thedomestic economy and its trading partners,showed a depreciation of 6.5 per cent. Chart 4.12illustrates the evolution of the real effectiveexchange rate. Chart 4.12: Movements in Real EffectiveExchange Rate
:
4. Monetary and Financial Developments
31

There are encouraging signs that the globaleconomy is moving out of recession, as suggestedby the latest batch of economic reports and theIMF October 2009 WEO. The pace of economiccontraction has slowed in some of the majoradvanced economies while in other economies,the recovery seemed to have already started. Atthis juncture, however, the recovery is still fragileand the global economy remains vulnerable tocontinuing strains in the financial system, weaklabour market conditions, gradually risingcommodity prices and massive liquidity resultingfrom the unprecedented fiscal and monetarystimulus. The latest IMF projections indicate thatthe rate of decline of world output would be lowerin 2009 than envisaged in the July 2009 WEOUpdate and for 2010 the global economy wouldrecord a higher positive growth rate at 3.1 percent, up by 0.6 percentage point from the July2009 figure of 2.5 per cent. With the recovery expected to be sluggish due tothe significant economic slack and weak demandpressures over the next few quarters, the short-to-medium term inflation outlook should remainbenign, dissipating any short-term threat of aresurgence of inflationary pressures at the globallevel. In October 2009, the IMF projectedinflation in advanced economies at 0.1 per centin 2009 and 1.1 per cent in 2010, while inflationfor emerging and developing economies isprojected at 5.5 per cent and 4.9 per cent in 2009and 2010, respectively. Oil prices are likely to rebound in the mediumterm, although a rapid recovery to the record pricelevels seen in the first half of 2008 is unlikely,given prospects of more moderate growth inemerging and developing economies in the nextglobal expansion. According to the US EnergyInformation Administration Short Term EnergyOutlook released on 6 October 2009, the price ofNYMEX WTI crude oil is expected to averageabout US$70 per barrel until the first quarter of2010. Average oil prices are projected to risegradually to around US$75 per barrel by December2010, as world economic conditions improve.
Looking further ahead, however, the globalinflation outlook is clouded by uncertaintiesregarding the evolution of commodity prices,particularly oil, on international markets as wellas the second-round effects of the massive fiscaland monetary stimulus implemented acrosscountries. Reflecting improved marketexpectations, commodity prices - especially oil -have surged from a trough ahead of sustainedeconomic recovery.
5.1 RISKS TO THE INFLATIONOUTLOOK There are both downside as well as upside risks tothe domestic inflation outlook. On the downside,they relate to the outlook for economic activityparticularly, while on the upside, they pertain tocommodity price pressures stemming fromexternal sources and exchange rate movements. After declining steadily from the second quarterof 2008 onwards, preliminary estimates ofquarterly economic growth suggest that growthwill gradually recover but will remain weak.Demand pressures are foreseen to stay subdued,the more so as the pick-up in overall economicactivity is expected to be held back by the slowrecovery in external-demand led sectors namelythe tourism and textile sectors. The full effects ofthe fiscal and monetary stimulus are yet to be feltand, at this juncture, the expansionary economicpolicies are not expected to generate unduedomestic demand pressures. As a result, theoutput gap is estimated to remain in negativeterritory up to around the second half of 2010although the magnitude is forecast to diminish asfrom the second half of 2009. Thus, risks to theinflation outlook emanating from domesticeconomic conditions should remain moderateover the forthcoming quarters.Monetary developments have been characterisedby a general deceleration in the growth of moneyand credit, indicative of the slowdown in economicactivity. Overall, the rate of monetary expansion isnot foreseen to threaten the attainment of lowinflation over the short to medium term.
33
5. THE OUTLOOK FOR INFLATION

The US dollar depreciated over the past fewmonths and could remain undermined in thelonger run. However, while financial marketsgained relative stability, global currency marketsare still quite volatile. Consequently, volatility oninternational currency markets coupled withlower capital inflows and a large current accountdeficit might exert pressure on the exchange rateof the rupee in the medium to long term. Alreadyin real effective terms, the rupee depreciated inthe first half of 2009. Any unfavourable exchangerate development remains a source of upwardprice pressures over the medium term.The disinflationary momentum triggered bycommodity price developments on internationalmarkets has stabilised. The risks to the inflationoutlook are broadly balanced over the next fewquarters. However, looking further ahead and onbalance, upside risks could outweigh downsiderisks. The countervailing pressures could arisefrom increases in commodity prices and freightrates in the medium term. In comparison to the previous inflation forecast,there is a slight increase which is symmetricallydistributed around the baseline projection. Thisupward revision stems from the degree ofuncertainty regarding future commodity pricedevelopments, which has already risen since thelast projections were made.
Inflation fan chartThe risks to the inflation outlook up till December2010 are graphically represented in the inflationfan chart, as shown in Chart 5.1. The fan chartdepicts the probability of different inflationoutcomes based on the central projectionillustrated by the darkest band in the chart. Theuncertainty around the central projection ofinflation is shown as additional bands above andbelow the central projection.The fan chart continues to show a deceleration ininflation up till the end of 2009 and a pick-upthereafter. This may be attributed to the combinedimpact of the base effects and the impact oflower-than-expected inflation outturn.
In a context of high uncertainty about theevolution of the global economy, weighing theabove-mentioned risks against the baselinescenario shows a neutral balance for the inflationforecast. This implies a projection of symmetricdensity for inflation throughout the forecasthorizon, which means that there is the sameprobability inflation will fall below or rise abovethe level considered in the baseline scenario.Chart 5.1: Inflation Fan Chart
Inflation Report Bank of Mauritius
34

5. The Outlook for Inflation
35
Box 3: Inflation Expectations
The third Inflation Expectations Survey was carried out in June 2009. Out of the 50 stakeholders chosen from thefinancial and real sectors of the economy, 44 responded to the survey. The survey findings are based on these 44responses.Findings of the Inflation Expectations Survey1. With respect to how respondents perceived the 7.4 per cent inflation rate for the twelve months ended May 2009,
56.8 per cent of respondents considered this rate to be high while 13.6 per cent judged it to be too high. 25 per cent of respondents deemed this rate as being appropriate and 4.6 per cent viewed this rate as being low.
2. With regard to their best description of the movement of prices over the preceding twelve months, 50 per cent ofrespondents indicated that prices of goods and services had gone up while 34.1 per cent were of the opinion thatthey had gone down. 15.9 per cent of respondents viewed that prices had remained unchanged.
3. With respect to the three main factors accounting for the prevailing inflation pattern, external factors were viewedby 68.2 per cent of respondents as the primary source of inflation in Mauritius. Wage policy and monetary policywere regarded by 36.4 per cent of respondents as the second and third most important factors, respectively.
4. In relation to the movement of prices over the following twelve months, 47.8 per cent of respondents expected prices to go up, while 38.6 per cent of respondents anticipated a decrease in prices. 13.6 per cent of respondentsexpected that prices would remain unchanged.
5. Finally, respondents were requested to provide their expectations of the rate of inflation for the twelve months ending December 2009, June 2010 and December 2010. 56.8 per cent of respondents expect inflation in December 2009 to be less than 7.4 per cent while 50 per cent of respondents are of the opinion that inflation willbe less than 7.4 per cent in June 2010. 43.2 per cent of respondents anticipate an inflation rate of less than 7.4 per cent in December 2010.
6. The mean inflation rates expected by respondents were 6.9 per cent, 7.2 per cent and 7.5 per cent, respectively,for the twelve months ending December 2009, June 2010 and December 2010. Respondents thus expect a dropin inflation rate in the short-term but anticipate a pick-up in the medium-term.
Graphical Representation of ResponsesQI.1. Inflation for the twelve-month period ended May 2009 was 7.4 per cent. Do you perceive this rate to be ...

Inflation Report Bank of Mauritius
36
QI.2. Which of the following best describes the movement of prices over the past 12 months?
QI.3. Which of the following factors account for the current inflation pattern? (Ranking in order of importance startingwith 1 for most important)
QI.4. Which of the following would best describe the movement of prices over the next 12 months?

5. The Outlook for Inflation
37
QI.5 What is your expectation of inflation in (a) December 2009; (b) June 2010; and (c) December 2010?