Embed Size (px)
Citation preview

Inflation & Index NumbersProblems & Issues
Dr. D. Foster – ECO 285

Inflation & Index NumbersProblems & Issues
• What are we measuring?• The biases:
substitution/quality/new/distribution …• Inflation as the ultimate individual statistic.• Effects of inflation• Other measures:
PPI/CPI-E/GDP Deflator/“Core” CPI• The conspiracy theory.

What are we measuring?What are we measuring?Is it the price level? Is it the value of money? Is it the price level? Is it the value of money?
Is it a consumption bundle? Is it the cost of living?Is it a consumption bundle? Is it the cost of living?

What are we measuring?What are we measuring?
• Callahan: Gibberish• The thermometer analogy.
1980
2014
$25/hour $75/hour
Is there inflation?If programmers today are 2, 3, 4 times as productive today …
* 2 =
$37.50/hr
* 3 =
$25/hour
* 4 =
$18.75/hr
But all we know is what they were/are being paid!!!

It gets worse …It gets worse …
• Did prices rise in 2014? Did they fall?• We still can’t tell, because prices measure
value!!!!– We increase demand, price rises.We increase demand, price rises.– We decrease demand, price falls.We decrease demand, price falls.
$.50 2013 $1.00 2014 $.25 2014
We are using a We are using a subjective measure – subjective measure –
price – to discern price – to discern objective information objective information
on inflation!!on inflation!!

Last word? - Last word? - CallahanCallahan
I have no objection to measuring anything that can I have no objection to measuring anything that can meaningfully measured. However, the problem with meaningfully measured. However, the problem with price indices is not that they are inaccurate, but that price indices is not that they are inaccurate, but that
the idea of a price index can't even be defined the idea of a price index can't even be defined coherently. Moreover, such indices are used to justify coherently. Moreover, such indices are used to justify any amount of economic tinkering on the part of the any amount of economic tinkering on the part of the
government, whereby it displays its ability to "control" government, whereby it displays its ability to "control" numbers that are its own arbitrary creation. The most numbers that are its own arbitrary creation. The most beneficial change that the government could initiate in beneficial change that the government could initiate in
this field would be to fire all its econometricians, this field would be to fire all its econometricians, lowering the "price level" of our taxes.lowering the "price level" of our taxes.

Substitution BiasSubstitution Bias
• ““Upper level”Upper level”– Substitution across categories.– Price of chicken rises and people buy more pork.– This is incorporated into the C-CPI-U calculation.
• ““Lower level”Lower level”– Consumers substitute across brands.– Increase price of Whopper but not Big Mac and
people buy more Big Macs.– This is “mimicked” by CPI-U since 2002 due to its
use of geometric means.

Quality BiasQuality Bias
• If not quantifiable …If not quantifiable …– Just guessing.– Gas additive example.– Based on hedonic pricing techniques.– We aren’t recording real $ values.
• If quantifiable, easy to include.If quantifiable, easy to include.– Candy bar falls from 8 oz. to 6 oz. while price stays
at $.50.– Will be recorded as $.67 and add to inflation.

New Product BiasNew Product Bias• Incompatible with fixed basket of goods.Incompatible with fixed basket of goods.• By the time it is included, its price has fallen!!By the time it is included, its price has fallen!!• CPI-U and CPI-W update baskets every 2 years.CPI-U and CPI-W update baskets every 2 years.• C-CPI-U updates basket every month.C-CPI-U updates basket every month.
Outlet/Distribution BiasOutlet/Distribution Bias• Not every price is recorded.Not every price is recorded.• Prices differ depending on location & store.Prices differ depending on location & store.• If Sam’s Club is missed, low end not represented.If Sam’s Club is missed, low end not represented.• Today, web purchases would further Today, web purchases would further
complicate this aspect.complicate this aspect.

Other BiasesOther Biases
• Small Sample BiasSmall Sample Bias– When only a few observations are recorded for an
item & the geometric mean is derived.– Calculated value is overstated.
• Rental Equivalence BiasRental Equivalence Bias– The value of owner occupied homes – what they
would rent for.– You can’t presume this would be the market rent.

Individuals – the ultimate biasIndividuals – the ultimate bias
• You don’t buy what is in the basket.• You don’t buy the same proportion as
the basket.• Establishing one single number for
“inflation” is meaningless.• Inflation is the ultimate individual
statistic.
These index numbers are at best rather crude and inaccurate illustrations of changes which have occurred… [T]hey provide a rough image of events which every individual experiences in his daily life. A judicious housewife knows much more about price changes as far as they affect her own household than the statistical averages can tell.

The Effects of The Effects of InflationInflation
• If expected . . . it shouldn’t matter, but:If expected . . . it shouldn’t matter, but:– Repricing costs (less now with scanners).– Inconvenience costs if money holdings fall.– Real economic costs if workers want
compensation for the uncertainty.– If high, to pull it down requires a recession
and an increase in unemployment.
• If unexpected:If unexpected:– Recipients of fixed incomes are losers . . .– Payers of fixed amounts are winners . . . – Real interest returns fall (r = i - %cpi).

Producer Price Index (PPI)• Basket of producer goods.• Considered a leading indicator.

“Elderly” CPI (PPI-E)• Basket of goods for those >62 years old.• “Experimental” and unpublished.
GDP Deflator• Nominal GDP = P * Q = (price level)*(real GDP)• Rearrange: P (GDP Deflator) = (Nom. GDP)/(Real GDP)

“Core” CPI – less food/energy
Because food & energy prices are quite volatile ...
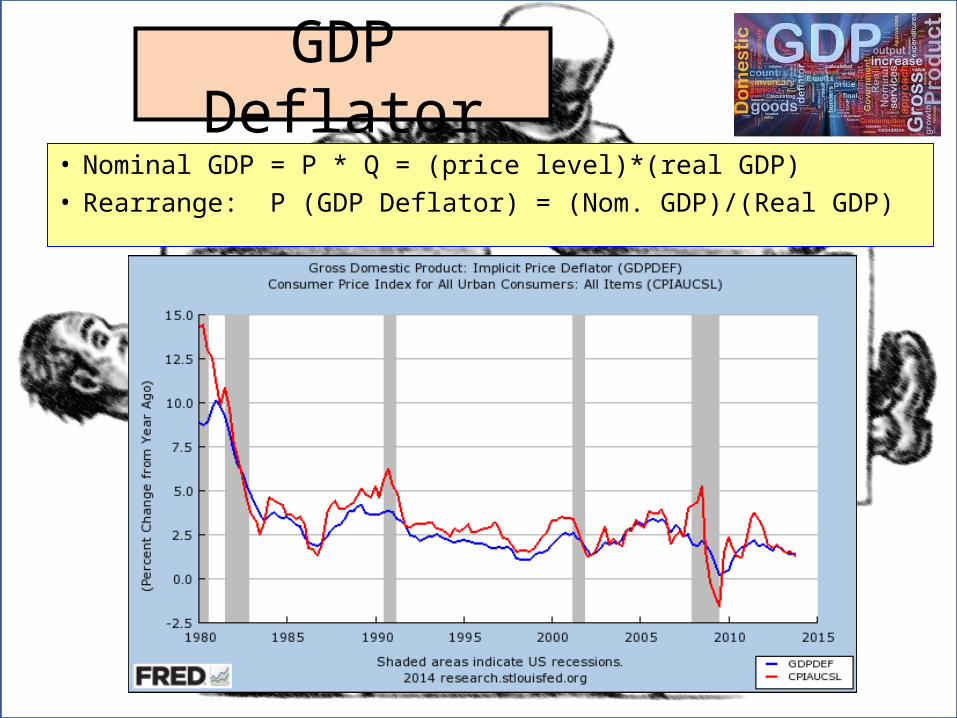
• Schiff:Schiff: official numbers seem wrong. official numbers seem wrong.– Constructed new basket …Constructed new basket …– Compared SPI to CPI:Compared SPI to CPI:• Close in 1970s (117% vs. 112%) but not 2000s (44% vs. 27%)Close in 1970s (117% vs. 112%) but not 2000s (44% vs. 27%)
– Newspaper index & health insurance.Newspaper index & health insurance.
Something fishy about the CPI?
• Boring:Boring: gov’t has an incentive to lowball est. gov’t has an incentive to lowball est.– BLS won’t release data.BLS won’t release data.• BLS vs. USDA on beef prices.BLS vs. USDA on beef prices.
– Methodologies changed 20 times over 30 years.Methodologies changed 20 times over 30 years.– Why not look at money growth directly?Why not look at money growth directly?

Inflation & Index NumbersProblems & Issues
Dr. D. Foster – ECO 285