Embed Size (px)
Citation preview
© Swiss Society of Economics and Statistics 2014, Vol. 150 (2) 55–87
a Swiss National Bank, Börsenstrasse 15, 8022 Zürich, Switzerland. Email: [email protected]. This paper was written while this author was at the Economic and Social Research Insti-tute, Dublin. The views expressed are those of the authors and do not necessarily reflect those of De Nederlandsche Bank or the Swiss National Bank. We would like to thank Bill Allen, Sandra Eickmeier, Stefan Gerlach, Peter Hördahl, John Williams, an anonymous referee and seminar participants at the EEA annual conference 2013 and the Economic and Social Research Institute for helpful comments and discussions, and Jakub Demski for excellent sup-port with the data.
b De Nederlandsche Bank, PO Box 98, 1000 AB, Amsterdam, The Netherlands, and Cass Busi-ness School. Email: [email protected].
Inflation Expectations, Central Bank Credibility and the Global Financial Crisis
Petra Gerlach-Kristena and Richhild Moessnerb
JEL-classification: E58, E31, G01.Keywords: Inflation expectations, central bank credibility, financial crisis.
1. Introduction
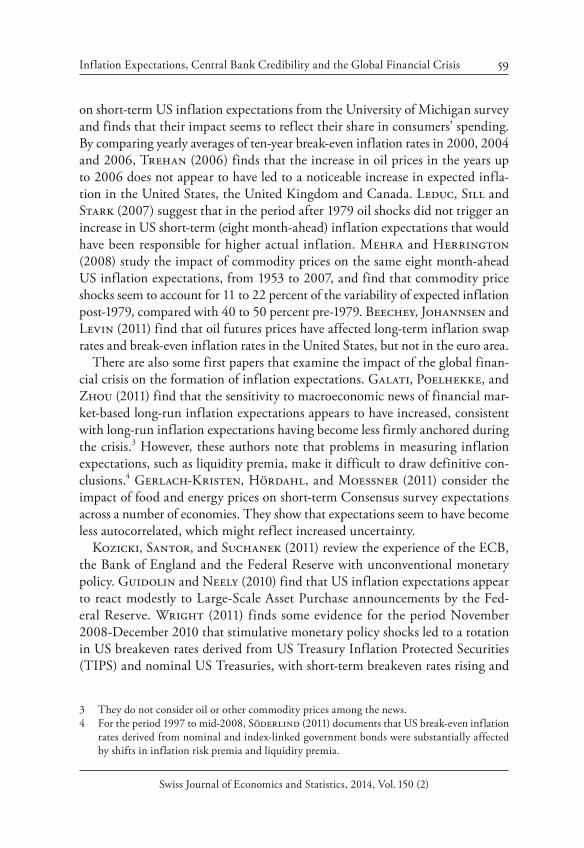
In late 2008, economic activity in the major advanced economies contracted sharply and actual and expected inflation rates dropped. In response, major central banks slashed interest rates and adopted unconventional monetary policy measures (Kozicki, Santor, and Suchanek, 2011), including provid-ing extended liquidity and purchasing assets. They also attempted to lower real interest rates by providing conditional forward guidance on keeping nominal policy rates low for an extended period of time, in order to drive down real inter-est rates and thus help revive the economy and avoid deflationary tendencies. To loosen monetary conditions, quantitative easing was adopted in late 2008 by the Federal Reserve and in early 2009 by the Bank of England. Due to unconven-tional monetary policy measures, the size of the balance sheets of the European Central Bank, the Bank of England and the Federal Reserve increased massively from late 2008 (see Figure 1). Forward guidance became an important unconven-tional monetary policy tool for the Federal Reserve when the zero lower bound was reached in late 2008 (Yellen, 2013). The European Central Bank intro-duced forward guidance in July 2013, and the Bank of England in August 2013.

56 Gerlach-Kristen / Moessner
Swiss Journal of Economics and Statistics, 2014, Vol. 150 (2)
1 On the costs of bringing down inflation, see e.g. Fischer (1994) for an empirical study and Blinder (2000) for a survey of policymakers.
Figure 1: Central Bank Balance Sheet Size; Total Assets in National Currencies (June 2007 100)
01-2007 12-2007 12-2008 12-2009 12-2010 12-2011 12-20120
100
200
300
400
500
600
Bank of JapanFederal ReserveEuropean Central BankBank of England
Sources: Datastream, national data.
These measures mark a departure from monetary policy in the calm years before the global financial crisis. Since the end of the Bretton Woods system, central banks have fought long battles to bring inflation down and under control.1 Low, stable inflation and inflation expectations reduce uncertainty in the economy and the associated risk premia.
Traditionally, central bankers have worried more about long-run inflation expectations than about short-run expectations. Short-run expectations are to a large extent beyond the central bank’s control since monetary policy impacts on the economy only with a lag. Long-run inflation expectations, by contrast, reflect how credibly a central bank promises stable inflation. If the central bank is fully credible, longer-run inflation expectations are firmly anchored at the level of its inflation objective or at a rate compatible with its definition of price stability. Thus, they do not respond to economic news, but are constant.
The question is: Have inflation expectations remained well-anchored, imply-ing that monetary policy has remained credible and the public still expects low, stable inflation? Or have the global financial crisis, policymakers’ unconventional

Inflation Expectations, Central Bank Credibility and the Global Financial Crisis 57
Swiss Journal of Economics and Statistics, 2014, Vol. 150 (2)
2 The European Central Bank’s definition of price stability is an inflation rate of “below, but close to two percent” for the Harmonised Index of Consumer Prices (HICP). The Federal Reserve’s longer-run goal for inflation is 2%, as measured by the annual change in the price index for personal consumption expenditures.
monetary policy responses and forward guidance, and the European debt crisis changed the anchoring of the public’s inflation expectations? And if so, has the adjustment been upwards, implying reduced inflation-fighting credibility, or downwards, reflecting doubts about central banks’ ability to revive the economy?
This paper tries to answer these questions for the euro area, the United King-dom and the United States using data spanning July 2004 to September 2013. In particular, we study how medium- to long-run inflation expectations have responded to commodity prices and inflation. We do so by analysing inflation expectations using one-year forward inflation swap rates three, five and ten years ahead, and we test whether the process of expectations formation has changed when Lehman Brothers collapsed and when the euro sovereign debt crisis first erupted. We focus on the impact of commodity prices on inflation expectations, on which there has only been limited work in the past (see Section 2). Commod-ity prices have varied greatly during the period of 2004–13 studied, in the case of oil prices tripling, falling back to their original level and tripling again. We also study the impact of inflation, which rose considerably above the inflation objective in all three economies, and turned negative in the US and the euro area. We find that since the onset of the global financial crisis, inflation expec-tations in the euro area, United Kingdom and United States three, five and ten years ahead have become less responsive to actual inflation and changes in oil and food prices. This suggests that the credibility of the central banks in these economies remains intact, despite large increases in their balance sheets due to unconventional monetary policy measures and the introduction of explicit for-ward guidance at the zero lower bound.
We also show that longer-term inflation expectations have remained broadly stable since the onset of the global financial crisis. That said, medium-term inflation expectations have fallen somewhat below 2% in the euro area, and to just below 2% in the United States.2 The volatility of inflation expectations has increased since the onset of the crisis. Moreover, we find that the autocorrela-tion of inflation expectations has risen. Shocks thus seem to affect expectations for longer than before. The rise in volatility appears due to the changed autocor-relation and larger shocks.

58 Gerlach-Kristen / Moessner
Swiss Journal of Economics and Statistics, 2014, Vol. 150 (2)
Overall, these findings suggest that the credibility of the central banks in the euro area, the United Kingdom and the United States remains intact, especially in the long run. The unchanged long-term credibility is remarkable given on the one hand the large shocks that have affected these economies and on the other hand the adoption of unconventional monetary policy measures.
The rest of the paper is structured as follows. Section 2 provides a short over-view of the related literature. Section 3 presents the data, Section 4 the estima-tion method, and Section 5 the results. Finally, Section 6 concludes.
2. Literature Review
This paper contributes to a broad literature on inflation expectations and central bank credibility. Several papers have examined the determinants of credibility. Levin, Natalucci and Piger (2004) find that for the period 1994–2003 infla-tion targeting apparently played a significant role in anchoring long-term infla-tion expectations. Beechey, Johannsen and Levin (2011) establish that long-term break-even inflation rates, derived from the difference between nominal and real bond yields, and inflation swap rates seem to respond to macroeconomic news in the United States but not in the euro area, suggesting that credibility was weaker in the United States. Gürkaynak, Levin and Swanson (2006) show that forward break-even inflation rates far ahead in the United States seem to have responded to economic news and also in the United Kingdom before the Bank of England was made operationally independent, though not thereafter. Clark and Nakata (2008) find that inflation expectations in the United States appear to have been better anchored in the later part of their sample period compared with around 20 years ago.
Gefang, Koop and Potter (2011) analyse the relationship between short-term and long-term inflation expectations in the United States and the United King-dom from 2003 to 2008 and find that long-term inflation expectations seem to have been contained within a target interval in the United States and constrained by the inflation target in the United Kingdom. Clark and Davig (2008) provide a survey of the empirical literature on drivers of inflation expectations, such as past inflation and macroeconomic variables. In a related paper (Clark and Davig, 2011), they show that the volatility of survey-based measures of US long-run infla-tion expectations decreased strongly from 1982 to mid-2008, and they attribute most of this reduction to smaller shocks to long-run inflation expectations.
A number of authors have studied the impact of commodity prices on inflation expectations before us. Van Duyne (1982) examines the impact of food prices
Inflation Expectations, Central Bank Credibility and the Global Financial Crisis 59
Swiss Journal of Economics and Statistics, 2014, Vol. 150 (2)
3 They do not consider oil or other commodity prices among the news.4 For the period 1997 to mid-2008, Söderlind (2011) documents that US break-even inflation
rates derived from nominal and index-linked government bonds were substantially affected by shifts in inflation risk premia and liquidity premia.
on short-term US inflation expectations from the University of Michigan survey and finds that their impact seems to reflect their share in consumers’ spending. By comparing yearly averages of ten-year break-even inflation rates in 2000, 2004 and 2006, Trehan (2006) finds that the increase in oil prices in the years up to 2006 does not appear to have led to a noticeable increase in expected infla-tion in the United States, the United Kingdom and Canada. Leduc, Sill and Stark (2007) suggest that in the period after 1979 oil shocks did not trigger an increase in US short-term (eight month-ahead) inflation expectations that would have been responsible for higher actual inflation. Mehra and Herrington (2008) study the impact of commodity prices on the same eight month-ahead US inflation expectations, from 1953 to 2007, and find that commodity price shocks seem to account for 11 to 22 percent of the variability of expected inflation post-1979, compared with 40 to 50 percent pre-1979. Beechey, Johannsen and Levin (2011) find that oil futures prices have affected long-term inflation swap rates and break-even inflation rates in the United States, but not in the euro area.
There are also some first papers that examine the impact of the global finan-cial crisis on the formation of inflation expectations. Galati, Poelhekke, and Zhou (2011) find that the sensitivity to macroeconomic news of financial mar-ket-based long-run inflation expectations appears to have increased, consistent with long-run inflation expectations having become less firmly anchored during the crisis.3 However, these authors note that problems in measuring inflation expectations, such as liquidity premia, make it difficult to draw definitive con-clusions.4 Gerlach-Kristen, Hördahl, and Moessner (2011) consider the impact of food and energy prices on short-term Consensus survey expectations across a number of economies. They show that expectations seem to have become less autocorrelated, which might reflect increased uncertainty.
Kozicki, Santor, and Suchanek (2011) review the experience of the ECB, the Bank of England and the Federal Reserve with unconventional monetary policy. Guidolin and Neely (2010) find that US inflation expectations appear to react modestly to Large-Scale Asset Purchase announcements by the Fed-eral Reserve. Wright (2011) finds some evidence for the period November 2008-December 2010 that stimulative monetary policy shocks led to a rotation in US breakeven rates derived from US Treasury Inflation Protected Securities (TIPS) and nominal US Treasuries, with short-term breakeven rates rising and

60 Gerlach-Kristen / Moessner
Swiss Journal of Economics and Statistics, 2014, Vol. 150 (2)
5 Inflation swap rates also include inflation risk premia and liquidity premia, which may vary over time. As noted in Galati, Poelhekke, and Zhou (2011), it is therefore difficult to draw definitive conclusions regarding the behaviour of inflation expectations by studying inflation swap rates.
long-term forward breakeven rates falling. Using daily data, Hofmann and Zhu (2013) studied whether central bank large-scale asset purchase announcements led to higher inflation expectations in the United States and the United King-dom. They find that central bank asset purchases had significant effects, but that their quantitative importance was uncertain. They conclude that central bank asset purchases were probably not the main driver of the shifts in inflation expec-tations. Moessner (2013) finds that the FOMC’s forward guidance at the zero lower bound led to a reduction in US real yields, but barely affected US inflation expectations derived from TIPS and nominal US Treasuries.
3. Data
Our analysis is based on one-year forward inflation swap rates for horizons of three, five and ten years ahead. We calculate these forward inflation swap rates from traded spot inflation swap rates. We do this because we are interested in assessing how far into the future an oil price shock affects inflation expectations.5 Is only the short term affected? Or is inflation expected to increase several years out? We would expect the latter to happen only if there are second-round effects, i.e. if the initial price shock causes subsequent price increases elsewhere in the economy. Second-round effects should not be present if the public believes the central bank’s commitment to keep inflation at its target or the rate compatible with its definition of price stability.
To understand the calculation of the annual forward inflation swap rates, it is useful to consider first the two-year spot inflation swap rate. While this rate captures the expected price change between today and two years from now, the one-year forward inflation swap rate one year ahead captures expected inflation between t 1 and t 2 years. This is the inflation expectation we are interested in. Denoting the swap rate of a maturity of j years at time t by ,jt the one-year forward inflation swap rate ending j years ahead is given by
11
11, 2,3, ,1 0.
1
jjtj
t jjt
j (1)

Inflation Expectations, Central Bank Credibility and the Global Financial Crisis 61
Swiss Journal of Economics and Statistics, 2014, Vol. 150 (2)
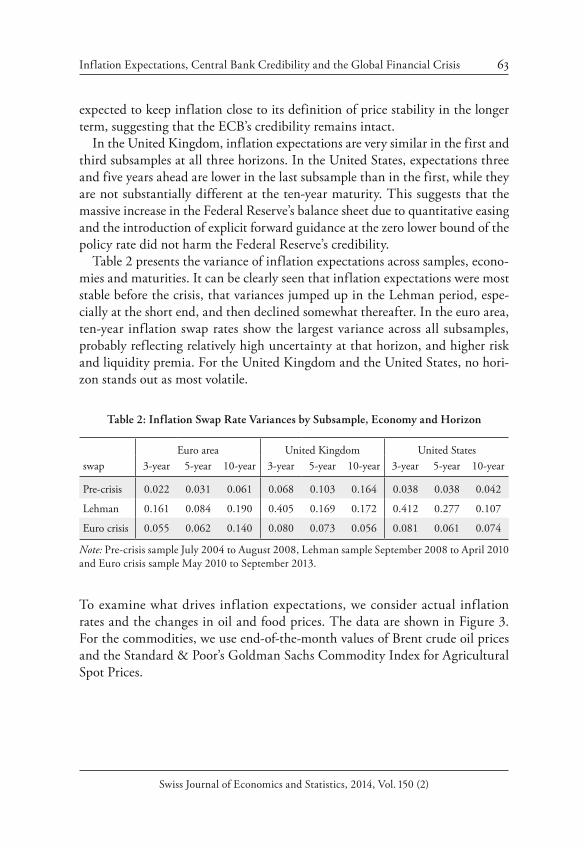
For 1 1.1, t tj Figure 2 shows the one-year forward inflation swap rates ending three, five and ten years ahead for the euro area, the United Kingdom and the United States for the sample July 2004 to September 2013. The underlying price index for the inflation swap rates is the consumer price index.
Table 1 presents the mean of inflation expectations by horizon, subsample and economy, and Table 2 the variances. We break the sample into three subperiods, one up to the collapse of Lehman Brothers in September 2008, the second up to the beginning of the European debt crisis in May 2010, and a third for the time thereafter.
Table 1: Inflation Swap Rate Means by Subsample, Economy and Horizon
Euro area United Kingdom United Statesswap 3-year 5-year 10-year 3-year 5-year 10-year 3-year 5-year 10-year
Pre-crisis 2.379 2.428 2.508 2.893 2.991 3.268 2.723 2.824 2.960
Lehman 1.997 2.479 2.466 2.761 3.335 4.174 1.944 2.669 3.078
Euro crisis 1.825 1.988 2.347 2.877 3.026 3.472 2.251 2.699 3.000
Note: Pre-crisis sample July 2004 to August 2008, Lehman sample September 2008 to April 2010 and Euro crisis sample May 2010 to September 2013.
It can be seen that inflation expectations shifted downwards during the Lehman Brothers phase at the three-year maturity in all three economies, reflecting dis-inflationary concerns at the height of the crisis. By contrast, ten-year inflation expectations shifted considerably upwards in the United Kingdom during the Lehman Brothers phase, which might have partly reflected concerns about the sustainability of the fiscal position and inflation-fighting credibility at the height of the crisis. By contrast, ten-year inflation expectations only shifted up slightly in the United States and did not change substantially in the euro area during the Lehman Brothers phase.
In the euro area, inflation expectations at all three maturities are clearly lower in the last subsample than before the crisis. Euro area inflation expectations fell by 55 basis points to 1.8%, at the three-year maturity, by 44 basis points to just below 2% at the five-year maturity, and by 16 basis points but remaining above 2% at the ten-year maturity. This arguably reflects the negative medium-term outlook for euro area recovery. But market participants seem to believe that the European Central Bank will bring inflation back to its definition of price stabil-ity of “below, but close to two percent” in the medium term. The ECB is also

62 Gerlach-Kristen / Moessner
Swiss Journal of Economics and Statistics, 2014, Vol. 150 (2)
Figure 2: Forward Inflation Swap Rates (in %)
–1
0
1
2
3
4
5
6
2004-06 2006-06 2008-06 2010-06 2012-06
Euro area
–1
0
1
2
3
4
5
6
2004-06 2006-06 2008-06 2010-06 2012-06
United Kingdom
–1
0
1
2
3
4
5
6
2004-06 2006-06 2008-06 2010-06 2012-06
United States
Three-year ahead forward inflation swap rateFive-year ahead forward inflation swap rateTen-year ahead forward inflation swap rate
Sources: Bloomberg, authors’ calculations.
Inflation Expectations, Central Bank Credibility and the Global Financial Crisis 63
Swiss Journal of Economics and Statistics, 2014, Vol. 150 (2)
expected to keep inflation close to its definition of price stability in the longer term, suggesting that the ECB’s credibility remains intact.
In the United Kingdom, inflation expectations are very similar in the first and third subsamples at all three horizons. In the United States, expectations three and five years ahead are lower in the last subsample than in the first, while they are not substantially different at the ten-year maturity. This suggests that the massive increase in the Federal Reserve’s balance sheet due to quantitative easing and the introduction of explicit forward guidance at the zero lower bound of the policy rate did not harm the Federal Reserve’s credibility.
Table 2 presents the variance of inflation expectations across samples, econo-mies and maturities. It can be clearly seen that inflation expectations were most stable before the crisis, that variances jumped up in the Lehman period, espe-cially at the short end, and then declined somewhat thereafter. In the euro area, ten-year inflation swap rates show the largest variance across all subsamples, probably reflecting relatively high uncertainty at that horizon, and higher risk and liquidity premia. For the United Kingdom and the United States, no hori-zon stands out as most volatile.
Table 2: Inflation Swap Rate Variances by Subsample, Economy and Horizon
Euro area United Kingdom United Statesswap 3-year 5-year 10-year 3-year 5-year 10-year 3-year 5-year 10-year
Pre-crisis 0.022 0.031 0.061 0.068 0.103 0.164 0.038 0.038 0.042
Lehman 0.161 0.084 0.190 0.405 0.169 0.172 0.412 0.277 0.107
Euro crisis 0.055 0.062 0.140 0.080 0.073 0.056 0.081 0.061 0.074
Note: Pre-crisis sample July 2004 to August 2008, Lehman sample September 2008 to April 2010 and Euro crisis sample May 2010 to September 2013.
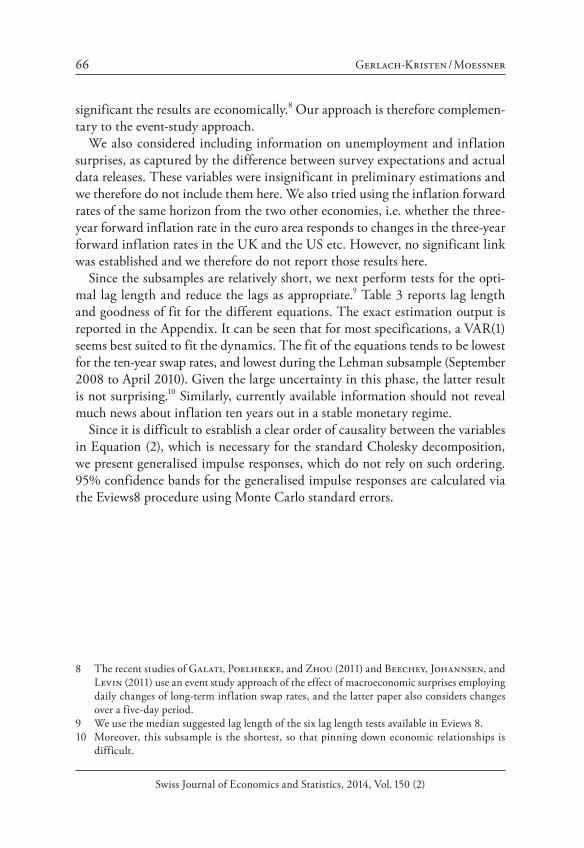
To examine what drives inflation expectations, we consider actual inflation rates and the changes in oil and food prices. The data are shown in Figure 3. For the commodities, we use end-of-the-month values of Brent crude oil prices and the Standard & Poor’s Goldman Sachs Commodity Index for Agricultural Spot Prices.

64 Gerlach-Kristen / Moessner
Swiss Journal of Economics and Statistics, 2014, Vol. 150 (2)
Figure 3: Actual Inflation Rates (in %) and Commodity Prices (in USD, June 2004 100)
–4
–2
0
2
4
6
06-2004 05-2006 04-2008 03-2010 01-2012
Euro areaUnited KingdomUnited States
0
100
200
300
400
500
06-2004 05-2006 04-2008 03-2010 01-2012
Oil PriceFood price index
Sources: Bloomberg, Datastream.

Inflation Expectations, Central Bank Credibility and the Global Financial Crisis 65
Swiss Journal of Economics and Statistics, 2014, Vol. 150 (2)
6 The underlying price index in Figure 2 is the Harmonised Index of Consumer Prices (HICP). While inflation swaps based on this index are widely traded in the United Kingdom and the United States, liquidity in the euro area is higher for swaps based on the HICP exclud-ing tobacco. We do not use those data to ensure comparability across economies. That said, we also performed the estimations discussed below using the alternative euro area data and obtained very similar impulse responses.
7 If we use growth rates for the commodity prices rather than changes, the results presented in the paper are virtually unaffected.
4. Estimation Method
In this section, we estimate what drives inflation expectations at different hori-zons. For each currency area, each of the three expectations horizons ( j 3, 5, 10 years) and each subsample, we estimate
1 2
1 2
1 2
1 2
,
j j jt t t
actual actual actualt t t
toil oil oilt t tfood food foodt t t
C A B ep p p
p p p
(2)
where tj denotes the expected one-year forward inflation rate j years out, t
actual the actual current inflation rate, and pt
oil and ptfood the change in the oil and
food price, respectively. We use end-of-the-month rather than daily data since most series appear non-
stationary at high frequency. Figure 2 (and standard unit root tests not reported here) suggests that the assumption of stationary inflation expectations is appro-priate for the three economies under consideration.6 In Figure 3 the commodity prices are shown in US dollars, but in the estimation of Equation (2) we convert them into euros for the euro area and into pound sterling for the United King-dom so as to fully capture their impact on the local inflation rate. Moreover, we difference the commodity data since standard unit root tests do not reject the existence of a unit root.7 Actual inflation is used in levels. Monthly data allows us to study effects that are economically significant in that they are significant over periods longer than one or a few days. Studies of financial market reactions to macroeconomic surprises using an event-study approach usually examine reac-tions over one or several days only, or even intra-day, so that it is not clear how
66 Gerlach-Kristen / Moessner
Swiss Journal of Economics and Statistics, 2014, Vol. 150 (2)
8 The recent studies of Galati, Poelhekke, and Zhou (2011) and Beechey, Johannsen, and Levin (2011) use an event study approach of the effect of macroeconomic surprises employing daily changes of long-term inflation swap rates, and the latter paper also considers changes over a five-day period.
9 We use the median suggested lag length of the six lag length tests available in Eviews 8.10 Moreover, this subsample is the shortest, so that pinning down economic relationships is
difficult.
significant the results are economically.8 Our approach is therefore complemen-tary to the event-study approach.
We also considered including information on unemployment and inflation surprises, as captured by the difference between survey expectations and actual data releases. These variables were insignificant in preliminary estimations and we therefore do not include them here. We also tried using the inflation forward rates of the same horizon from the two other economies, i.e. whether the three-year forward inflation rate in the euro area responds to changes in the three-year forward inflation rates in the UK and the US etc. However, no significant link was established and we therefore do not report those results here.
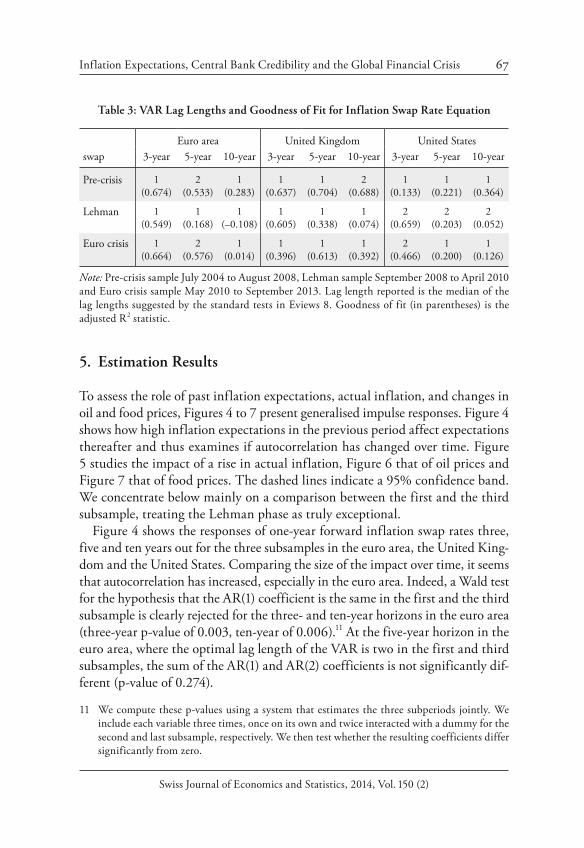
Since the subsamples are relatively short, we next perform tests for the opti-mal lag length and reduce the lags as appropriate.9 Table 3 reports lag length and goodness of fit for the different equations. The exact estimation output is reported in the Appendix. It can be seen that for most specifications, a VAR(1) seems best suited to fit the dynamics. The fit of the equations tends to be lowest for the ten-year swap rates, and lowest during the Lehman subsample (September 2008 to April 2010). Given the large uncertainty in this phase, the latter result is not surprising.10 Similarly, currently available information should not reveal much news about inflation ten years out in a stable monetary regime.
Since it is difficult to establish a clear order of causality between the variables in Equation (2), which is necessary for the standard Cholesky decomposition, we present generalised impulse responses, which do not rely on such ordering. 95% confidence bands for the generalised impulse responses are calculated via the Eviews8 procedure using Monte Carlo standard errors.
Inflation Expectations, Central Bank Credibility and the Global Financial Crisis 67
Swiss Journal of Economics and Statistics, 2014, Vol. 150 (2)
11 We compute these p-values using a system that estimates the three subperiods jointly. We include each variable three times, once on its own and twice interacted with a dummy for the second and last subsample, respectively. We then test whether the resulting coefficients differ significantly from zero.
5. Estimation Results
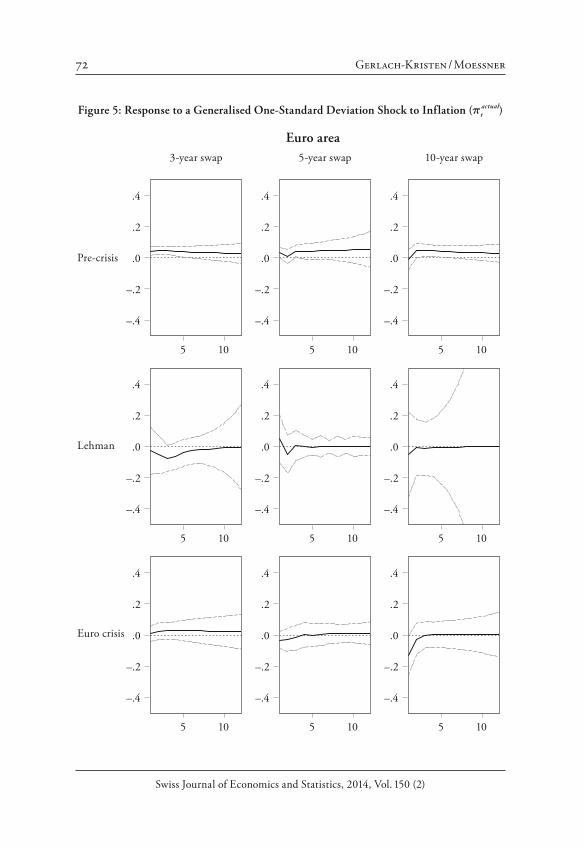
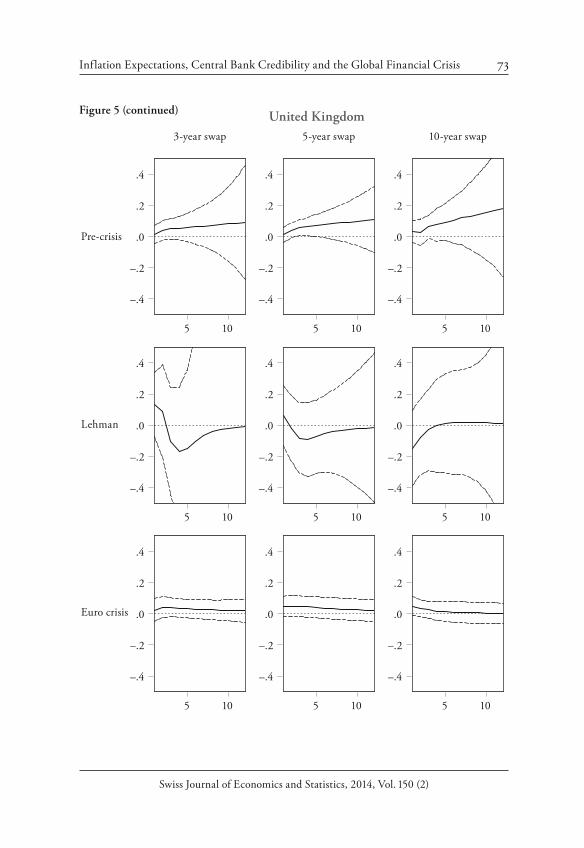
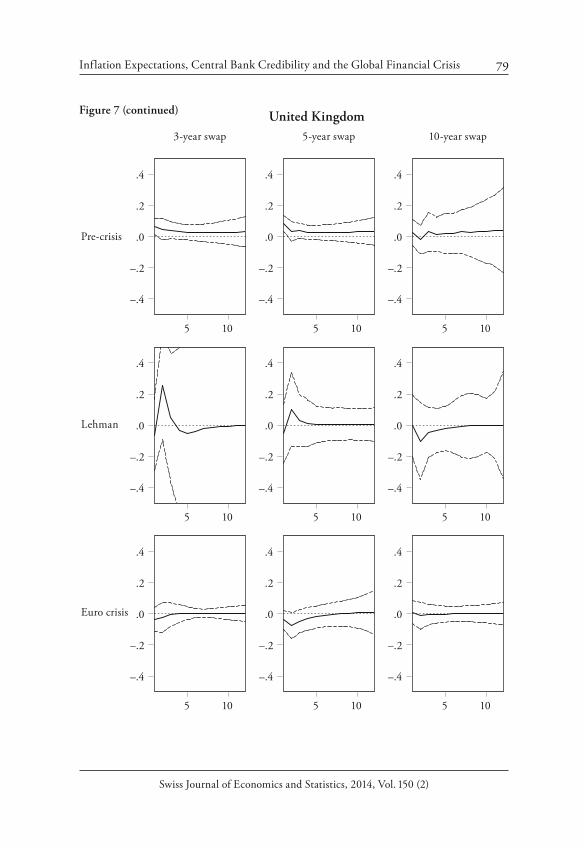
To assess the role of past inflation expectations, actual inflation, and changes in oil and food prices, Figures 4 to 7 present generalised impulse responses. Figure 4 shows how high inflation expectations in the previous period affect expectations thereafter and thus examines if autocorrelation has changed over time. Figure 5 studies the impact of a rise in actual inflation, Figure 6 that of oil prices and Figure 7 that of food prices. The dashed lines indicate a 95% confidence band. We concentrate below mainly on a comparison between the first and the third subsample, treating the Lehman phase as truly exceptional.
Figure 4 shows the responses of one-year forward inflation swap rates three, five and ten years out for the three subsamples in the euro area, the United King-dom and the United States. Comparing the size of the impact over time, it seems that autocorrelation has increased, especially in the euro area. Indeed, a Wald test for the hypothesis that the AR(1) coefficient is the same in the first and the third subsample is clearly rejected for the three- and ten-year horizons in the euro area (three-year p-value of 0.003, ten-year of 0.006).11 At the five-year horizon in the euro area, where the optimal lag length of the VAR is two in the first and third subsamples, the sum of the AR(1) and AR(2) coefficients is not significantly dif-ferent (p-value of 0.274).
Table 3: VAR Lag Lengths and Goodness of Fit for Inflation Swap Rate Equation
Euro area United Kingdom United Statesswap 3-year 5-year 10-year 3-year 5-year 10-year 3-year 5-year 10-year
Pre-crisis 1 (0.674)
2 (0.533)
1 (0.283)
1 (0.637)
1 (0.704)
2 (0.688)
1 (0.133)
1 (0.221)
1 (0.364)
Lehman 1 (0.549)
1 (0.168)
1 (–0.108)
1 (0.605)
1 (0.338)
1 (0.074)
2 (0.659)
2 (0.203)
2 (0.052)
Euro crisis 1 (0.664)
2 (0.576)
1 (0.014)
1 (0.396)
1 (0.613)
1 (0.392)
2 (0.466)
1 (0.200)
1 (0.126)
Note: Pre-crisis sample July 2004 to August 2008, Lehman sample September 2008 to April 2010 and Euro crisis sample May 2010 to September 2013. Lag length reported is the median of the lag lengths suggested by the standard tests in Eviews 8. Goodness of fit (in parentheses) is the adjusted R2 statistic.

68 Gerlach-Kristen / Moessner
Swiss Journal of Economics and Statistics, 2014, Vol. 150 (2)
In the United Kingdom, only the autocorrelation at the ten-year horizon seems to have changed. The optimal lag length of the VAR is two in the first and one in the third subsample, and the AR(1) coefficient in the third subsample is sig-nificantly lower than the sum of the AR(1) and AR(2) coefficients in the first subsample, at the 5% level (p-value 0.037). For the United States, the hypoth-esis that the autocorrelation is the same in the first and the third subsample is clearly rejected for the three-year swap rate (the optimal lag length of the VAR is one in the first and two in the third subsample; the sum of the AR(1) and AR(2) coefficients in the third subsample is significantly higher than the AR(1) coef-ficient in the first subsample, p-value of 0.001) and less clearly for the ten-year rate (0.090). Overall, Figure 4 suggests that inflation expectations have returned more slowly to their average in recent years than before the crisis. This change is clearest at the ten-year horizon.
Figure 5 shows the impact of actual inflation on forward inflation swap rates. While this variable used to affect inflation expectation slightly in the euro area at all horizons and three-year ahead expectations in the United States, it seems to have lost influence with the crisis. Such independence of longer-term infla-tion expectations from actual inflation is a sign that central banks’ credibility is intact.
Figure 6 presents the impulse responses for a shock in the oil price change on forward inflation swap rates. Oil prices seem to matter for the three- and five-year expectation in the euro area both before the crisis and in the third subsample. In the United Kingdom and less so the United States, there is evidence of an influ-ence in the pre-crisis sample. This effect seems to have largely disappeared with the crisis. Similarly, food prices, shown in Figure 7, had an impact on three-year expectations in all three economies before the crisis. Since then, the effect in the United Kingdom and the United States has disappeared.
In sum, the impulse responses suggest that actual inflation and changes in oil and food prices have had a smaller impact on inflation expectations since the crisis than before. Inflation expectations have moreover become more autocorre-lated. The fact that inflation expectations have become more volatile, as reported in Table 2, thus is partly due to the higher autocorrelation since the onset of the crisis. At the same time, variables not included in the regression analysis and thus captured by the residuum also have become more volatile. This is documented in Table 4, which shows that the standard error of the inflation swap rate equation in the VAR is generally larger in the third than in the first subsample. Whether this reflects that the new factors have started affecting inflation expectations, or whether variables that had an impact already before the crisis have simply become more volatile, is an open question left for future research.

Inflation Expectations, Central Bank Credibility and the Global Financial Crisis 69
Swiss Journal of Economics and Statistics, 2014, Vol. 150 (2)
Figure 4: Response to a Generalised One-Standard Deviation Shock
to Inflation Expectations ( tj )
Euro area
Pre-crisis
Lehman
Euro crisis
3-year swap 5-year swap 10-year swap
–.4
–.2
.0
.2
.4
5 10
–.4
–.2
.0
.2
.4
5 10
–.4
–.2
.0
.2
.4
5 10
–.4
–.2
.0
.2
.4
5 10
–.4
–.2
.0
.2
.4
5 10
–.4
–.2
.0
.2
.4
5 10
–.4
–.2
.0
.2
.4
5 10
–.4
–.2
.0
.2
.4
5 10
–.4
–.2
.0
.2
.4
5 10

70 Gerlach-Kristen / Moessner
Swiss Journal of Economics and Statistics, 2014, Vol. 150 (2)
United Kingdom
Pre-crisis
Lehman
Euro crisis
3-year swap 5-year swap 10-year swap
–.4
–.2
.0
.2
.4
5 10
–.4
–.2
.0
.2
.4
5 10
–.4
–.2
.0
.2
.4
5 10
–.4
–.2
.0
.2
.4
5 10
–.4
–.2
.0
.2
.4
5 10
–.4
–.2
.0
.2
.4
5 10
–.4
–.2
.0
.2
.4
5 10
–.4
–.2
.0
.2
.4
5 10
–.4
–.2
.0
.2
.4
5 10
Figure 4 (continued)

Inflation Expectations, Central Bank Credibility and the Global Financial Crisis 71
Swiss Journal of Economics and Statistics, 2014, Vol. 150 (2)
United States
Pre-crisis
Lehman
Euro crisis
3-year swap 5-year swap 10-year swap
–.4
–.2
.0
.2
.4
5 10
–.4
–.2
.0
.2
.4
5 10
–.4
–.2
.0
.2
.4
5 10
–.4
–.2
.0
.2
.4
5 10
–.4
–.2
.0
.2
.4
5 10
–.4
–.2
.0
.2
.4
5 10
–.4
–.2
.0
.2
.4
5 10
–.4
–.2
.0
.2
.4
5 10
–.4
–.2
.0
.2
.4
5 10Note: Generalised impulse responses, VAR length as reported in Table 3. Dashed lines indicate the 95% confidence band. Pre-crisis sample July 2004 to August 2008, Lehman sample September 2008 to April 2010 and euro crisis sample May 2010 to September 2013.
Figure 4 (continued)
72 Gerlach-Kristen / Moessner
Swiss Journal of Economics and Statistics, 2014, Vol. 150 (2)
Figure 5: Response to a Generalised One-Standard Deviation Shock to Inflation ( tactual)
Euro area
Pre-crisis
Lehman
Euro crisis
3-year swap 5-year swap 10-year swap
–.4
–.2
.0
.2
.4
5 10
–.4
–.2
.0
.2
.4
5 10
–.4
–.2
.0
.2
.4
5 10
–.4
–.2
.0
.2
.4
5 10
–.4
–.2
.0
.2
.4
5 10
–.4
–.2
.0
.2
.4
5 10
–.4
–.2
.0
.2
.4
5 10
–.4
–.2
.0
.2
.4
5 10
–.4
–.2
.0
.2
.4
5 10
Inflation Expectations, Central Bank Credibility and the Global Financial Crisis 73
Swiss Journal of Economics and Statistics, 2014, Vol. 150 (2)
United Kingdom
Pre-crisis
Lehman
Euro crisis
3-year swap 5-year swap 10-year swap
–.4
–.2
.0
.2
.4
5 10
–.4
–.2
.0
.2
.4
5 10
–.4
–.2
.0
.2
.4
5 10
–.4
–.2
.0
.2
.4
5 10
–.4
–.2
.0
.2
.4
5 10
–.4
–.2
.0
.2
.4
5 10
–.4
–.2
.0
.2
.4
5 10
–.4
–.2
.0
.2
.4
5 10
–.4
–.2
.0
.2
.4
5 10
Figure 5 (continued)

74 Gerlach-Kristen / Moessner
Swiss Journal of Economics and Statistics, 2014, Vol. 150 (2)
United States
Pre-crisis
Lehman
Euro crisis
3-year swap 5-year swap 10-year swap
–.4
–.2
.0
.2
.4
5 10
–.4
–.2
.0
.2
.4
5 10
–.4
–.2
.0
.2
.4
5 10
–.4
–.2
.0
.2
.4
5 10
–.4
–.2
.0
.2
.4
5 10
–.4
–.2
.0
.2
.4
5 10
–.4
–.2
.0
.2
.4
5 10
–.4
–.2
.0
.2
.4
5 10
–.4
–.2
.0
.2
.4
5 10Note: Generalised impulse responses, VAR length as reported in Table 3. Dashed lines indicate the 95% confidence band. Pre-crisis sample July 2004 to August 2008, Lehman sample September 2008 to April 2010 and euro crisis sample May 2010 to September 2013.
Figure 5 (continued)

Inflation Expectations, Central Bank Credibility and the Global Financial Crisis 75
Swiss Journal of Economics and Statistics, 2014, Vol. 150 (2)
Figure 6: Response to a Generalised One-Standard Deviation Shock
to the Oil Price Change ( ptoil )
Euro area
Pre-crisis
Lehman
Euro crisis
3-year swap 5-year swap 10-year swap
–.4
–.2
.0
.2
.4
5 10
–.4
–.2
.0
.2
.4
5 10
–.4
–.2
.0
.2
.4
5 10
–.4
–.2
.0
.2
.4
5 10
–.4
–.2
.0
.2
.4
5 10
–.4
–.2
.0
.2
.4
5 10
–.4
–.2
.0
.2
.4
5 10
–.4
–.2
.0
.2
.4
5 10
–.4
–.2
.0
.2
.4
5 10

76 Gerlach-Kristen / Moessner
Swiss Journal of Economics and Statistics, 2014, Vol. 150 (2)
United Kingdom
Pre-crisis
Lehman
Euro crisis
3-year swap 5-year swap 10-year swap
–.4
–.2
.0
.2
.4
5 10
–.4
–.2
.0
.2
.4
5 10
–.4
–.2
.0
.2
.4
5 10
–.4
–.2
.0
.2
.4
5 10
–.4
–.2
.0
.2
.4
5 10
–.4
–.2
.0
.2
.4
5 10
–.4
–.2
.0
.2
.4
5 10
–.4
–.2
.0
.2
.4
5 10
–.4
–.2
.0
.2
.4
5 10
Figure 6 (continued)

Inflation Expectations, Central Bank Credibility and the Global Financial Crisis 77
Swiss Journal of Economics and Statistics, 2014, Vol. 150 (2)
United States
Pre-crisis
Lehman
Euro crisis
3-year swap 5-year swap 10-year swap
–.4
–.2
.0
.2
.4
5 10
–.4
–.2
.0
.2
.4
5 10
–.4
–.2
.0
.2
.4
5 10
–.4
–.2
.0
.2
.4
5 10
–.4
–.2
.0
.2
.4
5 10
–.4
–.2
.0
.2
.4
5 10
–.4
–.2
.0
.2
.4
5 10
–.4
–.2
.0
.2
.4
5 10
–.4
–.2
.0
.2
.4
5 10Note: Generalised impulse responses, VAR length as reported in Table 3. Dashed lines indicate the 95% confidence band. Pre-crisis sample July 2004 to August 2008, Lehman sample September 2008 to April 2010 and euro crisis sample May 2010 to September 2013.
Figure 6 (continued)

78 Gerlach-Kristen / Moessner
Swiss Journal of Economics and Statistics, 2014, Vol. 150 (2)
Figure 7: Response to a Generalised One-Standard Deviation Shock
to the Food Price Change ( ptfood )
Euro area
Pre-crisis
Lehman
Euro crisis
3-year swap 5-year swap 10-year swap
–.4
–.2
.0
.2
.4
5 10
–.4
–.2
.0
.2
.4
5 10
–.4
–.2
.0
.2
.4
5 10
–.4
–.2
.0
.2
.4
5 10
–.4
–.2
.0
.2
.4
5 10
–.4
–.2
.0
.2
.4
5 10
–.4
–.2
.0
.2
.4
5 10
–.4
–.2
.0
.2
.4
5 10
–.4
–.2
.0
.2
.4
5 10
Inflation Expectations, Central Bank Credibility and the Global Financial Crisis 79
Swiss Journal of Economics and Statistics, 2014, Vol. 150 (2)
United Kingdom
Pre-crisis
Lehman
Euro crisis
3-year swap 5-year swap 10-year swap
–.4
–.2
.0
.2
.4
5 10
–.4
–.2
.0
.2
.4
5 10
–.4
–.2
.0
.2
.4
5 10
–.4
–.2
.0
.2
.4
5 10
–.4
–.2
.0
.2
.4
5 10
–.4
–.2
.0
.2
.4
5 10
–.4
–.2
.0
.2
.4
5 10
–.4
–.2
.0
.2
.4
5 10
–.4
–.2
.0
.2
.4
5 10
Figure 7 (continued)

80 Gerlach-Kristen / Moessner
Swiss Journal of Economics and Statistics, 2014, Vol. 150 (2)
United States
Pre-crisis
Lehman
Euro crisis
3-year swap 5-year swap 10-year swap
–.4
–.2
.0
.2
.4
5 10
–.4
–.2
.0
.2
.4
5 10
–.4
–.2
.0
.2
.4
5 10
–.4
–.2
.0
.2
.4
5 10
–.4
–.2
.0
.2
.4
5 10
–.4
–.2
.0
.2
.4
5 10
–.4
–.2
.0
.2
.4
5 10
–.4
–.2
.0
.2
.4
5 10
–.4
–.2
.0
.2
.4
5 10Note: Generalised impulse responses, VAR length as reported in Table 3. Dashed lines indicate the 95% confidence band. Pre-crisis sample July 2004 to August 2008, Lehman sample September 2008 to April 2010 and euro crisis sample May 2010 to September 2013.
Figure 7 (continued)

Inflation Expectations, Central Bank Credibility and the Global Financial Crisis 81
Swiss Journal of Economics and Statistics, 2014, Vol. 150 (2)
6. Conclusions
Long-run inflation expectations should not respond to economic news if the central bank is seen as credibly committed to stabilising inflation. In this paper we find that since the onset of the global financial crisis, inflation expectations in the euro area, United Kingdom and United States three, five and ten years ahead have become less responsive to actual inflation and changes in oil and food prices. This suggests that the credibility of the central banks in these economies remains intact, despite large increases in their balance sheets due to unconven-tional monetary policy measures and the introduction of explicit forward guid-ance at the zero lower bound.
Mean longer-term inflation expectations have generally not changed much since the global financial crisis, which supports this conclusion. That said, in the medium term markets’ inflation expectations are lower than before the crisis in the euro area and the United States. While standard analyses in the literature have defined credible monetary policy in terms of keeping longer-term inflation expectations low and stable, markets seem to price in lower inflation expecta-tions in the medium term than before the crisis, which may reflect doubts of an imminent economic recovery.
Finally, we also find that since the onset of the global financial crisis, inflation expectations have become more volatile. We argue that the higher variability of inflation expectations is due to two factors. First, the autocorrelation of infla-tion expectations has increased, which implies that shocks have a longer-term impact than before the crisis. Second, the variance of shocks has risen, reflect-ing the importance of factors not captured in the analysis. Whether these factors mattered for inflation expectations already before the crisis, but had a smaller variance, or whether they are variables that had no effect previously, is a ques-tion for future research.
Table 4: Standard Errors of Inflation Swap Rate Equation
Euro area United Kingdom United Statesswap 3-year 5-year 10-year 3-year 5-year 10-year 3-year 5-year 10-year
Pre-crisis 0.088 0.119 0.214 0.163 0.167 0.234 0.185 0.175 0.164
Lehman 0.276 0.271 0.470 0.410 0.343 0.409 0.385 0.482 0.327
Euro crisis 0.136 0.165 0.379 0.223 0.172 0.187 0.214 0.228 0.263
Note: Pre-crisis sample July 2004 to August 2008, Lehman sample September 2008 to April 2010 and Euro crisis sample May 2010 to September 2013.

82 Gerlach-Kristen / Moessner
Swiss Journal of Economics and Statistics, 2014, Vol. 150 (2)
Ap
pen
dix
Tabl
es A
1 to
3 p
rese
nt th
e VA
R es
timat
ion
resu
lts b
y ex
pect
atio
ns h
oriz
on. W
e onl
y re
port
the e
quat
ion
for e
xpec
ted
infla
tion.
Tab
le A
1: T
hre
e-Y
ear
Swap
Rat
es
Euro
are
aU
nite
d K
ingd
omU
nite
d St
ates
Pre-
crisi
sLe
hman
Euro
cris
isPr
e-cr
isis
Lehm
anEu
ro c
risis
Pre-
crisi
sLe
hman
Euro
cris
is
Con
stant
1.02
1***
1.29
3***
0.57
1***
0.72
4***
1.59
5***
1.07
5***
2.27
6***
3.45
6***
1.25
3***
1j t
0.48
4***
0.37
9***
0.61
7***
0.67
8***
0.38
6**
0.56
3***
0.05
4–0
.135
0.76
1***
1actual
t0.
085*
**–0
.015
0.05
60.
090*
0.07
30.
049
0.08
6***
0.40
4***
0.08
4
1oil
tp0.
007*
**0.
013
0.01
8***
0.01
1**
0.03
8*0.
014
0.00
60.
052*
**–0
.008
1food
tp–0
.001
*0.
007*
*–0
.001
–0.0
010.
012*
–0.0
01–0
.001
0.00
4–0
.002
*
2j t
–0.6
69**
*–0
.272
*
2actual
t–0
.096
–0.1
31
2oil
tp0.
026
0.01
3
2food
tp–0
.003
–0.0
00
Not
e: Pr
e-cr
isis s
ampl
e Ju
ly 2
004
to A
ugus
t 200
8, L
ehm
an sa
mpl
e Se
ptem
ber 2
008
to A
pril
2010
and
Eur
o cr
isis s
ampl
e M
ay 2
010
to S
epte
mbe
r 20
13. *
/**/
***
deno
tes s
igni
fican
ce a
t the
10/
5/1
perc
ent l
evel
. Opt
imal
lag
leng
th a
s rep
orte
d in
Tab
le 3
.

Inflation Expectations, Central Bank Credibility and the Global Financial Crisis 83
Swiss Journal of Economics and Statistics, 2014, Vol. 150 (2)
Tab
le A
2:
Fiv
e-Y
ear
Swap
Rat
es
Euro
are
aU
nite
d K
ingd
omU
nite
d St
ates
Pre-
crisi
sLe
hman
Euro
cris
isPr
e-cr
isis
Lehm
anEu
ro c
risis
Pre-
crisi
sLe
hman
Euro
cris
is
Con
stant
0.74
3***
3.59
5***
0.38
30.
752*
**2.
763*
**0.
783*
**1.
799*
**3.
802*
**1.
776*
**
1j t
0.26
9*–0
.415
*0.
598*
**0.
659*
**0.
197
0.70
4***
0.29
9**
–0.3
030.
380*
**
1actual
t0.
005
–0.0
65–0
.138
0.12
7**
–0.0
120.
032
0.04
90.
160
–0.0
43
1oil
tp0.
001
–0.0
190.
013*
0.00
9*0.
023
0.00
30.
008
0.02
20.
002
1food
tp–0
.001
0.00
8–0
.002
*–0
.002
0.00
4–0
.002
–0.0
010.
002
–0.0
03
2j t
0.33
6***
0.14
5–0
.119
2actual
t0.
086
0.18
90.
003
2oil
tp0.
005
–0.0
020.
025
2food
tp–0
.001
0.00
4***
0.00
2
Not
e: Pr
e-cr
isis s
ampl
e Ju
ly 2
004
to A
ugus
t 200
8, L
ehm
an sa
mpl
e Se
ptem
ber 2
008
to A
pril
2010
and
Eur
o cr
isis s
ampl
e M
ay 2
010
to S
epte
mbe
r 20
13. *
/**/
***
deno
tes s
igni
fican
ce a
t the
10/
5/1
perc
ent l
evel
. Opt
imal
lag
leng
th a
s rep
orte
d in
Tab
le 3
.

84 Gerlach-Kristen / Moessner
Swiss Journal of Economics and Statistics, 2014, Vol. 150 (2)
Tab
le A
3:
Ten
-Yea
r Sw
ap R
ates
Euro
are
aU
nite
d K
ingd
omU
nite
d St
ates
Pre-
crisi
sLe
hman
Euro
cris
isPr
e-cr
isis
Lehm
anEu
ro c
risis
Pre-
crisi
sLe
hman
Euro
cris
is
Con
stant
1.46
1***
3.38
7***
1.84
6***
0.10
42.
745*
**1.
190*
**1.
058*
**3.
933*
**1.
811*
**
1j t
0.28
3**
-0.3
380.
198
0.54
1***
0.40
2*0.
652*
**0.
655*
**-0
.116
0.42
4***
1actual
t0.
134*
**-0
.063
0.02
10.
073
-0.1
050.
003
-0.0
12-0
.020
-0.7
66
1oil
tp0.
012*
*-0
.000
-0.0
15-0
.002
-0.0
170.
000
-0.0
04-0
.008
0.00
6
1food
tp-0
.001
0.00
0-0
.001
-0.0
01-0
.004
-0.0
010.
000
0.00
2-0
.001
2j t
0.36
7***
-0.1
49
2actual
t0.
027
0.03
7
2oil
tp0.
001
0.01
0
2food
tp0.
001
0.00
7
Not
e: Pr
e-cr
isis s
ampl
e Ju
ly 2
004
to A
ugus
t 200
8, L
ehm
an sa
mpl
e Se
ptem
ber 2
008
to A
pril
2010
and
Eur
o cr
isis s
ampl
e M
ay 2
010
to S
epte
mbe
r 20
13. *
/**/
***
deno
tes s
igni
fican
ce a
t the
10/
5/1
perc
ent l
evel
. Opt
imal
lag
leng
th a
s rep
orte
d in
Tab
le 3
.

Inflation Expectations, Central Bank Credibility and the Global Financial Crisis 85
Swiss Journal of Economics and Statistics, 2014, Vol. 150 (2)
References
Beechey, Meredith, Benjamin Johannsen, and Andrew Levin (2011), “Are Long-Run Inflation Expectations Anchored more Firmly in the Euro Area than in the United States?”, American Economic Journal: Macroeconomics, 3 (April), pp. 104–129.
Blinder, Alan (2000), “Central-Bank Credibility: Why Do We Care? How Do We Build It?”, American Economic Review, 90(5), pp. 1421–1431.
Clark, Todd, and Troy Davig (2008), “An Empirical Assessment of the Rela-tionships among Inflation and Short- and Long-Term Expectations”, Federal Reserve Bank of Kansas City Research Working Paper No. 08-05, November.
Clark, Todd, and Troy Davig (2011), “Decomposing the Declining Volatil-ity of Long-Term Inflation Expectations”, Journal of Economic Dynamics & Control, 35, pp. 981–999.
Clark, Todd, and Taisuke Nakata (2008), “Has the Behaviour of Inflation and Long-Term Inflation Expectations Changed?”, Federal Reserve Bank of Kansas City Economic Review, First Quarter, pp. 17–50.
Fischer, Stanley (1994), “Modern Central Banking”, in The Future of Cen-tral Banking, Forrest Capie, Charles Goodhart, Stanley Fischer and Norbert Schnadt, eds., pp. 262–304, Cambridge: Cambridge University Press.
Gefang, Deborah, Gary Koop, and Simon Potter (2011), “The Dynamics of UK and US Inflation Expectations”, Strathclyde Discussion Papers in Eco-nomics No. 11–20.
Galati, Gabriele, Steven Poelhekke, and Chen Zhou (2011), “Did the Crisis Affect Inflation Expectations?”, International Journal of Central Bank-ing, 7(1), pp. 167–207.
Gerlach-Kristen, Petra, Peter Hördahl, and Richhild Moessner (2011), “Inflation Expectations and the Great Recession”, BIS Quarterly Review, March, pp. 39–51.
Guidolin, Massimo, and Christopher Neely (2010), “The Effects of Large-Scale Asset Purchases on TIPS Inflation Expectations”, Federal Reserve Bank of St. Louis National Economic Trends, September, 1.
Gürkaynak, Refet, Andrew Levin, and Eric Swanson (2006), “Does Infla-tion Targeting Anchor Long-Run Inflation Expectations? Evidence from Long-Term Bond Yields in the US, UK, and Sweden”, CEPR Working Paper No. 5806.
Hofmann, Boris, and Feng Zhu (2013), “Central Bank Asset Purchases and Inflation Expectations”, BIS Quarterly Review, March, 23–35.

86 Gerlach-Kristen / Moessner
Swiss Journal of Economics and Statistics, 2014, Vol. 150 (2)
Kozicki, Sharon, Eric Santor, and Lena Suchanek (2011), “Unconventional Monetary Policy: The International Experience with Central Bank Asset Pur-chases”, Bank of Canada Review, Spring, pp. 13–25.
Leduc, Sylvain, Keith Sill, and Tom Stark (2007), “Self-Fulfilling Expecta-tions and the Inflation of the 1970s: Evidence from the Livingston Survey”, Journal of Monetary Economics, 54, pp. 433–459.
Levin, Andrew, Fabio Natalucci, and Jeremy Piger (2004), “The Macro-economic Effects of Inflation Targeting”, Federal Reserve Bank of St. Louis Review, July/August, 86(4), pp. 51–80.
Mehra, Yash, and Christopher Herrington (2008), “On the Sources of Movements in Inflation Expectations: A Few Insights from a VAR Model”, Federal Reserve Bank of Richmond Economic Quarterly, 94(2), Spring, pp. 121–146.
Moessner, Richhild (2013), “Reactions of Real Yields and Inflation Expec-tations to Forward Guidance in the United States”, DNB Working Paper No. 398.
Söderlind, Paul (2011), “Inflation Risk Premia and Survey Evidence on Mac-roeconomic Uncertainty”, International Journal of Central Banking, 7(2), pp. 113–133.
Trehan, Bharat (2006), “Inflation Targets and Inflation Expectations: Some Evidence from the Recent Oil Shocks”, FRBSF Economic Letter No. 2006-22, September 1.
Van Duyne, Carl (1982), “Food Prices, Expectations, and Inflation”, American Journal of Agricultural Economics, 64 (3), pp. 419–430.
Wright, Jonathan (2011), “What does monetary policy do to long-term inter-est rates at the zero lower bound?”, NBER Working Paper No. 17154.
Yellen, Janet (2013), Remarks at panel discussion on “Monetary Policy: Many Targets, Many Instruments. Where Do We Stand?” at a conference sponsored by the International Monetary Fund on “Rethinking Macro Policy II”, Wash-ington, D.C., April 16.
SUMMARY
Long-run inflation expectations should not respond to economic news if the central bank is seen as credibly committed to stabilising inflation. In this paper we find that since the onset of the global financial crisis, medium and long-term inflation expectations implied by inflation swaps in the euro area, United Kingdom and United States have become less responsive to actual inflation and

Inflation Expectations, Central Bank Credibility and the Global Financial Crisis 87
Swiss Journal of Economics and Statistics, 2014, Vol. 150 (2)
changes in oil and food prices. This suggests that the credibility of the central banks in these economies remains intact, despite large increases in their balance sheets due to unconventional monetary policy measures and the introduction of explicit forward guidance at the zero lower bound. We also find an increase in autocorrelation of inflation expectations, which suggests that shocks have a longer-lasting impact than before the financial crisis.