Embed Size (px)
Citation preview
PRECLINICAL STUDY
Inflammatory breast cancer (IBC): clues for targeted therapies
Sandra V. Fernandez • Fredika M. Robertson • Jianming Pei • Lucy Aburto-Chumpitaz •
Zhaomei Mu • Khoi Chu • R. K. Alpaugh • Yong Huang • Yu Cao •
Zaiming Ye • Kathy Q. Cai • Kimberly M. Boley • Andres J. Klein-Szanto •
Karthik Devarajan • Sankar Addya • Massimo Cristofanilli
Received: 23 April 2013 / Accepted: 6 June 2013 / Published online: 21 June 2013
� The Author(s) 2013. This article is published with open access at Springerlink.com
Abstract Inflammatory breast cancer (IBC) is the most
aggressive type of advanced breast cancer characterized by
rapid proliferation, early metastatic development and poor
prognosis. Since there are few preclinical models of IBC,
there is a general lack of understanding of the complexity
of the disease. Recently, we have developed a new model
of IBC derived from the pleural effusion of a woman with
metastatic secondary IBC. FC-IBC02 cells are triple neg-
ative and form clusters (mammospheres) in suspension that
are strongly positive for E-cadherin, b-catenin and
TSPAN24, all adhesion molecules that play an important
role in cell migration and invasion. FC-IBC02 cells
expressed stem cell markers and some, but not all of the
characteristics of cells undergoing epithelial mesenchymal
transition (EMT). Breast tumor FC-IBC02 xenografts
developed quickly in SCID mice with the presence of
tumor emboli and the development of lymph node and lung
metastases. Remarkably, FC-IBC02 cells were able to
produce brain metastasis in mice on intracardiac or intra-
peritoneal injections. Genomic studies of FC-IBC02 and
other IBC cell lines showed that IBC cells had important
amplification of 8q24 where MYC, ATAD2 and the focal
adhesion kinase FAK1 are located. MYC and ATAD2
showed between 2.5 and 7 copies in IBC cells. FAK1,
which plays important roles in anoikis resistance and tumor
metastasis, showed 6–4 copies in IBC cells. Also, CD44
was amplified in triple-negative IBC cells (10–3 copies).
Additionally, FC-IBC02 showed amplification of ALK and
NOTCH3. These results indicate that MYC, ATAD2,
CD44, NOTCH3, ALK and/or FAK1 may be used as
potential targeted therapies against IBC.
Keywords CD44 � NOTCH3 � MYC � ATAD2 � ALK �FAK1/PTK2Electronic supplementary material The online version of this
article (doi:10.1007/s10549-013-2600-4) contains supplementarymaterial, which is available to authorized users.
S. V. Fernandez � J. Pei � L. Aburto-Chumpitaz � Z. Mu �R. K. Alpaugh � Y. Cao � K. Q. Cai � A. J. Klein-Szanto �K. Devarajan � M. Cristofanilli
Fox Chase Cancer Center, Philadelphia, PA 19111, USA
Present Address:
S. V. Fernandez � Z. Mu � M. Cristofanilli
Department of Medical Oncology, Kimmel Cancer Center,
Thomas Jefferson University, Philadelphia, PA 19107, USA
S. V. Fernandez (&)
Thomas Jefferson University, 233 South 10th St., 1002 BLSB,
Philadelphia, PA 19107, USA
e-mail: [email protected]
F. M. Robertson � K. Chu � Z. Ye � K. M. Boley
University of Texas M.D. Anderson Cancer Center, Houston,
TX 77030, USA
Y. Huang
Section of Gastroenterology, Department of Medicine,
University of Chicago, Chicago, IL 60637, USA
S. Addya
Jefferson Genomics Laboratory, Kimmel Cancer Center, Thomas
Jefferson University, Philadelphia, PA 19107, USA
M. Cristofanilli (&)
Thomas Jefferson University, 1025 Walnut St., Philadelphia,
PA 19107, USA
e-mail: [email protected]
123
Breast Cancer Res Treat (2013) 140:23–33
DOI 10.1007/s10549-013-2600-4

Introduction
Inflammatory breast cancer (IBC) is a very aggressive type of
advanced breast cancer with a poor prognosis. IBC patients
often develop metastasis in brain, bones and soft tissue with
variable frequency, being the most aggressive features
described in triple-negative (TN) IBC. Although IBC
accounts for 1–6 % of all breast cancer cases in the USA and
up to 20 % of all breast cancers globally [1], its incidence is
dramatically increasing [2, 3]. Due to its propensity to rapidly
metastasize, IBC is responsible for a disproportionate number
of breast cancer-related deaths [1]. Approximately, 30 % of
IBC patients have distant metastases at the time of diagnosis,
in contrast to 5 % of patients with non-IBC breast cancers.
IBC occurs commonly in patients under the age of 50 years
and since it does not present as a lump is often misdiagnosed as
an infection [4]. The clinical symptoms of IBC are very dis-
tinct from other types of breast cancer and involve the rapid
onset of changes in the skin overlying the breast, including
edema, redness and swelling, exhibiting a wrinkled and
orange-peel appearance of the skin defined as peau d’orange
[5]. This peculiar presentation that mimics an inflammation is
associated with the invasion of aggregates of tumor cells,
defined as tumor emboli into the dermal lymphatics, causing
an obstruction of the lymph channels [6]. IBC tumor emboli
are non-adherent cell clusters that rapidly spread by a con-
tinuous passive dissemination [7], thus favoring both distal
metastasis and local recurrence. Although IBC, like non-IBC
breast cancers, is a heterogeneous disease and can occur as any
of the five molecular subtypes, they are most commonly either
ErbB2 overexpressing or triple negative [8].
Few models are currently available to evaluate the peculiar
biology of IBC and improve our understanding of the factors
associated with early activation of the metastatic process in this
disease. The majority of the IBC studies have been performed
using the cell lines SUM149 and SUM190 [9]. SUM149 cells
are triple negative and SUM190 cells are ER/PR negative and
ErbB2 positive [10–13]. Other less studied IBC cell lines are
MDA-IBC3, KPL4 and WIBC-9—all ER/PR-negative,
ErbB2-positive—and the triple-negative Mary-X xenografts
[14–18]. In this work, we report the isolation and character-
ization of a new human triple-negative IBC model, FC-IBC02.
Genomic and expression studies were performed in FC-IBC02
and other IBC cell lines to understand the metastatic process of
IBC and determine putative targets for therapy.
Materials and methods
IBC cells and FC-IBC02 breast tumor xenografts
Tumor cells from pleural effusion of IBC patients were grown
under non-adherent conditions [19] for a minimum of 14 days
and then expanded under adherent conditions. As FC-IBC02,
FC-IBC01 (triple negative) [20] and KMO-015 (ER negative,
PR negative, ErbB2 positive) were also established in our
laboratory. All the cell lines used in these studies were certi-
fied by ATCC using (short tandem repeat) profiling.
The tumorigenesis and metastatic capacities of the FC-
IBC02 cells were tested in 35- to 40-day-old female SCID mice.
After 14 passages, FC-IBC02 cells (105 or 106 cells) were
suspended in 150 ll PBS, mixed with 150 ll Matrigel (BD
Biosciences, Bedford, MA) and injected into the fourth left
inguinal mammary fat pad of SCID mice. Breast tumors and
other organs (lungs, heart, liver, spleen, brain, ovaries, kidneys
and lymph nodes) were removed, fixed in 10 % neutral buffered
formalin and paraffin embedded for histological examination.
Chromosomal and gene expression analyses
The Affymetrix CytoScanTM HD arrays were used to study
copy number and loss of heterozygosity (LOH). The intensities
of probe hybridization were analyzed by Affymetrix software’s
Command Console, and the copy number and genotyping
analyses were performed using Affymetrix Chromosome
Analysis Suite software with the default settings. Gene
expression studies were performed using Affymetrix U133 Plus
2.0 human oligonucleotide microarrays. We evaluated array
quality using GCOS, dChip software [21] and R-Bioconductor
‘‘affy’’ package [22]. We calculated the intensities of probe sets
using robust multi-chip average algorithm [23]. To identify
differentially expressed genes, we conducted two-group com-
parison using significance analysis of microarrays [24]. Only
genes with small false discovery rate (FDR B 0.001) and fold
change[fourfold were considered for the analysis.
FAK1/PTK2 protein expression studies
To quantify activated (phosphorylated) and total FAK1 (also
known as PTK2 or FAK), the FAK FACE (Fast Activated
Cell-based ELISA; Active Motif) assays were used. Cells
were grown on 96 well plates and incubated with a primary
antibody that recognized either phosphorylated FAK1
(Y397) or total FAK1. Subsequently, cells were incubated
with a secondary HRP-conjugated antibody and developing
solution and the reaction was quantified by colorimetric
readout (OD450). The relative number of cells in each well
was then determined through use of crystal violet.
Results
FC-IBC02 cell line and breast tumor xenografts
FC-IBC02 was established from the pleural effusion from a
49-year-old Caucasian woman who had developed
24 Breast Cancer Res Treat (2013) 140:23–33
123
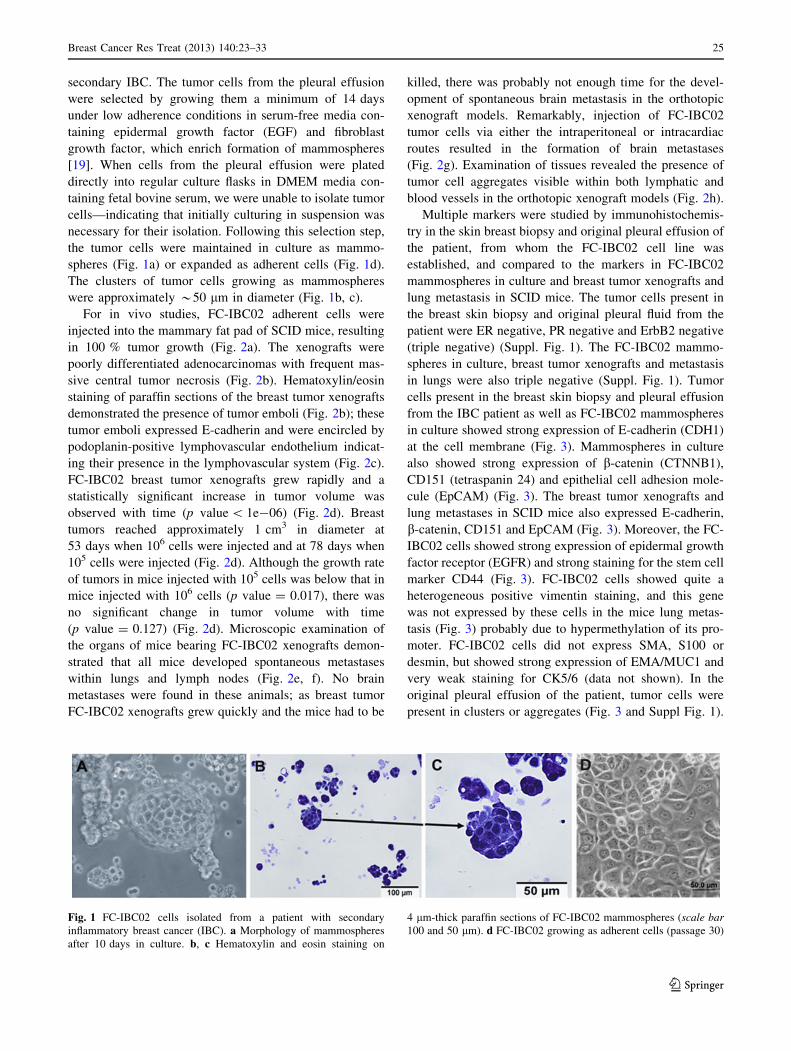
secondary IBC. The tumor cells from the pleural effusion
were selected by growing them a minimum of 14 days
under low adherence conditions in serum-free media con-
taining epidermal growth factor (EGF) and fibroblast
growth factor, which enrich formation of mammospheres
[19]. When cells from the pleural effusion were plated
directly into regular culture flasks in DMEM media con-
taining fetal bovine serum, we were unable to isolate tumor
cells—indicating that initially culturing in suspension was
necessary for their isolation. Following this selection step,
the tumor cells were maintained in culture as mammo-
spheres (Fig. 1a) or expanded as adherent cells (Fig. 1d).
The clusters of tumor cells growing as mammospheres
were approximately *50 lm in diameter (Fig. 1b, c).
For in vivo studies, FC-IBC02 adherent cells were
injected into the mammary fat pad of SCID mice, resulting
in 100 % tumor growth (Fig. 2a). The xenografts were
poorly differentiated adenocarcinomas with frequent mas-
sive central tumor necrosis (Fig. 2b). Hematoxylin/eosin
staining of paraffin sections of the breast tumor xenografts
demonstrated the presence of tumor emboli (Fig. 2b); these
tumor emboli expressed E-cadherin and were encircled by
podoplanin-positive lymphovascular endothelium indicat-
ing their presence in the lymphovascular system (Fig. 2c).
FC-IBC02 breast tumor xenografts grew rapidly and a
statistically significant increase in tumor volume was
observed with time (p value \ 1e-06) (Fig. 2d). Breast
tumors reached approximately 1 cm3 in diameter at
53 days when 106 cells were injected and at 78 days when
105 cells were injected (Fig. 2d). Although the growth rate
of tumors in mice injected with 105 cells was below that in
mice injected with 106 cells (p value = 0.017), there was
no significant change in tumor volume with time
(p value = 0.127) (Fig. 2d). Microscopic examination of
the organs of mice bearing FC-IBC02 xenografts demon-
strated that all mice developed spontaneous metastases
within lungs and lymph nodes (Fig. 2e, f). No brain
metastases were found in these animals; as breast tumor
FC-IBC02 xenografts grew quickly and the mice had to be
killed, there was probably not enough time for the devel-
opment of spontaneous brain metastasis in the orthotopic
xenograft models. Remarkably, injection of FC-IBC02
tumor cells via either the intraperitoneal or intracardiac
routes resulted in the formation of brain metastases
(Fig. 2g). Examination of tissues revealed the presence of
tumor cell aggregates visible within both lymphatic and
blood vessels in the orthotopic xenograft models (Fig. 2h).
Multiple markers were studied by immunohistochemis-
try in the skin breast biopsy and original pleural effusion of
the patient, from whom the FC-IBC02 cell line was
established, and compared to the markers in FC-IBC02
mammospheres in culture and breast tumor xenografts and
lung metastasis in SCID mice. The tumor cells present in
the breast skin biopsy and original pleural fluid from the
patient were ER negative, PR negative and ErbB2 negative
(triple negative) (Suppl. Fig. 1). The FC-IBC02 mammo-
spheres in culture, breast tumor xenografts and metastasis
in lungs were also triple negative (Suppl. Fig. 1). Tumor
cells present in the breast skin biopsy and pleural effusion
from the IBC patient as well as FC-IBC02 mammospheres
in culture showed strong expression of E-cadherin (CDH1)
at the cell membrane (Fig. 3). Mammospheres in culture
also showed strong expression of b-catenin (CTNNB1),
CD151 (tetraspanin 24) and epithelial cell adhesion mole-
cule (EpCAM) (Fig. 3). The breast tumor xenografts and
lung metastases in SCID mice also expressed E-cadherin,
b-catenin, CD151 and EpCAM (Fig. 3). Moreover, the FC-
IBC02 cells showed strong expression of epidermal growth
factor receptor (EGFR) and strong staining for the stem cell
marker CD44 (Fig. 3). FC-IBC02 cells showed quite a
heterogeneous positive vimentin staining, and this gene
was not expressed by these cells in the mice lung metas-
tasis (Fig. 3) probably due to hypermethylation of its pro-
moter. FC-IBC02 cells did not express SMA, S100 or
desmin, but showed strong expression of EMA/MUC1 and
very weak staining for CK5/6 (data not shown). In the
original pleural effusion of the patient, tumor cells were
present in clusters or aggregates (Fig. 3 and Suppl Fig. 1).
Fig. 1 FC-IBC02 cells isolated from a patient with secondary
inflammatory breast cancer (IBC). a Morphology of mammospheres
after 10 days in culture. b, c Hematoxylin and eosin staining on
4 lm-thick paraffin sections of FC-IBC02 mammospheres (scale bar
100 and 50 lm). d FC-IBC02 growing as adherent cells (passage 30)
Breast Cancer Res Treat (2013) 140:23–33 25
123

Copy number and loss of heterozygosity (LOH)
in FC-IBC02 and other IBC cells
High-resolution arrays were used to evaluate copy number
and LOH in FC-IBC02 cells and other triple-negative (Mary
X, SUM149, FC-IBC01) and ErbB2-positive (MDA-IBC3,
SUM190, KPL4, KMO-015) IBC cell lines. Also, non-IBC
cells (MFC-7, MDA-MB231, MDA-MB468, SUM159) were
included in these studies to compare the profiles between IBC
and non-IBC cells. FC-IBC02 cells showed complicated
genomic alterations in all chromosomes with the exception of
chromosome 12 (Suppl. Fig. 2). Gains/amplifications were
more common than deletions/losses; FC-IBC02 cells showed
scattered genomic profile (deletions) on 11q chromosome arm
known as chromothripsis; the copy number profile across this
chromosome arm shows many positions at which copy num-
ber changes between one or two copies (Suppl. Fig. 2). Copy
number and LOH studies were also performed for Mary X
(Suppl. Fig. 3), SUM149 (Suppl. Fig. 4) and FC-IBC01
(Suppl. Fig. 5). Most of the IBC cells showed multiple
amplifications of 8q having 3–10 copies of this chromosomal
arm (Fig. 4). The 8q is the location of the oncogene MYC,
MTDH1, PVT1, FAK1 (also known as PTK2K) and ATAD2
between other genes. In contrast, the non-IBC cell lines
studied showed only 1–4 copies of 8q (Fig. 4). IBC cells
showed 2.5–7 copies of the oncogene MYC and, although
MYC was also amplified in non-IBC cells, the number of
copies was lower in non-IBC (1–3 copies) with the exception
of SUM159 cells that have a focal MYC amplification
(Table 1). PTK2/FAK1 also showed more copies in IBC
(2.5–7 copies) than in non-IBC cells (1–2.5 copies) (Table 1).
Metadherin (MTDH1) showed 2.5–6 copies in IBC and 1–3
copies in non-IBC cell lines; ATAD2 showed 2.5–6 copies in
IBC and 1–3.5 copies in non-IBC (Table 1). CD44 located in
11p13 showed eight copies in FC-IBC02, ten copies in the
triple-negative IBC cells FC-IBC01 and three copies in
SUM149; CD44 showed 1–2 copies in the ErbB2 ? IBC and
non-IBC, except MDA-MB468 (4.5 copies). Additionally,
FC-IBC02 cells showed 3.5–4 copies of anaplastic lymphoma
kinase (ALK) gene on chromosome 2p23.2 (Table 1).
Fig. 2 Breast tumor xenograft and metastases in mice. a Breast
tumor xenograft in SCID mouse injected with 106 FC-IBC02 cells.
b Hematoxylin/eosin staining of breast tumor FC-IBC02 xenograft
with tumor emboli. c FC-IBC02 tumor emboli express E-cadherin
(green) and are encircled by podoplanin-positive (red) lymphovas-
cular endothelium. d Growth curves of FC-IBC02 breast tumor
xenografts after injection of 106 (line in red) or 105 cells (line in
black). The growth curves represent the average growth of the breast
tumors in five animals per group. Tumor volume measurements were
obtained at baseline (Day 0) and at pre-determined time points
(measured in days) for each mouse in each group (105 vs. 106 tumor
cells injected). e Lung metastasis by orthotopic injection (409
magnification), f lymph node metastasis by orthotopic injection (409
magnification), g brain metastasis after intraperitoneal injection (409
magnification), h cluster of tumor cells within a blood vessel (409
magnification)
26 Breast Cancer Res Treat (2013) 140:23–33
123

Expression studies of IBC cells
Gene expression studies were performed in IBC triple-neg-
ative cells (FC-IBC02, SUM149) and compared to IBC
ErbB2-positive (MDA-IBC3, SUM190) and non-IBC triple-
negative cells (MDA-MB231 and MDA-MB468). The
microarray data have been deposited into the NCBI’s gene
expression omnibus (GEO) datasets (GSE40464). Hierar-
chical clustering of cell lines based on global gene expres-
sion showed two cell clusters (Fig. 5) in which FC-IBC02
Fig. 3 Expression of E-cadherin and other adhesion molecules by
FC-IBC02. The FC-IBC02 mammospheres express E-cadherin, b-
catenin, CD151 (tetraspanin 24) and EpCAM. Also, these cells are
positive for CD44, EGFR (epidermal growth factor receptor) and
vimentin. Breast skin biopsy and pleural effusion of the IBC patient,
mammospheres in culture, breast tumor xenografts and lungs
metastasis in mice are shown for these markers, 209 magnification
Breast Cancer Res Treat (2013) 140:23–33 27
123

(mammospheres and adherent cells) clustered together with
MDA-MB231 and SUM149, both from the basal B subtype.
The second cluster included the triple-negative cell line
MDA-MB468 from basal A subtype and the ErbB2-positive
IBC cell lines MDA-IBC3 and SUM190 (Fig. 5). The gene
expression profiles of FC-IBC02 mammospheres and
adherent cells were very similar and only few genes showed
significant differences between them.
By flow cytometry analyses, FC-IBC02 showed a sub-
population of cells with stem cell characteristics CD44?/
CD24low/CD34? and the number of stem cells was higher
in cells growing as mammospheres (15.6 %) than adherent
(9.66 %) (Suppl. Figs. 6A and 6B); from these subpopu-
lations of stem cells, higher number of CD133? cells were
seen in mammospheres (20.5 %) than adherent cells
(9.47 %) (Suppl. Figs. 6C, 6D). FC-IBC02 also expressed
Fig. 4 Chromosome 8 in IBC and non-IBC cells. Copy number and loss of heterozygosity (LOH) were studied using Affymetrix CytoScanTM
HD arrays. The chromosome 8 in different IBC and non-IBC cells is shown
28 Breast Cancer Res Treat (2013) 140:23–33
123

Ta
ble
1C
op
yn
um
ber
of
som
eam
pli
fied
gen
esin
IBC
and
no
n-I
BC
cell
s
Lo
cati
on
Gen
eG
ene
des
crip
tio
nC
op
yn
um
ber
IBC
No
n-I
BC
Tri
ple
neg
ativ
eE
R(-
)P
R(-
)E
rbB
2?
ER
(?)
Tri
ple
neg
ativ
e
FC
-
IBC
02
Mar
yX
SU
M
14
9
FC
-
IBC
01
MD
-
IBC
3
SU
M
19
0
KP
L4
KM
O-0
15
MC
F-7
MD
A-
MB
-23
1
MD
A-
MB
-46
8
SU
M-
15
9
2p
23
.2A
LK
An
apla
stic
lym
ph
om
a
kin
ase,
rece
pto
r
tyro
sin
ek
inas
e
(on
cog
ene)
3.5
–4
31
.5U
PD
31
33
hm
z2
mo
sU
PD
32
4q
11
c-K
IT(C
D1
17
)R
ecep
tor
tyro
sin
ek
inas
e
(on
cog
ene)
UP
DU
PD
11
UP
D6
hm
z1
.83
1m
os
UP
D1
2
7p
12
EG
FR
Ep
ider
mal
Gro
wth
Fac
tor
Rec
epto
r
2.5
–3
2.5
2.5
–3
mo
sU
PD
14
33
UP
Dm
os
UP
D9
UP
D
8p
11
.22
FG
FR
1F
ibro
bla
stG
row
thF
acto
r
Rec
epto
r1
32
\2
11
1.5
22
.5h
mz
11
12
8q
24
.21
MY
CM
YC
(on
cog
ene)
7h
mz
4–
5h
mz
2.5
42
.52
.54
73
2.5
hm
z1
\1
0
8q
24
.3P
TK
2/F
AK
1F
oca
lad
hes
ion
kin
ase
16
hm
z6
hm
z2
.54
2.5
2.5
4h
mz
72
.52
.5h
mz
12
8q
24
.13
AT
AD
2A
TP
ase
fam
ily
,co
fact
or
for
MY
C
64
.52
.54
.53
.52
.54
hm
z5
hm
z3
.53
12
8q
22
.1M
TD
H1
Met
adh
erin
(on
cog
ene)
64
.52
.54
.5h
mz
3.5
43
.54
.5h
mz
3U
PD
12
8q
24
.21
PV
T1
PV
T1
(on
cog
ene)
75
2.5
53
2.5
10
hm
z6
3.5
31
10
9q
34
.3N
otc
hl
No
tch
12
.52
22
.53
26
12
32
2
19
p1
3N
otc
h3
No
tch
35
–6
hm
zU
PD
2.5
22
.5h
mz
22
22
23
2
11
p1
3C
D4
4C
D4
48
UP
D3
10
hm
z1
12
11
24
.52
17
pT
P5
3P
53
(tu
mo
rsu
pp
ress
or)
1U
PD
2.5
hm
z1
11
UP
D1
1U
PD
11
Hm
zh
om
ozy
go
us,
UP
Du
nip
aren
tal
dis
om
y(t
wo
cop
ies
wit
hL
OH
),m
os
mo
saic
Breast Cancer Res Treat (2013) 140:23–33 29
123

the stem cell markers nestin (NES), ALDH1A3 and high
levels of KIT (Fig. 6a). FC-IBC02 showed some charac-
teristics of cells undergoing epithelial–mesenchymal tran-
sition (EMT) such as low expression of fibronectin (FN1)
and high expression of vimentin (VIM), although these
cells expressed genes associated with retention of an epi-
thelial phenotype including E-cadherin (CDH1) and Ep-
CAM (Fig. 3, 6a). All the IBC cell lines expressed low
levels of ZEB1 when compared with ZEB1 expression in
MDA-MB231; low levels of ZEB1, which is an E-cadherin
transcriptional repressor, would explain the expression of
E-cadherin in IBC cells (Fig. 6a). Interestingly,
expressions of the transcription factors TWIST1 and SNAI2
which are inducers of EMT were high in FC-IBC02 cells
(Fig. 6a).
Several genes from the Notch signaling pathway such as
NOTCH2, NOTCH3, HEY1, HEY2, JAG1 and JAG2 were
upregulated in FC-IBC02 (mammospheres and adherent
cells) (Fig. 6b). FC-IBC02 cells expressed high levels of
the oncogenes MYCL1, MYB, MYCN and ATAD2
(Fig. 6c). MYC expression was higher in the triple-negative
IBC cell lines (FC-IBC02 and SUM149) compared to the
triple-negative non-IBC cells (MDA-MB231 and MDA-
MB468) and the ErbB2 ? IBC cells (MDA-IBC3 and
Fig. 5 Clustering of IBC and non-IBC cell lines by gene expression
profile. A total of 6,575 probe sets passing the criterion of SD
(standard deviation) [0.9 and \2 were used in unsupervised
hierarchical clustering of samples. The molecular subtypes of the
cells used in these studies are described on the right, also ER
(estrogen receptor alpha), PR (progesterone receptor) and ErbB2
status of the cell lines are described. FC-IBC02 mammospheres (FC-
IBC02 m) and adherent cells (FC-IBC02adh) showed very similar
profiles. The triple-negative cell lines FC-IBC02 and SUM149
clustered together with the triple-negative non-IBC MDA-MB231
Fig. 6 Heat maps of the selected marker genes in IBC and non-IBC
cells. a Epithelial–mesenchymal transition (EMT) and stem cell
markers, b genes involved in Notch signaling pathway and c other
selected marker genes are displayed. Red, yellow or blue colors
represent expression levels above, at or below the mean level across
samples
30 Breast Cancer Res Treat (2013) 140:23–33
123

SUM190). All the cells showed ALK (anaplastic lymphoma
kinase) expression, although its expression was slightly
higher in SUM149 and FC-IBC02 mammospheres
(Fig. 6c). PTK2/FAK1 showed higher expression in the
IBC cell lines FC-IBC02 and SUM190 and its expression
was higher in FC-IBC02 mammospheres compared to
adherent cells (Fig. 6c). Total and phosphorylated PTK2/
FAK1 protein expression was studied in different IBC cells
and all showed phosphorylated PTK2/FAK1 (Fig. 7).
Discussion
We have developed a new IBC cell line, FC-IBC02,
derived from the pleural effusion of a woman with rapidly
progressing secondary IBC. These tumor cells and xeno-
grafts in mice showed the same markers as the original
pleural effusion in the patient from whom they were iso-
lated. FC-IBC02 breast tumor xenografts grew rapidly and
all mice developed spontaneous metastases within lungs
and lymph nodes. FC-IBC02 cells were able to recapitulate
the peculiar metastatic process observed in IBC patients, as
shown by the formation of tumor emboli within lymphatics
of SCID mice. Remarkably, injection of FC-IBC02 tumor
cells via either the intraperitoneal or intracardiac routes
resulted in the formation of brain metastases.
The symptoms of IBC are caused by the invasion of
aggregates of tumor cells (tumor emboli) into the dermal
lymphatics, causing an obstruction of the lymph channels
[6]. Although, tumor emboli are also found in non-IBC
tumors, they are more frequent and high in number in IBC
[25]. Tumor emboli expressed cell–cell adhesion molecules
that maintain the tumor cells together. Approximately,
90 % of human IBCs are associated with increased
E-cadherin indicating that the gain of E-cadherin axis
contributes to the IBC phenotype [18]. FC-IBC02 cells,
breast tumor xenografts and metastatic lesions within lungs
in SCID mice showed strong expression of E-cadherin and
b-catenin in cell membranes. For most non-IBC tumors,
loss of E-cadherin and acquisition of mesenchymal phe-
notype have been associated with increased invasion and
metastatic potential, although in IBC tumor cells gained a
survival benefit from the expression of E-cadherin medi-
ating the formation of the characteristic tumor emboli.
Moreover, FC-IBC02 cells showed strong expression of the
membrane tetraspanin 24 (TSPAN24/CD151). Collec-
tively, these results demonstrate that the FC-IBC02 tumor
emboli express E-cadherin, b-catenin and TSPAN24/
CD151 suggest that these adhesion molecules may have a
functional role in maintaining the tight aggregation of cells
within the tumor emboli. The maintenance of cell–cell
adhesions allow the migration of tumor cells through the
lymphatic and blood vessels as clusters, thus supporting the
hypothesis that cohesive or collective migration may pro-
vide a survival advantage by protecting cells from immune
attack or shear forces during transit through the circulation
[26]. The presence of clusters of circulating tumor cells
(CTCs) have been observed in the blood of IBC patients
(data not shown).
The expression of epithelial markers by IBC cells is par-
adoxical to the current hypothesis that metastasis occurs as
part of the process of epithelial–mesenchymal transition
(EMT). Through the EMT process, epithelial cells lose cell–
cell contact and cell polarity, downregulate epithelial-asso-
ciated genes and acquire a mesenchymal phenotype; this
cellular process culminates with single cells having
increased motility, invasiveness and metastatic capacity.
FC-IBC02 cells showed some, but not all the characteristic
expression patterns of EMT; these cells expressed vimentin
(VIM) and the EMT-transcription factors SNAI2 and
TWIST1, although they showed strong expression of the
epithelial markers EpCAM, MUC1 and E-cadherin. It has
been suggested that SNAI2 and TWIST1 are probably
responsible for maintaining the stem cell state rather than
inducing mesenchymal marker expression [27, 28]. Recent
studies suggest that EMT is not a pre-requisite for tumor cell
invasion and cells can move in a collective manner depen-
dent on maintenance of cell–cell adhesion molecules [29].
At the genomic level, FC-IBC02 cells and other IBC
cells showed extensive chromosomal copy number changes
indicating a higher degree of genomic instability in IBC
that is in agreement with their high grade. NOTCH3 was
amplified in FC-IBC02, and several genes from the Notch
signalling pathway were upregulated in this cell line.
Recently, it was shown that Notch 3 was also activated in
Mary X [30]. Furthermore, IBC cells showed amplification
of the 8q chromosomal arm where the oncogene MYC and
Fig. 7 Expression of total and phospho-FAK1 (Y397) in IBC cell
lines. FAK1 protein expression was studied in the triple-negative IBC
cell lines FC-IBC02 and SUM149, and ErbB2-positive IBC cell lines
SUM190 and KMO-015. Data were plotted after correction of cell
number
Breast Cancer Res Treat (2013) 140:23–33 31
123

ATAD2, a cofactor for MYC, are located. MYC showed
2.5–7 copies in IBC cells. MYC amplification is one of the
most consistent markers of adverse prognosis for cancer
and is more often amplified in IBC than non-IBC tumors
[31]. MYC expression was higher in the triple-negative
IBC cell lines FC-IBC02 and SUM149 when compared
with the triple-negative non-IBC MDA-MB-231 and
MDA-MB468, and the ErbB2 ? IBC cells SUM190 and
MDA-IBC3. MYC has a large number of targeted genes
and it upregulates genes involved in cell growth and pro-
liferation [32]. ATAD2 was amplified and upregulated in
FC-IBC02; it was shown that this gene is usually overex-
pressed and amplified in aggressive tumors [33]. ATAD2
associates through its bromodomain (BRD) with histone
H3 acetylated at Lys 14 during late mitosis, regulating the
expression of genes required for cell cycle progression
[33]; recently, specific inhibitors to BRD-containing pro-
teins have been developed [34–36]. Targeting ATAD2
through the use of specific inhibitors to its BRD domain
will be useful as therapeutic targets in MYC-driven tumors.
Metadherin (MTDH), a gene related to anoikis resis-
tance, located at 8q, was also amplified and upregulated in
FC-IBC02 cells. Anchorage-independent survival or anoi-
kis resistance is characteristic of tumor cells and contrib-
utes to metastasis [37]. All tumor cells that eventually form
metastases at distant sites must survive in circulation and
then in metastatic organs, and all of these microenviron-
ments are quite distinct from that of the breast. The ability
of tumor cells to survive in these altered matrix conditions
is known as anoikis resistance (adhesion-independent
growth) and is in contrast to normal epithelial cells, which
undergo cell death (anoikis) when deprived of signals from
the normal extracellular matrix [37]. MTDH functions as a
downstream mediator of the transforming activity of
oncogenic Ha-Ras and c-MYC and promotes lung, bone
and brain metastasis [38]. Interestingly, another gene pre-
viously reported to contribute to metastasis via regulation
of anoikis resistance is the focal adhesion kinase FAK1 (or
PTK2) [37], which shows 2.5–7 copies in IBC. FAK1 is a
non-receptor tyrosine kinase that localizes to focal adhe-
sions and controls a number of cell pathways including
proliferation, viability and survival. Its overexpression was
linked to anoikis resistance [39]. FAK1 mRNA and protein
levels are absent or low in normal tissue and benign neo-
plasms, and are upregulated in invasive and metastatic
tumors [40]. Elevated FAK1 levels have been reported in
many tumors such as epithelial tumor of the breast [39].
We have studied FAK1 in the triple-negative IBC cell lines
FC-IBC02 and SUM149, and ErbB2-positive cell lines
SUM190 and KMO-015, and this protein showed to be
activated in these cells (phosphorylated in Y397). Studies
for evaluating a new dual ALK-FAK1 inhibitor in IBC
cells and xenograft models are ongoing in our laboratory.
In summary, the gene signature and phenotypic charac-
teristics of FC-IBC02 and other IBC cell lines suggest that
IBC exhibits characteristics of epithelial plasticity, where
tumor cells retain an epithelial phenotype through E-cad-
herin and EpCAM expressions, while simultaneously
expressing markers of cancer stem cells. FC-IBC02 xeno-
grafts represent an ideal model for studying spontaneous
metastases in lungs and lymph nodes and brain metastases by
the intracardiac route. Moreover, FC-IBC02 and other IBC
cells demonstrated amplification of MYC, ATAD2, CD44,
NOTCH3, ALK and FAK1 indicating that these genes could
be used as potential target therapies against IBC.
Acknowledgments This work was supported by the American
Airlines-Komen for the Cure Foundation Promise Grant KGO81287
(FMR, MC), NIH NCI 1R01 CA 138239 (MC) and the Inflammatory
Breast Cancer Foundation. We thank Maria Florencia Arisi for the
corrections of this manuscript.
Conflict of interest The authors declare that they have no conflict
of interest.
Open Access This article is distributed under the terms of the
Creative Commons Attribution Noncommercial License which per-
mits any noncommercial use, distribution, and reproduction in any
medium, provided the original author(s) and the source are credited.
References
1. Hance KW, Anderson WF, Devesa SS, Young HA, Levine PH
(2005) Trends in inflammatory breast carcinoma incidence and
survival: the surveillance, epidemiology, and end results program
at the National Cancer Institute. J Natl Cancer Inst 97:966–975
2. Chia S, Swain SM, Byrd DR, Mankoff DA (2008) Locally advanced
and inflammatory breast cancer. J Clin Oncol 26:786–790
3. Dawood S et al (2011) Differences in survival among women
with stage III inflammatory and noninflammatory locally
advanced breast cancer appear early: a large population-based
study. Cancer 117:1819–1826
4. Robertson FM et al (2010) Inflammatory breast cancer: the dis-
ease, the biology, the treatment. CA Cancer J Clin 60:351–375
5. Cristofanilli M et al (2007) Inflammatory breast cancer (IBC) and
patterns of recurrence: understanding the biology of a unique
disease. Cancer 110:1436–1444
6. Molckovsky A, Fitzgerald B, Freedman O, Heisey R, Clemons M
(2009) Approach to inflammatory breast cancer. Can Fam Phy-
sician 55:25–31
7. Alpaugh ML, Tomlinson JS, Kasraeian S, Barsky SH (2002)
Cooperative role of E-cadherin and sialyl-Lewis X/A-deficient
MUC1 in the passive dissemination of tumor emboli in inflam-
matory breast carcinoma. Oncogene 21:3631–3643
8. Bertucci F, Finetti P, Birnbaum D, Viens P (2010) Gene
expression profiling of inflammatory breast cancer. Cancer
116:2783–2793
9. Van Laere SJ et al (2006) Identification of cell-of-origin breast
tumor subtypes in inflammatory breast cancer by gene expression
profiling. Breast Cancer Res Treat 95:243–255
10. Willmarth NE, Ethier SP (2006) Autocrine and juxtacrine effects
of amphiregulin on the proliferative, invasive, and migratory
properties of normal and neoplastic human mammary epithelial
cells. J Biol Chem 281:37728–37737
32 Breast Cancer Res Treat (2013) 140:23–33
123

11. Neve RM et al (2006) A collection of breast cancer cell lines for
the study of functionally distinct cancer subtypes. Cancer Cell
10:515–527
12. Forozan F et al (1999) Molecular cytogenetic analysis of 11 new
breast cancer cell lines. Br J Cancer 81:1328–1334
13. Charafe-Jauffret E et al (2006) Gene expression profiling of
breast cell lines identifies potential new basal markers. Oncogene
25:2273–2284
14. Kurebayashi J et al (1999) Isolation and characterization of a new
human breast cancer cell line, KPL-4, expressing the Erb B
family receptors and interleukin-6. Br J Cancer 79:707–717
15. Alpaugh ML, Tomlinson JS, Shao ZM, Barsky SH (1999) A
novel human xenograft model of inflammatory breast cancer.
Cancer Res 59:5079–5084
16. Shirakawa K et al (2001) Absence of endothelial cells, central
necrosis, and fibrosis are associated with aggressive inflammatory
breast cancer. Cancer Res 61:445–451
17. Xiao Y, Ye Y, Yearsley K, Jones S, Barsky SH (2008) The
lymphovascular embolus of inflammatory breast cancer expresses
a stem cell-like phenotype. Am J Pathol 173:561–574
18. Tomlinson JS, Alpaugh ML, Barsky SH (2001) An intact over-
expressed E-cadherin/alpha, beta-catenin axis characterizes the
lymphovascular emboli of inflammatory breast carcinoma. Can-
cer Res 61:5231–5241
19. Dontu G et al (2003) In vitro propagation and transcriptional
profiling of human mammary stem/progenitor cells. Genes Dev
17:1253–1270
20. Robertson F et al (2012) Genomic profiling of pre-clinical models
of inflammatory breast cancer identifies a signature of epithelial
plasticity and suppression of TGF B signalling. J Clin Exp Pathol
2:1–11
21. Li C, Hung Wong W (2001) Model-based analysis of oligonu-
cleotide arrays: model validation, design issues and standard error
application. Genome Biol 2: RESEARCH 0032
22. Gautier L, Cope L, Bolstad BM, Irizarry RA (2004) affy–analysis
of Affymetrix GeneChip data at the probe level. Bioinformatics
20:307–315
23. Irizarry RA et al (2003) Exploration, normalization, and sum-
maries of high density oligonucleotide array probe level data.
Biostatistics 4:249–264
24. Tusher VG, Tibshirani R, Chu G (2001) Significance analysis of
microarrays applied to the ionizing radiation response. Proc Natl
Acad Sci USA 98:5116–5121
25. Lo AC et al (2009) Analysis of RhoC expression and lympho-
vascular emboli in inflammatory vs non-inflammatory breast
cancers in Egyptian patients. Breast 18:55–59
26. Friedl P, Gilmour D (2009) Collective cell migration in mor-
phogenesis, regeneration and cancer. Nat Rev Mol Cell Biol
10:445–457
27. Chui MH (2012) Insights into cancer metastasis from a clinico-
pathologic perspective: Epithelial mesenchymal transition is not a
necessary step. Int J Cancer 132(7):1487–1495
28. Mani SA et al (2008) The epithelial–mesenchymal transition
generates cells with properties of stem cells. Cell 133:704–715
29. Friedl P, Wolf K (2003) Tumour-cell invasion and migration:
diversity and escape mechanisms. Nat Rev Cancer 3:362–374
30. Xiao Y et al (2011) The lymphovascular embolus of inflamma-
tory breast cancer exhibits a Notch 3 addiction. Oncogene
30:287–300
31. Bekhouche I et al (2011) High-resolution comparative genomic
hybridization of inflammatory breast cancer and identification of
candidate genes. PLoS ONE 6:e16950
32. Eilers M, Eisenman RN (2008) Myc’s broad reach. Genes Dev
22:2755–2766
33. Ciro M et al (2009) ATAD2 is a novel cofactor for MYC,
overexpressed and amplified in aggressive tumors. Cancer Res
69:8491–8498
34. Filippakopoulos P et al (2010) Selective inhibition of BET
bromodomains. Nature 468:1067–1073
35. Muller S, Filippakopoulos P, Knapp S (2011) Bromodomains as
therapeutic targets. Expert Rev Mol Med 13:e29
36. Delmore JE et al (2011) BET bromodomain inhibition as a
therapeutic strategy to target c-Myc. Cell 146:904–917
37. Frisch SM, Screaton RA (2001) Anoikis mechanisms. Curr Opin
Cell Biol 13:555–562
38. Hu G et al (2009) MTDH activation by 8q22 genomic gain
promotes chemoresistance and metastasis of poor-prognosis
breast cancer. Cancer Cell 15:9–20
39. Gabarra-Niecko V, Schaller MD, Dunty JM (2003) FAK regu-
lates biological processes important for the pathogenesis of
cancer. Cancer Metastasis Rev 22:359–374
40. Cance WG et al (2000) Immunohistochemical analyses of focal
adhesion kinase expression in benign and malignant human breast
and colon tissues: correlation with preinvasive and invasive
phenotypes. Clin Cancer Res 6:2417–2423
Breast Cancer Res Treat (2013) 140:23–33 33
123