Embed Size (px)
Citation preview
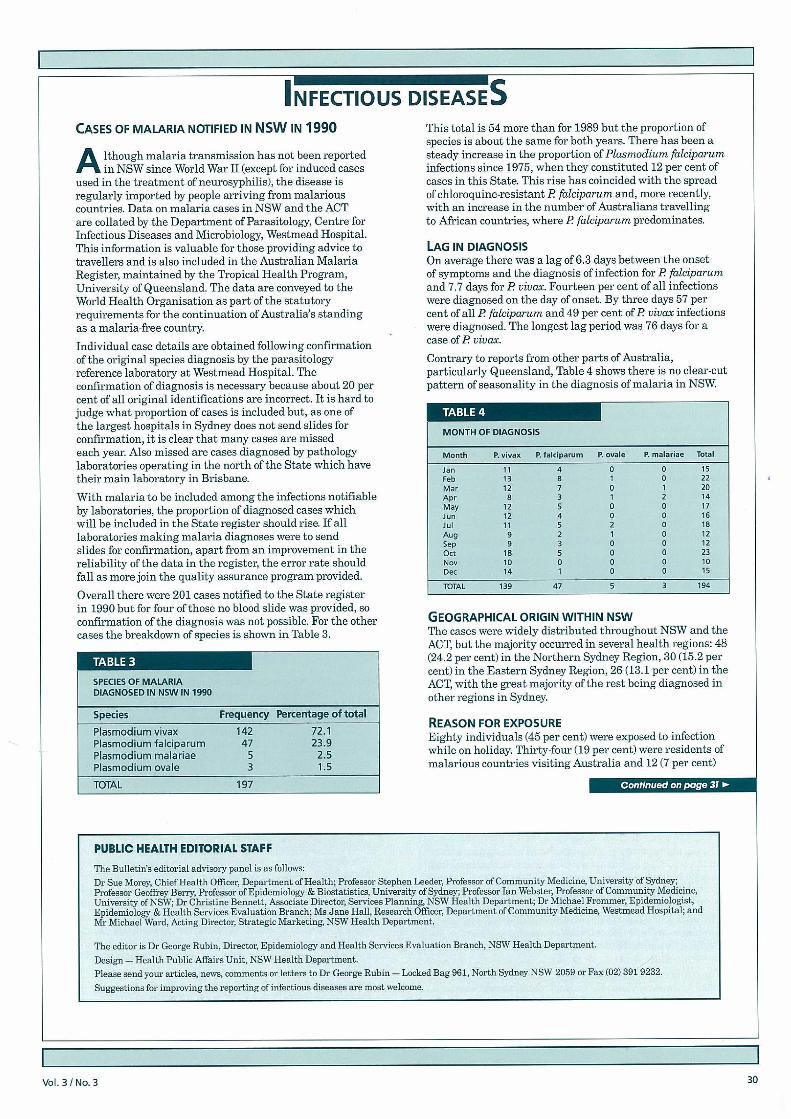
INFECTIOUS DiSEASESCASES OF MALARIA NOTIFIED IN NSW IN 1990
A lthough malaria transmission has not been reportedin NSW since World War II (except for induced cases
used in the treatment of neurosyphilis), the disease isregularly imported by people arriving from malariouscountries. Data on malaria cases in NSW and the ACTare collated by the Department of Parasitology, Centre forInfectious Diseases and Microbiology, Westmead Hospital.This information is valuable for those providing advice totravellers and is also included in the Australian MalariaRegister, maintained by the Tropical Health Program,University of Queensland. The data are conveyed to theWorld Health Organisation as part of the statutoryrequirements for the continuation of Australio?s standingas a malaria-free country.
Individual case details are obtained following confirmationof the original species diagnosis by the parasitologyreference laboratory at Westmead Hospital. Theconfirmation of diagnosis is necessary because about 20 percent of all original identifications are incorrect. It is hard tojudge what proportion of cases is included but, as one ofthe largest hospitals in Sydney does not send slides forconfirmation, it is clear that many cases are missedeach year. Also missed are cases diagnosed by pathologylaboratories operating in the north of the State which havetheir main laboratory in Brisbane.
With malaria to be included among the infections notifiableby laboratories, the proportion of diagnosed cases whichwill be included in the State register should rise. If alllaboratories making malaria diagnoses were to sendslides for confirmation, apart from an improvement in thereliability of the data in the register, the error rate shouldfall as more join the quality assurance program provided.
Overall there were 201 cases notified to the State registerin 1990 but for four of those no blood slide was provided, soconfirmation of the diagnosis was not possible. For the othercases the breakdown of species is shown in Table 3.
'p :] 1*
SPECIES OF MALARIADIAGNOSED IN NSW IN 1990
Specie5 Frequency Percentage of total
PlasmodiumvivaxPlasmodium falciparumPlasmodium malariaePlasrnodium ovale
14247
53
72i23.9
2.51.5
TOTAL 197
This total is 54 more than for 1989 but the proportion ofspecies is about the same for both years. There has been asteady increase in the proportion of Plasmodium faiciparuininfections since 1975, when they constituted 12 per cent ofcases in this State. This rise has coincided with the spreadof chloroquine-resistant P falcipanrm and, more recently,with an increase in the number of Australians travellingto African countries, where P falciparum predominates.
LAG IN DIAGNOSISOn average there was a lag of 6.3 days between the onsetof symptoms and the diagnosis of infection for P faiciparumand 7.7 days for P viva.x. Fourteen per cent of all infectionswere diagnosed on the day of onset. By three days 57 percent of all P falciparum and 49 per cent of P vivax infectionswere diagnosed. The longest lag period was 76 days for acase of P vivax.
Contrary to reports from other parts of Australia,particularly Queensland, Table 4 shows there is no clear-cutpattern of seasonality in the diagnosis of malaria in NSW.
MONTH OF DIAGNOSIS
Month P. vivax P. fIciparum P. ovals P. malsrise Total
Jan 4 0 0 15
Feb 3 8 1 0 22Mar 12 7 0 1 20
Apr 8 3 1 2 14
May 12 5 0 0 17Jun 12 4 0 0 16
Jul 11 5 2 0 10
Aug 9 2 1 0 12
Sep 9 3 0 0 12Oct 18 5 0 0 23
NOv 10 0 0 0 10
Dec 14 1 0 0 15
1DTAL 139 47 5 3 194
GEOGRAPHICAL ORIGIN WITHIN NSWThe cases were widely distributed throughout NSW and theACT, but the majority occurred in several health regions: 48(24.2 per cent) in the Northern Sydney Region, 30(15.2 percent) in the Eastern Sydney Region, 26 (13.1 per cent) in theACT, with the great majority of the rest being diagnosed inother regions in Sydney.
REASON FOR EXPOSUREEighty individuals (45 per cent) were exposed to infectionwhile on holiday. Thirty-four (19 per cent) were residents ofmalarious countries visiting Australia and 12 (7 per cent)
PUBLIC HEALTH EDITORIAL STAFF
The Bulletin's editorial advisory panel is as follows:
Dr Sue Morey, Chief Health Officer, Department of Health; Professor Stephen Leedes; Profestor of Community Medicine, University of Sydney;Professor Geoffrey Berry, Professor of Epidemiology & Biostatistica, University of Sydney; Professor Ian Webste; Professor of Community Medicine,University of NSW; Di- Christine Bennett, Associate Director, Services Planning, NSW Health Department; Dr Michael Froinmes', Epidemiologist,Epidemiology & Health Servicee Evaluation Bianch; Ms Jane Hall, Research Office'; Department of Community Medicine, Weetmead Hospital; andMi' Michael Ward, Acting Director, Strategic Marketing, NSW Health Department.
The editor is Dr George Rubin, Director, Epidemiology and Health Services Evaluation Branch, NSW Health Department.
Design - Health Public Affairs Unit, NSW Health Department.
Please send your articles, newa, comments or letters to Dr George Rubin - Locked Bag 961, North Sydney NSW 2059 or Fax (02)391 9232.
Suggestions for improving the reporting of infectious diseases are most welcome.
VoI.3INo.3 30

Cases of malaria in NSW in 1990
Continued from page 30
were immigrants or refugees from such countries. Thirty(17 per cent) were infected while living in malariouscountries for purposes of employment and 16 (9 per cent)while visiting on business. Two became infected while onmilitary exercises.
CLASSWICATION OF CASESOne hundred and ninety cases were imported into Australiaand none was a relapse from previously imported infections.One of the relapses was the second suffered by theindividual concerned.
- :] II.
GEOGRAPHIC ORFGIN OF CASES
Region of origin Number of cases Percentage
Africa 18 9.4Central America 1 0.5South America 1 0.5Southern Asia 26 13.6South East Asia 44 23.0South West Pacific 100 52.4
TOTAL 190
The geographic regions of origin of the diagnosed casesof malaria are listed in Table 5. In keeping with past yearsthe great majority of cases come from the countries of theSouth-West Pacific Region, Papua New Guinea (75), theSolomon Islands (13) and Vanuatu (11). One individualinfected in the region had visited all three countries, so anexact country of origin was not determined. In this region71 per cent of eases were Plasmodium vivax and 27 per centP. falciparum.
Of the 44 cases imported from South East Asia, 31 werefrom Indonesia. Many of these are reported to have beenacquired in Bali, but it is difficult to be sure the personhas not also travelled to Lombok or some other part of thecountry. Plasmodium vivax infections totalled 75.6 per centof infections from this region and P. falciparum 22 per cent.
All the cases imported from Southern Asia werePlesmodium vivax. Twenty-three (88.5 per cent) werefrom India, two from Pakistan and one from Sri Lanka.
Picz.snwdium falciparuni (12 cases, 66.7 per cent)predominates in cases from African countries. There wereequal numbers (three each) of P. ovale and P. uivax fromthis region.
ACCURACY OF DIAGNOSISFor 151 (76.6 per cent) of the 197 blood slides submitted theoi-iginal diagnosis was correct. With the other 46 (23.4 percent) cases, the type of error varied. In 19 instances thediagnosis given was malaria'. Although that was basicallytrue, because the proper clinical management of malariadepends on knowledge of the species involved, thisdiagnosis was classed as incorrect. There are somelaboratories which seem to wait for the confirmed diagnosisfrom the reference laboratory before reporting to thereferring doctor. This is a dangerous practice whereP. falciparwn is involved and in one instance recently,was partly responsible for a near fatality. If the 'malaria'category is not included in the calculations there is stillan error rate in diagnosis of 14 per cent overall and of
16 per cent in cases involving Plasmodium falciparum. Thisis much higher than it was about 10 years ago and is causefor concern.
- i I .
AGE AND SEX OF CASES
Age group Females Males Total
0-4 2 2 45-9 1 7 810-14 3 6 915-19 1 7 820-24 11 27 3825-29 13 22 3530-34 8 17 2535-39 3 17 2040-44 4 9 1345-49 1 6 750-54 3 5 855-59 1 3 460-64 2 2 465-69 5 1 670-74 1 1 275-79 1 0 180-84 1 0 1
TOTAL 61 132 193
Details of the age and sex of 193 individuals were availableand are shown in Table 6. The youngest person infected wasa 1-year-old male who was a resident of Papua New Guineaand the oldest an 84-year-old woman who had recentlyemigrated from Vietnam. Both were infected with P vicar.The 1-year-old also had P falciparum diagnosed severalmonths previously in Brisbane. The mean age for femaleswas 35 years and the mean for males was 30 years.
PROPHYLAXISBecause of the increasing problem of drug resistanceit is becoming more difficult to give advice on malarialprophylaxis. The information available in this instancecannot help with making decisions about the efficacyof particular prophylactic regimens, because there is noinformation on how many individuals overall were using aparticular drug or drugs. It is important for those advisingtravellers to stress that malaria prophylaxis will notprevent infection; it should prevent illness while the drug isstill being taken but, with drug-resistant strains, even thatcan not be guaranteed.
Among those in whom malaria was diagnosed the mostfrequently used single drug was chloroquine (34individuals) and the most common combination chloroquineand maloprim (39 individuals). Sixty people were taking noprophylaxis. There wei-e significant national differences inthe patterns of use of prophylaxis - 18.6 per cent ofAustralians, 613.7 per cent of Papua New Guineans and 91.7per cent of Indians were not using any anti-malarial drugs.
In Papua New Guinea 70-80 per cent of all malaria cases(depending on the region) are caused by P faiciparum. Theproportion of infections caused by that species in indvidualsinfected in PNG who were taking prophylaxis of some formwas 20 per cent, but in those who were not takingprophylaxis the proportion was 48 per cent. Thus, therecan be no doubt that some form of malaria prophylaxis is ofvalue in preventing a proportion of P falciparum infectionswhich would otherwise occur.
John WalkerDepartment of Parasitology, Centre for InfectiousDiseases and Microbiology, Westmead Hospital
Vol. 3/No. 3