Embed Size (px)
Citation preview
© Kernow Clinical Commissioning Group
.
Infection Prevention & Control Annual Report 2014-15 Lisa Johnson
May 2015
Infection Prevention & Control Annual report 2014-15
Page 2/53
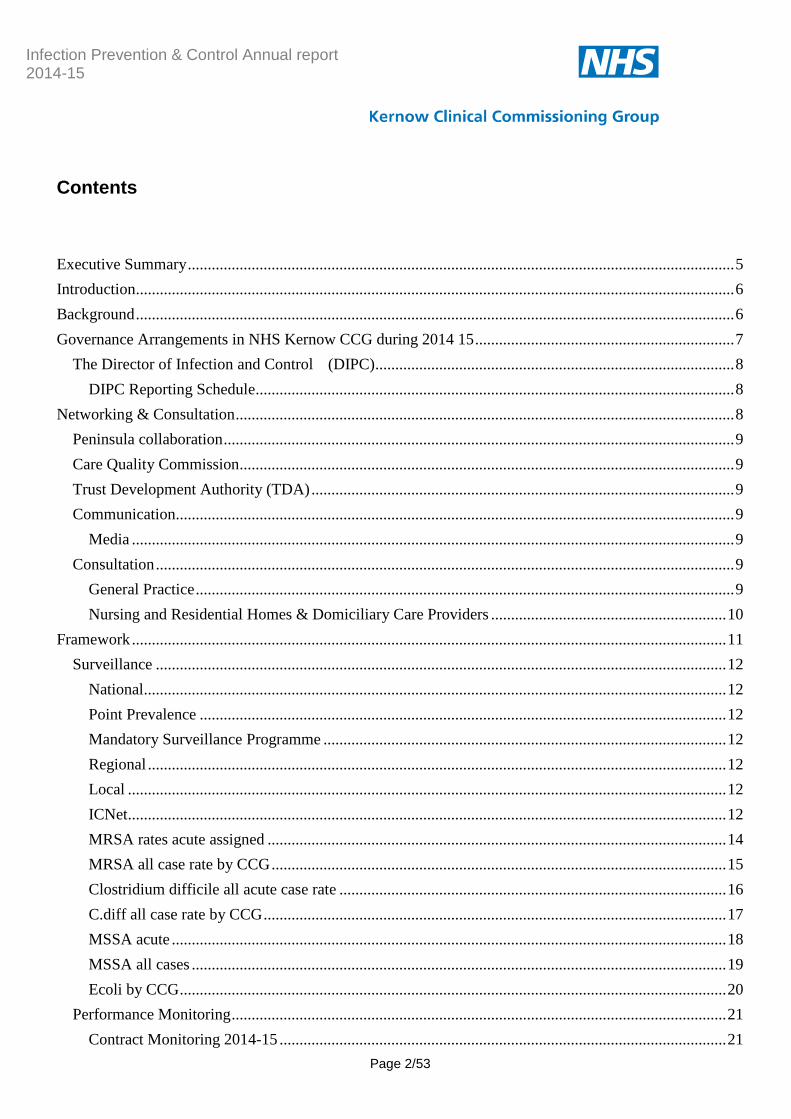
Contents
Executive Summary ......................................................................................................................................... 5
Introduction ...................................................................................................................................................... 6
Background ...................................................................................................................................................... 6
Governance Arrangements in NHS Kernow CCG during 2014 15 ................................................................. 7
The Director of Infection and Control (DIPC) .......................................................................................... 8
DIPC Reporting Schedule ........................................................................................................................ 8
Networking & Consultation ............................................................................................................................. 8
Peninsula collaboration ................................................................................................................................ 9
Care Quality Commission ............................................................................................................................ 9
Trust Development Authority (TDA) .......................................................................................................... 9
Communication ............................................................................................................................................ 9
Media ....................................................................................................................................................... 9
Consultation ................................................................................................................................................. 9
General Practice ....................................................................................................................................... 9
Nursing and Residential Homes & Domiciliary Care Providers ........................................................... 10
Framework ..................................................................................................................................................... 11
Surveillance ............................................................................................................................................... 12
National .................................................................................................................................................. 12
Point Prevalence .................................................................................................................................... 12
Mandatory Surveillance Programme ..................................................................................................... 12
Regional ................................................................................................................................................. 12
Local ...................................................................................................................................................... 12
ICNet ...................................................................................................................................................... 12
MRSA rates acute assigned ................................................................................................................... 14
MRSA all case rate by CCG .................................................................................................................. 15
Clostridium difficile all acute case rate ................................................................................................. 16
C.diff all case rate by CCG .................................................................................................................... 17
MSSA acute ........................................................................................................................................... 18
MSSA all cases ...................................................................................................................................... 19
Ecoli by CCG ......................................................................................................................................... 20
Performance Monitoring ............................................................................................................................ 21
Contract Monitoring 2014-15 ................................................................................................................ 21
Infection Prevention & Control Annual report 2014-15
Page 3/53
Mandatory Surveillance/Performance ................................................................................................... 21
MRSA Zero Tolerance 2014-15 ............................................................................................................ 21
Clostridium difficile ............................................................................................................................... 22
Contract Setting 2015-16 ....................................................................................................................... 25
Sepsis Lead ............................................................................................................................................ 25
Flu Lead ................................................................................................................................................. 26
Investigation & Learning ........................................................................................................................... 28
MRSA .................................................................................................................................................... 28
C.diff ...................................................................................................................................................... 28
MSSA & Ecoli bacteraemia ................................................................................................................... 31
Evidence Log ......................................................................................................................................... 31
Whole System Planning ............................................................................................................................. 31
Norovirus ............................................................................................................................................... 31
Cdiff ....................................................................................................................................................... 32
MRSA .................................................................................................................................................... 32
CPE ........................................................................................................................................................ 33
Ebola ...................................................................................................................................................... 33
Improvement Evaluation ........................................................................................................................... 34
Norovirus ................................................................................................................................................... 34
Norovirus Outbreak Overview .............................................................................................................. 36
Antimicrobial Stewardship ............................................................................................................................ 36
DIPC Role .................................................................................................................................................. 36
UK Strategy ............................................................................................................................................... 36
AMR systems maps ............................................................................................................................... 37
Local Strategy ........................................................................................................................................ 38
Prescribing Compliance ......................................................................................................................... 39
Primary Care .......................................................................................................................................... 43
Education ....................................................................................................................................................... 46
Conclusion ..................................................................................................................................................... 47
Appendices .................................................................................................................................................... 47
Glossary ......................................................................................................................................................... 47
Abbreviations ............................................................................................................................................. 47
Clostridium difficile ................................................................................................................................... 48
Ecoli ........................................................................................................................................................... 48
MSSA / MRSA .......................................................................................................................................... 49
Norovirus ................................................................................................................................................... 50
Infection Prevention & Control Annual report 2014-15
Page 4/53
Appendices .................................................................................................................................................... 51
Infection Prevention & Control Annual report 2014-15
Page 5/53
Executive Summary
Preventing & reducing Healthcare Associated Infection (HCAI) is a well embedded priority in local commissioning relationships. Fluctuating rates in some infections have been noted in recent years but there are some improvements to report. New challenges have been met with positive response particularly in relation to Ebola preparedness. Specific activity and developments this year have been;
Update of the whole community Norovirus Plan
Implementation of Clostridium difficile (C.diff) avoidability assessments.
Completed phase 2 of the prescribing audit collaboration
Ebola preparedness
Raised profile of Antibiotic Awareness Day
Construction of a CQUIN for Sepsis
Progress of MRSA plan

Infection Prevention & Control Annual report 2014-15
Page 6/53
Introduction
It is estimated that 300,000 patients a year in England acquire a healthcare-associated infection as a result of care within the NHS. The English point prevalence survey (PPS) data collection was undertaken by hospital teams between October 2011 and November 2011. The prevalence of healthcare-associated infections in hospitals in England in 2011 was 6.4%. The most common types of healthcare-associated infection are respiratory infections (including pneumonia and infections of the lower respiratory tract) (22.8%), urinary tract infections (17.2%) and surgical site infections (15.7%). Each one of these infections means additional use of NHS resources, greater patient discomfort and a decrease in patient safety.1
This report satisfies the requirement that the Director of Infection Prevention & Control must publish an annual report to provide details of all aspects of the organisation’s infection prevention and control programme and include publication of HCAI data. Links are provided as footnotes throughout this document to further guidance and original sources.
Background
The NHS mandate2 and the NHS Outcomes framework3 set out the expectation for patients to be treated in a safe and clean environment and to be protected from avoidable harm. The Health & Social Care Act 20084 underpins the requirement for infection prevention and control and cleanliness with the provision of a statutory code of practice, ‘The Hygiene Code’. The Care Quality Commission (CQC) conducts unannounced inspections assessing registered providers against aspects of the code of practice to monitor compliance with the registration requirements relating to cleanliness and infection control. NHS Kernow has a general responsibility as a commissioning body to be satisfied that contracted providers have appropriate systems in place. National HCAI reduction expectations apply to CCG populations as well as acute providers.
1 Infection Prevention & Control NICE Quality Standard 2014
2 NHS Mandate
3 NHS Outcomes Framework at a glance
4 The Hygiene Code

Infection Prevention & Control Annual report 2014-15
Page 7/53
Governance Arrangements in NHS Kernow CCG during 2014 15
Risk & Review Team
Local Directors of Infection Prevention
& Control Group
Corporate & Clinical Services Directorate
Reporting Arrangements
Managing Director
Governance & Assurance Committee
Director
Interim Governance
Manager
Nurse Consultant
DIPC
Team Admin Support
Infection Prevention & Control Annual report 2014-15
Page 8/53
The Director of Infection and Control (DIPC)
The role of the DIPC was fulfilled, as in recent years, by the Nurse Consultant Infection Prevention & Control.
DIPC Reporting Schedule
Biannual reports to the Governance & Assurance Committee. The Local DIPC Group meets quarterly and takes a strategic overview is to ensure that: - The prevention of healthcare acquired infection remains a key area for joint work and delivery across the health and social care community. - A community wide perspective is maintained in relation to the strategic direction of infection prevention and control activity. - Infection Prevention and Control policies, procedures and additional guidance are shared to ensure that duplication is avoided, best practice shared and gaps are identified.
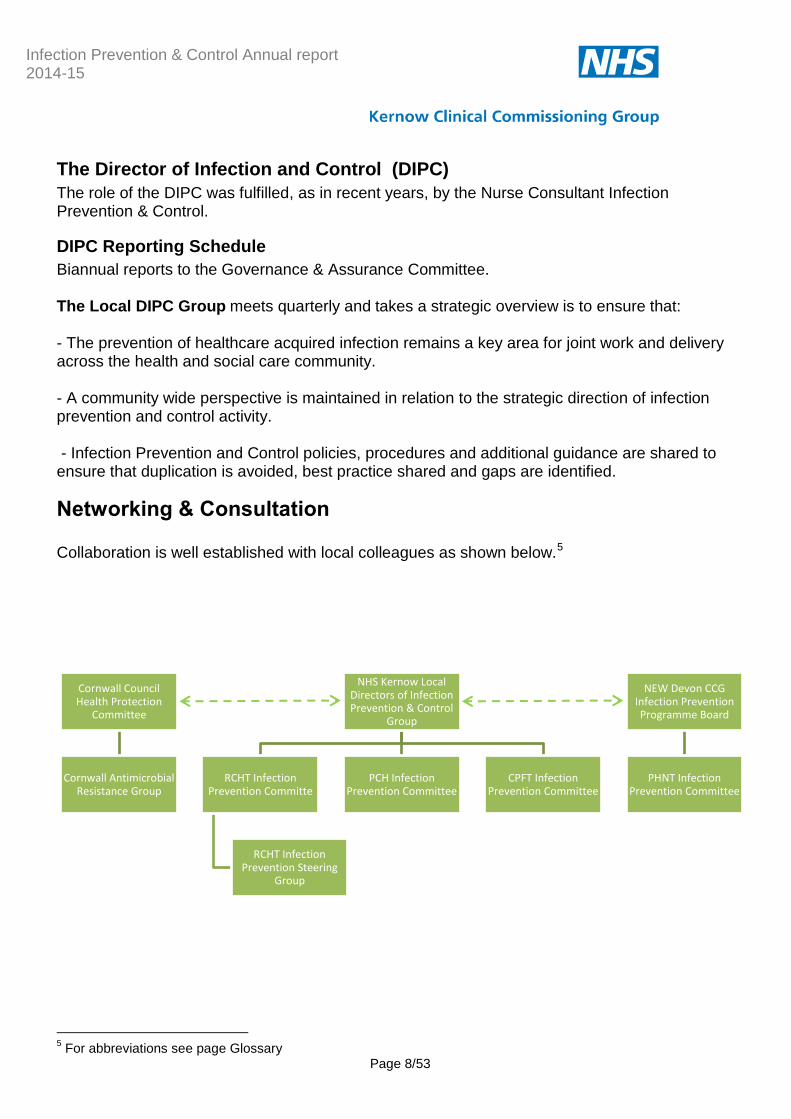
Networking & Consultation
Collaboration is well established with local colleagues as shown below.5
5 For abbreviations see page Glossary
Cornwall Council Health Protection
Committee
Cornwall Antimicrobial Resistance Group
NHS Kernow Local Directors of Infection Prevention & Control
Group
RCHT Infection Prevention Committe
RCHT Infection Prevention Steering
Group
PCH Infection Prevention Committee
CPFT Infection Prevention Committee
NEW Devon CCG Infection Prevention Programme Board
PHNT Infection Prevention Committee
Infection Prevention & Control Annual report 2014-15
Page 9/53
Peninsula collaboration
NHS Kernow NC-DIPC has close collaborative links with the Infection Control Leads in NEW Devon CCG & South Devon & Torbay with cross attendance at meetings and events. Technical support has been shared on a variety of issues including use of personal protective equipment, CQUIN construction, Ebola and Clostridium difficile reduction. An element of peer supervision has evolved which is positive for all parties.
Care Quality Commission
Changes in the inspection methodology have reduced the collaborative links previously in existence for infection prevention issues. Information sharing is via Governance Team attendance at CQC meetings.
Trust Development Authority (TDA)
A positive professional link was made with the regional TDA Head of Infection Prevention & Control during 2013-14 was lost in 2014-15 with the change in post holder at the TDA. A scheduled visit from the new post holder was postponed. A positive new connection will be established in 2015-16.
Communication
Media
Response was requested from the media on the issues of Noro virus and also antimicrobial prescribing. The Nurse Consultant recorded radio interviews on several occasions in respect of Norovirus and also in support of Antibiotic Awareness Day.
Consultation
General Practice
As noted in the previous annual report CCG commissioning did not include General Practice in 2014-15 and therefore this sector was not factored into the programme. Although raised as a concern with NHS England the option to provide services was not funded. Historic links remain and Practices have continued to ask for advice and inspections. Some email and telephone advice has been provided. Links into General Practice continue via work with the CCG Medicines Optimisation Team (see Antimicrobial Stewardship section). Options have been explored for the provision of training for Practice Nurses who have not had access to specific infection prevention training for two years.

Infection Prevention & Control Annual report 2014-15
Page 10/53
Nursing and Residential Homes & Domiciliary Care Providers
This section of the report previously related to the work of the audit & surveillance nurse. This role did not transfer to the CCG commissioning architecture. A single care home was visited in 2013-14 compared to 45 visits in the previous year. Improved collaboration with the service improvement team at Cornwall Council has been developed to maintain a route of influence in this sector. Collaborative work has been undertaken with the council to develop information resources for care homes. A member of the Service improvement team sits on the Local DIPC group. A care standard specific to Infection Prevention & Control has been produced and updated and this forms part of the wider set of standards produced for use in care homes by NHS Kernow. Works has also commenced during 2014-15 on a clinical management plan for MRSA to add to the set produced by Peninsula Community Health for care homes.
Infection Prevention & Control Annual report 2014-15
Page 11/53
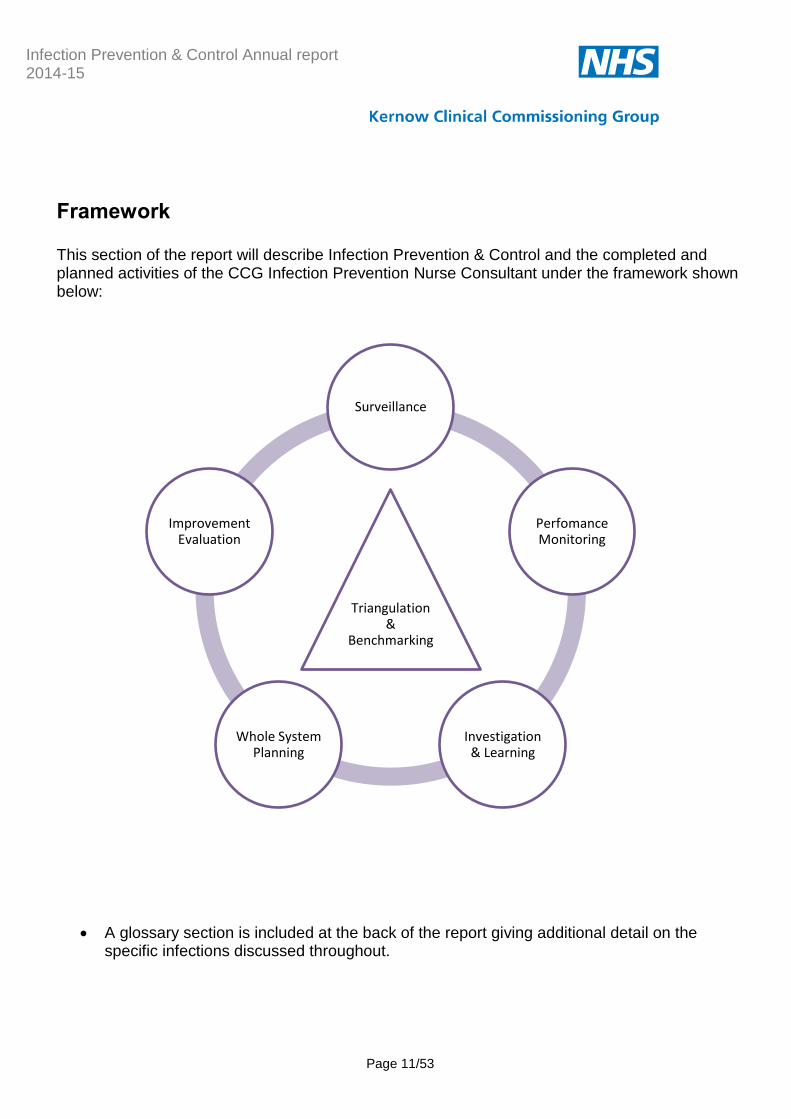
Framework
This section of the report will describe Infection Prevention & Control and the completed and planned activities of the CCG Infection Prevention Nurse Consultant under the framework shown below:
A glossary section is included at the back of the report giving additional detail on the specific infections discussed throughout.
Triangulation &
Benchmarking
Surveillance
Perfomance Monitoring
Investigation & Learning
Whole System Planning
Improvement Evaluation

Infection Prevention & Control Annual report 2014-15
Page 12/53
Surveillance
National
Point Prevalence
The Health Protection Agency (HPA) coordinated the fourth National Point Prevalence Survey (PPS) on healthcare-associated infection (HCAI)6 and first National PPS on antimicrobial use in England. A total of 3,360 (6.4%) patients were diagnosed with an active HCAI. Royal Cornwall Hospitals NHS Trust (RCHT) participated in the survey and reported a rate of 8.8%. This was slightly above the 2006 national average of 8.2% and significantly above the 2011 national average of 6.4%. RCHT repeated a prevalence survey of hospital acquired infections during December 2013 using the same methodology as the National point prevalence survey of 2011 and found an overall infection rate of 5.5%. The survey has not been repeated since.
Mandatory Surveillance Programme
The Public Health England deals with information collected via the mandatory surveillance programme. The collection point is via the laboratory where infections are confirmed by the analysis of specimens and swabs. Local, regional and national reporting comes from this system.
Regional
Regional trends in infections are also monitored by PHE and localised reports are provided regularly. PHE publication of annual rates of specific infections takes place in July. The presentation of this report is scheduled to precede the publication.
Local
ICNet
ICNet is a software package that allows real time collaboration of patient and laboratory data to enable case management and surveillance of HCAI. The use of ICNet in Cornwall was developed during 2009/10 and refined and extended during 2010/11. The Infection Prevention & Control Nurses use it to record their activity and advice. Surveillance reports can be pulled from the system and allow entry and analysis of risk factor data. This facility allowed greater understanding of local Clostridium difficile patterns during 2012-13. Use of this facility for community surveillance and proactive prevention ceased at the end of 2012-13 with the loss of the Audit & Surveillance Nurse post. The system continues to provide a
6 HPA Antimicrobial Resistance HCAI Point Prevalence Survey
Infection Prevention & Control Annual report 2014-15
Page 13/53
central point for infection prevention and control investigations and the link between laboratory results and patient location is critical. Links to the Plymouth Hospitals Trust system have been repeatedly requested and agreed in theory but never progressed. There have been positive developments in this area early in 2015 and meetings are scheduled to discuss the issue again. Graphs are shown on the following pages of mandatory surveillance data for the South West region.

© Kernow Clinical Commissioning Group
MRSA rates acute assigned
The graph above shows the rate of MRSA bacteraemia per 100,000 bed days of cases assigned to acute trust by the Post Infection Review process. Decreases can be seen compared to the previous year.

Infection Prevention & Control Annual report 2014-15
Page 15/53
MRSA all case rate by CCG
The graph above shows the rate of MRSA bacteraemia cases in the CCGs in the South West. This is the total case rate as opposed to the PIR assigned rate as these rates are not available at the time of reporting.
Infection Prevention & Control Annual report 2014-15
Page 16/53
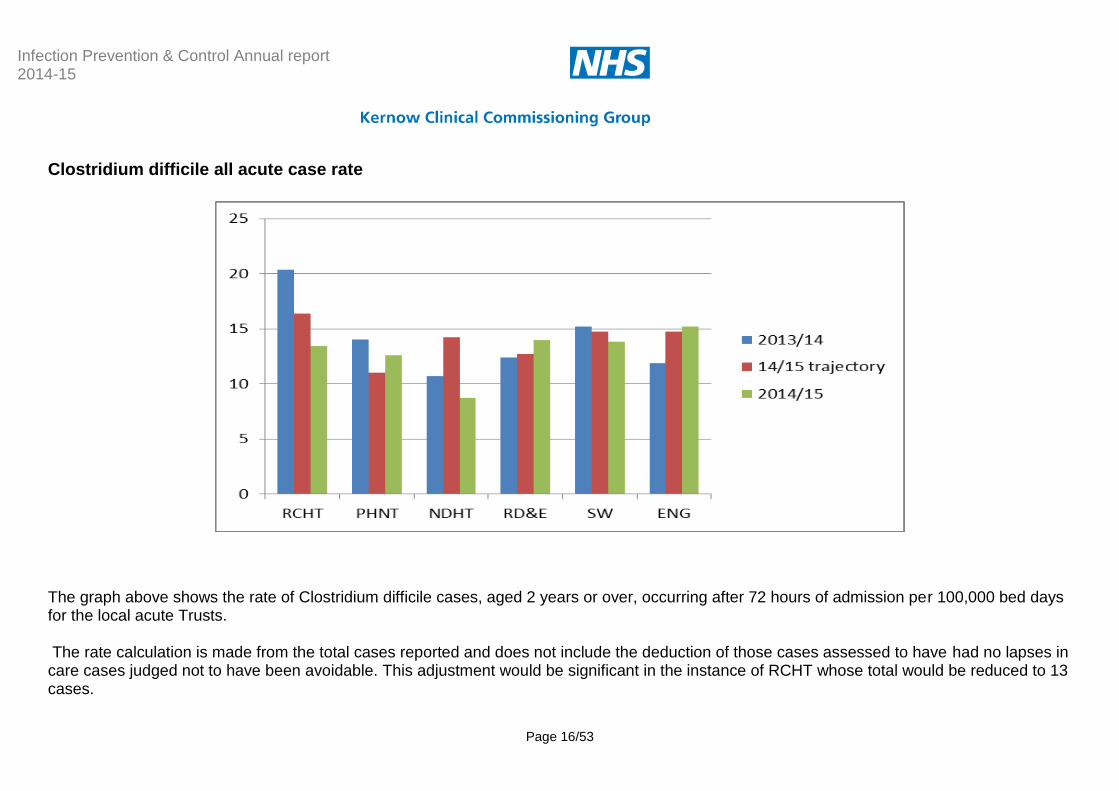
Clostridium difficile all acute case rate
The graph above shows the rate of Clostridium difficile cases, aged 2 years or over, occurring after 72 hours of admission per 100,000 bed days for the local acute Trusts. The rate calculation is made from the total cases reported and does not include the deduction of those cases assessed to have had no lapses in care cases judged not to have been avoidable. This adjustment would be significant in the instance of RCHT whose total would be reduced to 13 cases.

Infection Prevention & Control Annual report 2014-15
Page 17/53
C.diff all case rate by CCG
The graph above shows the rate of Clostridium difficile cases occurring both before and after 72 hours of admission (or without any admission) in the CCGs of the South West Region. Only 3 CCG have rates below the trajectory set. All others show increases including NHS Kernow where rates have increased for the second year.
Infection Prevention & Control Annual report 2014-15
Page 18/53
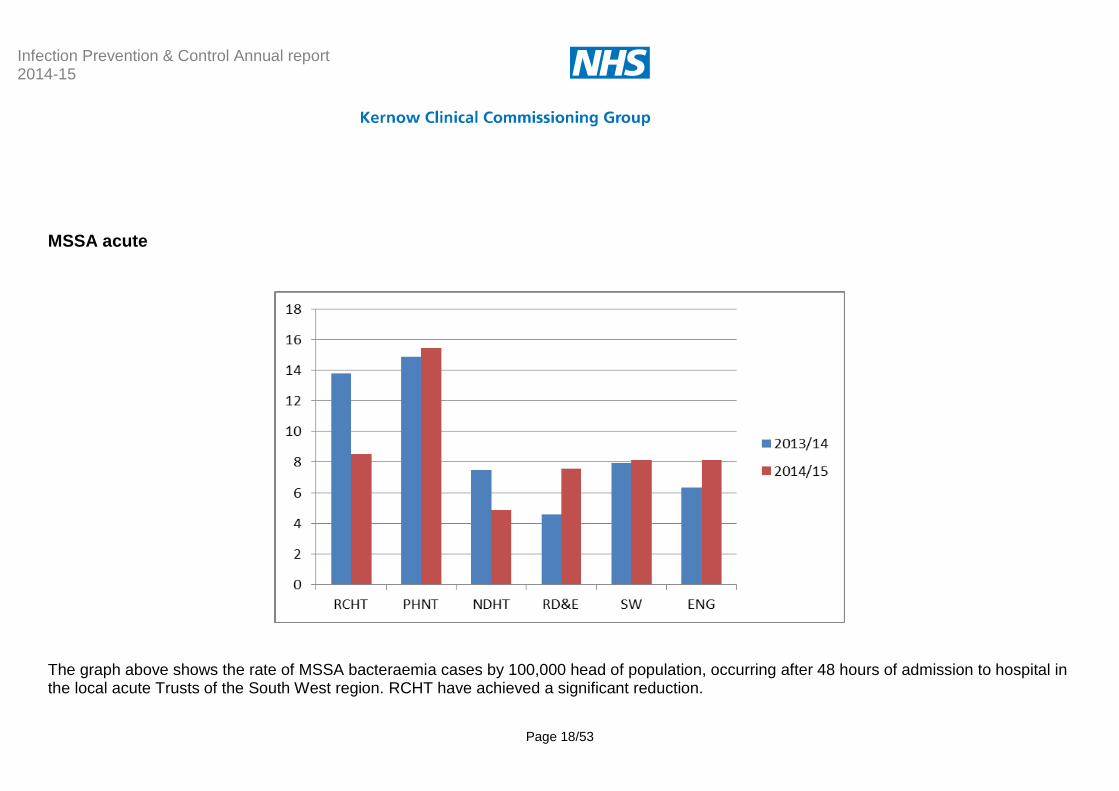
MSSA acute
The graph above shows the rate of MSSA bacteraemia cases by 100,000 head of population, occurring after 48 hours of admission to hospital in the local acute Trusts of the South West region. RCHT have achieved a significant reduction.
Infection Prevention & Control Annual report 2014-15
Page 19/53
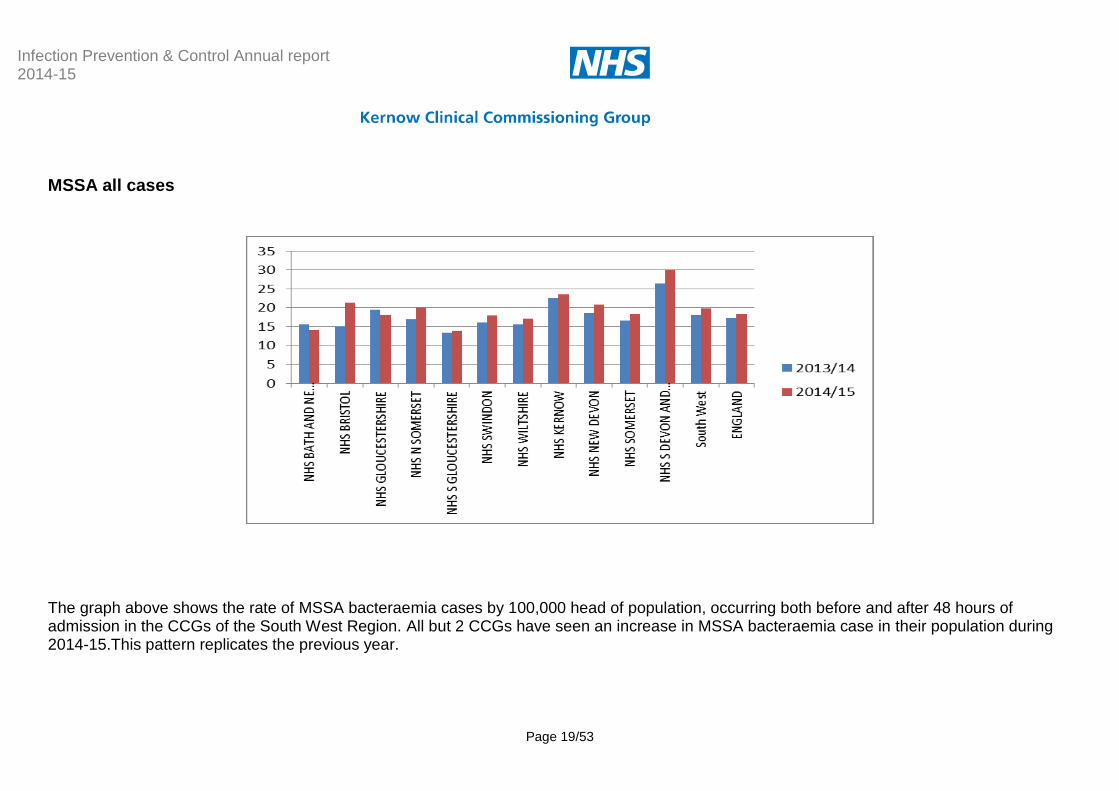
MSSA all cases
The graph above shows the rate of MSSA bacteraemia cases by 100,000 head of population, occurring both before and after 48 hours of admission in the CCGs of the South West Region. All but 2 CCGs have seen an increase in MSSA bacteraemia case in their population during 2014-15.This pattern replicates the previous year.

Infection Prevention & Control Annual report 2014-15
Page 20/53
Ecoli by CCG
Rates shown are by 100,000 head of population. NHS Kernow is one of only 3 CCGs to have seen a reduction in Ecoli bacteraemia rate in 2014-15. Rates by hospital are not shown as these are not included in data sources available.
© Kernow Clinical Commissioning Group
Performance Monitoring
Contract Monitoring 2014-15
A template is embedded within the quality report to collect key indicator information from providers. The submissions are routed through the Local DIPC Group where provider members have agreed to general discussion of each submission. This continues to be a positive process allowing members to share concerns, learning and solutions.
Mandatory Surveillance/Performance
Mandatory surveillance7 is designed to deliver the most accurate data on key infections. Reduction targets are a natural progression. This section will give details of performance against reduction targets set against infections subject to mandatory surveillance.8
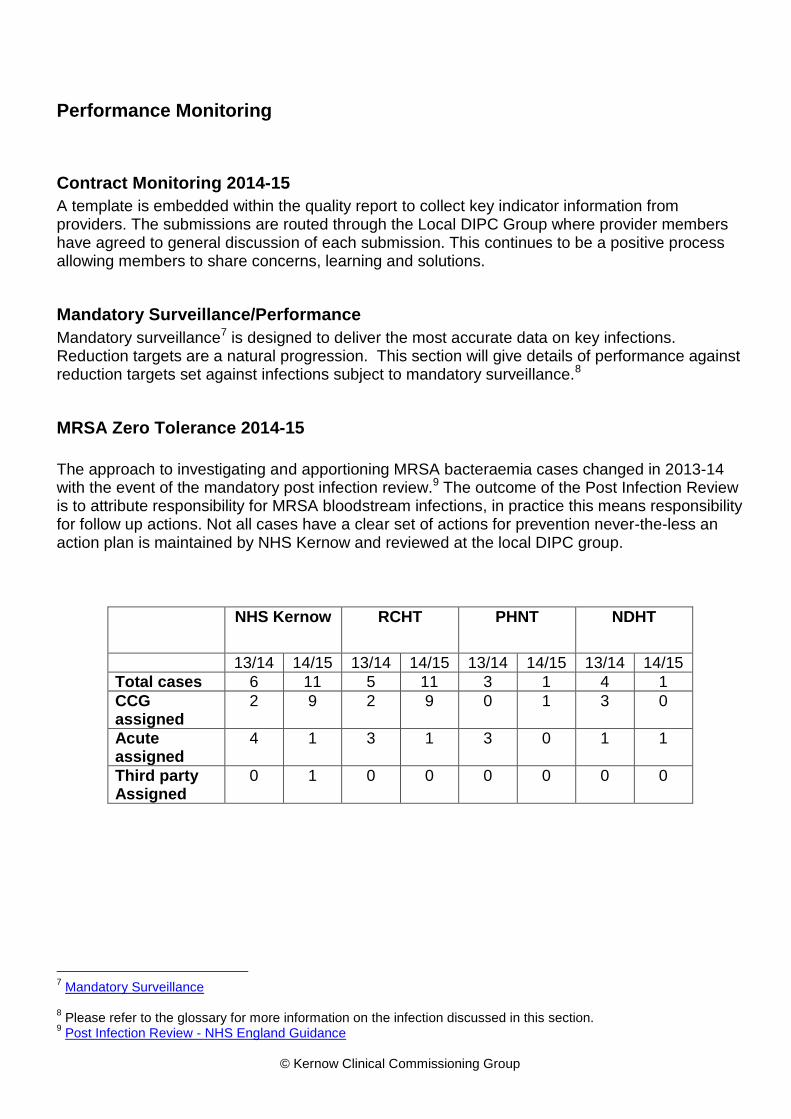
MRSA Zero Tolerance 2014-15
The approach to investigating and apportioning MRSA bacteraemia cases changed in 2013-14 with the event of the mandatory post infection review.9 The outcome of the Post Infection Review is to attribute responsibility for MRSA bloodstream infections, in practice this means responsibility for follow up actions. Not all cases have a clear set of actions for prevention never-the-less an action plan is maintained by NHS Kernow and reviewed at the local DIPC group.
NHS Kernow RCHT
PHNT
NDHT
13/14 14/15 13/14 14/15 13/14 14/15 13/14 14/15
Total cases 6 11 5 11 3 1 4 1
CCG assigned
2 9 2 9 0 1 3 0
Acute assigned
4 1 3 1 3 0 1 1
Third party Assigned
0 1 0 0 0 0 0 0
7 Mandatory Surveillance
8 Please refer to the glossary for more information on the infection discussed in this section.
9 Post Infection Review - NHS England Guidance
Infection Prevention & Control Annual report 2014-15
Page 22/53
Clostridium difficile
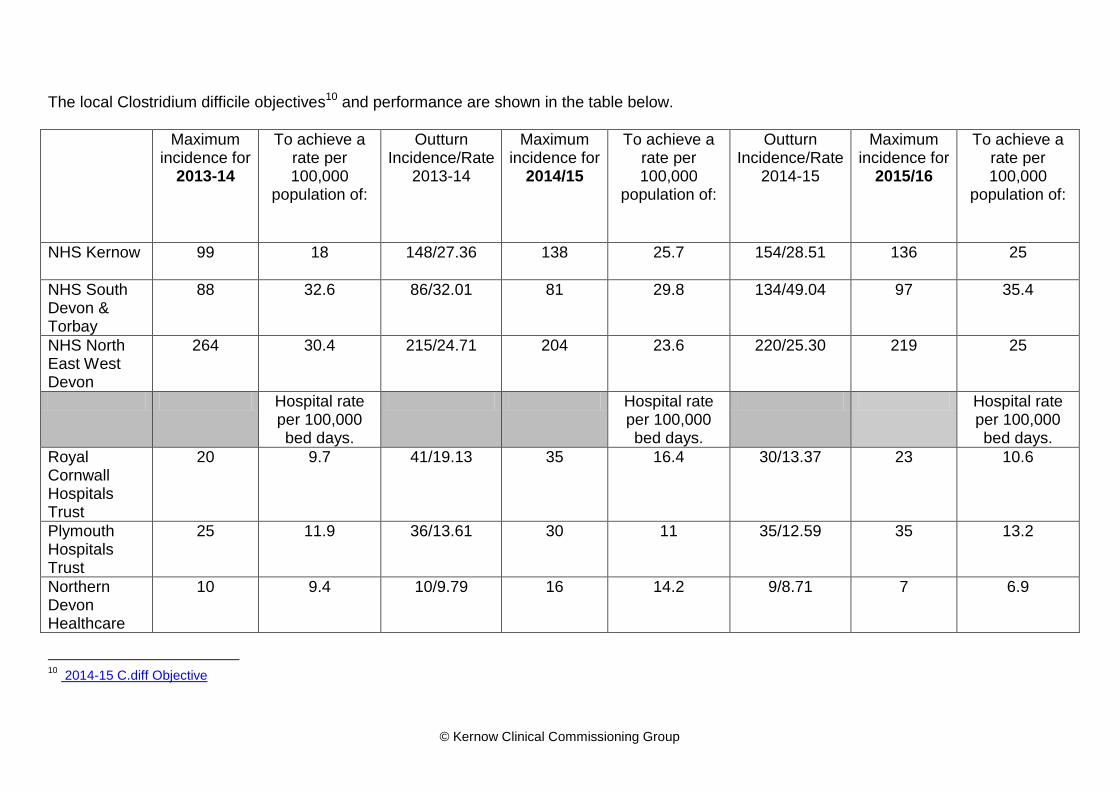
Challenging objectives for Clostridium difficile reduction have been in place for some years. Reductions are expected in both acute hospital cases and also CCG population cases. NHS Kernow CCG, NHS NEW Devon & NHS S Devon & Torbay have all seen increases in cases during 2014-15. Performance of local Acute trusts has been varied as the graph on page 16 and the table below portray. Northern Devon Healthcare and Royal Cornwall Hospitals Trust have made reductions and met the objective set whereas Plymouth Hospitals NHS Trust has made a small reduction but not met the objective. This appears to highlight an anomaly with the objective setting process which uses a baseline period between each year on which to base calculations. It can be seen in the table below that Plymouth has static incidence and that the objective set each year is rising. This would seem counter intuitive to effective reduction ambition.
© Kernow Clinical Commissioning Group
The local Clostridium difficile objectives10 and performance are shown in the table below.
Maximum incidence for
2013-14
To achieve a rate per 100,000
population of:
Outturn Incidence/Rate
2013-14
Maximum incidence for
2014/15
To achieve a rate per 100,000
population of:
Outturn Incidence/Rate
2014-15
Maximum incidence for
2015/16
To achieve a rate per 100,000
population of:
NHS Kernow
99 18 148/27.36 138 25.7 154/28.51 136 25
NHS South Devon & Torbay
88 32.6 86/32.01 81 29.8 134/49.04 97 35.4
NHS North East West Devon
264 30.4 215/24.71 204 23.6 220/25.30 219 25
Hospital rate per 100,000 bed days.
Hospital rate per 100,000 bed days.
Hospital rate per 100,000 bed days.
Royal Cornwall Hospitals Trust
20 9.7 41/19.13 35 16.4 30/13.37 23 10.6
Plymouth Hospitals Trust
25 11.9 36/13.61 30 11 35/12.59 35 13.2
Northern Devon Healthcare
10 9.4 10/9.79 16 14.2 9/8.71 7 6.9
10
2014-15 C.diff Objective
© Kernow Clinical Commissioning Group
Lapse in care Assessment 2014-15 is the first year that a set of NHS England guidance has been implemented. The guidance set out how commissioners can exercise discretion in deciding whether or not to impose sanctions on providers for breach of their Clostridium difficile objective, allowing them to take into account specific circumstances relating to identified infections in determining whether sanctions are appropriate Local response to this development is a good example of Devon & Cornwall collaboration. An evaluation tool to guide the consideration of cases was developed, shared and agreed by four acute providers. . Areas for consideration are;
courses of antibiotics given,
whether or not the correct indication, dose, and duration were prescribed
whether antibiotics were given for a healthcare associated infection which itself was avoidable,
whether proton pump inhibitors were prescribed appropriately
whether the case was associated with other cases in the same area
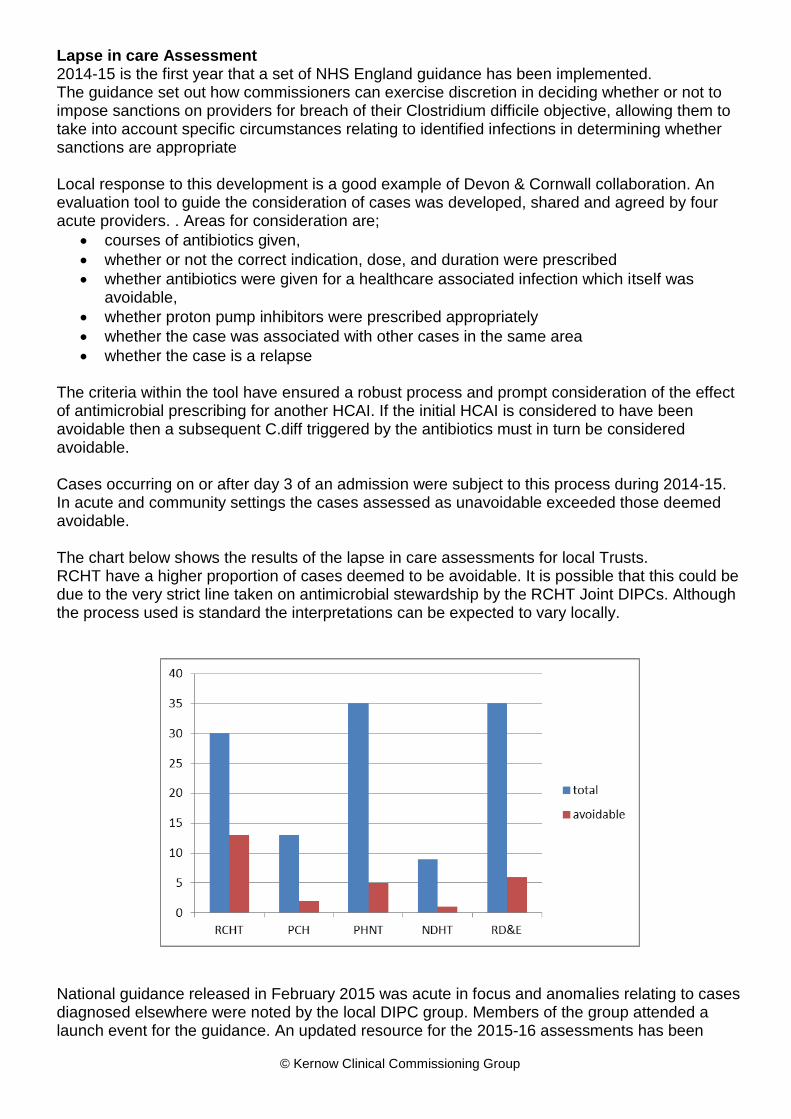
whether the case is a relapse The criteria within the tool have ensured a robust process and prompt consideration of the effect of antimicrobial prescribing for another HCAI. If the initial HCAI is considered to have been avoidable then a subsequent C.diff triggered by the antibiotics must in turn be considered avoidable. Cases occurring on or after day 3 of an admission were subject to this process during 2014-15. In acute and community settings the cases assessed as unavoidable exceeded those deemed avoidable. The chart below shows the results of the lapse in care assessments for local Trusts. RCHT have a higher proportion of cases deemed to be avoidable. It is possible that this could be due to the very strict line taken on antimicrobial stewardship by the RCHT Joint DIPCs. Although the process used is standard the interpretations can be expected to vary locally.
National guidance released in February 2015 was acute in focus and anomalies relating to cases diagnosed elsewhere were noted by the local DIPC group. Members of the group attended a launch event for the guidance. An updated resource for the 2015-16 assessments has been
Infection Prevention & Control Annual report 2014-15
Page 25/53
produced. This will aim to capture lapses in care as expected but also to capture areas of suboptimal practice which would not have directly contributed to the case. This should provide a wider focus for learning.
Contract Setting 2015-16
National templates for a service specification for Infection Prevention & Control became available at the end of 2009/10 these have been incorporated into the RCHT contract and updated once again for 2015-16.
The NHS Outcomes Framework, alongside the Adult Social Care and Public Health outcomes frameworks, sits at the heart of the health and care system and drives up quality throughout the NHS by encouraging a change in culture and behaviour focused on health outcomes not process. The latest version of the framework includes indicators specific to MRSA and Clostridium difficile incidence as in previous years.11
The RCN/IPS commissioning toolkit (V2)12 was used in the development of the proposed 15/16 indicators. A quality schedule was submitted giving the advised requirements for infection prevention for each provider sector taking account of the principle of proportionality set out in the Hygiene Code.
In addition the use of intelligence from Clostridium difficile case investigations and spot checks in wards revealed room for improvement in the use of stool charts. This simple intervention has been promoted and expected within diarrhoeal illness policies for many years but has resisted improvement. Submissions were made for this to be included as a quality indicator.
At the time of reporting only one of the final schedules has been shared and this did not contain the indicators proposed. This is disappointing and ways to improve contractual links are being considered for the 2016-17 contract round.
Sepsis Lead
In September 2014 NHS Kernow received a commissioner survey on the subject of Sepsis and it became apparent that an organisational lead would be helpful. The Nurse Consultant has adopted this role. An expectation was identified that contractual mechanisms should be in place to improve the prevention of sepsis. A local deadline for CQUIN (Commissioning for Quality & Innovation) production was ahead of the publication of national CQUINs and therefore a local CQUIN was pulled together in positive collaboration with the Cornwall Antimicrobial Resistance group. (See page 36) The denominators were set as: a) Improving % of nursing observations that have a calculated NEWS score13.
11
2015-16 NHS Outcome Framework 12
Infection Prevention Commissioning Toolkit 13
NEWS score

Infection Prevention & Control Annual report 2014-15
Page 26/53
b) Improving % of adult cases with a positive blood culture result and a NEWS score that should have triggered intervention who received a 1st antibiotic dose within 1 hour. c) 90 % of inpatients on antibiotics (prescribed since admission) whose antibiotic prescription has been reviewed have an antibiotic plan documented no later than 72 hours after first dose The national CQUINs were subsequently published and included sepsis; the national CQUIN team were consulted to check that the local idea could be progressed. Positive feedback was received. The CQUIN will be monitored by NHS Kernow
Flu Lead
Previously a PCT Public Health function in 2013-14 it became apparent that, following reconfiguration, the CCG did not have a Flu Lead, this function was incorporated into the Nurse Consultant DIPCs role. NHS England has the responsibility for commissioning the Flu programme. The Screening and Immunisation Manager sits within Public Health England and NHS England South (South West). Assurance of the planning and delivery of the flu immunisation programme was therefore led by NHSE who are expected to report on the performance and outcome of the programme as part of the responsibilities that NHS England agreed for the seasonal flu programme under a Section 7A agreement with the Secretary of State for Health. Local authority Directors of Public Health have a duty to ensure plans are in place to protect their population including through screening and immunisation. They provide independent scrutiny and challenge of the plans of NHS England, PHE and providers. The majority of flu vaccinations are given in primary care and general practice is key to the success of the flu vaccination programme. It remained the responsibility of GPs to order sufficient flu vaccine for eligible patients in 2014/15. NHS Kernow takes responsibility for monitoring the flu plans to improve staff vaccination uptake among providers. Vaccine uptake is monitored with upward delegation to an executive level group in cases of underperformance. The target percentage of staff uptake of flu vaccinations is 75%. The graph below indicates percentage of uptake across providers up to 2nd March 2015.

Infection Prevention & Control Annual report 2014-15
Page 27/53
There is significant national variation in uptake and 2014-15 in Cornwall has been disappointing. The planning workshop has already been held for the 2015-16 season and a regional approach proposed. A toolkit used in Devon is scheduled to be rolled out in Cornwall. The graph below shows uptake in Devon.
Low or non-significant effectiveness of Flu vaccine has been observed in 2014/15 in the UK and in North America this correlates with the direct mismatch seen between the vaccine virus and
Infection Prevention & Control Annual report 2014-15
Page 28/53
A(H3N2) strains circulating this winter. Vaccine mismatch due to circulation of drifted strains does occasionally occur.14 There is a possibility that the 2014-15 mismatch will affect the perceptions held about the value of vaccination. NHS Kernow will be requesting level 2 staff sickness data from providers from the third quarter to enable links to be made when discussing vaccine uptake.
Investigation & Learning
There are different processes in place for investigation and learning of HCAIs but the underpinning principles adopted locally recognise the need to evaluate care across the patient pathway and to facilitate blame free learning in order for staff to feel able to engage in a candid way.
MRSA
The MRSA Post Infection Review (see footnotes 9 on page 21) process relies on strong partnership working by all organisations involved in the patient’s care pathway, to jointly identify and agree the possible causes of, or factors that contributed to, the patient’s MRSA bloodstream infection. This system has worked well in Cornwall since collaborative investigation has been well embedded for some years. There have not been any incidents of failure to agree assignment and so arbitration has not been required. The actions identified during an investigation represent the learning available to the health community. Familiar themes frequently emerge from investigations both in terms of practice noted and patient risk factors. Prescribing stood out as an issue in several cases. This was addressed with primary care in collaboration with the medicines optimisation team and microbiology department at RCHT. Three presentations were given at the three GP prescribing leads locality group meetings. GPs were provided with reflective resources bases on recent cases.
C.diff
The ‘lapse in care’ assessments have provided some detail from which to evaluate themes. All cases had received antibiotics and no transmission was detected between cases. Cases were not found to result from antibiotics given for other HCAIs nor were any relapses noted. There
14
Vaccine mismatch

Infection Prevention & Control Annual report 2014-15
Page 29/53
were incidences where high risk antibiotics had been prescribed to patients with risk factors although this appeared to have been a risk assessed decision with the infection to be treated being the highest priority such as Pneumonia for example. GP Feedback System In response to the loss of the Audit and Surveillance nurse post a system to investigate and learn from C.diff cases in the community was set up with the Medicines optimisation team over the last 2 years. Kathryn Wisner, Pharmaceutical Advisor, Medicines Optimisation, NHS Kernow worked with the Nurse Consultant to inform GPs about each case of C diff in a timely manner and ask them to provide information about other possible contributory factors, such as recent hospital admissions and prescribed medication. This initial phase was used with the 77 cases in Cornwall between September 2013 & March 2014 After phase one of the project limitations were identified: Many of the forms were completed by members of practice staff other than a doctor, therefore the system has possibly not allowed prescribers to reflect on the contributory factors. In some cases one of the Prescribing Support Technicians from the Medicines Optimisation team visited the practice to complete the feedback. Insufficient detail was given around prescribing choices to enable conclusions to be drawn about consideration being given to risk factors. The second phase, rolled out during 2014-15, progressed to requesting evidence of reflection by prescribers on each C diff case. This aimed to allow anonymous sharing of the learning points and actions agreed within practices. The use of a significant event audit (SEA) for cases of Clostridium difficile was encouraged in line with the expectation of the current commissioner of primary care services NHS England. Phase 2 ran from September 2014 to February 2015: forms were sent to GPs for all 78 cases (including hospital diagnosed) and a positive completion rate of 76% was recorded. Evaluation again revealed limitations of the approach. Very few GPs reported having undertaken an SEA. Minimal learning was reported and no shareable learning reported. Some inappropriate comments indicated misunderstandings about the infection. Conclusions The evaluation of the second phase of the GP feedback system concluded that the epidemiological data collected is predictable for the most part and does not contribute to prevention strategies at this time. Requests for information and reflection show no evidence of having stimulated improved understanding, it is noted that although there were 78 cases in the phase 2 period there are 70 GP practices in Cornwall and this infection remains a relatively rare event for each.
Infection Prevention & Control Annual report 2014-15
Page 30/53
Next Steps The plan for 2015-16 is to restrict communications with GPs to those cases identified in either patients diagnosed with 3 days of an admission or those diagnosed at home (own home or care home). The hope is that an SEA template designed in collaboration with NEW Devon CCG will be used. This template represents a guided review and gives specific questions relevant to this infection and the risk factors involved. NHS England are the commissioners of primary care and the SEA process is something normally overseen by that organisation; negotiations are underway at the time of reporting to secure a mandate to proceed. As a contingency the template could be reformatted as a local survey but the preferred option would be to progress as an SEA which raises the profile of the infection.
Infection Prevention & Control Annual report 2014-15
Page 31/53
MSSA & Ecoli bacteraemia
Root cause analysis of these infections is carried out in both acute and community settings. RCHT reported 28 cases of MSSA bacteraemia in 2013-14, double the count of the previous year. Actions were identified in the RCHT 2014-15 programme of work to target this infection and improvements have been made to ANTT15 training. The use of screening was considered but a decision was made to use skin washes in high risk areas instead. Chlorhexidine washes are now used daily in critical care and oncology wards. A business case for an IV team has been submitted but not yet approved therefore this action has been carried over to 2015-16. There is also more work to do in engaging multidisciplinary involvement in root cause analysis and assurance needs to be gained that learning is being considered at divisional level. A 17% reduction in MSSA cases has been reported by RCHT and this is a positive endorsement of the investigation and learning process. An internal review of Ecoli themes has been conducted in PCH and the report is awaited at the time of writing. RCHT review risk factors and likely source of infections occurring after 48hours of admission. The urinary tract remains the most common likely source. Plans to evaluate themes during DIPC meetings did not materialise for these infections during 2014-15 however a formal system has been devised for use in 2015-16.
Evidence Log
The evidence log has been maintained for the last two years and contains around a hundred documents aiming to capture the underpinnings of current thinking and strategies.
Whole System Planning
Norovirus
The Cornwall & Isles of Scilly Whole Systems Norovirus Plan was updated as usual during 2014-15. This is done during the summer months and takes into account any learning or changes made following debriefs of the previous winter. Consultation extends to the Resilience groups and sign off is by the Local Directors of Infection Prevention & Control (DIPC) Group. Updates already being listed for the 2015-16 review include:
Clarity of responsibilities between providers, commissioners, local authority and Public Health England.
Terms of reference for outbreak overview
Improved guidance for onward care teams
Guidance for end of life care in outbreak scenarios
15
ANTT
Infection Prevention & Control Annual report 2014-15
Page 32/53
Cdiff
The Clostridium difficile plan was updated in September 2014 to capture the adoption of probiotics in RCHT. Updates already being listed for 2015-16 include;
Reference to the lapse in care assessments
Change in probiotics to be offered to high risk cases in PCH
Monitoring of GDH clusters - Glutamate dehydrogenase (GDH) EIA tests detect the presence of an antigen that is produced in high amounts by C. diff. GDH is present in both toxin producing and non-producing C. diff so gives an indicator of carriage in addition to confirmed toxin producing reported cases. Periods of increased incidence of GDH positive cases will be subject to an intervention likely to include deep cleaning and review of best practice.
PCH review of Proton pump inhibitor review guidance.
MRSA
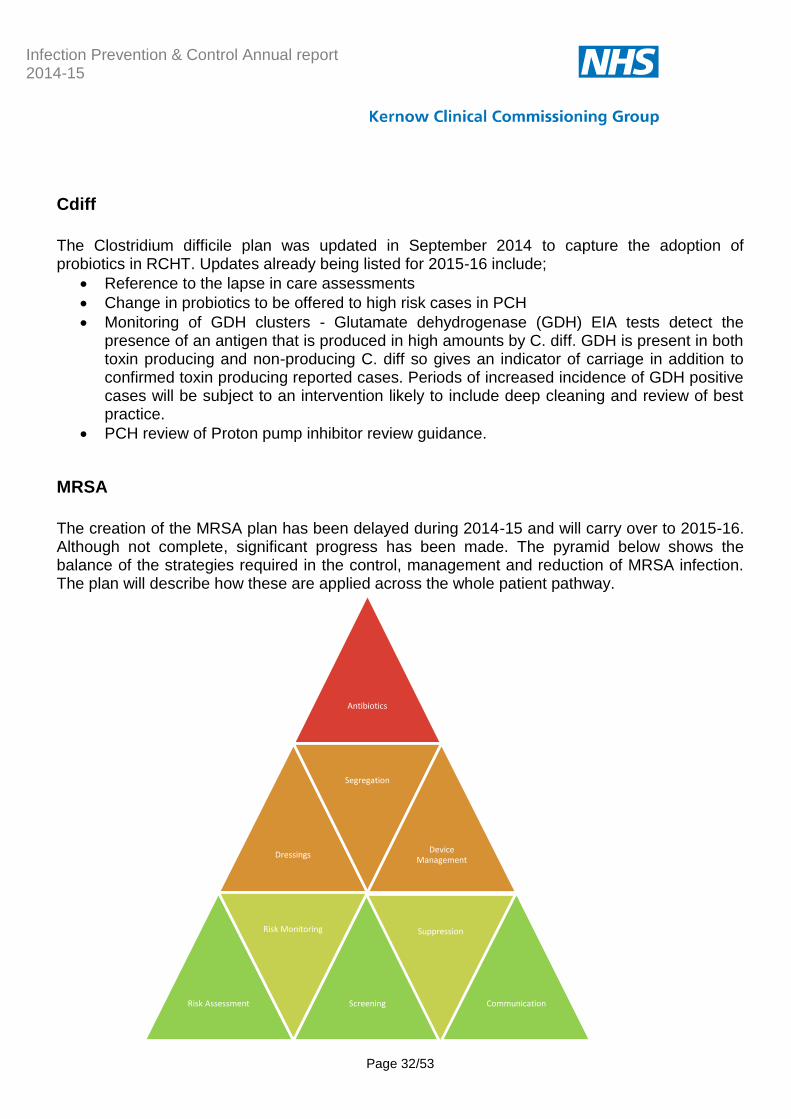
The creation of the MRSA plan has been delayed during 2014-15 and will carry over to 2015-16. Although not complete, significant progress has been made. The pyramid below shows the balance of the strategies required in the control, management and reduction of MRSA infection. The plan will describe how these are applied across the whole patient pathway.
Antibiotics
Dressings
Segregation
Device Management
Risk Assessment
Risk Monitoring
Screening
Suppression
Communication
Infection Prevention & Control Annual report 2014-15
Page 33/53
CPE
Acute trust toolkit for the early detection, management and control of carbapenemase-producing Enterobacteriaceae’ 16 (CPE) was published in December 2013. The toolkit is intended to guide clinicians and infection, prevention and control (IP&C) staff in the assessment of risks to their patients from carbapenemase-producing Enterobacteriaceae. The focus is on early detection and early instigation of IP&C measures to quickly prevent and control spread. Additionally, the toolkit provides supporting materials and information for trust boards to develop a contingency plan and prepare their own policy. RCHT are following this toolkit and have developed risk assessment for this infection. It is already apparent that isolation facilities would not be sufficient to accommodate patients whilst waiting for test result to be confirmed. This infection appears, as last year, to be rare at local level at the time of reporting. A toolkit for non-acute care settings, which will include care homes, was expected but has not yet been published. The Department of Health have set a target of reducing carbapenem consumption to 2009/10 levels by 2018/19. This means a reduction by half for RCHT.
Ebola
NHS Kernow has been involved in the overall health community assurance mechanism relating to UK preparedness for possible cases of Ebola virus disease. There are a number of local, regional and national agencies involved in this process and roles overlap to a certain extent. An assurance meeting was held on November 27th to collate the progress made in various areas and identify gaps. Providers responded to national requirement to prepare for possible cases by:
Identifying areas in all of the admitting areas to hold patients if required.
Training staff in the donning and doffing of protective clothing.
Additional works to the isolation ward at RCHT were completed to allow them to close a section of the ward off in the event they needed to use this.
Mask fit training renewed. Infection Control Risk Assessments were underpinned by the following facts: 1. It is not a robust virus and is readily inactivated e.g. by alcohol or soap and water. 2. It is transmitted via contact with body fluids. No evidence of airborne (aerosol-mediated) transmission.
16
CPE Toolkit
Infection Prevention & Control Annual report 2014-15
Page 34/53
3. Patients are not infectious until they are symptomatic. 4. Patients become more infectious as their disease progresses. The risk of transmission through casual contact with a mildly ill patient is low. However, high concentrations of the virus may occur in diarrhoeal stool and vomitus and the clinical environment can become very highly Contaminated. Plans were tested by the event of suspected cases none of whom were actually infected.
Improvement Evaluation
Ensuring evaluation is a planned section of infection prevention activity can be challenging. Working with a phased project methodology such as the work described in the section above on GP feedback relating to Clostridium difficile does facilitate this more easily. The use of the whole system plans gives an opportunity to evaluate strategies in use and capture rationale for change. Sharing action themes (planned for 2015-16) provides an opportunity to evaluate learning. Surveillance evaluates outcomes and indicates if reductions are sustained. In most years there are a combination of gains and losses in terms of prevention resource, practice, policy and outcomes and prevention itself can be difficult to quantify and therefore evaluate. In that sense this whole report is a tool for evaluation and this heading is included to continue to provide the challenge to address evaluation.
Norovirus
Norovirus improvements can be difficult to evaluate and sustain due to the pattern of this infection which typically fluctuates with increased activity following the appearance of new strains. 2014-15 has seen increased activity on the previous year for Noro as the graph below from Public Health England shows. Regular reports of activity are published by PHE.17
17
PHE Noro Reports

Infection Prevention & Control Annual report 2014-15
Page 35/53
All reports of Infectious Intestinal Disease outbreaks (suspected or laboratory confirmed) by setting, Devon Cornwall Somerset (DCS), 2013 week 27 to 2015 week 18
The graph below shows outbreaks notified by care homes schools and others (hotels for example) and outbreaks in hospital where a ward closure was required. A winter peak and Easter peak can be seen in both graphs.
The impact of Norovirus activity has been significant in a time period where system resilience has been fragile and two black alerts have been declared in relation to limited capacity.
Infection Prevention & Control Annual report 2014-15
Page 36/53
RCHT published a full report following their winter outbreak and the recommendations have been added to those collected from previous outbreak, this forms a checklist which is completed each time a significant outbreak is reported.
Norovirus Outbreak Overview
Norovirus is unique in that whilst bringing major disruption it does not attract the formation of an official multiagency outbreak control team . A weekly overview teleconference has been set up to fill the gap and feed assurance into local operations and resilience groups.
Antimicrobial Stewardship Antibiotics are substances that kill or interfere with the growth of microorganisms, especially bacteria. Not all microorganisms are susceptible to all antibiotics. Microorganisms which are not killed or inhibited by an antibiotic are called "antibiotic resistant. Antimicrobial resistance (AMR) is a global public health issue driven by the overuse of antimicrobials and inappropriate prescribing. The increase in resistance is making antimicrobial agents less effective and contributing to infections that are hard to treat. The number of infections due to multi-drug resistant organisms is growing however; the number of new antibiotics in the pipeline is extremely limited.18 Guidance within the Hygiene Code states that; “Procedures should be in place to ensure prudent prescribing and antimicrobial stewardship. There should be an on-going programme of audit, revision and update. In healthcare this is usually monitored by the antimicrobial management team or local prescribing advisors. 2014-15 has seen an increase in profile of the AMR agenda building on the publication of the UK 5 year strategy at the end of 2013. The challenge set in 2014 for Longitude Prize19 is to create a cheap, accurate, rapid and easy-to-use point of care test kit for bacterial infections.
DIPC Role
Antimicrobial stewardship is a key element of the DIPC role and this report as previous annual reports has collated information from across the health community on this subject. The Nurse Consultant works closely with the CCG Medicines Optimisation Team and links with the antimicrobial pharmacy leads in RCHT and PCH.
UK Strategy
During 2013-14 the Department of Health published the UK Five Year Antimicrobial Resistance Strategy20 Which opens by reminding us that: “There are few public health issues of greater
18
Antimicrobial prescribing and stewardship competencies. 19
Longitude Prize
Infection Prevention & Control Annual report 2014-15
Page 37/53
importance than antimicrobial resistance (AMR) in terms of impact on society. This problem is not restricted to the UK. It concerns the entire world and requires action at local, national and global level. AMR cannot be eradicated but a multi-disciplinary approach involving a wide range of partners will limit the risk of AMR and minimise its impact for health, now and in the future. The overarching goal of the Strategy is to slow the development and spread of AMR. It focusses activities around 3 strategic aims: • improve the knowledge and understanding of AMR, • conserve and steward the effectiveness of existing treatments, • stimulate the development of new antibiotics, diagnostics and novel therapies. The measures21 agreed by the UK antimicrobial resistance strategy High Level Steering Group, taking advice from expert scientific advisory committees cover 4 areas:
trends in resistance quality of prescribing in primary and secondary healthcare settings public and professional knowledge and understanding of antimicrobials and their
appropriate use. global security through ensuring global alignment in addressing AMR
These measures apply equally to human and animal health. A progress report22 published in December 2014 listed achievement as:
establishing baseline data to improve the way we monitor antibiotic prescribing and trends in resistance
publishing antimicrobial prescribing quality measures
launching an ‘antibiotic guardian’ campaign
improving the coordination of research into AMR
leading the development of a new World Health Organization resolution on AMR
establishing an independent review on AMR
AMR systems maps
The aim of producing an antimicrobial resistance (AMR) systems map23 is to provide a broad overview of the factors influencing the development of antimicrobial resistance and the interactions between them rather than detailed consideration of individual factors or infectious agents. Follow the link at footnote 22 to view the complex maps produced.
20
UK Antimicrobial Resistance Strategy 2013-2018 21
UK AMR Strategy measuring success 22
AMR strategy progress report 23
AMR systems map
Infection Prevention & Control Annual report 2014-15
Page 38/53
Local Strategy
The Cornwall Antimicrobial Resistance Group was set up in response to the national 5 year strategy and has been recognised as a best practice format by the Department of Health with a membership encompassing a wide range of agencies. The group has identified work streams as;
Education and Engagement with the Public
Education and Engagement with Healthcare Workers & Vets
Comprehensive Stewardship Programme for All Sectors Kathryn Wisner from the NHS Kernow Medicines Optimisation Team represented the group at a national study day held in March 2015 and gave a presentation about the composition and work of the group.
Local activity to support European Antibiotic Awareness Day in 2014 increased to capitalise on the raised profile. Competitions and awareness raising activities were held in RCHT. Leaflets and posters were produced and circulated to GP surgeries community hospitals, pharmacies, children’s’ centres, libraries. Radio interviews were given by NHS Kernow staff, RCHT and the local authority and press releases picked up by local newspapers.24 Links were sent out to quizzes and crosswords for the public to GP practices and also video clips for use in waiting areas. An evaluation was held by the organisers and publication is awaited. Cornwall residents made up 2% of the registered ‘Antibiotic Guardians’.
24
EAAD press
Infection Prevention & Control Annual report 2014-15
Page 39/53
Prescribing Compliance
A system of auditing the prescribing of antimicrobials is in place across the health community. Antimicrobial pharmacists use a standard point prevalence methodology enabling comparison with the South West Regional data for each question. Usually audits are undertaken twice a year and measure the percentage of patents taking antibiotics on the given day and the dose, route and length of course. The indication for the prescription is expected to be explicit and the choice of drug to be in line with the current guidance

© Kernow Clinical Commissioning Group
Audit Results The table below shows the rated results of antimicrobial prescribing audits at RCHT. Nine years of stewardship work has been required to reach the required standard shown. Electronic prescribing has brought with it opportunities to improve stewardship.
The following strategies are used within RCHT to improve and sustain antimicrobial stewardship:
Mar-06 Nov-06 Feb-08 Mar-09 Aug-09 Feb-10 Oct-10 Feb-11 Oct-11 Mar-12 Nov-12 Mar-13 Mar-14 Mar-15
Is the dose ok?
Is the route
appropriate?
Has a course
length and/or
review date
been stated?
Is indication
documented?
Does this
comply with
Trust ABX
guidelines?
Microbiologists authorisation code Reviewed antibiotic guidelines Antibiotic app Antimicrobial stewardship care bundle Education sessions to medical staff Weekly league table Escalation process for repeated non-compliance Care bundle for the management of community acquired pneumonia.
Six weekly audit cycles capturing individual prescriber performance with indication and stop or review date documentation on the EPMA system. Individual emails are sent to doctors detailing their performance with a reminder of the Trust 95% standard. Those scoring less than 75% are invited to attend an antimicrobial stewardship education session led by the Medical Joint DIPC.
© Kernow Clinical Commissioning Group
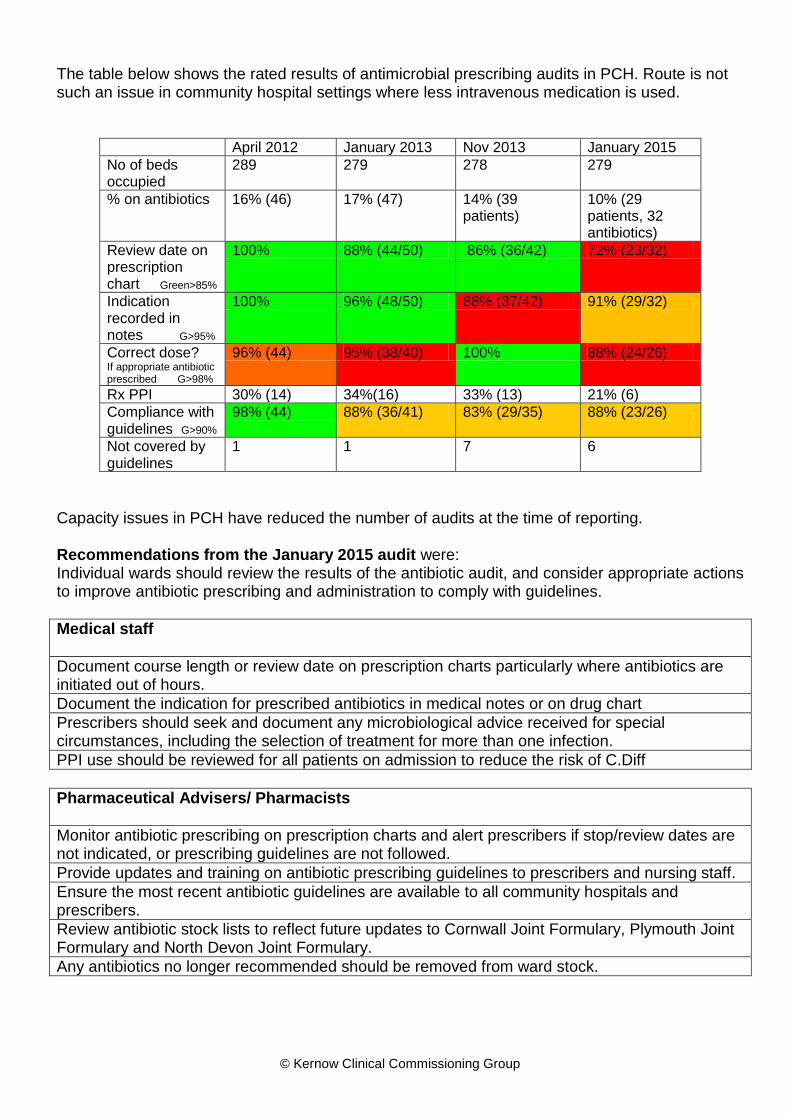
The table below shows the rated results of antimicrobial prescribing audits in PCH. Route is not such an issue in community hospital settings where less intravenous medication is used.
April 2012 January 2013 Nov 2013 January 2015
No of beds occupied
289 279 278 279
% on antibiotics 16% (46) 17% (47) 14% (39 patients)
10% (29 patients, 32 antibiotics)
Review date on prescription chart Green>85%
100% 88% (44/50) 86% (36/42) 72% (23/32)
Indication recorded in notes G>95%
100% 96% (48/50) 88% (37/42) 91% (29/32)
Correct dose? If appropriate antibiotic prescribed G>98%
96% (44) 95% (38/40) 100% 88% (24/26)
Rx PPI 30% (14) 34%(16) 33% (13) 21% (6)
Compliance with guidelines G>90%
98% (44) 88% (36/41) 83% (29/35) 88% (23/26)
Not covered by guidelines
1 1 7 6
Capacity issues in PCH have reduced the number of audits at the time of reporting. Recommendations from the January 2015 audit were: Individual wards should review the results of the antibiotic audit, and consider appropriate actions to improve antibiotic prescribing and administration to comply with guidelines.
Medical staff
Document course length or review date on prescription charts particularly where antibiotics are initiated out of hours.
Document the indication for prescribed antibiotics in medical notes or on drug chart
Prescribers should seek and document any microbiological advice received for special circumstances, including the selection of treatment for more than one infection.
PPI use should be reviewed for all patients on admission to reduce the risk of C.Diff
Pharmaceutical Advisers/ Pharmacists
Monitor antibiotic prescribing on prescription charts and alert prescribers if stop/review dates are not indicated, or prescribing guidelines are not followed.
Provide updates and training on antibiotic prescribing guidelines to prescribers and nursing staff.
Ensure the most recent antibiotic guidelines are available to all community hospitals and prescribers.
Review antibiotic stock lists to reflect future updates to Cornwall Joint Formulary, Plymouth Joint Formulary and North Devon Joint Formulary.
Any antibiotics no longer recommended should be removed from ward stock.
Infection Prevention & Control Annual report 2014-15
Page 42/53
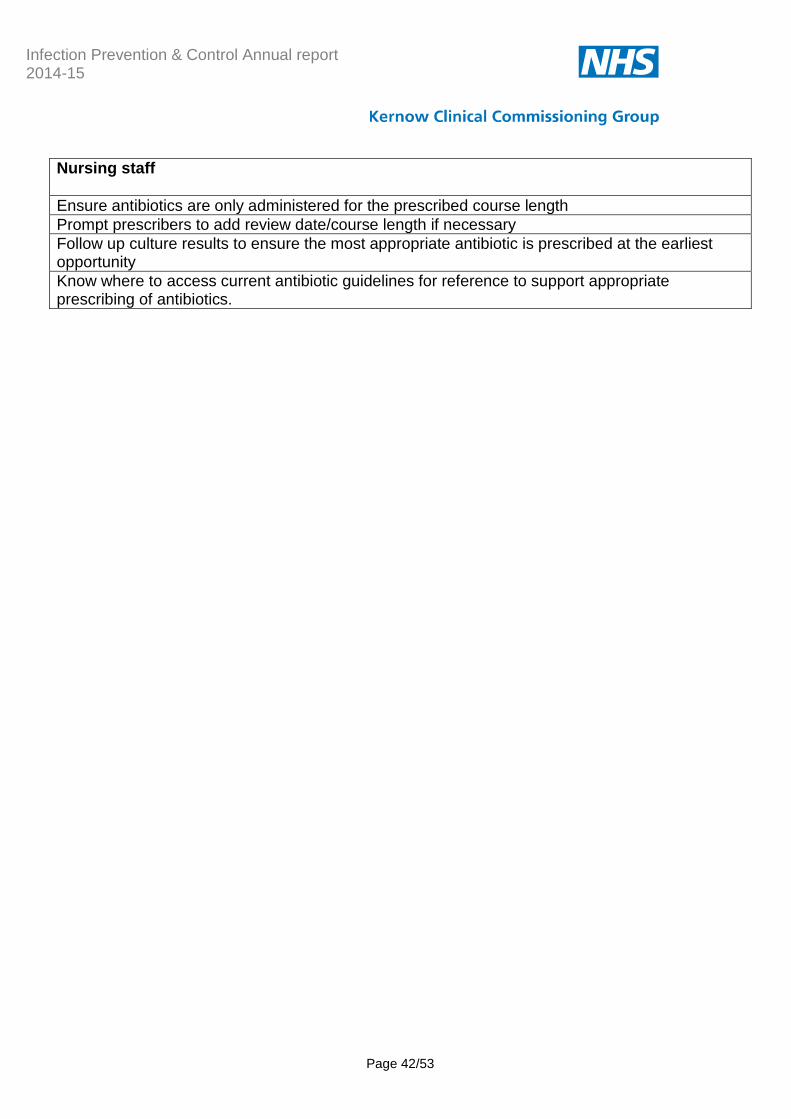
Nursing staff
Ensure antibiotics are only administered for the prescribed course length
Prompt prescribers to add review date/course length if necessary
Follow up culture results to ensure the most appropriate antibiotic is prescribed at the earliest opportunity
Know where to access current antibiotic guidelines for reference to support appropriate prescribing of antibiotics.

© Kernow Clinical Commissioning Group
Primary Care
2014-15 Incentive Scheme A two year strategy was proposed focussing on prescribing behaviour and competencies. Medicines optimisation produced a pack to assist practices in Cornwall with the implementation of the recommended strategies in the TARGET Antibiotics Toolkit25 in order to optimise their antibiotic prescribing. This aligned with the national AMR strategy to ensure that all prescribers meet the Antimicrobial Prescribing & Stewardship Competencies. It consisted of two parts: Part 1) Completion and review of the Primary Care Self-assessment Checklist to identify specific areas for discussion and implementation within the Practice. This assessment can be used as part of CQC Provider Compliance Assessment (PCA). The results of part one have been collected by Medicines Optimisation and are shown below.
Which of the key strategies from the toolkit do the practice feel has had the most impact on Antibiotic prescribing? 47% of practices found that the use of Delayed Antibiotic prescribing had an impact on reducing overall Antibiotic prescribing 40% of practices found that the use of the patient information leaflets had an impact on reducing overall Antibiotic prescribing 2% of practices found that none of the strategies within the toolkit had an impact on overall antibiotic prescribing or were unsure as to whether or not the strategies had made an impact 11% of practices noted on their report forms to have increased their use of the Local Antibacterial Guidelines
Other strategies which practices found to have an impact on overall Antibiotic Prescribing: 1. Educational videos being shown in the waiting room 2. Notices and leaflets readily available in the waiting room 3. Improved documentation on patients notes 4. Peer review of antibiotic prescribing 5. Regular antibiotic prescribing discussion 6. Antibiotic audits 7. Doctors explaining to patients the reasons why they have not been given an antibiotic for their presenting problem Has the practice noticed a reduction in patient expectation for antibiotics? • 39% of practices have noticed a reduction • 30% have seen no reduction • 31% were unsure if there has/hasn’t been a reduction
25
TARGET antibiotics toolkit
Infection Prevention & Control Annual report 2014-15
Page 44/53
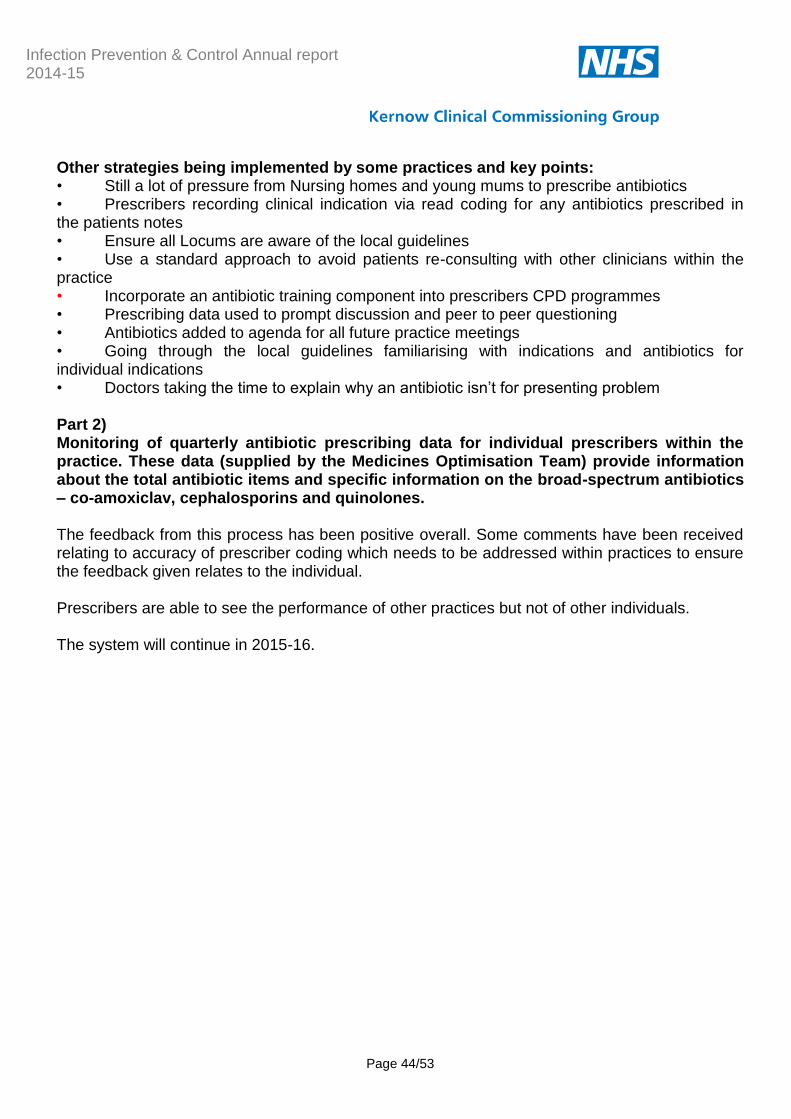
Other strategies being implemented by some practices and key points: • Still a lot of pressure from Nursing homes and young mums to prescribe antibiotics • Prescribers recording clinical indication via read coding for any antibiotics prescribed in the patients notes • Ensure all Locums are aware of the local guidelines • Use a standard approach to avoid patients re-consulting with other clinicians within the practice • Incorporate an antibiotic training component into prescribers CPD programmes • Prescribing data used to prompt discussion and peer to peer questioning • Antibiotics added to agenda for all future practice meetings • Going through the local guidelines familiarising with indications and antibiotics for individual indications • Doctors taking the time to explain why an antibiotic isn’t for presenting problem Part 2) Monitoring of quarterly antibiotic prescribing data for individual prescribers within the practice. These data (supplied by the Medicines Optimisation Team) provide information about the total antibiotic items and specific information on the broad-spectrum antibiotics – co-amoxiclav, cephalosporins and quinolones. The feedback from this process has been positive overall. Some comments have been received relating to accuracy of prescriber coding which needs to be addressed within practices to ensure the feedback given relates to the individual. Prescribers are able to see the performance of other practices but not of other individuals. The system will continue in 2015-16.
Infection Prevention & Control Annual report 2014-15
Page 45/53
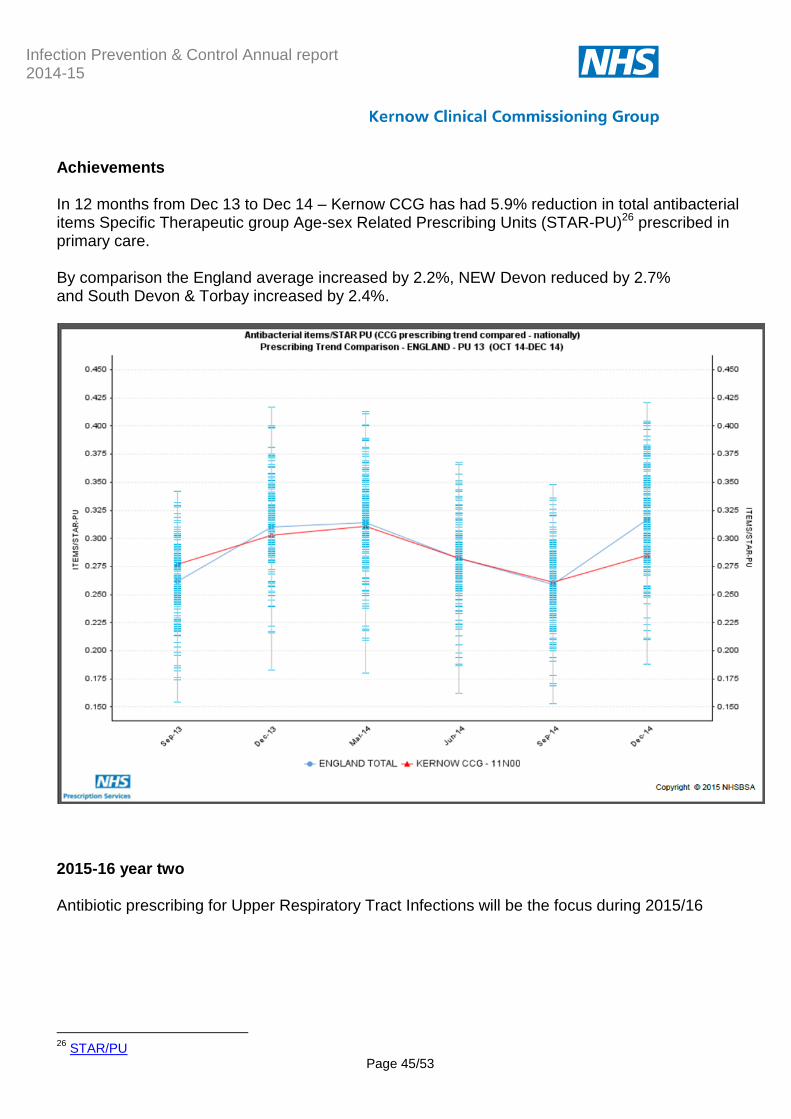
Achievements In 12 months from Dec 13 to Dec 14 – Kernow CCG has had 5.9% reduction in total antibacterial items Specific Therapeutic group Age-sex Related Prescribing Units (STAR-PU)26 prescribed in primary care. By comparison the England average increased by 2.2%, NEW Devon reduced by 2.7% and South Devon & Torbay increased by 2.4%.
2015-16 year two
Antibiotic prescribing for Upper Respiratory Tract Infections will be the focus during 2015/16
26
STAR/PU
Infection Prevention & Control Annual report 2014-15
Page 46/53
Key messages The majority of upper respiratory tract infections (URTIs) are ‘self-limiting’. Patients should be encouraged to first treat themselves or their children by seeking appropriate advice from one of the local pharmacies. Key initial actions: 1. At a practice meeting for all staff, including receptionists, discuss a multidisciplinary approach to ensure consistent, positive, evidence-based messages about URTIs are provided to patients at each point of contact – ( key messages and patient leaflets via TARGET website27: ) 2. Encourage all prescribers to READ code for URTIs. 3. Print off NICE Clinical Guideline 69 care pathway for RTIs for each prescriber and ensure a copy is available for reference in all consultation rooms. 4. Liaise with local pharmacies so that their staff are aware of the key messages being promoted about URTIs and that the practice will be encouraging patients to consult them for appropriate self-care treatments.
Education
Courses previously provided to General Practice staff were discontinued in 2013-14 as commissioning moved to NHS England. This sector is still without a solution for infection prevention control advice and training and the changes within NHS England South (SW) have reduced the capacity in that organisation. The Nurse Consultant maintains links with practice nurses who frequently request advice; resources such as guidance documents leaflets and posters have been shared. Discussions have been held in 2014-15 and a plan made to create a network for practice nurses as a forum for infection prevention & control updating this will progress during 2015-16. Links are also maintained with local nurses who provide education privately to care homes, again resources are shared and advice given to maintain a standard approach. In 2014-15 the Care Collaborative launched the operating standards for care homes and a standard for infection prevention and control was included this has already been updated for 2015-16.
27
Target
© Kernow Clinical Commissioning Group
Conclusion
The Cornwall population have seen increases in 2014-15 in MRSA bacteraemia, MSSA bacteraemia, Clostridium difficile and Norovirus and a reduction in Ecoli bacteraemia. Reductions have been achieved in hospital infections. Investigation processes are improving in particular for Clostridium difficile where a powerful link with antimicrobial stewardship is made. The links between HCAI reduction and the reduction of antimicrobial prescribing are set to strengthen. New work around Sepsis reduction has been included. This report has described the infection prevention activity of the CCG and collaborative work across the health community.
Appendices Appendix A shows the 2015-16 programme of work for NHS Kernow infection prevention and control. This is a summary of the programmed work for 2015-16.
Glossary
Abbreviations
ANTT – Aseptic non touch technique CPT – Cornwall Partnership Foundation Trust CQC – Care Quality Commission DIPC – Director of Infection Prevention & Control HCAI – Healthcare Acquired Infection HPA – Health Protection Agency MRSA – Meticillin resistant Staphylococcus aureus PCH – Peninsula Community Health PCT – Primary Care Trusts PHNT/PHT – Plymouth Hospitals Trust PHE – Public Health England PPI – Proton Pump Inhibitor RCHT – Royal Cornwall Hospitals Trust YTD – Year to date
Infection Prevention & Control Annual report 2014-15
Page 48/53
Clostridium difficile
Clostridium difficile (also known as ' C. difficile' or 'C. diff’) is a bacterium that can be found in the intestine. It is found in about 3% of adults and two-thirds of babies without causing any symptoms. Clostridium difficile causes diarrhoea (mild to severe) and, unusually, life-threatening inflammation of the intestines. Other symptoms can include fever, loss of appetite, nausea and abdominal pain or tenderness. A person can become infected with Clostridium difficile if he/she ingests the bacterium. People who become infected with Clostridium difficile are usually those who have taken antibiotics, particularly the elderly and people whose immune systems are compromised. In most patients the treatment for Clostridium difficile infection is antibiotic therapy.28
Ebola29 Ebola virus disease (EVD) (formerly known as Ebola haemorrhagic fever) is a severe disease caused by a virus of the filovirus family, which occurs in humans and other primates. The largest outbreak to date is currently occurring in West Africa affecting primarily Guinea, Liberia and Sierra Leone. Needlestick exposures in research laboratory workers who subsequently became infected have been documented e.g. in England (1976), and Russia (2004). However, 2 similar exposures (in USA 2004, and Germany 2009) did not result in infection or illness. Ebola is believed to be zoonotic; however the natural reservoir is unknown, despite extensive investigations. Non-human primates have been a source of human infection however they are not thought to be the reservoir as they develop severe, fatal illness when infected. The incubation period of Ebola virus disease ranges from 2 to 21 days. The onset of illness is sudden, with fever, headache, joint and muscle pain, sore throat and intense weakness. This is then followed by diarrhoea, vomiting, rash, impaired kidney and liver function and stomach pain. Some patients may develop a rash, red eyes, hiccups, internal and external bleeding. Ebola haemorrhagic fever is fatal in between 50 to 90% of all clinically ill cases. Laboratory diagnosis must be carried out under maximum biological containment conditions. There is no specific treatment or vaccine available for Ebola virus disease; however potential new vaccines and drug therapies are being developed and tested. Patients require intensive supportive therapy To avoid person to person transmission of Ebola virus, great care needs to be taken when nursing patients, to avoid contact with infected bodily fluids.
Ecoli
Escherichia coli30 (commonly referred to as E. coli) is a species of bacteria commonly found in the intestines of humans and animals. There are many different types of E. coli, and while some
28
Clostridium difficile guidance. Public Health England. 29
Ebola

Infection Prevention & Control Annual report 2014-15
Page 49/53
live in the intestine quite harmlessly, others may cause a variety of diseases. The bacterium is found in faeces and can survive in the environment. The commonest infection caused by E. coli is infection of the urinary tract, the organism normally spreading from the gut to the urinary tract. E. coli is also the commonest cause of cystitis (infection of the bladder), and in a minority of patients the infection may spread up the urinary tract to the kidneys, causing pyelonephritis. Otherwise healthy patients in the community may develop cystitis, and patients in hospital who have catheters, or tubes, placed in the urethra and bladder are also at risk. E. coli is also present in the bacteria that cause intra-abdominal infections following leakage from the gut into the abdomen, as for example with a ruptured appendix or following traumatic injury to the abdomen. E. coli bacteria may also cause infections in the intestine. Diarrhoeal infections (intestinal) are caused by a group of E. coli known as 'enterovirulent' (harmful to the intestines). Overspill from the primary infection sites to the bloodstream may cause blood poisoning ( E. coli bacteraemia). In rare instances, E. coli may cause meningitis in very young children.
MSSA / MRSA
Staphylococcus aureus31 is a bacterium that commonly colonises human skin and mucosa (e.g. inside the nose) without causing any problems. It can also cause disease, particularly if there is an opportunity for the bacteria to enter the body, for example through broken skin or a medical procedure. If the bacteria enter the body, illnesses which range from mild to life-threatening may then develop. These include skin and wound infections, infected eczema, abscesses or joint infections, infections of the heart valves (endocarditis), pneumonia and bacteraemia (blood stream infection). Staphylococcus aureus also produces toxins, which if the bacteria contaminate incorrectly prepared food can cause food poisoning and have also been linked with toxic shock syndrome. Some strains also produce another toxin called PVL; these tend to cause more severe disease. Most strains of S. aureus are sensitive to the more commonly used antibiotics, and infections can be effectively treated. Some S. aureus bacteria are more resistant. Those resistant to the antibiotic meticillin are termed meticillin-resistant Staphylococcus aureus (MRSA) and often require different types of antibiotic to treat them. Those that are sensitive to meticillin are termed meticillin-sensitive Staphylococcus aureus (MSSA). MRSA and MSSA only differ in their degree of antibiotic resistance: other than that there is no real difference between them.32
30
E.coli. Public Health England 31
MRSA/MSSA 32
MRSA/MSSA guidance Public Health England
Infection Prevention & Control Annual report 2014-15
Page 50/53
Norovirus
Norovirus is the most common cause of infectious gastroenteritis (diarrhoea and vomiting) in England and Wales. The Illness is generally mild and people usually recover fully within 2-3 days. Infections can occur at any age because immunity does not last. The virus is easily transmitted from one person to another. It can be transmitted by contact with an infected person; by consuming contaminated food or water or by contact with contaminated surfaces or objects. The most common symptoms are nausea, vomiting and diarrhoea. Symptoms often start with the sudden onset of nausea followed by projectile vomiting and watery diarrhoea. However, not all of those infected will experience all of the symptoms. Some people may also have a raised temperature, headaches and aching limbs. Symptoms usually begin around 12 to 48 hours after becoming infected. The illness is self-limiting and the symptoms will last for 12 to 60 hours. Most people make a full recovery within 1-2 days, however some people (usually the very young or elderly) may become very dehydrated and require hospital treatment (or rehydration at home under supervision) Norovirus often causes outbreaks because it is easily spread from one person to another and the virus is able to survive in the environment for many days. There are many different strains of Norovirus, immunity is short-lived and infection with one strain does not protect against infection with another strain. Outbreaks commonly occur in semi-closed environments such as hospitals, nursing homes, schools and on cruise ships, where people are in close contact with one another for long periods.
.
© Kernow Clinical Commissioning Group
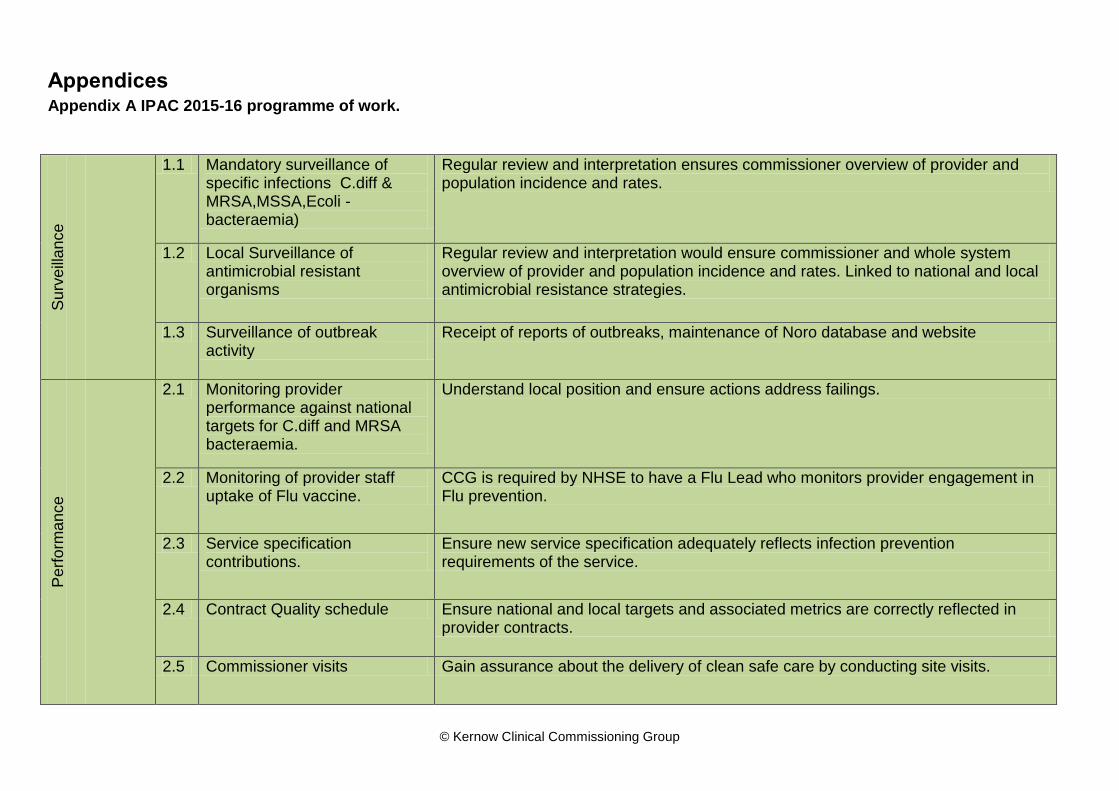
Appendices Appendix A IPAC 2015-16 programme of work.
Su
rveill
an
ce
1.1 Mandatory surveillance of specific infections C.diff & MRSA,MSSA,Ecoli - bacteraemia)
Regular review and interpretation ensures commissioner overview of provider and population incidence and rates.
1.2 Local Surveillance of antimicrobial resistant organisms
Regular review and interpretation would ensure commissioner and whole system overview of provider and population incidence and rates. Linked to national and local antimicrobial resistance strategies.
1.3 Surveillance of outbreak activity
Receipt of reports of outbreaks, maintenance of Noro database and website
Pe
rform
an
ce
2.1 Monitoring provider performance against national targets for C.diff and MRSA bacteraemia.
Understand local position and ensure actions address failings.
2.2 Monitoring of provider staff uptake of Flu vaccine.
CCG is required by NHSE to have a Flu Lead who monitors provider engagement in Flu prevention.
2.3 Service specification contributions.
Ensure new service specification adequately reflects infection prevention requirements of the service.
2.4 Contract Quality schedule Ensure national and local targets and associated metrics are correctly reflected in provider contracts.
2.5 Commissioner visits Gain assurance about the delivery of clean safe care by conducting site visits.

Infection Prevention & Control Annual report 2014-15
Page 52/53
Pe
rform
an
ce
2.6 Sepsis quality improvement National CQUIN
2.7 Reduce population C.diff National CCG C.diff objective is monitored in CCG assurance framework
2.8 Reduce population MRSA bacteraemia
National Zero tolerance expectation is monitored in CCG assurance framework
2.9 Reduce impact of outbreaks Ensure adequate collaborative provider response.
Inve
stiga
tio
n &
Le
arn
ing
3.1
Post Infection Reviews MRSA Mandatory surveillance system requires investigation and upload of result.
3.2
C.diff avoidability assessments National guidance directs that CCGs consider provider C.diff cases and remove those which can evidence unavoidability from the target trajectory.
3.3 MSSA bacteraemia case themes
CCG rates demonstrate failure to achieve reductions. Focus required to understand themes and develop reduction strategies.
Wh
ole
Syste
m
Pla
nn
ing
4.1 Update Noro Plan Whole System Noro Plan in place since August 2011, updated annually
4.2 Update C.diff Plan Whole System C.diff plan approved in May 2014 for update 2015
4.3 Create MRSA Plan MRSA case investigation has shown that prevention strategies in some settings have lapsed. Plan drafted in 2014 for completion in 2015.
4.4 Infection Prevention Joint Peninsula Strategy
To articulate links within the infection prevention agenda, clarify boundaries & joint aims. Draft from 2014 for completion in 2015.

Infection Prevention & Control Annual report 2014-15
Page 53/53
Wh
ole
Syste
m
Pla
nn
ing
4.5 Ebola Ensure CCG link into assurance processes
4.6 Sepsis Promote & participate in whole system collaboration to progress learning from Torbay Pilot.
4.7 AMR Promote & participate in whole system collaboration
Impro
ve
me
nt
Eva
lua
tio
n
5.1 Evaluating interventions and strategies
Ensure legacy knowledge is retained where strategies alter.
5.2 Build in evaluation phase to new projects
Ensure a structure is in place.
Ed
ucatio
n
6.1 Practice Nurse Network Set up network & biannual workshop
6.2 Website Develop resources on website.
6.2 Care Collaborative Identify opportunities to participate.