Embed Size (px)
Citation preview

Infant & Toddler Connection of Virginia
Results of FFY 2007Monitoring Indicators
For The Annual Performance Report &
State Performance Plan

2
Monitoring Indicator #1
Percent of infants & toddlers with IFSP’s who receive the early intervention services on their IFSP’s in a timely manner.Until June 30, 2008, timely initiation of services was defined as “within 21 calendar days from the date the IFSP is signed by the parent”Effective July 1, 2008, Virginia changed the definition of timely initiation of services to “within 30 calendar days from the date the IFSP is signed by the parent”

3
Indicator 1: Timely Initiation of Services
72
8189
100 100 100
0
20
40
60
80
100
120
November 1 2005 - June 30 2006 April 1 2007 - June 30 2007 April 1 2008 - June 30 2008
Monitoring Time Periods
Perc
enta
ge State Results
State Target

4
Indicator 1: Timely Initiation of Services by Service
86%
90%
93%
82%
84%
86%
88%
90%
92%
94%
November 1 2005 - June 302006
April 1 2007 - June 30 2007 April 1, 2008 - June 30, 2008
Monitoring Time Period
Perc
enta
ge State Results

5

6
Monitoring Indicator #2
Percent of infants & toddlers with IFSP’s who primarily receive early intervention services in the home or community settings.
(Primary Service Setting)

7
Indicator 2: Primary Service Setting
99
99.40
99
98.425 98.425 98.425
97.8
98
98.2
98.4
98.6
98.8
99
99.2
99.4
99.6
December 1 2005 December 1 2006 December 1 2007
Monitoring Date
Per
cent
age
State Results
State Target

8
Monitoring Indicator #3
Percent of infants and toddlers with IFSP’s who demonstrate improved:
Positive social-emotional skills (including social relationships);Acquisition and use of knowledge and skills (including early language/communication; andUse of appropriate behaviors to meet their needs.

9
Monitoring Indicator #4
Percent of families participating in Part C who report that early intervention services have helped the family:
Know their rights;Effectively communicate their children’s needs; andHelp their children develop and learn.

10
Indicator 4: Family OutcomesFamilies Participating in Part C Who Report That Early Intervention Services
Have Helped The Family:
67.20%
65.80% 66.10% 66.20%
64.70%
61.90% 62.30% 62.20%
77.50% 77.60% 77.50%78%
60.00%
65.00%
70.00%
75.00%
80.00%
2007 StateResults
2007 StateTarget
2008 StateResults
2008 StateTarget
A. Know Their Rights
B. Effectively CommunicateTheir Children's Needs
C. Help Their ChildrenDevelop and Learn

11
Monitoring Indicator #5
% of infants & toddlers birth to 1 with IFSP’s compared to other States with similar eligibility definitions.

12
Indicator 5: Child Find 0-1
0.51 0.53
0.70
0.620.65
0.7
0
0.1
0.2
0.3
0.4
0.5
0.6
0.7
0.8
December 1 2005 December 1 2006 December 1 2007
Monitoring Time Frame
Perc
enta
ge State Results
State Target

13
Year to Year Comparison of Targets Achieved for Indicator 5: 0-1
0.58
0.58
0.51
0.53
0.7
0 0.2 0.4 0.6 0.8
1-Dec-03
1-Dec-04
1-Dec-05
December 12006
December 12007
Mo
nit
ori
ng
Tim
e P
erio
d
Percentage
Target Achieved

14
Monitoring Indicator #6
% of infants & toddlers birth to 3 with IFSP’s compared to other States with similar eligibility definitions.

15
Child Find 0-3
1.72 1.781.921.9
2.052.20
0
0.5
1
1.5
2
2.5
December 1 2005 December 1 2006 December 1 2007
Monitoring Date
Per
ecen
tage State Results
State Target

16
Comparison of Annual Results for Indicator 6: Child Find 0-3
2.19
1.71
1.4
1.4
1.79
1.72
1.78
1.92
0 0.5 1 1.5 2 2.5
December 1 2000
December 1 2001
December 1 2002
December 1, 2003
December 1, 2004
December 1, 2004
December 1 2006
December 1 2007
Per
cen
tag
e
Monitoring Date
ResultsAchieved

17
Monitoring Indicator #7
% of eligible infants & toddlers with IFSP’s for whom an evaluation & assessment & an initial IFSP meeting were conducted within Part C’s 45-day timeline.

18
Indicator #7: 45-Day Timeline
98
96
98
100 100 100
949596979899
100101
April 1 2006 - June 302006
April 1 2007 - June 302007
April 1 2008 - June 302008
Year
Perc
enta
ge
State Results State Target

19
Mitigating Circumstances For Not Meeting 45-day Timeline
12%
84%
4%0%
50%
38%
12%
0%
10%
20%
30%
40%
50%
60%
70%
80%
90%
Chi
ld/F
amily
Ill
Fam
ilyS
ched
ulin
gP
refe
renc
e
Tem
pora
rily
Lost
Con
tact
Sev
ere
Wea
ther
/Nat
ural
Dis
aste
r
Pro
vide
rU
nava
ilabi
lity
Fost
er/S
urro
gate
Par
ent I
ssue O
ther
Mitigating Circumstances
Per
cent
age
2008

20
Monitoring Indicator #8
% of all children exiting Part C who received timely transition planning to support the child’s transition to preschool & other appropriate community services by their 3rd birthday including:

21
Monitoring Indicator #8 (cont.)
(a) IFSPs’ with transition steps & services;(b) Notification to the Local Education Agency (LEA), if child is potentially eligible for Part B;(c)Transition conference, if child potentially eligible for Part B.

22
Indicator 8A: Transition Steps and Services
86
96
99100 100 100
75
80
85
90
95
100
105
1/1/06 - 9/30/06 4/1/07 - 9/30/07 4/1/08 - 9/30/08
Monitoring Period
Per
cent
age
State Results
State Target

23
Indicator 8: Transition B. Notification to the Local Education Authority
89
93
100100 100 100
828486889092949698
100102
1/1/06 - 9/30/06 4/1/07-9/30/07 4/1/08 - 9/30/08
Monitoring Period
Perc
enta
ge State Results
State Target

24
Indicator 8: Transition C. Transition Conference
87
9596
100 100 100
80
85
90
95
100
105
1/1/06-9/30/06 4/1/07 - 9/30/07 4/1/08 - 9/30/08
Monitoring Period
Per
cent
age
State Results State Target

25
Justifications Why Transition Conference Did Not Occur in Timely Manner: 2008
5%
66%
29%
37%
21%
42%
0%
10%
20%
30%
40%
50%
60%
70%C
hild
/Fam
ilyIll
Fam
ilySc
hedu
ling
Pref
eren
ce
Late
Ref
erra
lTo
Par
t C
LEA
Sche
dulin
gD
iffic
ultie
s
SC/P
art C
Rep
Sche
dulin
gD
iffic
ultie
s
No
Rea
son
Doc
umen
ted
Justifications
Perc
enta
ge
Justification

26
State Reported Data: Indicator 14 Timely and Accurate Data
83
87
100
100
100
100
0 20 40 60 80 100 120
7/1/06 -6/30/06
7/1/06 -6/30/07
7/1/07 -6/60/08
Yea
r
Percentage
State Target
State Results

Proposed Changes in State Targets

28
Indicator 2: Percent of infants and toddlers with IFSPs who primarily receive early intervention services in the home or programs for typically developing children
Performance to Date: 99% in FFY 2005, FFY 2006, FFY 2007 Proposed Changes to State Targets: Indicator 2 Primary Service Setting
98.425 98.425 98.425
98 98 98
97.7
97.8
97.9
98
98.1
98.2
98.3
98.4
98.5
FFY 08 FFY 09 FFY 2010
Year
Perc
en
tag
e
Targets Identif ied in SPP
Proposed New Targets

29
Indicator 6: Percent of infants and toddlers, birth to three, served in Part C
Performance to Date: 1.79%, 1.72%, 1.78%, 1.92% (in FFY 2004 to FFY 2007, respectively)
Proposed Changes to State Targets: Indicator 6 Child Find 0-3
2.452.7
3
2.12.3
2.6
0
0.5
1
1.5
2
2.5
3
3.5
FFY 08 FFY 09 FFY 2010
Year
Percen
tag
e
Targets Identified in SPP
Proposed New Targets

Improvement Activities
31
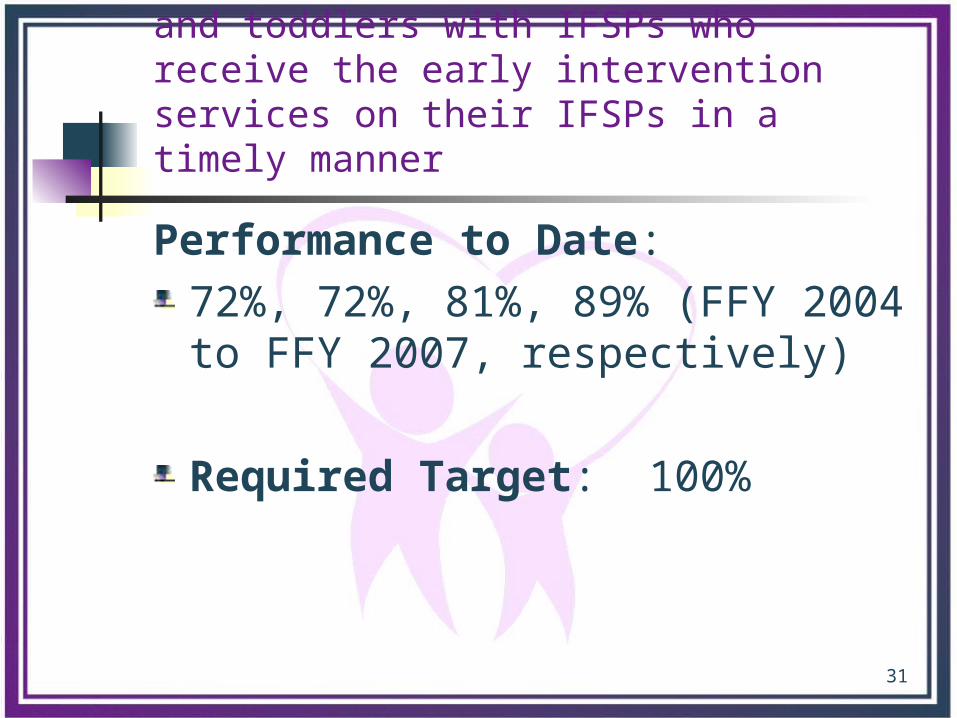
Indicator 1: Percent of infants and toddlers with IFSPs who receive the early intervention services on their IFSPs in a timely manner
Performance to Date: 72%, 72%, 81%, 89% (FFY 2004 to FFY 2007, respectively)
Required Target: 100%

32
Improvement ActivitiesTA and follow-up to local corrective action plans Explore, implement new strategies for recruiting and retaining personnelImplement revised family cost share practicesAdd data elements to ITOTS Collaborate with DMAS to move reimbursement for Part C under EPSDT Finalize the Part C Practice ManualImplement Virginia’s Part C Service Pathway statewide
Address evidence-based practice related to service delivery in new training requirements associated with the EI certification processImplement Part C practitioner database Finalize and implement the revised allocation methodology for disseminating federal and State Part C funds to local systemsInclude Virginia’s definition of “timely” in State Part C regulationsRevise the State Interagency Agreement for Part C

33
Questions?