Embed Size (px)
Citation preview

Scientific Bulletin Series: Mathematical Modelling in Civil Engineering, no.1/2008 5
Inertial Damping at Systems with Additional Mass Using Electric Extensometry
Abstract: In the civil engineering domain it is desirable to implement some innovative solutions of structural control to reduce the effects of special actions such as seismic or wind action over flexible structures.. Tuned mass dampers can be classified as a part of those solutions. Those systems presume that a certain additional mass is attached to the main structure. The dampening system has the dynamical characteristics tuned to the main system. This study puts forward an experimental observation of the inertial dampening capacity at free vibration of two systems, a SDOF system and a Three-DOF system, endowed with an additional mass. Furthermore,, some practical and theoretical aspects of beam deflection determination using electro extensometry method are presented.
Cristian Ghindea, assistant professor. eng., Technical University of Civil Engineering of Bucharest, Strength of Materials Department, e-mail: [email protected] Nicolai Ţopa, consulting professor dr. eng., Technical University of Civil Engineering of Bucharest, Strength of Materials Department
1. Introduction
For seismic protection design, as an alternative to the classical design system, considering that the structure dissipates energy by the appearance of plastic hinges, it is desirable to implement some innovative solutions of structural control. Tuned mass dampers can be classified as a part of those solutions. Theoretically, a tuned mass damper is made from a mass, a spring and a damper attached to a structure to reduce the dynamic response. The damper vibration frequency is tuned with the fundamental vibration frequency of the structure in this way the damper will vibrate in opposite phase with the main system. The energy is dissipated by the damper inertial force acting on the structure. To strengthen the intuitive assumption of the inertial damping a simple experimental test was made, starting from the idea of an additional mass working in antiphase with the main system. The target was the response characterization of a SDOF system, and of a Three-DOF, respectively, at free vibration, in two cases:
- Main system without additional mass; - Main system with additional mass (different sizes were used) attached to it
One of the test problems was the way to make a real-time record of the oscillations for an accurate comparison between the two cases. To overrun the problem the electric extensometry was used. This method isn’t new, but the computational system development in data processing and analyzing supplies new ways to use this method in various domains as construction industry, machine construction industry, aeronautical technique, even in medicine.
2. Equipment Presentation and Experimental Methods As it is known, the electric extensometer in made theoretically from a deformation transducer (strain gages) and an amplification system (Wheatstone bridge)[1].

6 Scientific Bulletin Series: Mathematical Modelling in Civil Engineering, no.1/2008
The entire measuring chain was realized with equipment made by Hottinger Baldwin Messtechnik GmbH (Germany). Strain gages selection was made with respect to the main system base material and to the necessity that the deformation value to be close to a point-like value not to an average value on a relatively small length of the beam. The used strain gages were of type 1-LY11-6/120, having 6 mm effective length of the measurement grid and a resistance of 120 Ω.
Fig. 2.1 Data acquisition system SPIDER 8 [2] The connection between the transducers and the computer which records and analyzes the obtained data is made through a data acquisition system, type „SPIDER 8” (figure 2.1). This can be endowed with 8 measurement channels providing excitation for strain gauges, force, displacement, temperature transducers and others. Eight such devices can be linked, in this way 68 channels can be measured with the same time step reference. The advantage of this equipment is that every measurement channel is provided with his own amplification system which automatically fills the experimental assembly to make a full Wheatstone bridge. Therefore, to perform a measurement the experimental assembly can be made in three ways: a quarter-bridge, a half-bridge and a full bridge. For the present experiment a simple assembly was made, using only a half-bridge system. This one was preferred versus the quarter-bridge system because of the automatic temperature correction (figures 2.2 and 2.3).
ε +Δt
εΔt
ε +εΔt
M M
Fig. 2.2 Strain gage assembly scheme Fig. 2.3 Temperature balancing scheme
After the automatic compensation of the Wheatstone bridge by “Spider 8”, the recorded strain value is:
( ) ( ) infsupinfsup εεεεεεε −=+−+= ΔΔ ttrec (2.1) If it is considered that
εεε =−= infsup (2.2) the recorded strain results independent of temperature variation tΔ
εε 2=rec (2.3)

Scientific Bulletin Series: Mathematical Modelling in Civil Engineering, no.1/2008 7
Finally, the measurement chain is completed with a computer which records and analyzes the obtained data. The interface between the data acquisition system and the computer is made by specialized software, “CATMAN Professional”, implemented by the German producer. Through “CATMAN Professional”, data were recorded in real-time, the software, beside the possibility to stockpile the results in different formats, has the capacity to make real-time graphical processing of the result or real-time transformation through user supplied functions. 3. Experimental Assembly 3.1. ExperimentalAassembly for SDOFSsystem The basic assembly of the experiment is shown in figure 3.1.1. The main structure was made from a steel element with square tube cross-section, fixed supported at one end, and at the other end having concentrated mass kgM 6.40 = . The load was of a type of an impulse followed by free vibration. Because of the necessity to keep the same action in all the cases, a mass ( kgm 0.2= ) was wire-hanged by a certain point of the beam The necessary impulse for the excitation of the system was obtained by cutting the wire.
a
a
Spider 8a-a
23 mm
23 m
m
3.5 mm
3.5
mm
1800 mm
M0=4.6kg
ma
mr=421g
Impulse application point
m=2.0 kg
400 mm
Fig. 3.1.1 Basic assembly of the experiment for the SDOF system
The additional system was composed of a spring with mass kgmr 421.0= and stiffness
cmkgkr / 2.0≈ and a variable concentrated mass. The generated actions ensured the elastic behavior of the steel element, the conversion between the measured strain and the cantilever free-end displacement had a linear character. The transformation was made automatically with “CATMAN” software using a transformation function, determined manually, using relations from the Strength of Materials. [3]
P
l0 l-l0
lMmax Mr
Δv
Fig. 3.1.2 Statically loaded cantilever beam

8 Scientific Bulletin Series: Mathematical Modelling in Civil Engineering, no.1/2008
Figure 3.1.2 shows the statically loaded cantilever beam corresponding to the after-impulse moment. The free-end displacement of the beam can be described by the following relation:
EIPl
v 3
3
=Δ (3.1.1)
where: P - the acting force at the free-end of the beam; l - the length of the beam ( mml 1800= ); 0l - the distance between the fixed support and the measurement point ( mml 0040 = ); E - modulus of elasticity for steel ( 24 101.2 cmkNE ×= ); I - moment of inertia of the cross-section ( 4 17858.75 mmI = ).
If we describe the stress in the measurement point related to the bending moment acting in the measurement cross-section it is possible to find a direct relation between load and stress:
( )W
llPWMr
r0−⋅
==σ (3.1.2)
where W is the strength modulus of the cross section of the beam ( 3 1552.935 cmW = ). From relation 3.1.2 we can extract the expression of the acting force on the beam (relation 3.1.3), which will be substituted in relation 3.1.1.
0llWP r
−⋅
=σ (3.1.3)
Because of the elastic behavior of the material, we can use the Hook’s law (relation 3.1.4) and define the transformation function between the measured strain ( rε ) and the free-end displacement (relation 3.1.5).
rr E εσ ⋅= (3.1.4)
( ) ( ) rrrv IlllW εεε ⋅=⋅
⋅−⋅⋅
=⋅⋅−⋅
⋅=Δ 120745.359
17858.754001800318001552.935
3
3
0
3
(3.1.5)
where the measurement unit for the recorded strain is mmmm .
The comparative results between the beam without and with additional mass, with different values, are shown in figures 3.1.3 to 3.1.8.
-15
-10
-5
0
5
10
15
0 5 10 15 20 25 30 35 40
timp (s)
Dis
plac
emen
t (m
m)
without additional mass with additional mass
M0=4600 gT = 0.355 sA0_max=11.87 mm (amplitudinea)Δst_max = 74.5 mm
Aa/A0=6.0/9.7=0.618
ma=322.8 gT = 0.425 s (0.385 s)Aa_max=10.544 mm (amplitudinea)Δst_max = 83.0 mm
Fig. 3.1.3 Free-end displacement amplitude for an additional mass gma 8.322=

Scientific Bulletin Series: Mathematical Modelling in Civil Engineering, no.1/2008 9
-15
-10
-5
0
5
10
15
0 5 10 15 20 25 30 35 40
timp (s)
Dis
plac
emen
t (m
m)
without additional mass with additional mass
M0=4600 gT = 0.355 sA0_max=11.87 mm (amplitudinea)Δst_max = 74.5 mm
Aa/A0=5.55/9.7=0.572
ma=460 gT = 0.46 s (0.395 s)Aa_max=10.24 mm (amplitudinea)Δst_max = 84.68 mm
Fig. 3.1.4 Free-end displacement amplitude for an additional mass gma 460=
-15
-10
-5
0
5
10
15
0 5 10 15 20 25 30 35 40
timp (s)
Dis
plac
emen
t (m
m)
without additional mass with additional mass
M0=4600 gT = 0.355 sA0_max=11.87 mm (amplitudinea)Δst_max = 74.5 mm
Aa/A0=5.9/9.7=0.608
ma=501.7 gT = 0.68 s (0.39 s)Aa_max=10.29 mm (amplitudinea)Δst_max = 85.2 mm
Fig. 3.1.5 Free-end displacement amplitude for an additional mass gma 7.501=
-15
-10
-5
0
5
10
15
0 5 10 15 20 25 30 35 40
timp (s)
Dis
plac
emen
t (m
m)
without additional mass with additional mass
M0=4600 gT = 0.355 sA0_max=11.87 mm (amplitudinea)Δst_max = 74.5 mm
Aa/A0=7.6/9.7=0.783
ma=873.4 gT = 0.31 s (0.24 s)Aa_max=10.97 mm (amplitudinea)Δst_max = 88.95 mm
Fig. 3.1.6 Free-end displacement amplitude for an additional mass gma 4.873=

10 Scientific Bulletin Series: Mathematical Modelling in Civil Engineering, no.1/2008
-15
-10
-5
0
5
10
15
0 5 10 15 20 25 30 35 40
timp (s)
Dis
plac
emen
t (m
m)
without additional mass with additional mass
M0=4600 gT = 0.355 sA0_max=11.87 mm (amplitudinea)Δst_max = 74.5 mm
Aa/A0=5.9/9.7=0.608
ma=873.4 gT = 0.35 s (0.45 s)Aa_max=10.09 mm (amplitudinea)Δst_max = 90.2 mm
Fig. 3.1.7 Free-end displacement amplitude for an additional mass gma 2.1017=
-15
-10
-5
0
5
10
15
0 5 10 15 20 25 30 35 40
timp (s)
Dis
plac
emen
t (m
m)
without additional mass with additional mass
M0=4600 gT = 0.355 sA0_max=11.87 mm (amplitudinea)Δst_max = 74.5 mm
Aa/A0=7.3/9.7=0.752
ma=873.4 gT = 0.36 s (0.315 s)Aa_max=11.46 mm (amplitudinea)Δst_max = 95.2 mm
Fig. 3.1.8 Free-end displacement amplitude for an additional mass gma 5.1399=
3.2. Experimental Assembly for Three-DOF System
This assemble was developed from the previous one by applying another two masses and two measurement points. The experiment aimed 7 study cases. First the response of the Three-DOF system without additional mass was recorded. For the other accounted cases different values of the additional mass were taken and the response of the system with additional mass was recorded. The basic assembly of the experiment is shown in figure 3.2.1.
Spider 8a-a
23 mm
23 m
m
3.5 mm
3.5
mm
1800 mm
M3=3.6kg
ma
mr=421g
a
a
M2=3.6kgM1=3.6kg
600 mm 600 mm 600 mm
Fig. 3.2.1 Basic assembly of the experiment for the Three-DOF system
Scientific Bulletin Series: Mathematical Modelling in Civil Engineering, no.1/2008 11
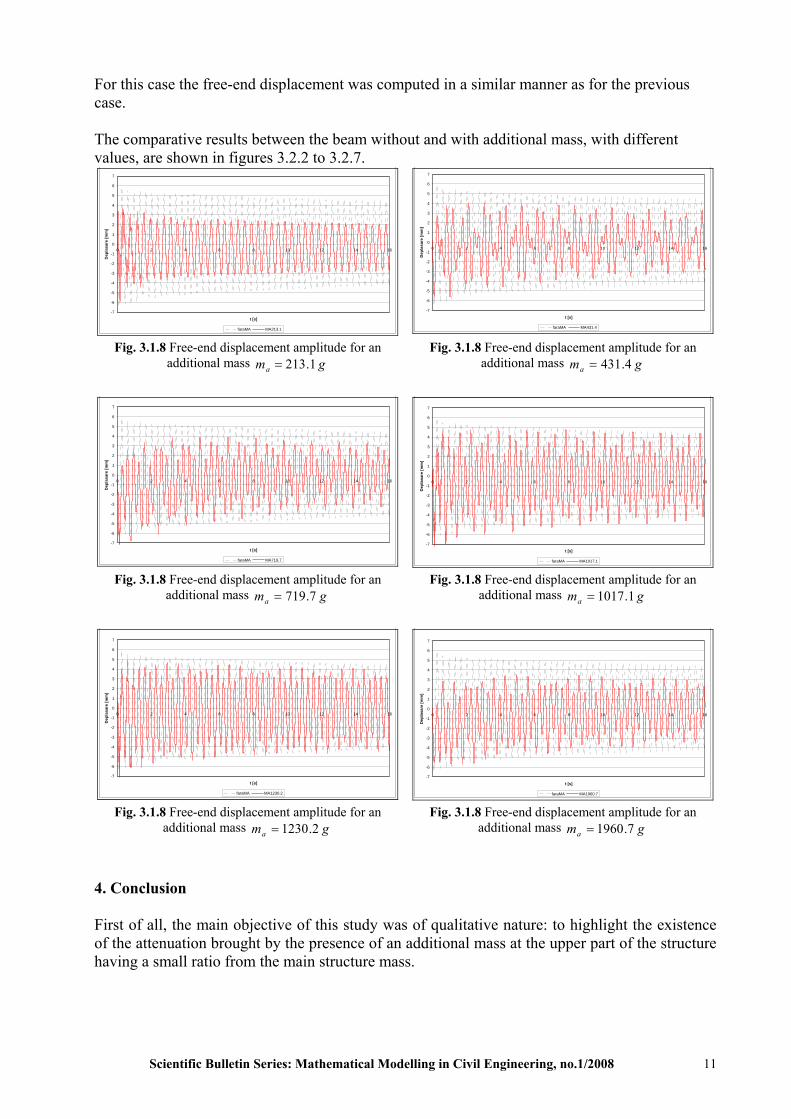
For this case the free-end displacement was computed in a similar manner as for the previous case. The comparative results between the beam without and with additional mass, with different values, are shown in figures 3.2.2 to 3.2.7.
-7
-6
-5
-4
-3
-2
-1
0
1
2
3
4
5
6
7
0 2 4 6 8 10 12 14 16
t [s]
Dep
lasa
re [m
m]
faraMA MA213.1
-7
-6
-5
-4
-3
-2
-1
0
1
2
3
4
5
6
7
0 2 4 6 8 10 12 14 16
t [s]
Dep
lasa
re [m
m]
faraMA MA431.4
Fig. 3.1.8 Free-end displacement amplitude for an additional mass gma 1.213=
Fig. 3.1.8 Free-end displacement amplitude for an additional mass gma 4.431=
-7
-6
-5
-4
-3
-2
-1
0
1
2
3
4
5
6
7
0 2 4 6 8 10 12 14 16
t [s]
Dep
lasa
re [m
m]
faraMA MA719.7
-7
-6
-5
-4
-3
-2
-1
0
1
2
3
4
5
6
7
0 2 4 6 8 10 12 14 16
t [s]
Dep
lasa
re [m
m]
faraMA MA1017.1
Fig. 3.1.8 Free-end displacement amplitude for an additional mass gma 7.719=
Fig. 3.1.8 Free-end displacement amplitude for an additional mass gma 1.1017=
-7
-6
-5
-4
-3
-2
-1
0
1
2
3
4
5
6
7
0 2 4 6 8 10 12 14 16
t [s]
Dep
lasa
re [m
m]
faraMA MA1230.2
-7
-6
-5
-4
-3
-2
-1
0
1
2
3
4
5
6
7
0 2 4 6 8 10 12 14 16
t [s]
Dep
lasa
re [m
m]
faraMA MA1960.7
Fig. 3.1.8 Free-end displacement amplitude for an additional mass gma 2.1230=
Fig. 3.1.8 Free-end displacement amplitude for an additional mass gma 7.1960=
4. Conclusion First of all, the main objective of this study was of qualitative nature: to highlight the existence of the attenuation brought by the presence of an additional mass at the upper part of the structure having a small ratio from the main structure mass.

12 Scientific Bulletin Series: Mathematical Modelling in Civil Engineering, no.1/2008
The qualitative remarks which can be concluded from these experiments must take into account the particular condition of the tests, free harmonic vibration were induced in the presence of the material dampening. From the comparison of the results we can observe certain attenuation of the free-end displacement in all studied cases. For the SDOF system the best response was obtained for a 460 g additional system mass, the amplitude reduction was near 42% (figure 3.1.4). The additional system, in this case, represents nearby 10% from the main system mass. For the second studied case, the Three-DOF structure, the most evident attenuation was recorded for a 213.1 g additional mass. All the additional system represents nearby 5% from the total mass of the main system (figure 3.2.2). Likewise, in this case an antiphase response was observed for the system with additional mass, related to the system without additional mass. For cases in which the mass increases, a modification of the response can be noted, but without significant amplitude reduction related to the increasing mass. (Figures 3.2.3 to 3.2.7) A special case can be noted in figure 3.2.7, where, for a significant augmentation of the additional mass a new amplitude reduction can be observed. In this case the additional system represents nearby 22% from the main system mass. For a real structure, the application of a similar additional mass with the purpose to attenuate the seismic motion or other actions effects, presumes a non-economical and unjustified dimensioning. Regarding the seismic action, the induced motion is not idealized anymore, but the attenuation phenomenon due the presence of the additional mass take place, as it is described in the literature. In this case, the studies and the tests showed that the optimal mass ratio is smaller than the ones resulted from the described tests; this is near 2% [4]. The direct approach to quantify and describe the effect of the additional mass in case of seismic action is another problem which has to be discussed separately and can be the material for another paper. This study has been made with resources from UEFISCU-CNCSIS, as a part of a PNII Program, contract no. 67/2007.
References
[1]. DAVID ROYLANCE, Experimental Strain Analysis, http://ocw.mit.edu/NR/rdonlyres/Materials-Science-and-Engineering/3-11Mechanics-of-MaterialsFall1999/3A6322CC-6616-47FC-A17C-9379F4D9507A/0/expt.pdf, Feb 23, 2001
[2]. ***, Spider 8, Spider 8-30, Spider 8-55 PC-Measurement Electronics. Data Sheet, documentation
B0409-5.0 en , Hottinger Baldwin Messtechnik GmbH;
[3]. ***, An Introduction to Measurements using Strain Gages, Hottinger Baldwin Messtechnik GmbH, 1-HOFFM.BUCH-E
[4]. PANAITE MAZILU, Rezistenţa Materialelor, Institutul de Construcţii Bucureşti, 1974
[5]. L. CALADO, J.M. PROENÇA, A. PANÃO. Innovative materials and techniques for seismic
protection, Vol. Earthquake Protection of Historical Buildings by Reversible Mixed Technologies – PROHITECH, 2004, WP5_proj.no.INCO-CT-509119.