Embed Size (px)
Citation preview

Inequality at Work:The Effect of Peer Salaries on Job Satisfaction
David Card, Alexandre Mas, Enrico Moretti, and Emmanuel Saez∗
November 2011
Abstract
We study the effect of disclosing information on peers’ salaries on workers’ job satisfac-tion and job search intentions. A randomly chosen subset of employees of the Universityof California was informed about a new website listing the pay of University employees.All employees were then surveyed about their job satisfaction and job search intentions.We find an asymmetric response to the information about peer salaries: workers withsalaries below the median for their pay unit and occupation report lower pay and jobsatisfaction, while those earning above the median report no higher satisfaction. Like-wise, below-median earners report a significant increase in the likelihood of looking for anew job, while above-median earners are unaffected. Those negative treatment effects areconcentrated among employees in the first quartile of each pay unit. Differences in payrank matter more than differences in pay levels. Our findings suggest that job satisfactiondepends on relative pay comparisons, and that this relationship is non-linear (JEL J24).
∗David Card, University of California, 530 Evans Hall #3880, Berkeley CA 94720, [email protected];Alexandre Mas, Princeton University, Firestone Library, Princeton, NJ 08544, [email protected]; EnricoMoretti, University of California, 530 Evans Hall #3880, Berkeley CA 94720, [email protected]; Em-manuel Saez, University of California, 530 Evans Hall #3880, Berkeley CA 94720, [email protected]. We aregrateful to David Autor, Stefano Dellavigna, Ray Fisman, Kevin Hallock, Lawrence Katz, Andrew Oswald, fouranonymous referees, and numerous seminar participants for many helpful comments. We thank the PrincetonSurvey Research Center, particularly Edward Freeland and Naila Rahman, for their assistance in implementingthe surveys. We are grateful to the Center for Equitable Growth at UC Berkeley and the Industrial RelationsSection at Princeton University for research support.

Economists have long been interested in the possibility that individuals care about both
their absolute income and their income relative to others.1 Recent studies have documented
systematic correlations between relative income and job satisfaction (e.g., Clark and Oswald,
1996), happiness (e.g., Luttmer, 2005 and Solnick and Hemenway 1998), health and longevity
(e.g., Marmot, 2004), and reward-related brain activity (e.g., Fliessbach et al. 2007).2 Despite
confirmatory findings from laboratory experiments (e.g., Fehr and Schmidt, 1999), the inter-
pretation of the empirical evidence is not always straightforward. Relative pay effects pose
a daunting challenge for research design, since credible identification hinges on the ability to
isolate exogenous variation in the pay of the relevant peer group.
In this paper we propose and implement a new strategy for evaluating the effect of relative
pay comparisons, based on a randomized manipulation of access to information on co-workers’
salaries.3 Following a court decision on California’s “right to know” law, the Sacramento Bee
newspaper established a website (www.sacbee.com/statepay) in early 2008 that made it possible
to search for the salary of any state employee, including faculty and staff at the University of
California (UC). In the months after this website was launched we contacted a random subset
of employees at three UC campuses, informing them about the existence of the site. A few days
later we surveyed all campus employees, eliciting information about their use of the Sacramento
Bee website, their pay and job satisfaction, and their job search intentions. We compare the
answers of people in the treatment group (who were informed about the site) to those of the
control group (who were not). We match administrative salary data to the survey responses
to examine how the effects of the information treatment depend on an individual’s earnings
relative to his or her peers, defined as co-workers in the same occupation group (faculty vs.
staff) and administrative unit (i.e., department or school) within the University.
Our information treatment had a large impact on use of the Sacramento Bee website, raising
1The classic early reference is Veblen (1899). Modern formal analysis began with Duesenberry’s (1949)relative income model of consumption. Easterlin (1974) used this model to explain the weak link betweennational income growth and happiness. Hamermesh (1975) presents a seminal analysis of the effect of relativepay on worker effort. Akerlof and Yellen (1990) provide an extensive review of the literature (mostly outsideeconomics) on the impact of relative pay comparisons.
2Other studies have found a more important role for absolute income than relative income, e.g., Stevenson andWolfers (2008). Kuhn et al. (2011) find that people do not experience reduced happiness when their neighborswin the lottery.
3A number of recent empirical studies have used similar manipulations of information to uncover the effectsof various policies. See Hastings and Weinstein (2009) on school quality, Jensen (2010) on returns to educationin developing countries; Chetty, Looney, and Kroft (2009) on sales taxes, Chetty and Saez (2009) on the EarnedIncome Tax Credit, and Kling et al. (2011) on Medicare prescription drug plans.

the fraction of people who accessed the site from 20 percent to nearly 50 percent. Four-fifths of
the new users reported that they investigated the earnings of colleagues in their own department
or pay unit. This strong “first stage” result establishes that workers are interested in co-workers’
pay – particularly the pay of peers in the same department – and that information manipulation
is a powerful and practical way to estimate the effects of relative pay on workers.
Accessing information on the Sacramento Bee website allows employees to update their
beliefs about their peers’ pay. In a relative income model this information treatment will have
a negative effect on the job satisfaction of lower-earning workers in a peer group, and a positive
effect on higher-earning workers. If satisfaction is a concave function of relative pay, as assumed
in the inequality aversion model of Fehr and Schmidt (1999), the negative effects on low-wage
earners will be larger than the positive effects on high-wage earners. In our experiment, we find
that the information treatment caused a reduction in job satisfaction among workers with pay
below the median for their department and occupation group, and an increase in their intention
to look for a new job. By comparison, treatment group members who were paid above the
median report no significant changes in job satisfaction or job search intentions. Responses to
the treatment appear to be more closely related to an individual’s rank in the salary distribution
than to his or her relative pay level, and to be strongest among people in the lowest quartile of
the pay distribution of their unit. We also study the effect of the information treatment on actual
turnover and find some suggestive evidence of an effect on the job-leaving rates, particularly for
those in the first quartile of pay in their unit.
Our results provide credible field-based confirmation of the importance of relative pay com-
parisons that have been identified in earlier observational studies of job turnover (Kwon and
Milgrom, 2008), job satisfaction (Clark and Oswald, 1996; Hamermesh, 2001) and happiness
(Frey and Stutzer, 2002; Luttmer, 2005), and in some (but not all) lab-based studies.4 They
lend specific support to the hypothesis that negative comparisons matter more than positive
comparisons for worker’s perceived job satisfaction. Our findings also contribute to the literature
4Lab-based experimental studies have developed a series of games such as the dictator game, the ultimatumgame, and the trust game (see Rabin 1998 for a survey) showing evidence that relative outcomes matter. See inparticular Fehr and Falk 1999, Fehr and Schmidt, 1999, Charness and Rabin, 2002, and Clark et al., 2010 for labevidence of relative pay effects. Note however that in experimental effort games, Charness and Kuhn (2007) andBartling and Von Siemens (2011) find that workers’ effort is highly sensitive to their own wages, but unaffectedby co-worker wages. Following the theory that ordinal rank matters proposed in psychology by Parducci (1995),some lab studies have shown that rank itself matters (see e.g. Brown et al. 2008 and Kuziemko et al. 2011).
2

on pay secrecy policies.5 About one-third of U.S. companies have “no-disclosure” contracts that
forbid employees from discussing their pay with co-workers. Such contracts are controversial
and are explicitly outlawed in several states. Our finding of an asymmetric impact of access to
pay information suggests that employers have an incentive to maintain pay secrecy, since the
costs for lower-paid employees exceed the benefits for their high-wage peers.
The remainder of the paper is organized as follows. Section I presents a simple conceptual
framework for structuring our empirical investigation. Section II describes the experimental
design, our data collection and assembly procedures, and selection issues. Section III presents
our main empirical results. Section IV concludes. Supplementary results are gathered in an
online appendix.
I Conceptual Framework
Theoretically there are two broad reasons why information on peer salaries may affect workers’
utilities. In this section we briefly discuss them. A more extensive development is presented in
Card, Mas, Moretti and Saez (2010).
Relative Income Model. A first reason why information on peer salaries may affect utility
is that that workers care directly about relative pay, as in Clark and Oswald (1996). Consider
a worker whose own wage is w and who compares her wage to a reference level, denoted m,
which is a function of the wages of co-workers in her reference group. The agent has incomplete
information about co-workers’ wages, and therefore of m. Let I denote the information set
available to the worker: we assume that our experiment changes the information set from I0 to
I1. Assume that the worker’s job satisfaction, given information set I, can be written as:
S(w, I) = u(w) + v(w − E[m|I]) + e, (1)
where u() represents the utility from her own pay, e is an individual-specific term representing
random taste variation, and v() represents feelings arising from relative pay comparisons. With
suitable choices for the functions u(.) and v(.), this specification encompasses most of the func-
tional forms that have been proposed in the literature on relative pay. We assume that in the
5The seminal work on pay secrecy is Lawler (1965). Futrell (1978) presents a comparison of managerialperformance under pay secrecy and disclosure policies, while Manning and Avolio (1985) study the effects ofpay disclosure of faculty salaries in a student newspaper. Most recently Danziger and Katz (1997) argue thatemployers use pay secrecy policies to reduce labor mobility and raise monopsonistic profits.
3

absence of the website, individuals only know their own salary, and that they hold a prior for
m that is centered on their own wage, i.e., E[m|I0] = w.
Under these assumptions, job satisfaction in the absence of external information is:
S(w, I0) = u(w) + v(w − E[m|I0]) + e = u(w) + e,
where we assume (without loss of generality) that v(0) = 0. With access to the website we
assume that individuals can observe m perfectly.6 Then job satisfaction conditional on using
the website is:
S(w, I1) = u(w) + v(w − E[m|I1]) + e = u(w) + v(w −m) + e
With additive preferences, the change in the information set from I0 to I1 leads to a change
in job satisfaction that depends directly on v(w−m). Assuming that v() is increasing, learning
about co-worker pay will reduce the satisfaction of low-paid workers and increase the satisfaction
of high-paid workers. If in addition v() is concave – as is assumed by Fehr and Schmidt (1999)
– workers with w < m will experience relatively large reductions in satisfaction, while those
with w ≥ m will experience only modest increases.
For purposes of estimation we will assume that the reference-group consists of workers in
the same department or administrative unit and faculty/staff grouping.7 We test for concavity
in v() by specifying this function as piece-wise linear with a different slope above and below the
median salary within a worker’s reference group. We do not view this specification as a literal
description of individual preferences, but rather as a simple way to trace out the treatment
response function to test whether there are heterogenous effects depending on relative income,
and whether these effects are nonlinear.
Rational Updating. People may react to new information on co-worker salaries even if
they do not care directly about relative pay. In particular, it is possible that workers have
no direct concern over peer salaries, but rationally use this information to update their future
pay prospects. If co-worker wages provide a signal about future wages, either through career
advancement or a bargaining process, learning that one’s wage is low (high) relative to co-
workers’ salaries leads to updating expected future wage upward (downward). In this model,
6The complete information assumption can be relaxed without substantively changing the model.7As discussed below, we find that a large majority of new users who were prompted to look at the site by
our information treatment examined the pay of colleagues in their own department. We take this as evidencethat the department is the relevant comparison unit.
4

the revelation of co-workers’ salaries raises the job satisfaction of relatively low-wage workers
and lowers the satisfaction of relatively high-wage workers. Thus, in contrast to the relative
utility model above, learning that one is paid less than one’s peers is “good news,” while learning
that one is paid more is “bad news.” See Card, Mas, Moretti and Saez (2010) for details on
this model.8 Our randomized design allows us to measure the effect of information revelation
for workers at different points in the salary distribution and thus provide some evidence on the
relative merit of these two models.
Incomplete Compliance. In the theoretical model above we have implicitly assumed that
all treated individuals access the web site salary information, whereas none of the control group
have access to this information. In practice, however, some members of both the treatment
and control groups had used the web site prior to our intervention, and not all members of
the treatment group used the website after receiving treatment.9 Thus, some of the treatment
group were uninformed, while some of the control group were informed. As in other experimen-
tal studies this incomplete compliance raises potential difficulties for the interpretation of our
empirical results.
Let T denote the treatment status of a given individual (T = 0 for the control group; T = 1
for the treatment group), and let π0 = E[D|T = 0, w,m] and π1 = E[D|T = 1, w,m] denote the
probabilities of being informed (denoted by D = 1) conditional on treatment status, individual
wages, and peer mean wages. With this notation, equation (1) becomes
S = u(w) + π0 · v(w −m) + T · (π1 − π0) · v(w −m) + e+ φ, (2)
where φ is an error component reflecting the deviation of an individual’s actual information sta-
tus from his or her expected status.10 Under the assumption that the “information treatment
intensity” δ ≡ π1 − π0 is constant across individuals, equation (2) implies that the observed
treatment response function in our experiment is simply an attenuated version of the “full com-
pliance” treatment effect, with an attenuation factor of δ. Below we estimate a variety of “first
8Of course, other reactions to updating are possible. For example, a worker who learns that her co-workersare highly paid may revise upward her expected future wages, but may experience a decline in job satisfactionbecause she has to enter into a costly bargaining process with her employer. We thank a referee for pointingout this possibility.
9Some treated employees may have failed to read our initial email informing them of the website. Othersmay have been concerned about clicking a link in an unsolicited email, and decided not to access the site.
10Formally, φ = [D−Tπ1− (1−T )π0)]v(w−m). This term is mean-independent of the conditioning variablesin π0 and π1.
5

stage” models that measure the effect of the information treatment on use of the Sacramento
Bee website, including models that allow the treatment effect to vary with functions of (w−m).
We find that the information treatment intensity is independent of the observed characteris-
tics of individuals, including their wage and relative wage, suggesting that we can interpret our
estimated models as variants of equation (2) with a uniformly attenuated treatment response.11
II Data and Experimental Design
A The Experiment
In March 2008, the Sacramento Bee posted a searchable database at www.sacbee.com/statepay
containing individual pay information for California public employees including workers at the
University of California system. Although public employee salaries have always been considered
“public” information in California, in practice access to salary data was extremely restrictive
and required a written request to the State or the UC. The Sacramento Bee database was the
first to make this information easily accessible. At its inception the database contained pay
information for calendar year 2007 for all UC workers (excluding students and casual workers)
as well as monthly pay for all other state workers.
In Spring 2008, we decided to conduct an experiment to measure the reactions of employees
to the availability of information on the salaries of their co-workers. We elected to use a
randomized design with stratification by department (or pay unit). Ultimately we focused
on three UC campuses: UC Santa Cruz (UCSC), UC San Diego (UCSD), and UC Los Angeles
(UCLA), using the online personnel directories for each institution as the basis for our sample.12
Our information treatment consisted of an e-mail (sent from special e-mail accounts established
at UC Berkeley and Princeton) informing recipients of the existence of the Sacramento Bee
website, and asking them to report whether they were aware of the existence of the site or not.
The e-mails were sent in October 2008 for UCSC, in November 2008 for UCSD, and in May
2009 for UCLA. The exact text of the e-mail was as follows:
“We are Professors of Economics at Princeton University and Cal Berkeley conducting a
research project on pay inequality at the University of California. The Sacramento Bee newspa-
11In the more general case in which the information treatment varies with w and m the experimental re-sponse reflects a combination of the variation in the information treatment effect (π1− π0) and the difference insatisfaction in the presence or absence of information (v(w −m)).
12The online directories contain email addresses, as well as employee names, job titles, and departments.
6

per has launched a web site listing the salaries for all State of California employees, including
UC employees. The website is located at www.sacbee.com/statepay or can be found by searching
“Sacramento Bee salary database” with Google. As part of our research project, we wanted to
ask you: Did you know about the Sacramento Bee salary database website?”
About 40 percent of employees at UC Santa Cruz, 25 percent of employees at UC San Diego,
and 37.5 percent of employees at UCLA received this information treatment. Our experimental
design is described in Appendix Table A0. We stratified by department to allow for the testing
of peer interactions in the response to treatment.13 As shown in detail in Card, Mas, Moretti,
Saez (2010), however, there is no evidence of such interactions, and we therefore ignore them in
the analysis below. We always cluster our standard errors at the department×occupation (staff
vs. faculty) level to reflect the stratified design.
We also randomly selected a subset of UCLA employees to receive a “placebo treatment.”
As in the treatment group, workers in the placebo group received an e-mail with an introduc-
tion explaining that we were conducting a study of pay inequality. The placebo described a
UC website listing the salaries of top UC administrators and asked recipients to fill out a 1-
question survey on their knowledge of the site. Importantly, this alternative web site provided
no information on salaries of typical UC workers. We use responses from people who received
the placebo treatment to assess our interpretation of the responses to our primary treatment
in light of possible confounders, including priming effects due to the language of the treatment
e-mail, and differential response rates between treatments and controls.
Three to ten days after the initial treatment e-mails were sent, we sent e-mails to all employ-
ees at each campus asking them to respond to a survey. This follow-up survey (reproduced in
the online appendix) included questions on knowledge and use of the Sacramento Bee website,
on job satisfaction and future job search intentions, on the respondent’s age and gender, and on
the length of time they had worked in their current position and at the University of California.
The survey was completed online by following a personalized link to a website. In an effort to
raise response rates we randomly assigned a fraction of employees to be offered a chance at one
of three $1000 prizes for people who completed the survey.14 In addition, we sent up to two
13At each campus, a fraction of departments was randomly selected for treatment (two-thirds of departmentsat UC Santa Cruz; one-half at the other two campuses). Within each treated department a random fraction ofemployees was selected for treatment (60 percent at UC Santa Cruz, 50 percent at UC San Diego, 75 percent atUCLA).
14More precisely, all respondents were eligible for the prize, but only a randomly selected sample were told
7

additional e-mail reminders asking people to complete the follow-up survey.
B Survey Responses
Our final dataset combines campus and department identifiers from the online directories, treat-
ment status information, follow-up survey responses, and administrative salary data for employ-
ees at the three campuses.15 Overall, just over 20 percent of employees at the three campuses
responded to our follow-up survey (Appendix Table A1). While comparable to the response
rates in many other non-governmental surveys, this is still a relatively low rate, leading to some
concern that the respondent sample differs systematically from the overall population of UC
employees. A particular concern is that response rates may be affected by our information
treatment, potentially confounding any measured treatment effects on job satisfaction.
Table 1 presents a series of linear probability models for the event that an individual re-
sponded to our follow-up survey. The model in column 1 is fit to the overall universe of 41,975
names that we extracted from the online directories and were subject to random assignment.
The models in columns 2-4 are fit on the subset of 31,887 names we were able to match to
the administrative salary data. The coefficient estimates in column 1 point to three notable
conclusions. First, the response rate for people who could be matched to the administrative
salary data is significantly higher (+3.4 percentage points) than for those who could not. Sec-
ond, assignment to either the information treatment or the placebo treatment had a significant
negative effect on response rates, on the order of -4 to -5 percentage points. This pattern
suggests that there was a “nuisance” effect of being sent two e-mails that lowered response rates
to the follow-up survey independently of the content of the first e-mail. Third, being offered
the response incentive had a sizeable positive (+4 percentage point) effect on response rates.
The models in columns 2-3 are based on the subset of people who can be matched to
earnings data, with and without the addition of a cubic polynomial in individual earnings as
an extra control. In both cases the estimates are very close to those in column 1. Finally,
about it (see Appendix Table A0 for complete details).15The salary data – which were obtained from the same official sources used by the Sacramento Bee – include
employee name, base salary, and total wage payments from the UC for calendar year 2007. We matched thesalary data to the online directory database by first and last name, dropping all cases for which the match wasnot one-to-one (i.e., any cases where two or more employees had the same first and last name). Appendix TableA1 presents some summary statistics on the success of our matching procedures. Overall, we were able to matchabout 76 percent of names. The match rate varies by campus, with a high of 81 percent at UCSD and a low of71 percent at UCSC. We believe that these differences are explained by differences in the quality and timelinessof the information in the online directories at the three campuses.
8

in anticipation of the treatment effect models estimated below, the specification in column 4
allows for a differential treatment effect on response rates for people whose earnings are above
or below the median for their occupation and pay unit. The estimation results suggest that
the negative response effect of treatment assignment is very similar for people with above-
median earnings (-4.0 percent) and below-median earnings (-3.6 percent), and we cannot reject
a homogeneous effect. We also fit a variety of richer models allowing interactions between
earnings and treatment status, and allowing a potential kink in the effect of earnings at the
median of the pay unit. In none of these models could we reject the homogeneous effects
specification presented in column 4.
Overall, the negative effect of the information treatment on the response rate is modest
in magnitude (about a 15 percent reduction in the likelihood of responding), but it is highly
statistically significant. The response gap poses a potential threat to the interpretation of
our treatment effect estimates, which rely on data from survey respondents. The very similar
negative effects of the information treatment and the placebo treatment, however, suggest that
the reduced response rate was not attributable to the content of the treatment e-mail. In light
of this fact, we use the survey responses of the placebo group to test whether the responses of
the treatment group contain significant selection biases.16
C Summary Statistics
Table 2 presents a comparison of employees who were assigned to receive our information treat-
ment and those who were not. For simplicity we refer to these two groups as the treatment and
control groups of the experiment.17 Beginning with the overall sample in the first panel of the
table, note that only about 17 percent of our sample are faculty members. The vast majority
are staff, including administrators, employees of the medical centers at two of the campuses, and
support staff. As expected given random assignment, the fractions of faculty in the treatment
and control groups are not significantly different, after adjusting for campus effects to reflect
the differential rates of assignment to treatment at the 3 campuses. About three-quarters of our
overall sample can be matched to salary data. Again the fractions matched to salary data in
the treatment and control group are very close to equality, consistent with random assignment.
16As discussed below, analysis of the placebo group also allows us to investigate potential priming effectsassociated with the wording of cover email sent with both the main treatment and the placebo treatment.
17Here the control group includes the group of workers who received the placebo treatment.
9

The next panel pertains to the subset of employees who could be matched to earnings
data. Base earnings (which exclude over-time, extra payments, etc.) are slightly higher for
the treatment group than the control group (t = 2.0), but the gap in total earnings (which
include over-time and supplements like summer pay and housing allowances) is smaller and not
significant. As noted above, among those with earnings data the fraction of the treatment group
who responded to our follow-up survey is about 3 percentage points lower than the rate for the
controls, and the difference is highly significant (t = 4.5).
Finally, the bottom panel of Table 2 presents comparisons in our main analysis sample, which
consists of the 6,411 people who responded to our follow-up survey (with non-missing responses
for the key outcome variables) and can be matched to administrative salary data. This sample is
comprised of 85 percent staff and 15 percent faculty, with mean total earnings of around $67,000.
Within the analysis sample the probability of treatment is statistically unrelated to age, tenure
at UC, tenure at the current job position, gender, and wages.18 This provides very reassuring
evidence that there was no systematic differential selection across treatment and control groups
for responding to our survey, at least based on observable demographic variables. Selection due
to unobservable factors remains a possibility that we address using the placebo treatment, as
described below.
III Empirical Results
We now turn to our main analysis of the effects of the information treatment. Except in Section
III.D, we restrict attention to the subsample of survey respondents in our main analysis sample.
A Effect on Use of the Sacramento Bee Website
We begin in Table 3 by estimating a series of linear probability models that quantify the first-
stage effect of our information treatment on use of the Sacramento Bee web site.19 The mean
rate of use reported by the control group is 19.1 percent. As shown by the model in column
18We also fit a logit for individual treatment status, including campus dummies (to reflect the design of theexperiment) and a set of 15 additional covariates: 3 dummies for age category, 4 dummies for tenure at the UC,4 dummies for tenure in current position, a dummy for gender, and a cubic in total earnings received from UC.The p-value for exclusion of the 15 covariates is 0.74.
19All the models include controls for campus and faculty/staff status (fully interacted) as well as a cubicpolynomial in total individual pay. The faculty/staff and individual pay controls have no effect on the size ofthe estimated treatment effect but do contribute to explanatory power.
10

1, the information treatment more than doubles that rate (by +28 percent) to a mean rate of
almost 50 percent.
In column 2 we include a dummy indicating whether the individual was offered a (randomly
assigned) monetary response incentive. The coefficient estimate for the treatment dummy is the
same as in column 1, and the coefficient on the incentive dummy is very close to 0. Column 3
shows a model in which we add in demographic controls (gender, age dummies, and dummies
for tenure at the UC and tenure in current position). These variables have some explanatory
power (e.g., women are about 5 percentage points less likely to use the website than men with
t = 4.3), but their addition has no impact on the effect of the information treatment.
As discussed above, because of incomplete compliance the interpretation of the observed
treatment response as an attenuated version of equation 2 requires that the information treat-
ment intensity is independent of an individual’s wage or relative wage. This assumption might
be violated if highly-paid individuals within a unit have better information about their relative
salary than low-paid individuals. This could be true among staff, for example, if the department
manager, who is higher paid, sets or reviews staff salaries.
This potential complication motivates the analysis in columns 4 and 5 of Table 3. The
specification in column 4 allows separate treatment effects for people paid above or below the
median for their pay unit (defined as the intersection of department and faculty-staff status).
The estimated treatment effects are very similar in magnitude and we cannot reject identical
effects (p=0.64, reported in bottom row of the table). The specification in column 5 allows
a main effect for treatment, and an interaction of treatment status with earnings relative to
the median earnings in the pay unit, with a potential kink in the interaction term when salary
exceeds the median salary in the pay unit. The interaction terms are very small in magnitude
and again we cannot reject heterogeneous treatment effects across relative salary levels (p=0.76).
We have fit many other interacted specifications and in all cases find that the information
treatment had a large and relatively homogeneous effect on the use of the Sacramento Bee
website.20 Overall, we believe that the evidence is quite consistent with the hypothesis that
the information treatment had a homogeneous effect on the use of the web site, suggesting that
20The estimated effect of treatment is a little larger at UCSC (33 percent, standard error = 5 percent) thanat the other two campuses (UCSD: 28 percent, standard error =2 percent; UCLA: 28 percent, standard error= 2 percent) but we cannot reject a constant treatment effect (p=0.21). The estimated treatment effect is alsosomewhat larger for faculty (32 percent, standard error 3 percent) than for staff (28 percent, standard error 2percent), but again we cannot reject a constant effect at conventional significance levels (p=0.23).
11

the new information was similar for higher- and lower-paid people.
In our UCLA survey we also collected information on what types of information users of
the Sacramento Bee website had actually checked. As shown in Appendix Table A2, among
“new users” who were prompted to look at the site by our information treatment, 87 percent
examined the pay of colleagues in their own department, while 54 percent examined the pay of
colleagues in a different department in their campus. Only about a quarter examined the pay
of colleagues at different campuses, or high profile UC employees. The effects are very similar
for employees paid above- or below-median in their unit. These findings confirm that people
who were informed about the Sacramento website by our treatment e-mail were very likely to
use the site to look-up the pay of their closest co-workers. We take this as direct evidence that
the department is a relevant unit for defining relative pay comparisons.
B Effect on Job and Salary Satisfaction and Mobility
We turn now to models of the effect of the information treatment on employee satisfaction. Our
surveys asked respondents four questions related to their pay and job satisfaction, and their job
search intentions. The first is a simple measure of wage satisfaction: “How satisfied are you with
your wage/salary on this job?”. Respondents could choose one of four categories: “very satis-
fied”, “somewhat satisfied”, “not too satisfied” or “not at all satisfied”. The second is a measure
of overall job satisfaction:“All in all, how satisfied are you with your job?”. Respondents could
choose among the same four categories as for wage satisfaction. The third is a measure of per-
ceived fairness of wage setting: “Do you agree or disagree that your wage is set fairly in relation
to others in your department/unit?”. Respondents could choose “Strongly Agree”, “Agree”,
“Disagree” or “Strongly Disagree”. Finally, the last question elicited job search intentions:
“Taking everything into consideration, how likely is it you will make a genuine effort to find a
new job within the next year?”. Respondents could choose “very likely”, “somewhat likely” or
“not at all likely”.
In Appendix Table A3 we report the distributions of responses to these questions among
the control and treatment groups of our analysis sample. We also show the distribution of
responses for the controls when they are reweighted across the three campuses to be directly
comparable to the treatment group. In general, UC employees are relatively happy with their
jobs but less satisfied with their wage or salary levels. Despite their professed job satisfaction,
12

just over one-half say they are somewhat likely or very likely to look for a new job next year.
For much of the subsequent analysis we consider three main dependent variables. In order
to simplify the presentation of results, and to improve precision, we combine wage satisfaction,
job satisfaction, and wage fairness into a single index by taking the simple average of these
measures.21 This variable, which we call the satisfaction index, is interpretable as a general
measure of work satisfaction. The index has a ten point scale with higher values indicating the
respondent is more satisfied based on the three underlying measures.22 The second outcome
variable is a binary variable that is 1 if the respondent reports being “very likely” to look for
a new job.23 The third outcome is a binary variable for whether the respondent is dissatisfied
and is looking for a new job.24
Tables 4 and 5 present a series of OLS models for these three outcomes.25 We begin with
the basic models in columns 1, 4, and 7 of Table 4 which include only a treatment dummy,
a cubic polynomial in the individual’s earnings, and indicators for faculty/staff status fully
interacted with campus. The estimated treatment effects from this simple specification are
either insignificant or only borderline significant. The point estimate for the effect on the
satisfaction index is negative (t = 0.9), the point estimate for search intentions is positive
(t = 0.8), and the point estimate for the combined variable (dissatisfied and likely looking for
a new job) is positive and marginally significant (t = 1.8). These estimates suggest that our
information treatment may have had a small negative average effect on employee satisfaction.
The coefficients on the earnings controls (not reported in the table) indicate that higher earnings
are associated with higher job and wage satisfaction, and a lower probability of looking for a
new job.
We then estimate differential treatment effects for individuals with below-median and above-
median earnings. In particular, we fit models of the form:
S = g(w, x) + a · 1(w ≤ m) + b0 · T · 1(w ≤ m) + b1 · T · 1(w > m) + µ, (3)
21We have experimented with different ways of constructing this index, for example taking the first principalcomponent of these variables, and the estimates are not sensitive to these alternatives.
22Results of baseline ordered probit models for each of the sub-components are in Appendix Table A4.23We obtain qualitatively similar results if we use a binary variable for whether the respondent is “likely” or
“very likely” to look for a new job.24Specifically, we create a binary variable taking the value of 1 for whether the respondent is dissatisfied (below
the median on the satisfaction index) and responds “very likely” to the job search intentions question, and 0otherwise.
25Ordered probit estimates of similar models are in Tables 5 and 6 in Card, Mas, Moretti and Saez (2010) andare qualitatively very similar.
13
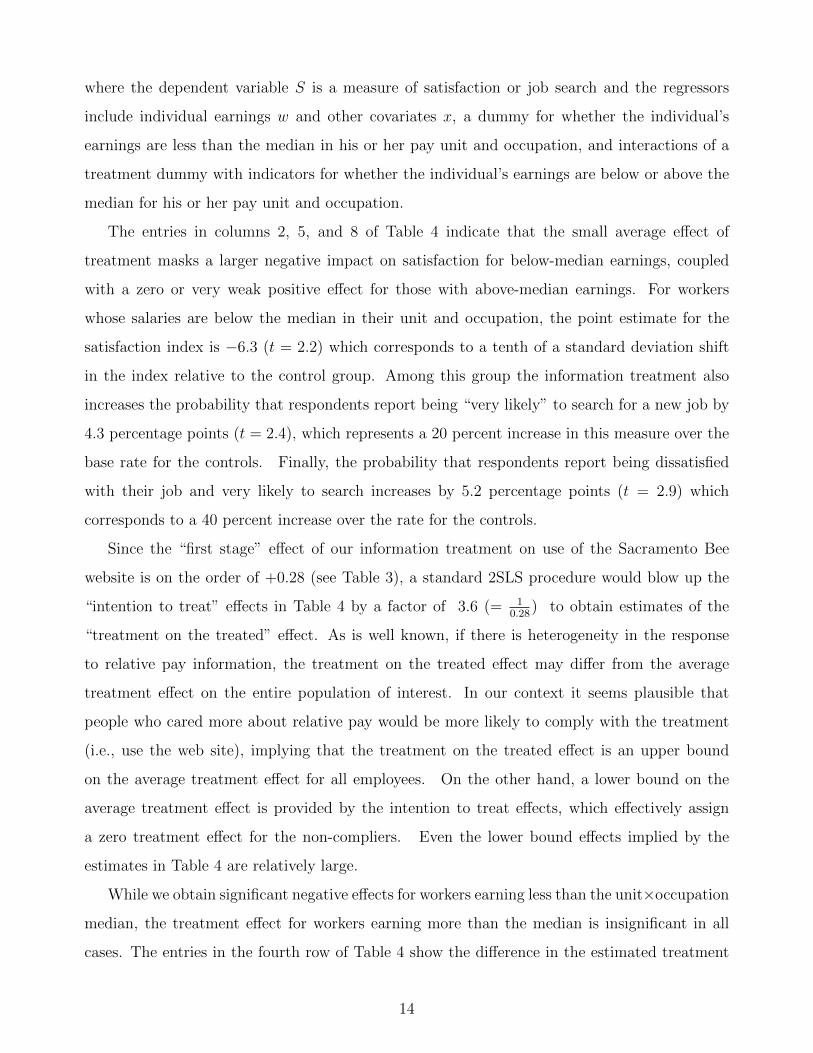
where the dependent variable S is a measure of satisfaction or job search and the regressors
include individual earnings w and other covariates x, a dummy for whether the individual’s
earnings are less than the median in his or her pay unit and occupation, and interactions of a
treatment dummy with indicators for whether the individual’s earnings are below or above the
median for his or her pay unit and occupation.
The entries in columns 2, 5, and 8 of Table 4 indicate that the small average effect of
treatment masks a larger negative impact on satisfaction for below-median earnings, coupled
with a zero or very weak positive effect for those with above-median earnings. For workers
whose salaries are below the median in their unit and occupation, the point estimate for the
satisfaction index is −6.3 (t = 2.2) which corresponds to a tenth of a standard deviation shift
in the index relative to the control group. Among this group the information treatment also
increases the probability that respondents report being “very likely” to search for a new job by
4.3 percentage points (t = 2.4), which represents a 20 percent increase in this measure over the
base rate for the controls. Finally, the probability that respondents report being dissatisfied
with their job and very likely to search increases by 5.2 percentage points (t = 2.9) which
corresponds to a 40 percent increase over the rate for the controls.
Since the “first stage” effect of our information treatment on use of the Sacramento Bee
website is on the order of +0.28 (see Table 3), a standard 2SLS procedure would blow up the
“intention to treat” effects in Table 4 by a factor of 3.6 (= 10.28
) to obtain estimates of the
“treatment on the treated” effect. As is well known, if there is heterogeneity in the response
to relative pay information, the treatment on the treated effect may differ from the average
treatment effect on the entire population of interest. In our context it seems plausible that
people who cared more about relative pay would be more likely to comply with the treatment
(i.e., use the web site), implying that the treatment on the treated effect is an upper bound
on the average treatment effect for all employees. On the other hand, a lower bound on the
average treatment effect is provided by the intention to treat effects, which effectively assign
a zero treatment effect for the non-compliers. Even the lower bound effects implied by the
estimates in Table 4 are relatively large.
While we obtain significant negative effects for workers earning less than the unit×occupation
median, the treatment effect for workers earning more than the median is insignificant in all
cases. The entries in the fourth row of Table 4 show the difference in the estimated treatment
14

effects for above- and below-median workers. These are statistically significant for all three
outcomes at the five percent level.26 Overall, the negative impact of information on below-
median workers, coupled with the absence of any positive effect for above-median workers, is
consistent with inequality aversion in the relative wage concern function.
The choice of the median to distinguish high and low relative wages is of course arbitrary.
The models in columns 3, 6, and 9, break out the treatment effect for workers in the lower half
of the pay distribution into separate effects for workers in the two lowest quartiles. The results
suggest that the largest information effects occur for workers in the first quartile, while the
effects for people in the second quartile and the upper half are uniformly small in magnitude
and insignificant. We infer that our main results are largely driven by impacts on relatively
low-paid employees in each unit.
We have also estimated models allowing the treatment effects to vary by gender, faculty/staff
status, and length of tenure, shown in Appendix Table A5. We find that the treatment effect on
search intentions is concentrated among low-paid and low-tenure respondents.27 Staff appear
to be more responsive than faculty to the treatment on both satisfaction and job search, but the
relatively small number of faculty limits our ability to make precise comparisons. Although both
men and women express the same elevated dissatisfaction following the information treatment,
women appear more inclined to report that they are searching for a new job following treatment.
This finding may be related to the general differences in bargaining attitudes between men and
women noted by Babcock and Laschever (2003). Specifically, women may be more likely to leave
their job than to ask for a raise in response to learning that they are underpaid, though without
additional data our findings are only suggestive.28 As a caveat to Table A5, it should be noted
that treatment intensity varies somewhat across subgroups. However, inflating the estimates
26To probe of the robustness of our inferences to potential selection biases we fitted selection-correction modelswhere we take advantage of random assignment of the prize incentive that we introduced to raise response rates,as well as the random assignment of the placebo which reduces response rates. See Card, Mas, Moretti and Saez(2010) for these estimates and associated discussion. We come back to the issue of selection in Section C below.
27This latter is not surprising as very few UC employees with long tenure change jobs. We use this featureto test that responses to job search are truthful (and not cheap talk due to wage dissatisfaction). In AppendixTable A6 we show that treatment effects on job search are present only in the group of more mobile workers aspredicted by age, tenure, time in position, gender, faculty/staff status, and campus (estimated from the controlgroup).
28In a separate analysis (not reported in this paper) we rule out that the probability of leaving one’s jobconditional on the job search response differs between women and men. Specifically, the relationship betweenthe job search response and being listed in the campus directory in March 2011 is similar for women and men.The baseline probability of still being listed in the campus directory by March 2011 conditional on appearing inour sample is also very close between women and men.
15

by the “first-stage” effects of the information treatment results in a very similar pattern of
estimates across sub-groups to those presented in Table A5.
We have also explored models in which we use employees at the entire campus (instead of the
department) as the peer unit, keeping the distinction between staff and faculty. The results are
presented in Appendix Table A7. Using campus-wide median pay as the reference point we find
a relatively large negative effect of our information treatment on the satisfaction of faculty with
below-median pay, and a significantly positive effect for faculty with above median pay. On the
other hand, the treatment effects on job-search intentions of faculty are still asymmetric, with
positive effects for lower-paid faculty and negligible effects for higher-paid faculty. For staff,
the use of a campus-wide reference point leads to noticeably smaller negative treatment effects
for lower-paid workers than when we define the reference point at the department level. This
suggests that departmental colleagues may be a better comparison group for staff, whereas for
faculty a broader comparison group may be relevant.
To test more directly the inequality aversion hypothesis, the models in Table 5 adopt
a treatment effect specification that depends on a piece-wise linear function of the gap be-
tween an individual’s earnings and the reference earnings (again defined as median earnings by
department×(faculty/staff):
S = g(w, x) + c1 · T · (w −m) · 1(w ≤ m) + c2 · T · (w −m) · 1(w > m) + µ. (4)
Note that we interact the treatment dummy T with the wage gap (w−m), allowing potentially
different effects when the individual’s earnings are below (c1) or above (c2) the reference point
wage. Consistent with the findings in Table 4, these models suggest a pattern of treatment
effect for all outcomes that is concentrated among the lowest-wage individuals. The estimates
in columns 1, 4 and 7 confirm the non-linearity in the relationship between the treatment effect
and the wage gap, with a relatively large negative estimate for the coefficient c1 and small and
insignificant estimates for the coefficient c2. Thus, the distance between one’s own wage and
the reference wage matters when w ≤ m, but once the wage exceeds the reference wage the
effect of treatment is constant. Across all models reported in Table 5 we cannot reject that the
treatment response function is zero when the wage exceeds the pay unit median.
In the remaining columns of Table 5 we explore whether the effect of the information treat-
ment varies with wage rank, rather than with relative wage level. The motivation for this
specification is the possibility that ordinal rank matters more for relative utility considerations
16

than absolute salary differences, as has been suggested in the psychology literature (e.g., Par-
ducci, 1995). In columns 2, 5, and 8 we replace the gap variable based on pay levels with the
gap in percentile ranks (normalized so that median rank is 0). For the first and third outcomes,
the interaction based on rank shows a more pronounced effect than the interaction based on
relative salary levels while for the intended search the two alternatives are very similar. When
we estimate models that include both rank and levels (columns 3, 6, and 9) rank wins the “horse
race” for all three outcomes. Specifically, in the combined model the interaction of treatment
with rank is significant for the below-median workers while the interaction with the relative
wage gap is no longer significant.29
Overall, we believe that the weight of the evidence in Tables 4 and 5 supports a relative
income model of the responses to the information treatment. We note, however, two caveats that
preclude a definitive conclusion. First, we do not directly measure the change in the discounted
expected utility (EU) that individuals experience when they are exposed to the information
in the Sacramento Bee website. It is possible that learning about co-workers’ salaries raises
EU for low-paid workers—as predicted by a rational updating model—and at the same time
lowers reported job and pay satisfaction, and increases willingness to look for a new job. This
possibility makes it difficult to definitely reject the hypothesis of rational updating. Second, we
cannot completely rule out that more highly paid employees in a unit have better information
on co-worker wages. While we have shown above that the effects of the information treatment
on the observed web site use of above-median and below-median workers are virtually identical,
it is still possible that the new information was less important for the high-wage group.
C Effects of the Placebo Treatment
While our randomized research design provides a strong basis for inferences about the effects
of an information treatment, there may be a concern that our interpretation of the measured
treatment effects is flawed. For example, it is conceivable that receiving the first stage e-mail
about research on inequality at UC campuses could have reduced job satisfaction of relatively
low-paid employees, independently of the information they obtained from the Sacramento Bee.
Such effects are known in the psychology literature as “priming effects”. This concern is poten-
tially serious because we used the words “pay inequality” in our cover e-mail to participants.
29Models where we have added a treatment main-effect (not reported in the table) also show that the rankvariable appears to be more significant in the treatment response than relative wage levels.
17

Another issue of concern is the lower response rate in the treatment group, which may introduce
differential selection biases in the measured responses of the treatment and control groups.
One way to address these concerns is to fit similar models to those in Table 4, using the
placebo treatment instead of our real information treatment. The wording of the placebo
treatment e-mail closely followed the wording of our main information treatment:
“We are Professors of Economics at Princeton University and Cal Berkeley conducting a
research project on pay inequality and job satisfaction at the University of California. The
University of California, Office of the President (UCOP) has launched a web site listing the
individual salaries of all the top administrators on the UC campuses. The listing is posted at
[...]. As part of our research project, we wanted to ask you: Did you know that UCOP had
posted this top management pay information online?”.
Note that the experimentally-measured effect of the placebo treatment is subject to the
same set of potential biases as the effect of the real treatment. Specifically, because the placebo
treatment contained the same wording in the cover e-mail, it presumably had a similar priming
effect as the real treatment. Moreover, because the placebo treatment reduced the response
rate to our survey by the same magnitude as the real treatment, we should observe a similar
degree of selection bias in the measured responses of the treatment and control groups in the
placebo experiment.30
The placebo treatment was only administered at UCLA (see Appendix Table A0). To
analyze the effects of the placebo treatment, we use all observations who were not assigned to
the information treatment at the UCLA campus (i.e., the UCLA “control group”), distinguishing
within this subsample of 1,880 people between those who were assigned the placebo treatment
(N=503) and those who were not (N=1,377). As a first step, we fit various models similar to
the ones in Table 3 and found no indication that the placebo treatment had any effect on use
of the Sacramento Bee site.
In Table 6 we compare the effects of the placebo treatment to the effects of our main
information treatment for each of our three outcome measures. Columns 1, 4 and 7 show
baseline models for the effect of our main information treatment on people above or below the
30One concern is that the placebo is providing new and relevant information in units that house top admin-istrators. In Appendix Table A8 we estimate the placebo effect excluding departments or administrative unitswhich house Deans, Associate Deans, or Provosts. The resulting estimates appear close to those that includethese units and excluding them do not alter the conclusions from the analysis below.
18

median earnings in the their pay unit, fit only to the UCLA sample and excluding observations
assigned to the placebo treatment. The pattern of estimates is very similar to the pattern in
Table 4 (estimated on all three campuses) though somewhat less precise because of the smaller
sample. As in the overall sample, low-earning employees who were informed of the Sacramento
Bee database have lower satisfaction, are more likely to report that they are searching for a
job, and are more likely to be dissatisfied and searching for a job relative to the control group.
Columns 2, 5, and 8 show parallel models defining “treatment” as our placebo e-mail treatment.
In these specifications the impact on low-wage employees is uniformly small and insignificant.
In the third column, we show p-values corresponding to the test that the parameters from the
information treatment model are equal to the placebo model. For the three outcomes, we can
reject the hypothesis that the interaction of treatment with below median in pay unit is equal to
the interaction of placebo and below median in pay unit at or below the 6 percent level. These
results show that the systematic pattern of estimates in Tables 4 is not an artefact of priming
effects or selection biases arising from our earlier e-mail contact of the treatment group. Hence
they provide additional support for our interpretation of these estimates as relative pay effects.
D Effects on Actual Turnover in the Medium-Run
One limitation of our study is that our survey information is limited to self-reported outcomes,
raising the question as to whether the effects of the information treatment translated into
changes in observable economic behavior. To address this limitation, we gathered the online
directories for the three campuses as of August 2011, some 27-35 months after our initial treat-
ment and survey e-mails. We then define a turnover indicator, based on whether a given
individual’s e-mail name is still present at the campus.31 Table 7 presents a series of mod-
els using this indicator of turnover as a dependent variable. As a starting point, the model
in column 1 relates the turnover event to our survey-based measure of job search intentions.
Reassuringly, the estimates shows that stated search intentions are a very strong predictor of
actual turnover. Among the subset of respondents to our survey, those who reported being
very likely to search for new job have 19.5 percentage points higher turnover, while those who
said they were somewhat likely to search have 5 percentage points higher turnover.
Columns 2-5 examine the effects of the information treatment on turnover for the full sample
31Overall, 27 percent of the names that we were able to match with base salary data were no longer presentin August 2011, implying an annual turnover rate of about 10 percent.
19

of people we were able to match to 2007 salary data, regardless of whether they responded to our
survey or not. Given the findings in Tables 4 and 5 we present two specifications: one in which
we divide people into the upper half and the bottom two quartiles of the pay distribution in their
unit (columns 2-3), and an alternative in which we use the deviation of salary rank from the
median in the pay unit (columns 4-5). In an effort to improve the precision of the estimates, the
models in columns 3 and 5 introduce a set of departmental fixed effects in addition to controls
for the individual’s earnings and occupation group × campus. Turnover rates vary widely by
department so the addition of these variables leads to a notable reduction in the standard errors
for the estimated treatment effects.
The estimates in columns 2 and 3 show large but imprecise positive effects of the information
treatment on turnover rates of people in the bottom quartile of salaries: The estimated treatment
effect for the lowest quartile in column 3 implies a 2.3 percentage point increase in the probability
of quitting (relative to the average rate of 31 percent) with t = 1.74. A similar pattern of
effects is revealed from the estimates in columns 4-5 which show a negative but only marginally
significant effect of higher salary rank on the probability of turnover among workers in the
lower half of the earnings distribution, and relatively smaller effects on people in the upper
half. Overall, we infer that the information treatment may have led to an increase in turnover
of lower-ranked workers, consistent with the increases in their stated search intentions and
increased job dissatisfaction, but the estimates are too imprecise to reach a definite conclusion.
It is worth noting two issues that may confound the interpretation of the turnover treatment
effects in Table 7. First, information about the Sacramento Bee website (and other sites with
salary information about UC employees) has been diffusing over time, presumably narrowing
the information gap between our treatment and control groups, and diluting our experimental
design. Second, because of the severe recession and high unemployment in California in the
period from 2007 to 2011 period, workers who were unsatisfied with their relative salary may
have been unable to find other jobs. We suspect both factors would lead to smaller measured
effects in Table 7 than would arise in other contexts. Given these concerns, and the imprecision
of the estimates, we believe these results are at best only suggestive about the longer-run
economic effects of salary disclosure.32
32We also collected the salary data released by the UC administration in August 2011, which report 2010salaries. We estimated models intended to test the hypothesis that our information treatment affects eithersalaries or different components of salaries (base pay vs. over time). In particular, we tested whether treated
20

IV Conclusion
In this paper we manipulate access to information on co-worker pay to test how knowledge of
one’s position in the pay distribution of immediate co-workers affects satisfaction and job search
intentions. We find that the information treatment has a negative effect on workers paid below
the median for their unit and occupation – particularly for those in the lowest pay quartile –
but has no effect on workers paid above median. The evidence further suggests that the effect
of the treatment is more closely related to pay rank than to the actual level of pay relative to
the median in the pay unit.
These patterns are consistent with a utility function that imposes a negative cost for having
wages below the reference-point, but little or no reward for having wages above the reference-
point. Overall, our results support the conclusions of many previous observational studies
and lab-based experimental studies on relative income and worker satisfaction. We also find
suggestive evidence that the information treatment increased the 2-3 year turnover rate of
lower-ranked employees, though our experimental design has been diluted by the diffusion of
information about the web-site over time. Finding experimental research designs to estimate
the longer-term effects of pay disclosure is an important topic for future research.
In terms of workplace policies, our findings indicate that employers have a strong incentive
to impose pay secrecy rules. In the short run, the disclosure of salary information results in
a decline in job and pay satisfaction, concentrated among the lowest-earning workers. In the
longer run it is possible that making information on salaries available may lead to endogenous
changes in wage-setting policies and employee composition that ultimately affect the distribution
of wages, as in the models of Frank (1984), Bewley (1999), and Bartling and von Siemens (2010).
workers who learn to be paid below their peers experience different salary changes. In general, our models failedto uncover significant differences—a finding that is probably to be expected in a serious recession like the currentone—with one exception. We found that treated workers with above median earnings tend to be significantlyless likely to receive overtime pay. Re-assuringly, this effect appears to be concentrated among non-responders(as responders in the control learned about the website in the survey). We report these estimates in AppendixTable A9.
21

ReferencesAkerlof, George, and Janet Yellen. 1990. “The Fair-wage Effort Hypothesis and Unem-ployment.” Quarterly Journal of Economics, 105(2): 255-84.Babcock, Linda and Sara Laschever. 2003. Women Don’t Ask: Negotiation and the GenderDivide. Princeton, NJ: Princeton University Press.Bartling, Bjorn and Ferdinand von Siemens. 2010. “The Intensity of Incentives in Firmsand Markets: Moral Hazard with Envious Agents.” Labour Economics, 17: 598-607.Bartling, Bjorn and Ferdinand von Siemens. 2011. “Wage Inequality and Team Produc-tion: An Experimental Analysis.” Journal of Economic Psychology, 32(1): 1-16.Bewley, Truman. 1999. “Why Wages Don’t Fall During a Recession?” Cambridge, MA:Harvard University Press.Brown, Gordon, Gardner, Jonathan, Oswald, Andrew, and Jing Qian. 2008. “DoesWage Rank Affect Employees’ Wellbeing?” Industrial Relations, 47: 355-389.Card, David, Alexandre Mas, Enrico Moretti, and Emmanuel Saez. 2010. “Inequalityat Work: The Effect of Peer Salaries on Job Satisfaction.” NBER Working Paper No. 16396,revised April 2011.Charness, Gary, and Peter Kuhn. 2007. “Does Pay Inequality Affect Worker Effort?Experimental Evidence.” Journal of Labor Economics, 23(4): 693–724.Charness, Gary, and Matthew Rabin. 2002. “Understanding Social Preferences withSimple Tests.” Quarterly Journal of Economics, 117(3): 817–869.Chetty, Raj, Adam Looney and Kory Kroft. 2009. “Salience and Taxation: Theory andEvidence. ” American Economic Review, 99(4): 1145-1177.Chetty, Raj and Emmanuel Saez. 2009. “Teaching the Tax Code: Earnings Responses toan Experiment with EITC Recipients.” NBER Working Paper No. 14836.Clark, Andrew, E., Masclet, David, and Marie Claire Villeval. 2010. “Effort and Com-parison Income: Experimental and Survey Evidence.” Industrial and Labor Relations Review,63: 407-426.Clark, Andrew E. and Andrew J. Oswald. 1996. “Satisfaction and Comparison Income.”Journal of Public Economics, 61(3): 359-381.Danziger, Leif, and Eliakim Katz. 1997. “Wage Secrecy as a Social Convention.” EconomicInquiry, 35: 59-69.Duesenberry, James S. 1949. Income, Saving and the Theory of Consumer Behavior. Cam-bridge, MA: Harvard University Press.Easterlin, Richard A. 1974. “Does Economic Growth Improve the Human Lot? SomeEmpirical Evidence.” In Nations and Households in Economic Growth: Essays in Honor ofMoses Abramowitz, eds. P.A. David and M.W. Reder. New York: Academic Press.Fehr, Ernst, and Armin Falk. 1999. “Wage Rigidity in a Competitive Incomplete Market.”Journal of Political Economy 107(1), 106–34.Fehr, Ernst, and Klaus M. Schmidt. 1999. “A Theory of Fairness, Competition, andCooperation.” Quarterly Journal of Economics, 114: 817–868.Fliessbach, K., Weber, B., Trautner, P., Dohmen, T., Sunde, U., Elger, C., andFalk, A. 2007. “Social comparison affects reward-related brain activity in the human ventralstriatum.” Science, 318: 1305-1308.Frank, Robert H. 1984. “Are Workers Paid their Marginal Products?” American EconomicReview, 74(4): 549-571.
22

Frey, Bruno S., and Alois Stutzer. 2002. “What Can Economists Learn from HappinessResearch?” Journal of Economic Literature, 40: 402–435.Futrell, Charles M. 1978. “Effects of Pay Disclosure on Satisfaction for Sales Managers: ALongitudinal Study.” Academy of Management Journal, 21: 140-144.Hamermesh, Daniel. 1975. “Interdependence in the Labor Market.” Economica, 42: 420–29.Hamermesh, Daniel. 2001. “The Changing Distribution of Job Satisfaction.” Journal ofHuman Resources, 36: 1-30.Hastings, Justine and Jeffrey Weinstein. 2009. “Information, School Choice, and Aca-demic Achievement: Evidence from Two Experiments.” Quarterly Journal of Economics,124(4): 1373-1414.Jensen, Robert. 2010. “The (Perceived) Returns to Education and the Demand for School-ing.” Quarterly Journal of Economics, 125(2): 515-548.Kling, Jeffrey, Sendhil Mullainathan, Eldar Shaffir, Lee Vermeulen, Marian V.Wrobel. 2011. “Comparison Friction: Experimental Evidence from Medicare Drug Plans.”forthcoming Quarterly Journal of Economics.Kuhn, Peter, Peter Kooreman, Adriaan R. Soetevent, and Arie Kapteyn. 2011. “TheEffects of Lottery Prizes on Winners and their Neighbors: Evidence from the Dutch PostcodeLottery.” American Economic Review, 101: 2226-2247.Kuziemko, Ilyana, Ryan Buell, Taly Reich, and Michael Norton. 2011. “Last-placeAversion: Evidence and Redistributive Implications.” NBER Working Paper No. 17234.Kwon, Illoong and Eva M. Milgrom. 2008. “Status in the Worlplace: Evidence fromM&A.” SIEPR Working Paper.Lawler, Edward E. 1965. “Managers’ Perceptions of Their Subordinates’ Pay and of TheirSuperiors’ Pay.” Personnel Psychology, 18, 413-422.Luttmer, Erzo. 2005. “Neighbors as Negatives: Relative Earnings and Well-Being.” QuarterlyJournal of Economics, 120(3): 963–1002.Manning, Michael R. and Bruce J. Avolio. 1985. “The Impact of Blatant Pay Disclosurein a University Environment.” Research in Higher Education, 23(2): 135-149.Marmot, Michael. 2004. The Status Syndrome: How Social Standing Affects Our Health andLongevity. Times Book, New York.Parducci, Allen. 1995. Happiness, Pleasure, and Judgment: The Contextual Theory and itsApplications. Mahwah, NJ: Erlbaum.Rabin, Matthew. 1998. “Psychology and Economics.” Journal of Economic Literature, 36:11-46.Solnick Sara J. and David Hemenway. 1998. “Is More Always Better?: A Survey onPositional Concerns.” Journal of Economic Behavior and Organization, 37(3): 373-383.Stevenson, Betsey and Justin Wolfers. 2008. “Economic Growth and Subjective Well-Being: Re-assessing the Easterlin Paradox.” Brookings Papers on Economic Activity, Spring.Veblen, Thorstein. 1899. The Theory of the Leisure Class. Macmillan Company, New York.
23

Overall Sample
(N=41,975)All Coefficients×100 (1) (2) (3) (4)Dummy if match to wage 3.37 -- -- --
(0.58)Treatment Effects:Treated individual (all in treated departments) -3.81 -3.74 -3.82 --
(0.54) (0.62) (0.61)Placebo individual (all in placebo departments) -5.46 -5.98 -5.89 -5.90
(0.88) (1.03) (1.01) (1.01)Response Incentive Effects: Offered prize 4.25 4.32 4.23 4.24
(0.76) (0.86) (0.86) (0.86)Treatment Effects Based on Relative Wage:Treated individual earning less than median -- -- -- -3.60 in pay unit (0.79)Treated individual earning more than -- -- -- -4.04 median in pay unit (0.81)Dummy if earnings less than median in pay -- -- -- -0.69 unit (0.73)
Cubic in earnings? no no yes yes
Table 1: Determinants of Survey Response
Subsample Matched to Wage Data (N=31,887)
Notes: All models are estimated by OLS. Standard errors, clustered by campus/department, are in parentheses(1,078 clusters for models in column 1; 1,044 for columns 2-4). Dependent variable in all models is dummy forresponding to survey (mean=0.204 for column 1; mean=0.214 for columns 2-4). All models include interactedeffects for campus and faculty or staff status (5 dummies). "Earnings" refers to total UC payments in 2007. Pay unitrefers to faculty or staff members in an individual's department. Column 1 includes the full sample while columns 2-4 include only the subsample successfully matched to the administrative salary data for 2007. Columns 3-4 includeearnings controls (up to cubic term). Column 4 includes interactions of treatment and relative earnings in the unit.

Mean of Mean of DifferenceControl Treatment (adjusted for t-testGroupa Group campus)
(1) (2) (3) (4)Overall Sample (N=41,975)Percent faculty 16.2 19.1 1.47 0.91
(1.61)Percent matched to wage data 76.3 75.2 0.12 0.10
(1.15)Sample Matched to Wage Data (N=31,887)Mean base earnings ($1000's) 54.73 58.26 2.50 2.04
(1.23)Mean total earnings (base + supplements, $1000's) 63.35 66.93 2.34 1.22
(1.91)Percent with total earnings < $20,000 13.2 12.8 -0.37 0.47
(0.77)Percent with total earnings > $100,000 15.3 16.9 0.90 0.77
(1.16)Percent responded to survey with non-missing 21.1 17.8 -2.76 4.49responses for 8 key variables (0.61)
Survey Respondents with Wage Data and non-Missing Values (N=6,411)Percent faculty 15.0 17.9 1.22 0.68
(1.79)Mean total earnings (base + supplements, $1000's) 65.61 69.09 1.69 0.75
(2.23)Percent female 60.9 61.0 0.43 0.24
(1.79)Percent age 35 or older 72.9 75.9 1.68 1.15
(1.46)Percent employed at UC 6 years or more 59.1 62.7 1.03 0.62
(1.67)Percent in current position 6 years or more 40.3 43.8 1.76 1.08
(1.63)
a Includes placebo treatment group (at UCLA only).
Table 2: Comparison of Treated and Non-treated Individuals
Notes: Entries represent means for treated and untreated individuals in indicated samples. Difference between mean for treatment and control groups, adjusting for campus effects to reflect the experimental design, is presented in column 3 along with estimated standard errors (in parentheses), clustered by campus/department. The t-test for difference in means of treatment and control group is presented in column 4.

(1) (2) (3) (4) (5)
Treated individual (coefficient × 100) 28.3 28.3 28.5 -- 28.3(1.6) (1.6) (1.6) (2.0)
Treated individual earning less than median -- -- -- 29.3 -- in pay unit (coefficient × 100) (2.1)
Treated individual earning more than median -- -- -- 27.7 -- in pay unit (coefficient × 100) (2.0)
Treated individual × deviation of earnings from median -- -- -- -- -0.4 in pay unit (coefficient × 100) (0.7)
Treated individual × deviation of earnings from median -- -- -- -- 0.3 in pay unit if deviation positive (coefficient × 100) (0.9)
Dummy for response incentive (test for -- 0.0 -- -- -- selection bias in respondent sample) (1.8)
Dummy for earnings less than median -- -- -- -1.6 --in pay unit (coefficient × 100) (1.8)
Deviation of earnings from median (coefficient × 100) -- -- -- -- -0.1(0.40)
Deviation of earnings from median -- -- -- -- 0.4 if deviation positive (coefficient × 100) (0.50)
Controls for campus × (staff/faculty) and cubic yes yes yes yes yes in earnings?
Demographic controls (gender, age, tenure and no no yes yes yes time in position)
P-value for test against model in column 3 -- -- -- 0.64 0.76
Notes: All models are estimated by OLS. Standard errors, clustered by campus/department, are in parentheses (818 clusters for allmodels). Dependent variable in all models is dummy for using Sacramento Bee web site (mean for control group=19.2 percent; mean fortreatment group=49.4 percent; overall mean=27.6 percent). "Earnings" refers to total UC payments in 2007. Deviation of earnings frommedian are expressed in $10,000s. Pay unit refers to faculty or staff members in an individual's department. All models with interactionterms also include main effects. The sample size is 6,411.
Table 3: Effect of Treatment on Use of Sacramento Bee Website

(1) (2) (3) (4) (5) (6) (7) (8) (9)
Treated individual -2.0 -- -- 1.0 -- -- 2.0 -- --(2.2) (1.2) (1.1)
I. Treated individual with earnings ≤ median -- -6.3 -- -- 4.3 -- -- 5.2 -- pay in unit (2.9) (1.8) (1.8)
II. Treated individual with earnings > median -- 2.0 2.2 -- -2.0 -2.0 -- -0.9 -0.9 pay in unit (2.6) (2.6) (1.6) (1.6) (1.3) (1.3)
II-I -- 8.3 -- -- -6.3 -- -- -6.1 --(3.5) (2.4) (2.1)
Treated × earnings in first quartile -- -- -15.0 -- -- 8.0 -- -- 8.1in pay unit (4.0) (2.6) (2.4)
Treated × earnings in second quartile -- -- 1.9 -- -- 0.8 -- -- 2.5in pay unit (3.9) (2.5) (2.3)
P-value for exclusion of 0.36 0.05 0.00 0.85 0.03 0.01 0.08 0.01 0.00treatment effects
Mean of the dependent variable in the
control group [standard deviation]
Table 4: Effect of Information Treatment on Measures of Job Satisfaction
Dissatisfied and Likely Looking for a New Job
(10 point scale) (Yes = 1)Satisfaction Index
Reports Very likely to Look for New Job
[66.1]
(Yes = 1)
Notes: All models are estimated by OLS. All coefficients and means are multiplied by one hundred. Standard errors, clustered by campus/department, are inparentheses (818 clusters for all models). "Earnings" refers to total UC payments in 2007. Pay unit refers to the respondent's department or administrative unit. Medianpay is computed seperately for faculty and staff. The satisfaction index is the average of responses for the questions: "How satisfied are you with your wage/salary onthis job?", "How satisfied are you with your job?", and "Do you agree or disagree that your wage is set fairly in relation to others in your department/unit?". Responses toeach of these questions are on a 1-4 scale and are ordered so that higher values indicate greater satisfaction. The variable "Dissatisfied and Likely Looking for a NewJob" is 1 if the respondent is below the median value of the satisfaction index and reports being "very likely" to make an effort to find a new job. See text and AppendixTable A3 for further details on the construction of the dependent variables. In addition to the explanatory variables presented in the table, all models include controls forcampus × (staff/faculty), a cubic in earnings, and main effects. The sample size is 6,411.
274.2 21.9
[41.4]
12.9
[33.5]

(1) (2) (3) (4) (5) (6) (7) (8) (9)
Treated individual × deviation of earnings from 1.7 -- -0.8 -1.4 -- -0.1 -1.3 -- 0.2median if deviation negative (coefficient × 100) (0.9) (1.5) (0.5) (0.9) (0.5) (0.8)
Treated individual × deviation of earnings from -0.5 -- -0.8 -0.5 -- -0.5 -0.2 -- -0.1median if deviation positive (coefficient × 100) (0.6) (0.9) (0.3) (0.4) (0.2) (0.3)
Treated individual × deviation of rank from 0.5 -- 2.4 3.3 -- -1.9 -1.7 -- -1.8 -2.0if deviation negative (coefficient × 10) (1.0) (1.8) (0.7) (1.1) (0.6) (1.0)
Treated individual × deviation of rank from 0.5 -- -0.3 0.8 -- -0.8 -0.1 -- -0.4 -0.2if deviation positive (coefficient × 10) (0.9) (1.5) (0.5) (0.8) (0.4) (0.7)
Controls for campus × (staff/faculty) yes yes yes yes yes yes yes yes yes and cubic in earnings?
P-value for exclusion of treatment effects 0.12 0.06 0.07 0.01 0.01 0.03 0.02 0.01 0.03
Table 5: Effect of Information Treatment on Measures of Job Satisfaction: Earnings Differences vs. Rank
Notes: All models are estimated by OLS. Standard errors, clustered by campus/department, are in parentheses (818 clusters for all models). "Earnings" refers to total UCpayments in 2007. Pay unit refers to faculty or staff members in an individual's department. See note to Table 4 for description of the dependent variables. In addition to theexplanatory variables presented in this table, specifications 1, 3, 4, 6, 7, and 9 include the deviation of earnings from the median earnings in the pay unit if the deviation ispositive, the deviation of earnings from the median earnings in the pay unit if the deviation is negative, and an indicator for whether the deviation is negative. Deviation ofearnings from median are expressed in $10,000s. Specifications 2,3,5,6, 8 and 9 include the deviation of the rank in the pay unit from 0.5 if the deviation is positive, the deviation of the rank in the pay unit from 0.5 if the deviation is negative, and an indicator for whether the deviation is negative. The sample size is 6,411.
(10 point scale) (Yes = 1) (Yes = 1)
Satisfaction IndexReports Very likely to Look for
New JobDissatisfied and Likely Looking for a New Job

Treatment Placebo p-valuea Treatment Placebo p-valuea Treatment Placebo p-valuea
(1) (2) (3) (4) (5) (6) (7) (8) (9)Treated individual with earnings less -8.6 1.7 0.04 4.7 -3.3 0.06 7.8 -4.0 0.00than median in pay unit (4.6) (4.5) (2.8) (3.7) (2.6) (3.2)
Treated individual with earnings more -1.5 -1.4 0.98 -3.3 -1.9 0.63 -1.3 1.4 0.22than median in pay unit (3.8) (3.7) (2.5) (2.9) (1.8) (2.1)
Controls for staff/faculty status and cubic yes yes yes yes yes yes in wage?Observations 2303 1880 2303 1880 2303 1880
a p-value for hypothesis that placebo and treatment effects are equal.
Table 6: Estimates of the Effect of "Placebo" Treatment
Notes: All models are estimated by OLS. All coefficients are multiplied by 100. Standard errors, clustered by campus/department, are in parentheses. "Treatment" inthe columns denotes the information treatment. "Placebo" denotes the placebo treatment. Sample is for UCLA only. Treatment specifications exclude the placebogroup. Placebo specifications exclude the treatment group. Standard errors, clustered by campus/department, are in parentheses. "Earnings" refers to total UCpayments in 2007. Pay unit refers to faculty or staff members in an individual's department. Models are based on specifications 2, 5, and 8 of Table 4. For additionaldetails see notes to Table 4 and text.
Reports Very likely to Look for New Job
Dissatisfied and Likely Looking fora New Job
(10 point scale) (Yes = 1) (Yes = 1)Satisfaction Index

Survey Respondents
Only
(1) (2) (3) (4) (5)
Reported "very likely" to make a genuine 19.5 -- -- -- --effort to find a new job (coefficient × 100) (1.62)
Reported "somewhat likely" to make a genuine 4.96 -- -- -- --effort to find a new job (coefficient × 100) (1.20)
Treated individual with earnings > median -- 1.42 0.84 -- -- pay in unit (coefficient × 100) (1.29) (0.93)
Treated × earnings in first quartile -- 2.61 2.30 -- --in pay unit (coefficient × 100) (1.78) (1.32)
Treated × earnings in second quartile -- -0.39 -0.71 -- --in pay unit (coefficient × 100) (1.64) (1.19)
Treated individual × deviation of rank from 0.5 -- -- -- -0.74 -0.63if deviation negative (coefficient × 10) (0.51) (0.36)
Treated individual × deviation of rank from 0.5 -- -- -- 0.43 0.27if deviation positive (coefficient × 10) (0.39) (0.31)
Controls for campus × (staff/faculty) Yes Yes Yes Yes Yesand cubic in earnings?Department fixed-effects No No Yes No YesObservations 6,599 31,882 31,882 31,882 31,882
Notes: All models are estimated by OLS. Dependent variable is 1 if we were not able to locate an individual in online campusdirectories in August 2011, and 0 otherwise. (Overall mean of dependent variable is 0.31). Sample in columns 2-5 includes allindividuals in employee subsample matched to earnings data. We found found 49 percent of original sample in UCSC, 76 percent inUCSD, and 74.5 percent in UCLA. Sample in column 1 only is restricted to individuals who responded to our survey with validresponse for search intentions question. Excluded category in column 1 is "not likely at all". In addition to the explanatory variablespresented in the table, models in columns 2-5 include an indicator for whether the respondent is paid at least the median in his/her payunit. Column 4 and 5 include the deviation of the rank in the pay unit from 0.5 if the deviation is positive and negative.
Table 7: Effect of Information Treatment on Job Mobility
All Employees Who Could be Matched to Earnings Data

Online Appendix of “Inequality at Work: The Effect ofPeer Salaries on Job Satisfaction”
This appendix includes the exact survey questions and a set of supplementary tables A0-A9that are referred to in the main text. Complete explanations for the supplementary tables areprovided in the notes of each table.
Survey Questions
In this appendix, we reproduce the exact wording of the online second stage survey. Weshow the exact questions in the case of UCLA (UCSC and UCSD surveys had a similar setof questions but did not include as many questions on the detailed use of the Sacramento Beewebsite).
The survey is divided into 3 parts: A. job satisfaction and pay equity questions, B. Demo-graphic and job characteristics questions, C. Knowledge and use of the SacBee website. Thoseparts were not be separately flagged to the subjects to avoid influencing the responses.
A. Job Satisfaction and Pay Equity:
1. Please indicate whether you agree or disagree with the following statements:
(a) “My wage/salary is set fairly in relation to others in my department or unit.”
(b) “My wage/salary is set fairly in relation to workers in similar jobs on campus.”
(c) “My wage/salary is set fairly in relation to workers in similar jobs at other UCcampuses.”
Strongly Agree/Agree/Disagree/Strongly Disagree
2. Please indicate whether you agree or disagree with the following statement: “Differencesin income in America are too large.”Please pick one of the answers below.
– Strongly agree
– Agree
– Disagree
– Strongly disagree
3. Do you expect to receive a salary increase in the next 3 years over and above the standardcost of living adjustment?Please pick one of the answers below.
– Yes
– No
31

4. Please indicate whether you agree or disagree with the following statement: “At UC,individual performance on the job plays an important role in promotions and salary in-creases.”Please pick one of the answers below.
– Strongly agree
– Agree
– Disagree
– Strongly disagree
(a) How satisfied are you with your wage/salary on this job?Please pick one of the answers below.
– Very satisfied
– Somewhat satisfied
– Not too satisfied
– Not at all satisfied
(b) All in all, how satisfied are you with your job?Please pick one of the answers below.
– Very satisfied
– Somewhat satisfied
– Not too satisfied
– Not at all satisfied
5. Taking everything into consideration, how likely is it you will make a genuine effort tofind a new job within the next year?Please pick one of the answers below.
– Very likely
– Somewhat likely
– Not at all likely
B. Demographic and Job Characteristics Questions:
Please tell us a few things about yourself:
1. Are you working full-time or part-time in your job on campus?Please pick one of the answers below.
– Full-time
– Part-time
(a) Is your position covered by a collective bargaining agreement?Please pick one of the answers below.
32

– Yes
– No
2. Are you female or male?Please pick one of the answers below.
– Female
– Male
3. What is your current age?Please pick one of the answers below.
– Under 25
– 25-34
– 35-54
– Over 55
4. How many years have you worked at this university?Please pick one of the answers below.
– Less than 1 year
– 2 to 5 years
– 6 to 10 yrs
– 11 to 20 years
– More than 20 years
5. How many years have you worked in your current position?Please pick one of the answers below.
– Less than 1 year
– 2 to 5 years
– 6 to 10 yrs
– 11 to 20 years
– More than 20 years
C. Awareness and use of the Sacramento Bee website:
1. Are you aware of the web site created by the Sacramento Bee newspaper that lists salariesfor all State of California employees? (The website is located at www.sacbee.com/statepay,or can be found by entering the following keywords in a search engine: Sacramento Beesalary database).Please pick one of the answers below.
– Yes
33

– No
If no, skip 2-4.
2. (a) When did you learn about the salary database posted by the Sacramento Bee?Please pick one of the answers below.
– In the last few weeks
– More than one month ago
(b) Please tell us: Have you used the Sacramento Bee salary database?Please pick one of the answers below.
– Yes
– No
If yes, skip 4; If no, skip 3.
3. (a) Which people’s salaries were you most interested in? (You may select more than onegroup.)
– Colleagues in my department
– Colleagues in other departments on campus
– Colleagues at other campuses
– Highly paid or high profile people
(b) Were the salaries you checked higher or lower than you expected?Please pick one of the answers below.
– Higher
– About what I expected
– Lower
4. Why didn’t you use SacBee website? (Select all the options that apply.)
– I already know enough about salaries of University employees
– Learning about colleagues’ pay could make me feel underpaid
– Learning about colleagues’ pay could make me feel overpaid
– I want to respect the privacy of my colleagues on campus
– Information about salaries of University employees is of no interest to me
5. Do you think that making available public information on individual salaries is
– Helpful for people who are paid less than average
– Harmful for people who are paid less than average
– Helpful for morale in your department
– Harmful for morale in your department
– Likely to lead to salary increases for some people
– Likely to lead some people to look for other jobs
If you have any additional comments please feel free to enter them here before you submitthe questionnaire. Please write your answer in the space below.
34

CampusInformation Treatment
Assignment Placebo Assignment Response Incentive Assignment
UC Santa Cruz 66.7% of departments assigned none 33% of departments assigned to 100%N=3,606 in 223 departments incentive (all receive incentive) or administrative units 60% of individuals in treated 33% of departments assigned to 50%
department assigned incentive (one-half receive incentive)33% of departments assigned to no
target = 40% of individuals incentive (none receive incentive)actual = 42.0%
target = 50% of individualsactual = 49.3%
UC San Diego 50% of departments assigned none 33% of departments assigned to 100%N=17,857 in 410 departments incentive (all receive incentive) or administrative units 50% of individuals in treated 33% of departments assigned to 50%
department assigned incentive (one-half receive incentive)33% of departments assigned to no
target = 25% of individuals incentive (none receive incentive)actual = 23.9%
target = 50% of individualsactual = 55.0%
UCLA 50% of departments assigned 25% of departments assigned All individuals receive incentiveN=20,512 in 445 departments or administrative units 75% of individuals in treated 75% of individuals in placebo
department assigned department assigned
target = 37.5% of individuals target = 18.8% of individualsactual = 36.4% actual = 21.9%
All Three campuses target = 32.4% of individuals target = 9.2% of individuals target = 74.4% of individualsN=41,975 in 1,078 departments actual = 31.6% actual = 10.7% actual = 76.5% or administrative units
Appendix Table A0: Design of the Information Experiment
Notes: Assignment was based on name/email and department information contained in online directories. Sample sizes reflect number of valid email addresses extractedfrom directories. See text for procedures used to define departments/administrativeunits. The response incentive explicitlyoffered the opportunity to win $1000 (from arandom lottery with 3 winners for each campus) for survey respondents. The information treatment assignment and the response incentive assignment were orthogonal.Placebo treatment departments were randomly selected from among control departments which did not receive the information treatment.

Percent Responded Percent With EarningsNumber in Percent Matched Percent Responded Conditional on and non-missing Sample Size
Online Directory to Earnings Data to Survey Earnings Data Survey Data in Analysis File(1) (2) (3) (4) (5) (6)
UC Santa Cruz
Staff 2,797 70.3 14.7 16.8 10.9 306
Faculty 809 73.6 18.9 21.2 14.7 119
All 3,606 71.1 15.6 17.8 11.8 425UC San Diego
Staff 15,782 81.1 24.0 24.0 17.9 2,830
Faculty 2,075 78.8 21.7 23.8 17.5 363
All 17,857 80.8 23.7 23.9 17.9 3,193UCLA
Staff 16,227 73.8 19.0 19.8 14.1 2,283
Faculty 4,285 68.1 16.3 19.1 12.5 536
All 20,512 72.6 18.4 19.6 13.7 2,819All Three campuses
Staff 34,806 76.8 20.9 21.6 15.6 5,419
Faculty 7,169 71.8 18.2 20.8 14.1 1,018
All 41,975 76.0 20.4 21.4 15.3 6,437
Notes: Sample sizes in column (1) reflect number of valid email addresses extracted from directories. Earnings data were matched to directory data by campus and name.Entries in columns 5 and 6 are based on individuals in the online directory who can be matched to earnings data, responded to the survey, and provided non-missingresponses for 8 key questions.
Appendix Table A1: Matching and Response Rates

Use Sacramento Bee website
Colleagues in own
department
Colleagues in other
departments, own campus
Colleagues at other UC
campuses"High-profile"
UC employeesAny of those in
cols. 2-5(1) (2) (3) (4) (5) (6)
Mean rate of use for control group (percent) 24.3 15.2 10.1 6.4 13.2 23.9
Estimated treatment effect from model with basic controls:Treated individual (coefficient × 100) 27.8 24.1 15.0 7.5 9.5 27.6
(2.4) (2.2) (1.7) (1.4) (2.0) (2.4)Estimated treatment effect from interacted model with basic controls:Treated individual with earnings less than 29.5 25.4 14.5 7.6 10.6 29.4 median in pay unit (coefficient × 100) (3.5) (3.3) (2.3) (2.0) (2.9) (3.5)
Treated individual with earnings greater than 26.3 23.0 15.6 7.4 8.7 26.1 median in pay unit (coefficient × 100) (2.8) (2.7) (2.1) (1.7) (2.4) (2.8)
P-value for equality of treatment effects a 0.45 0.54 0.72 0.92 0.56 0.41
at-test for equality of treatment effects for people with earnings below median in pay unit and those with earnings above median in pay unit.
Appendix Table A2: Treatment Effects on Use of Sacramento Bee Website for Different Types of Salary InformationUsed Sacramento Bee Website and Looked at Salary Information for:
Notes: Estimated on sample of 2,806 survey respondents from UCLA (1,880 controls, including those assigned placebo treatment, and 926 treated individuals).Estimated treatment effects are from OLS models that control for faculty status and cubic in wage. Interacted model also includes dummy indicating whetherindividual pay is below median for pay unit. Standard errors, clustered by department, are in parentheses (358 clusters for all models). Earnings refer to total UCpayments in 2007. Pay unit refers to faculty or staff members in an individual's department.

Not At All Satisfied
Not Too Satisfied
Somewhat Satisfied
Very Satisfied
Overall Sample (N=6411) 16.3 31.9 40.1 11.7Control Group (N=4635) 15.9 32.5 39.5 12.1Controls Reweighteda 15.6 32.9 39.6 11.8Treatment Group (N=1776) 17.3 30.4 41.8 10.6
Overall Sample (N=6411) 3.3 12.1 47.3 37.3Control Group (N=4635) 3.3 12.2 47.4 37.2Controls Reweighteda 3.0 12.1 47.1 37.8Treatment Group (N=776) 3.3 12.0 47.1 37.6
Not At All Likely
Somewhat Likely Very Likely
Overall Sample (N=6411) 47.0 30.8 22.2Control Group (N=4635) 47.2 30.7 21.9Controls Reweighteda 47.5 30.5 22.1Treatment Group (N=1776) 45.8 31.1 23.1
Strongly Disagree Disagree Agree
Strongly Agree
Overall Sample (N=6411) 11.7 31.1 47.5 9.8Control Group (N=4635) 11.4 31.0 47.8 9.9Controls Reweighteda 11.3 31.4 47.5 9.8Treatment Group (N=1766) 12.6 31.1 46.9 9.4
Overall Sample (N=6397) 1.9 11.4 38.1 48.5Control Group (N=4625) 2.1 11.6 38.8 47.6Controls Reweighteda 2.2 11.4 38.5 48.0Treatment Group (N=1772) 1.6 11.0 36.5 51.0
1 4/3 5/3 2 7/3 8/3 9 10/3 11/3 4Satisfaction Index (10 point scale) Overall Sample (N=6411) 1.3 2.7 5.8 9.8 14.7 18.3 20.4 15.4 7.4 4.2
Control Group (N=4635) 1.3 2.7 5.6 9.6 14.9 18.5 20.5 15.2 7.3 4.5Controls Reweighteda 1.2 2.5 5.7 9.4 15.1 19.0 20.5 15.2 7.0 4.6Treatment Group (N=1766) 1.4 2.7 6.2 10.3 14.3 17.9 20.2 16.1 7.6 3.4
No YesDissatisfied and likely to make an Overall Sample (N=6411) 86.6 13.4effort to find a job Control Group (N=4635) 87.1 12.9
Controls Reweighteda 87.2 12.8Treatment Group (N=1766) 85.1 14.9
Notes: Entries are tabulations of responses for analysis sample (or subset of analysis sample with non-missing responses).aMeans for control group are reweighed across campuses to reflect unequal probability of treatment at different campuses. Reweighted controls are then directly comparable toTreatment.
"Do you agree or disagree that your wage isset fairly in relation to others in your department/unit?"
"How satisfied are you with your wage/salary on this job?"
"How satisfied are you with your job?"
"How likely is it you will make a genuine effort to find a new job within the next year?"
"Do you agree or disagree that differences in income in America are too large?"
Appendix Table A3: Means of Outcome Measures by Treatment Status

Wage is fair Satisfied with Wage on Job
Satisfied with Job
Likely to Look for New Job
(1-4 scale) (1-4 scale) (1-4 scale) (1-3 scale)(1) (2) (3) (4)
I. Treated individual with earnings ≤ than -10.1 -6.3 -8.5 11.6 median in pay unit (coefficient × 100) (4.9) (4.5) (4.9) (4.5)
II. Treated individual with earnings > than 2.5 -0.5 6.3 -3.3 median in pay unit (coefficient × 100) (4.5) (4.5) (4.4) (4.9)
II-I 12.6 5.8 14.8 -14.9(6.0) (5.7) (6.5) (6.6)
Controls for campus × (staff/faculty) Yes Yes Yes Yesand cubic in earnings?
P-value for exclusion of 0.08 0.38 0.07 0.03 treatment effects
Appendix Table A4: Ordered Probit Models for Effect of Information Treatment on Measures of Job Satisfaction
Notes: Specifications are ordered probit models. Standard errors, clustered by campus/department, are inparentheses(818 clusters for all models). "Earnings" refers to total UC payments in 2007. Pay unit refers to faculty orstaff members in an individual's department. See Appendix Table A3 and text for description and means of thedependent variables. For columns 1-3 responses are ordered so that higher values indicate greater satisfaction.Models are based on specification 2 of Table 4. In addition to the explanatory variables presented in the table, allmodels include an indicator for whether the respondent is paid at least the median in his/her pay unit.

Panel A: Females Males Staff FacultyLow
TenureHigh
TenureSatisfaction Index (1) (2) (3) (4) (5) (6)
I. Treated individual with earnings ≤ than -5.9 -6.7 -7.0 -3.1 -3.0 -9.5 median in pay unit (coefficient × 100) (3.5) (4.6) (3.5) (6.3) (3.8) (4.2)
II. Treated individual with earnings > than 3.8 -0.3 1.6 4.5 -2.7 3.3 median in pay unit (coefficient × 100) (3.5) (4.0) (2.9) (5.8) (4.6) (3.0)
II-I 9.7 6.3 8.6 7.6 0.3 12.8(4.7) (5.7) (4.1) (8.6) (5.6) (4.8)
P-value for exln. of treatment effects 0.11 0.35 0.09 0.66 0.64 0.03
Observations 3908 2503 5396 1015 2558 3853
Panel B: Females Males Staff FacultyLow
TenureHigh
Tenure
Very Likely to Look for New Job (Yes = 1) (1) (2) (3) (4) (5) (6)
I. Treated individual with earnings ≤ than 5.5 2.2 5.2 0.1 7.3 1.2 median in pay unit (coefficient × 100) (2.2) (3.3) (2.0) (3.6) (2.6) (2.5)
II. Treated individual with earnings > than -3.8 0.4 -2.8 2.1 -1.4 -2.1 median in pay unit (coefficient × 100) (2.0) (2.4) (1.8) (3.4) (3.3) (1.7)
II-I -9.2 -1.8 -8.0 2.1 -8.7 -3.3(2.8) (4.5) (2.7) (5.0) (4.0) (3.0)
P-value for exclusion of treatment effects 0.01 0.77 0.01 0.82 0.02 0.42
Panel C: Females Males Staff FacultyLow
TenureHigh
TenureDissatisfied and Likely Looking for a New Job (Yes = 1) (1) (2) (3) (4) (5) (6)
I. Treated individual with earnings ≤ than 5.4 4.8 5.8 2.5 5.8 4.8 median in pay unit (coefficient × 100) (2.1) (2.9) (2.0) (3.0) (2.4) (2.4)
II. Treated individual with earnings > than -1.4 -0.2 -1.2 0.7 0.5 -1.4 median in pay unit (coefficient × 100) (1.7) (1.8) (1.5) (2.3) (2.5) (1.4)
II-I -6.8 -5.1 -7.1 -1.8 -5.3 -6.1(2.5) (3.6) (2.4) (3.7) (3.3) (2.8)
P-value for exclusion of treatment effects 0.02 0.26 0.01 0.68 0.05 0.09Notes: All models estimated by OLS. Standard errors, clustered by campus/department, are in parentheses."Earnings" refers to total UC payments in 2007. Pay unit refers to faculty or staff members in an individual'sdepartment. Models are based on specifications 2, 5, and 8 of Table 4. For additional details see notes to Table 4and text.
Appendix Table A5: Effect of Information Treatment -- by Subgroup

(1) (2) (3) (4)
Panel A: Workers with earnings ≤ median
Treated individual (coefficient × 100) 4.0 -8.6 -5.9 -6.8(1.8) (4.8) (2.9) (9.1)
Treated individual × Predicted -- 0.5 -- 0.0probability of search (coefficient × 100) (0.2) (0.4)
Predicted probability of search -- 0.9 -- 0.0(0.1) (0.2)
Controls for campus × (staff/faculty) Yes Yes Yes Yes and cubic in earnings?
Panel B: Workers with earnings > median
Treated individual (coefficient × 100) -1.8 -2.0 2.4 12.7(1.6) (3.1) (2.5) (6.4)
Treated individual × Predicted -- 0.5 -- -0.5probability of search (coefficient × 100) (0.2) (0.3)
Predicted probability of search -- 0.8 -- 0.1(0.1) (0.2)
Controls for campus × (staff/faculty) Yes Yes Yes Yes and cubic in earnings?
Notes: All models estimated by OLS. Standard errors, clustered by campus/department, are inparentheses. "Earnings" refers to total UC payments in 2007. Pay unit refers to faculty or staff membersin an individual's department. The predicted probability of search is the predicted value from a probitmodel estimated over the control group where the dependent variable is 1 if the respondent reports being"very likely" to be searching for a new job, with age, gender, tenure, faculty/staff, campus, and time inposition dummy controls. See note to Table 4 for definitions of the dependent variables.
Appendix Table A6: Effect of Predicted Mobility on Search and Satisfaction Treatment Effects
Likely to Look for New Job Satisfaction Index
(Yes = 1) (10 point scale)

Faculty Staff Faculty Staff Faculty Staff(1) (2) (3) (4) (5) (6)
I. Treated individual with earnings ≤ than -16.9 -5.6 3.4 4.6 4.6 5.1campus median (6.6) (3.5) (3.7) (2.1) (3.3) (2.0)II. Treated individual with earnings > than 16.7 0.0 -0.8 -2.0 -1.1 -0.3campus median (5.3) (2.8) (3.2) (1.8) (2.1) (1.6)II-I 33.5 5.6 -4.1 -6.6 -5.8 -5.4
(8.6) (3.9) (4.9) (2.7) (3.9) (2.4)Controls for campus Yes Yes Yes Yes Yes Yes and cubic in earnings?P-value for exclusion of 0.00 0.25 0.64 0.05 0.32 0.03 treatment effects
Notes: This table reports the same specification as columns 2,5, and 8 of Table 4 but instead of computing themedian earnings of the reference group at the the department/administrative unit-level, we compute themedian at the campus-level, seperately for faculty and staff. All models are estimated by OLS. Allcoefficients and means are multiplied by one hundred. Standard errors, clustered by campus/department, arein parentheses. The sample size is 6,411.
Appendix Table A7: Effect of Information Treatment on Job Satisfaction by Pay Relative to Campus/Occupation Median
Satisfaction Index
Reports Very likely to Look for New Job
Dissatisfied and Likely Looking for a New Job
(10 point scale) (Yes = 1) (Yes=1)

Placebo all
Placebo - Exclude Dept's with Any
Top Admininstrators Placebo all
Placebo - Exclude Dept's with Any Top
Admininstrators Placebo all
Placebo - Exclude Dept's with Any Top
Admininstrators(1) (2) (3) (4) (5) (6)
Treated individual earning less 1.7 3.1 -3.3 -4.6 -4.0 -5.0than median in pay unit (4.5) (4.6) (3.7) (3.7) (3.2) (3.2)
Treated individual earning more -1.4 -2.5 -1.9 -0.4 1.4 2.1than median in pay unit (3.7) (4.0) (2.9) (3.1) (2.1) (2.2)
Controls for staff/faculty status and cubic yes yes yes yes yes yes in wage?Observations 1880 1669 1880 1669 1880 1669
Notes: All models are estimated by OLS. All coefficients are multiplied by 100. Standard errors, clustered by campus/department, are in parentheses. "Placebo" refersto the placebo information treatment. Sample includes UCLA employees who received either the placebo information treatment or no treatment. In columns 2, 4, and 6,individuals in any department or administrative unit that is home to a Dean, Associate Dean, or Provost is excluded. Standard errors, clustered by campus/department,are in parentheses. "Earnings" refers to total UC payments in 2007. Pay unit refers to faculty or staff members in an individual's department. Models are based onspecifications 2, 5, and 8 of Table 4. For additional details see notes to Table 4 and text.
Appendix Table A8: Estimates of the Effect of "Placebo" Treatment with and Without Top Administrators
Satisfaction Index Very likely to Look for New JobDissatisfied and Likely Looking for
New Job(10 point scale) (Yes = 1) (Yes = 1)

All coefficients are in percent (2) (3) (3) (4) (5) (6)
Treated individual with earnings > median -1.64 -2.14 -0.13 -- -- pay in unit (coefficient × 100) (.73) (.74) (1.29)
Treated × earnings in first quartile .54 .73 -.15 -- --in pay unit (coefficient × 100) (1.34) (1.49) (2.31)
Treated × earnings in second quartile .28 -.13 1.64 -- --in pay unit (coefficient × 100) (1.23) (1.27) (2.12)
Treated individual × deviation of rank from 0.5 -- -- -- -1.78 -1.93 -1.09if deviation negative (coefficient × 10) (3.93) (4.20) (6.53)
Treated individual × deviation of rank from 0.5 -- -- -- -3.74 -4.51 -2.13if deviation positive (coefficient × 10) (1.96) (2.05) (3.43)
Controls for campus × (staff/faculty) Yes Yes Yes Yes Yes Yesand cubic in earnings, and presence of overtime in 2007?
Sample AllNon-
responders Responders AllNon-
responders Responders
Observations 25,135 19,319 5,816 25,135 19,319 5,816
Notes: All models are estimated by OLS. Dependant variable is 100 if employee had positive overtime earnings in 2010 (and zero if not). The sample is allemployees still present in 2010 earnings data. The table is built following the same specifications as Table 7, columns 2 and 4. We do not include departmentfixed effects. The mean of the dependent variable for the full sample is 24.8%. In addition to the standard controls (campus x (staff/faculty)) and cubic in 2007earnings, we added an indicator for having overtime earnings in 2007. Responders is the set of employees who responded to our survey (and hence learnedabout the Sacramento Bee website even if they were in the control group). Non-responders is the set of employees who did not respond to our survey (and forwhom the treatment vs. control first stage effects is still potentially relevant). All coefficients are in percent.
Appendix Table A9: Effect of Information Treatment on Presence of Overtime Earnings in 2010