Embed Size (px)
Citation preview

Inequality and Redistribution in the Australian Welfare State
Peter Whiteford, Crawford School of Public Policy

Acknowledgements
• Research supported as part of the GINI project – “Growing Inequalities’ Impacts” http://www.gini-research.org/articles/research. EU Seventh framework programme cooperation, Theme 8, Socio-economic sciences and humanities, SSH-2009 - 2.2.1 social inequalities, their implications and policy options
• “The project focus is inequalities in income/wealth and education and their social, political and cultural impacts. It highlights potential effects of individual distributional positions and increasing inequality for a host of ‘bad outcomes’ (both societal and individual) and allows feedback from these impacts to inequality itself in a frame of policy-oriented debate and comparison across 25 EU countries, the USA, Japan, Canada and Australia.”
• Also based on work undertaken and to continue with Gerry Redmond (Flinders University), Philip Hayes and Elizabeth Adamson (UNSW), “Supporting families: Horizontal and vertical equity in the Australian tax-benefit system in historical and comparative perspectives “, funded by ARC (LP 100100596).

Background and outline• Increasing interest internationally and in Australia in trends in
inequality.– Questions about the contribution of growing income inequality
in USA to financial crisis (R.G. Rajan, “Fault Lines”, 2010)
• This presentation is primarily descriptive – what has happened to income inequality in Australia over recent decades, and what factors appear to be associated with these trends.
• Data and methods; measures of inequality
• Situating Australia internationally
• Income inequality: trends and driving forces
• Redistribution through taxes and benefits
• Discussion and conclusions

Data and methods
• Data are from Australian Bureau of Statistics (ABS) income surveys from 1981-82 to 2007-08 and in some cases 2009-10. The ABS has changed and improved income measures over time; for consistency we use the “unimproved” income measure, showing lower inequality after 2005-06, but effects on earlier trends uncertain.
• Income measure is current weekly income of income units (nuclear family), adjusted for household size using “revised OECD equivalence scales”.
• Income is conventionally made up of market income (earnings, self-employment, investment and property income, private transfers); the addition of transfers from government (social security benefits) or privately (e.g. child support) produces gross income; direct taxes are deducted to estimate cash disposable income.
• Also important to bear in mind what is not included in cash disposable income – e.g. imputed income from housing, indirect taxes, non-cash benefits, superannuation - or is/maybe included but is not easily identifiable – e.g. tax expenditures (concessions) .

How is inequality measured?• What inequalities are we interested in or concerned about –
inequality of income, inequality of opportunity, inequality of wealth?• Inequality is often thought of as disparities or gaps – what is the
distance between a low income and a high income household, or what is the ratio of their incomes, e.g. what is the gap between the richest 10% and the poorest 10% (decile) or the richest and poorest 20% (quintile)?– A lot of inequality is at the extremes, i.e. within the
richest and poorest income groups• The measure of inequality most commonly used is the Gini
coefficient, which varies between zero – when all households have exactly the same income and one – when one household has all the income. Preferred because it is calculated for everyone in the population.
• Other measures are sensitive to inequality at the extremes.

Previous studies• A notable recent study of income inequality trends in Australia is the
2011 Fay Gale lecture by Professor Denise Doiron, UNSW.• There are a number of similarities between our results and hers, but
also some differences.• Because our work is interested in long-term trends, we exclude the
effects of the improvements made to surveys from 2007-08. • Also this work looks mainly at households of working age, rather than
all households as in Professor Doiron’s analysis.• Despite this, overall trends fairly similar – except Figure 4 in the Fay
Gale lecture which shows a decline in real income for the poorest 20% between 2003-07. As shown below we find significant real increases.
• Note also recent OECD studies, Growing Unequal and Divided We Stand, which also use unadjusted ABS figures.

Situating Australia Internationally

Level of inequality in OECD countries2005 2008

Change in inequality, OECD countries, 1995 to 2007-08

Sen welfare index, OECD countries, 2008Mean equivalised income, adjusted to USD (PPPs) and adjusted for inequality

Change in real GDP, Australia and selected OECD countries, 2008 to 2011Q4 2007=100

Median Australian households have fared extremely well 1998=1
Australia USA

Income inequality: trends and driving forces
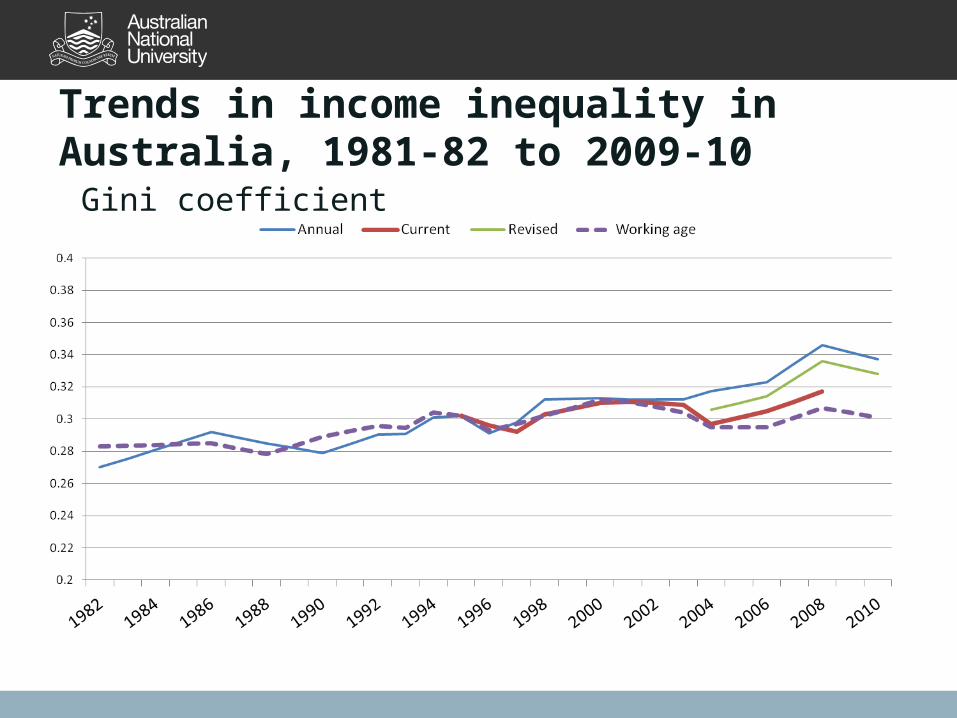
Trends in income inequality in Australia, 1981-82 to 2009-10 Gini coefficient

Trends in alternative inequality indicators for working age households, 1981-82 to 2009-10

Patterns of income growth by decile and period, Australia, 1981-82 to 2007-08
Average annual percentage change in real equivalent household income, working age
0.0%1.0%2.0%3.0%4.0%5.0%6.0%7.0%8.0%9.0%
10.0%
1 2 3 4 5 6 7 8 9 10
1982 to 1996 1996 to 2003 2003 to 2007

Components of change in real disposable income, working-age households, 2003-04 to
2007-08

Trends in income inequality in different income components among working age households,
Australia, 1982 to 2007-08Gini coefficient

Redistribution

Assessing redistribution• Redistribution refers to the outcomes of different tax and benefit
systems – how much do the benefit and tax systems actually change the distribution of household income?
• Conventionally measured by comparing measures of income inequality at different stages in the income accounting framework:– Difference between inequality in market and gross
incomes is measured as the impact of social security benefits,
– Difference between inequality in gross and disposable incomes is measured as the impact of taxation.
• Redistribution is the product of the volume of taxes and benefits and their distribution across income groups (progressivity).
• Possible to disaggregate inequality by income sources, type of household (family composition) or location.

Trends in income inequality in different income measures among working age households,
Australia, 1982 to 2007-08
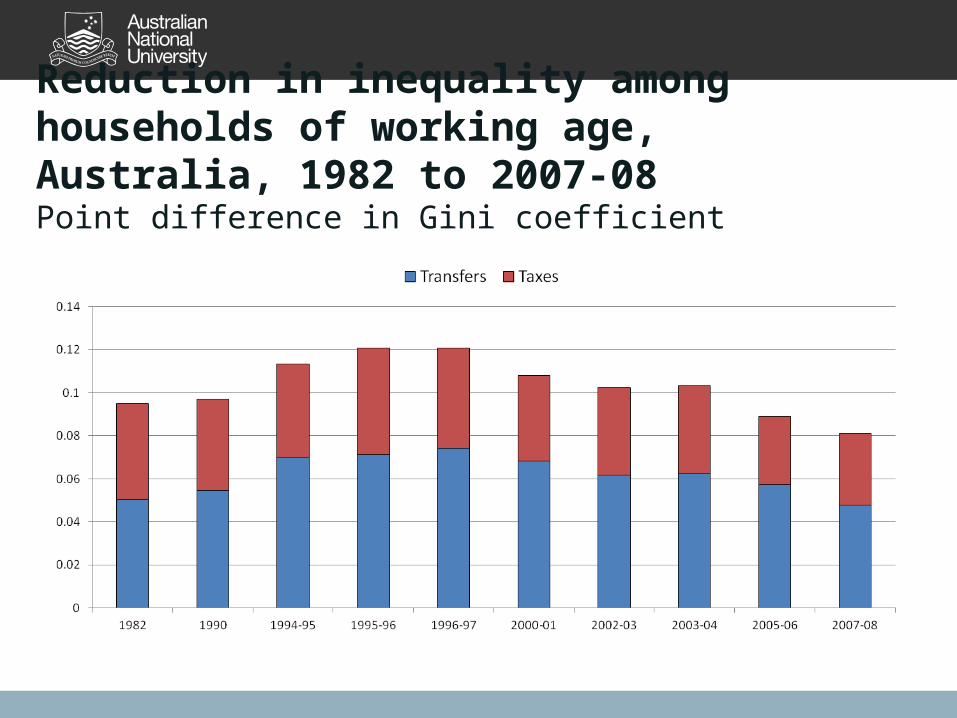
Reduction in inequality among households of working age, Australia, 1982 to 2007-08Point difference in Gini coefficient

Trends in progressivity of transfers and taxes for working age households, 1982 to 2007-08Concentration coefficient
Transfers Taxes

Average tax rates (%) by deciles of household income, 1982, 1996-97 and 2007-08

Assessing income inequality trends• Trends in inequality differ by time period, income components and income measures.
Thus, there is no single trend, but the complex interaction of multiple influences.• Market income inequality rose in period of Labor government, mainly reflecting higher
joblessness and wider wage dispersion. Disposable income inequality rose significantly less (about 1/3 as great), reflecting both transfer and tax changes.
• Despite increasing wage dispersion, market income inequality fell from 1996-97 to 2007-08, mainly because of increased family earnings, particularly for women. Capital income inequality rose significantly after 2003, but insufficient to offset lower inequality in earnings.
• The effectiveness of the tax system in reducing inequality was stable in the 1980s and early 1990s, but reduced after 1996. Average tax rates fell most for the highest decile (about 4 percentage points).
• The effectiveness of the transfer system in reducing inequality increased by about 40% in the period of the Labor government, but fell back to its original level by 2007-08. This does not necessarily reflect explicit policy change, but rising earnings among lower income groups lead to a scaling back of income support , heightened by indexation of key benefits to prices.

Joblessness is a major source of inequality in Australia
• Earnings represent around three-quarters of total pre-tax household income, the largest single component.
• In 1983, a full-time worker at the 90th percentile earned 2.0 times as much as a worker at the 10th percentile- this disparity increased to 2.3 in 1996, 2.5 in 2004, and 2.8 in 2009-10.
• In 1982 a working-age family at the 90th percentile earned 112 times as much as a family at the 10th percentile – this disparity reduced to 56 times as much in 1996 and 49 times as much in 2009-10.
Benefits reduce inequality more than taxes• When social security benefits are added in, this disparity was reduced to 9.8
times as much in 1982, 10.2 times as much in 1996 and 11.4 times as much in 2009-10.
• Taxes reduced the disparity to 8.0 to 1 in 1982, 7.5 to 1 in 1996 and 9.6 to 1 in 2009-10.
But you also need taxes to pay for benefits

Income measures and concepts are important• Inequality is lower the longer the time period over which it is measured –
between 2001 and 2009 the Gini coefficient went from 0.306 in 2000, 0.300 in 2003, 0.312 in 2007 and 2008 and 0.299 in 2009; inequality over a two-year period varied between 0.286 and 0.295; inequality over a four year period varied between 0.273 and 0.282; inequality over the 9 years was 0.263.
• Broader measures of resources also suggest lower inequality, particularly the addition of non-cash benefits (health, education, community services) even after subtracting indirect taxes. For example, the 90/10 ratio for disposable income in 2009-10 was 3.9 to 1, but for “final income” it was 2.65 to 1.
• Inequality is mainly reduced by raising the bottom not reducing the top:– Direct taxes and cash transfers increase the incomes of the 10 th percentile by 231% and
lower the income of the 90th percentile by 19%;
– The net effect of Indirect benefits and taxes is to raise the 10 th percentile by a further 50% and raise the 90th percentile by 1%.
27

Additional material

Inequality is lower the longer the time period over which it is measured
29

Inequality of earnings among households of working age, 2005Gini coefficients for different earnings measures
00.10.20.30.40.50.60.7
Personal earnings, full-time workers
Personal earnings, full-time and part-
time
Household earnings, all workers
Including jobless
Australia Denmark USA
30

Trends in earnings inequality for full-time workers, Australia, 1975 to 2008

Trends in poverty, Australia, 1982 to 2009-10
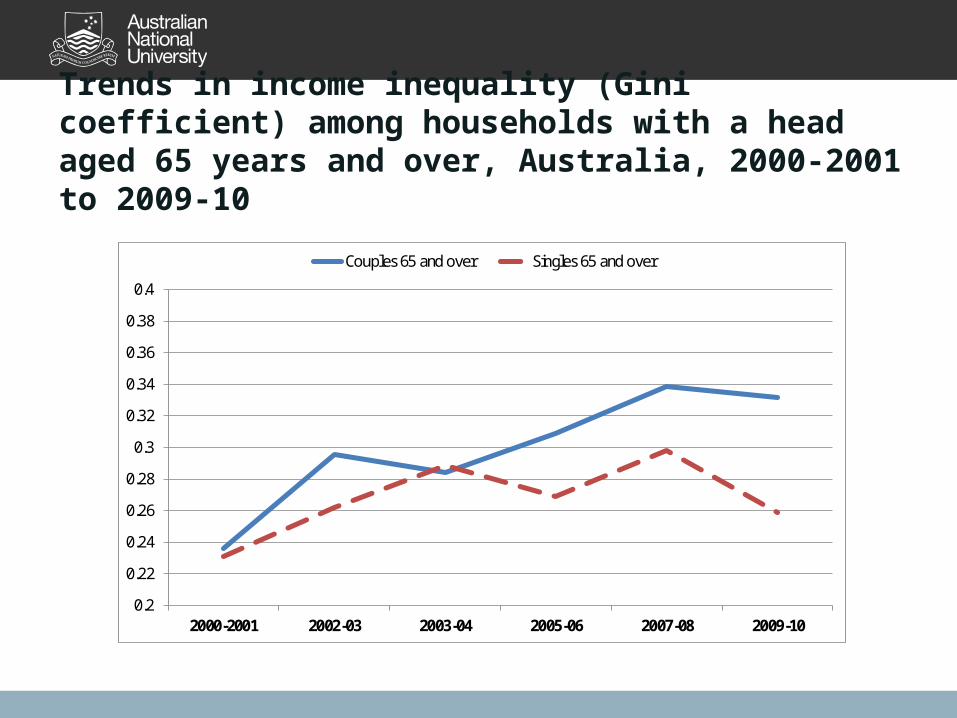
Trends in income inequality (Gini coefficient) among households with a head aged 65 years and over, Australia, 2000-2001 to 2009-10
0.2
0.22
0.24
0.26
0.28
0.3
0.32
0.34
0.36
0.38
0.4
2000-2001 2002-03 2003-04 2005-06 2007-08 2009-10
Couples 65 and over Singles 65 and over


![firstname.lastname@anu.edu.au arXiv:2005.03860v1 [cs.CV] 8 ... · firstname.lastname@anu.edu.au Abstract Cross-view geo-localization is the problem of estimat-ing the position and](https://img.dokumen.tips/doc/110x75/5f59c6e167c3d563620e0b20/anueduau-arxiv200503860v1-cscv-8-anueduau-abstract-cross-view-geo-localization.jpg)


![f g@anu.edu.au arXiv:1910.11006v1 [cs.CV] 24 Oct 2019](https://img.dokumen.tips/doc/110x75/61cef6bc72d9092dc3118acb/f-ganueduau-arxiv191011006v1-cscv-24-oct-2019.jpg)