Embed Size (px)
Citation preview

1
Inequalities in quality of life in
Europe
European Quality of Life Survey
Tadas Leoncikas,
Research manager, Living conditions and quality of life unit
Workshop on measuring human development
Eschborn, 14 June 2013
What is Eurofound?
• A tripartite European agency
• Carrying out comparative
socio-economic research
• Budget of EUR 20.7m (2013)
• 115 people in Dublin and in
Brussels
• Established in 1975
2

European Quality of Life Survey
• Three waves: 2003, 2007 and 2011-2012
• 3rd EQLS – 34 countries (EU27, TR, HR, MK, IS, ME, RS, XK)
• Residents (18+)
Register based stratified random sampling
Random route if no register available
Stratification by urbanisation and region
• 43636 interviews
1000-3000 interviews per country
Response rate (RR3) 41.3% (EU27) & 44.7% (non-EU)
• 38 minute face to face interviews at peoples’ homes
• 25 languages and 13 language variants

Core surveyed aspects of quality of life
Subjective well-being Living standards and deprivation Home, housing, local environment Employment and work-life balance Family and social life Social exclusion and community
involvement Public services, health, healthcare Quality of society
European Quality of Life Survey
EQLS 2011/12:
73 questions
183 items

• Monitoring change over time
• Social inequalities
• Convergence and divergence between
Member States
• Policy pointers
Various dimensions of monitoring and
reporting on the basis of EF surveys

6
Subjective
well-being Social
inequalities
in quality of
life
Quality of
Society
and
Public
Services
Trends in
Quality of
life
2003 – 2007
– 2011/2012

7
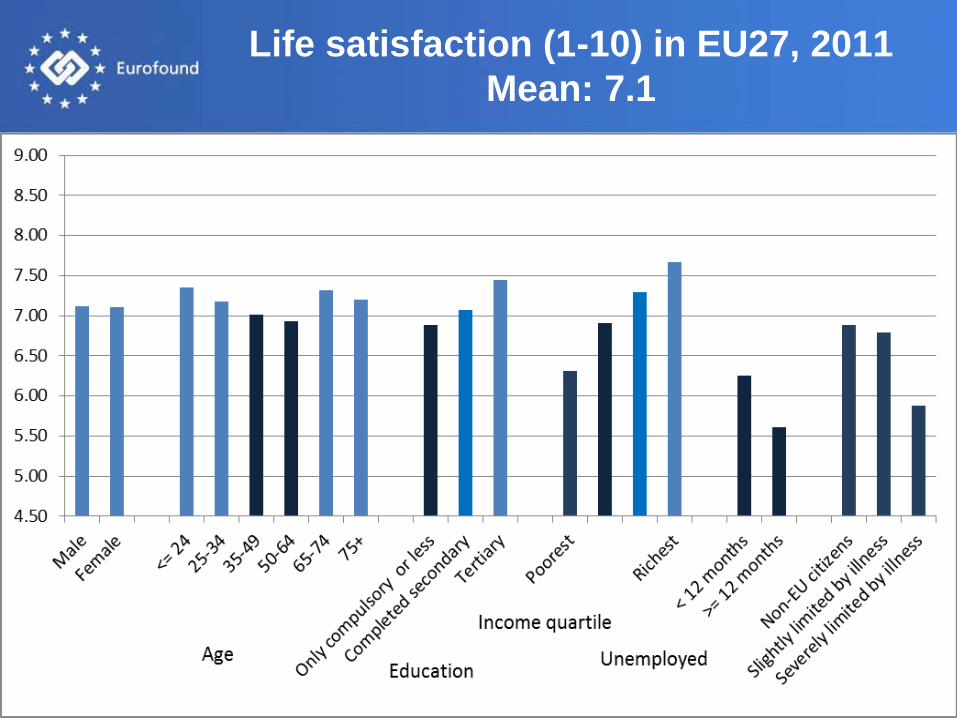
Life satisfaction (1-10) in EU27, 2011
Mean: 7.1
Part 1:
Deprivation
8

0
0,5
1
1,5
2
2,5
3
3,5
4
4,5
5
Bulg
aria
Hungar
y
Est
onia
Lat
via
Gre
ece
Rom
ania
Lit
huan
ia
Pola
nd
Slo
vak
ia
Cypru
s
Port
ugal
Mal
ta
Cze
ch R
epubli
c
Spai
n
EU
Unit
ed K
ingdom
Irel
and
Slo
ven
ia
Fra
nce
Ital
y
Bel
giu
m
Ger
man
y
Fin
land
Net
her
lands
Aust
ria
Den
mar
k
Sw
eden
Luxem
bourg
Items people cannot afford (out of 6):
top and bottom income quartiles

10
Europeans (EU27) reporting that their households cannot afford at least one of these six items
increased from 38% in 2007 to 45% in 2011.
No (%)
Paying for a week’s annual holiday away from home (not staying with
relatives)
37
Replacing any worn-out furniture 35
Buying new, rather than second-hand, clothes 17
Having friends or family for a drink or meal at least once a month 15
Keeping the home adequately warm 12
Having a meal with meat, chicken, fish every second day 10
Can you household afford it?

11
The importance of social elements of poverty
Financial strain and
situation of old people
12

13
Austria
France
0%
5%
10%
15%
20%
25%
30%
35%
40%
45%
50%
18-24 25-34 35-49 50-64 65+
Austria
Poland
Romania Slovakia
0%
5%
10%
15%
20%
25%
30%
35%
40%
45%
50%
18-24 25-34 35-49 50-64 65+
Have difficulties making ends meet
by age groups
EU15
EU12
0%
5%
10%
15%
20%
25%
30%
35%
40%
45%
50%
18-24 25-34 35-49 50-64 65+

Health
14
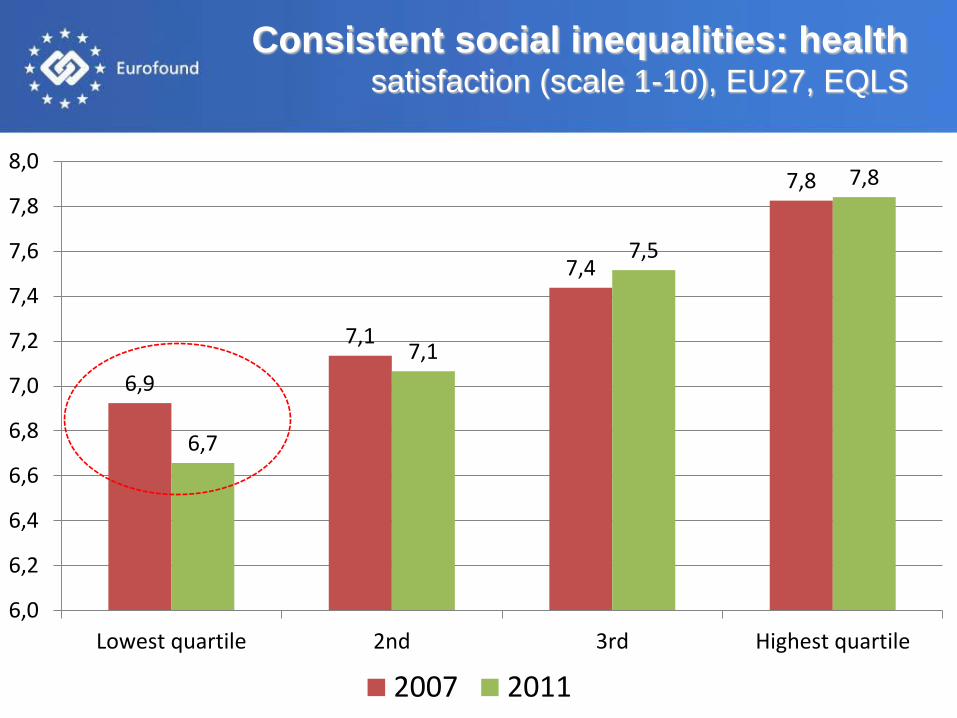
Consistent social inequalities: health satisfaction (scale 1-10), EU27, EQLS
6,9
7,1
7,4
7,8
6,7
7,1
7,5
7,8
6,0
6,2
6,4
6,6
6,8
7,0
7,2
7,4
7,6
7,8
8,0
Lowest quartile 2nd 3rd Highest quartile
2007 2011

Part 2:
Subjective well-being
16
17
Life satisfaction (1-10) in EU27, 2011
Mean: 7.1

• Bulgaria, Greece and Hungary have the
lowest levels of life satisfaction and
most wellbeing measures.
• Specific measures reveal:
High levels of stress in France
High levels of loneliness in Italy
Low levels of vitality in the UK
• Population groups:
Unemployed
Severely limited by health problems
Lower levels of education
Separated/divorced
Bottom income quartile
Those aged 35-50
18
Who has low wellbeing?

Who has falling well-being?
• Overall life satisfaction rose, but happiness fell and social
exclusion rose.
• Biggest falls 2007-2011: Greece, Estonia, but note also Sweden,
Finland and Netherlands.
• Generally, WB gap
between richest and
poorest grew
• Students and those
aged 50-64, have
fallen

Who has high/rising well-being?
• Social democrat countries
• Nordic and NL have lowest WB inequality
• Rising WB in Southern Europe (except Greece), in higher income quartiles.
• Across the board, in Bulgaria, Romania, Poland and Denmark.

Well-being inequality (within countries)
• Biggest WB inequalities:
Between males and females: Cyprus
Between rich and poor: Bulgaria
Between severely limited by health and others: Slovakia
• Biggest overall WB inequality in Romania.

22
1,0
2,0
3,0
4,0
5,0
6,0
7,0
8,0
9,0
10,0
Turk
ey
Cro
atia
Ro
man
ia
Serb
ia
Latv
ia
Lith
uan
ia
FYR
Mac
edo
nia
Ko
sovo
Esto
nia
Bu
lgar
ia
Ger
man
y
Hu
nga
ry
Mo
nte
neg
ro
Slo
vaki
a
Au
stri
a
Cze
ch R
epu
blic UK
Cyp
rus
Irel
and
Gre
ece
Po
lan
d
Ital
y
Mal
ta
Slo
ven
ia
Po
rtu
gal
Fran
ce
Swed
en
Luxe
mb
ou
rg
Spai
n
Be
lgiu
m
Net
her
lan
ds
Fin
lan
d
Icel
and
Den
mar
k
Lowest quintile
Highest quintile
Mean life satisfaction
Life satisfaction: 20% top – 20% bottom

23
Life satisfaction: mean pair distance

24
0
5
10
15
20
25
30
Q30 All things considered, how satisfied would you say
you are with your life these days?
Please tell me on a scale of 1 to 10, where 1 means very dissatisfied and 10
means very satisfied (%, EU27, EQLS 2011/12)

Risk factors amongst low life satisfaction
group (those 1-4)
25

26
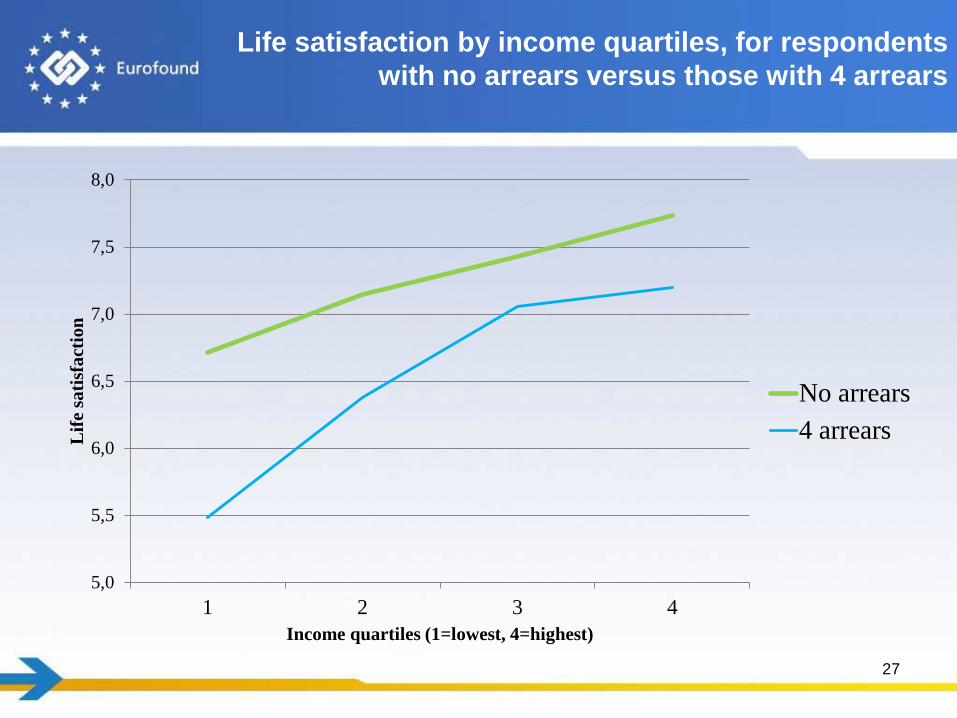
What helps protect against the negative wellbeing
impact of low income and physical or mental illness?
• People with low incomes benefit most from:
Not being in debt
Permanent employment
Face-to-face contact with family members
• People with poor health benefit most from:
Face-to-face contact with family members
Protective factors
27
Life satisfaction by income quartiles, for respondents
with no arrears versus those with 4 arrears
5,0
5,5
6,0
6,5
7,0
7,5
8,0
1 2 3 4
Lif
e sa
tisf
act
ion
Income quartiles (1=lowest, 4=highest)
No arrears
4 arrears

28
Life satisfaction for different income quartiles, for
respondents on a permanent contract versus those on
a temporary contract of less than a year
5,00
5,50
6,00
6,50
7,00
7,50
8,00
1 2 3 4
Lif
e sa
tisf
act
ion
Income quartiles (1=lowest, 4=highest)
On an unlimited permanent
contract
On a fixed term contract of less
than 12 months

29
Life satisfaction for different income quartiles, for
different frequencies of face-to-face contact with
siblings
5,00
5,50
6,00
6,50
7,00
7,50
8,00
1 2 3 4
Lif
e sa
tisf
act
ion
Income quartiles (1=lowest, 4=highest)
Once a week or more often
Less often than once a month

31
Impact on life satisfaction equivalised to
percentage change in income
Equivalent income loss
Deprivation - 6 items 99%
Having 5 housing problems 89%
Deprivation - 2 items 81%
Being unemployed (versus having a job) 80%
Never having contact with friends (versus at least once a week) 75%
Being separated or divorced 62%
Being widowed 60%
Deprivation - 1 item 56%
Never having been married 54%
Being unable to work due to long-term illness or disability 51%
Never participating in sports (versus at least once a week) 48%
Being employed (versus being retired) 46%
Living in a larger urban area (versus in open countryside) 45%
Not having close support on one of five items 42%
Having 1 housing problem 35%
Arrears - 1 item 29%
Being a single parent 25%
Living in a larger urban area (versus in a village or small town) 24%
Never attending religious services (versus at least once a week) 20%
Perceived exclusion
Perceived tensions
32

33
2,81
2,76
2,42
2,36
2,28
2,11
2,10
2,09
2,09
1,00 1,50 2,00 2,50 3,00
unable to work
unemployed 12 months +
unemployed <12 months
at work as an assisting relative
full-time homemaker
on leave
at work
retired
student
Perceived social exclusion index [1-5], EU27
34
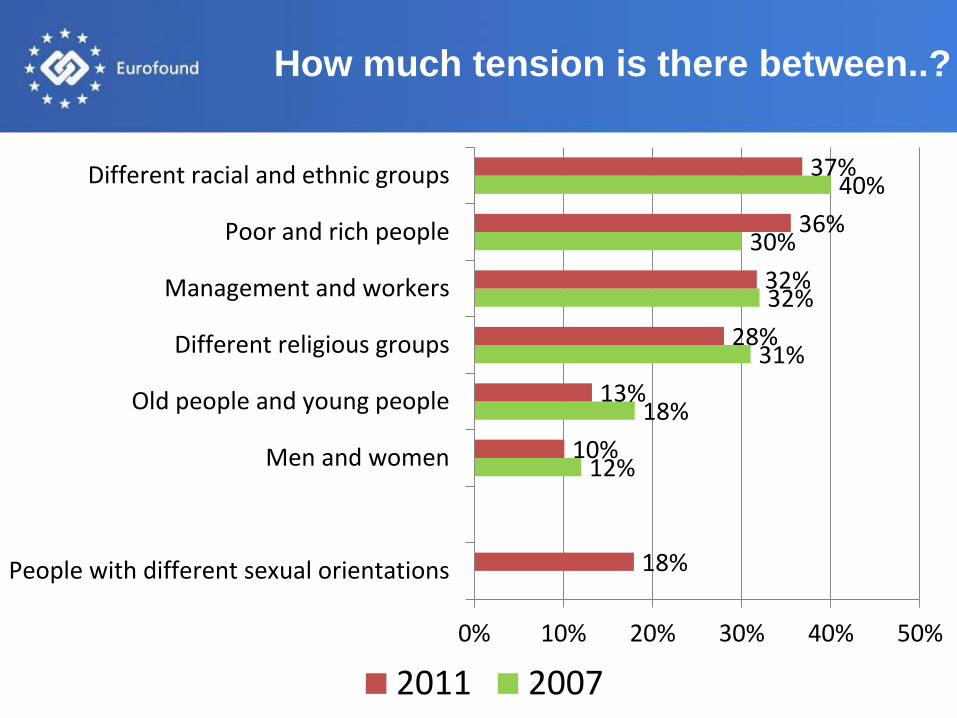
12%
18%
31%
32%
30%
40%
18%
10%
13%
28%
32%
36%
37%
0% 10% 20% 30% 40% 50%
People with different sexual orientations
Men and women
Old people and young people
Different religious groups
Management and workers
Poor and rich people
Different racial and ethnic groups
2011 2007
How much tension is there between..?
35
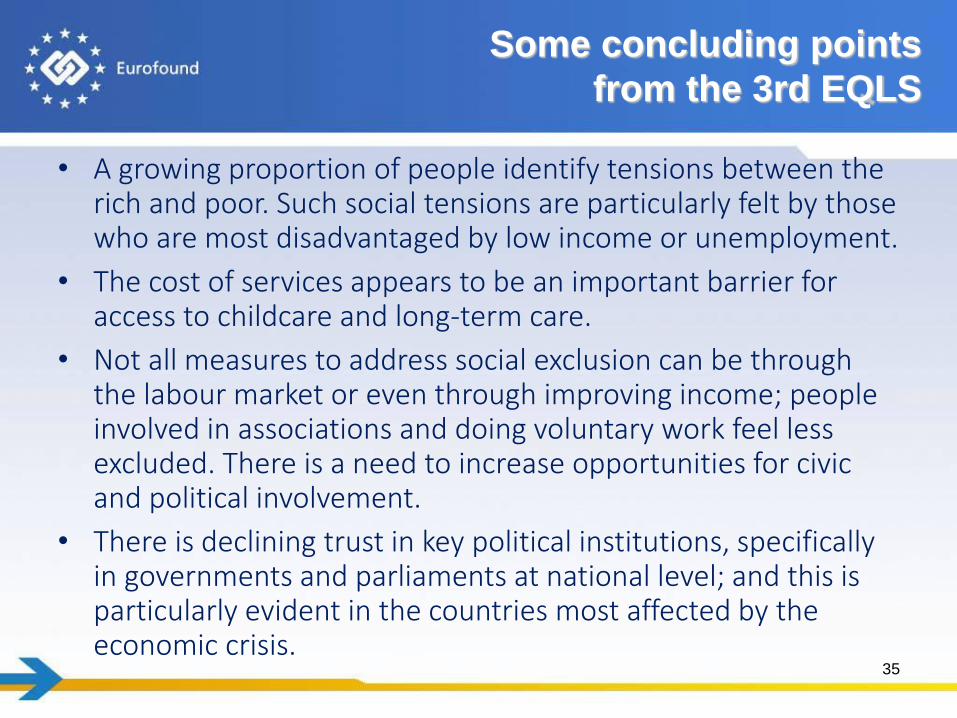
• A growing proportion of people identify tensions between the rich and poor. Such social tensions are particularly felt by those who are most disadvantaged by low income or unemployment.
• The cost of services appears to be an important barrier for access to childcare and long-term care.
• Not all measures to address social exclusion can be through the labour market or even through improving income; people involved in associations and doing voluntary work feel less excluded. There is a need to increase opportunities for civic and political involvement.
• There is declining trust in key political institutions, specifically in governments and parliaments at national level; and this is particularly evident in the countries most affected by the economic crisis.
Some concluding points
from the 3rd EQLS

Overview report
(2012)
Quality of Life in Europe: Impacts of the
crisis
EU27 analytical
reports
(forthcoming 2013)
Trends in quality of life 2003-2007-2011
Subjective well-being and quality of life
Quality of society and public services
Social inequalities in quality of life
Enlargement
country reports
(2013)
7 enlargement country profiles 2013
Trend analysis later in 2013:
Turkey 2003-2007-2012
Croatia 2007-2012
FYROM 2007-2012
36
More of EQLS
Additional material
37
Key elements of the quality assurance
strategy for Eurofound surveys
1. Planning: using a systematic Quality Control Framework developed
specifically for each Survey
2. Consultation: experts and users of the survey participate in the
development of the questionnaire, concepts and methodology
3. Transparency: opening up the process both internally and externally
4. Documentation: keeping track of everything, making sure that
interventions can be traced back
5. Assessment of the quality of the process and output: EF surveys
subscribe to the quality criteria of European Statistical system.
External quality assessment are carried out after each round.
Data and background information -
Eurofound in service for policy and research
• Eurofound Survey web pages
http://www.eurofound.europa.eu/surveys/index.htm
• Technical reports
http://www.eurofound.europa.eu/surveys/eqls/2011/documents/t
echnicalreport.pdf
• External Quality Assessment reports
http://www.eurofound.europa.eu/surveys/ewcs/2010/documents/
qualityassessment.pdf
• Survey mapping tool on Eurofound website
http://www.eurofound.europa.eu/surveys/smt/eqls/results.htm
• Data sets freely available on the UK Data archive http://www.eurofound.europa.eu/surveys/availability/index.htm
39
Eurofound’s conceptual framework
of measuring quality of life in EQLS
• Scope that people have to attain their goals.
• Quality of life is measured by objective as well subjective indicators.
• Quality of life as overarching frame that entails concepts at level of
individual, family, community, and society.
• EQLS is based on a multi-dimensional concept of QoL:
Goes beyond focus on living conditions or resources,
The survey covers broad spectrum of domains of life (employment,
housing, family, health, community, participation in society,
socioeconomic (in)security);
and analyses interrelationship between domains (such as work, family,
health and wellbeing);
Addresses quality of society: trust, intergroup relations, quality of public
and neighbourhood services.