Embed Size (px)
Citation preview

REGIONS AND INEQUALITIES Higher Tier
regionsandinequalities ©RSH 27-Mar-10 Page 1 of 17
INEQUALITIES AND REGIONS
Diagrams can be drawn to represent inequalities.
The main steps involved are
o Draw the boundary line
Use a solid line if the inequality is a or a .
Use a dotted line if the inequality is a < or a >.
o Determine the which side of the boundary is needed.
o Shade out the unwanted reqion.
Examples
Draw the diagram to represent the inequality
x 2.
Solution
Draw the boundary line x = 2
This line represents all points for which x
= 2.
The region to the right contains all points
whose x coordinates are greater than 2.
This is the side we want.

REGIONS AND INEQUALITIES Higher Tier
regionsandinequalities ©RSH 27-Mar-10 Page 2 of 17
Shade the unwanted region.
In this case, the boundary line is solid
because we want to include x = 2.
This is the region x > 2.
The boundary line is dotted because we
don’t want to include x = 2.

REGIONS AND INEQUALITIES Higher Tier
regionsandinequalities ©RSH 27-Mar-10 Page 3 of 17
This diagram represents the
inequality y > 2.
This diagram represents the
inequality y 1.

REGIONS AND INEQUALITIES Higher Tier
regionsandinequalities ©RSH 27-Mar-10 Page 4 of 17
EXERCISE 1
Draw diagrams to represent the following inequalities.
1. x 2
2. y 3
3. x > 1
4. y < 4
5. x 0
6. x 4

REGIONS AND INEQUALITIES Higher Tier
regionsandinequalities ©RSH 27-Mar-10 Page 5 of 17
DOUBLE INEQUALTIES
Diagrams can be drawn to represent double inequalities.
Draw both boundary lines and shade out the unwanted regions.
Example
a) Draw the region to represent 3 < x < 2.
b) State whether or not the points (1, 1) and (4, 2) lie in the given region.
Solution
a) 3 < x 2 gives two inequalities
x > 3 and x < 2
The boundary lines are
x = 3 and x = 2.
Dotted lines are used because neither x
= 2 nor x = 3 are wanted.
The boundary lines are drawn separately
and the unwanted regions shaded.
The unshaded region represents
3 < x < 2.
b) Plot the point (1, 1)
It lies in the region.
Plot the point (4, 2)
It lies outside of the given region.

REGIONS AND INEQUALITIES Higher Tier
regionsandinequalities ©RSH 27-Mar-10 Page 6 of 17
EXERCISE 2
Draw diagrams to represent the following inequalities.
1. 2 x 4
2. 3 < x < 1
3. 0 x < 4
4. 3 < y < 1
5. 2 < y 3
6. 3 x < 5

REGIONS AND INEQUALITIES Higher Tier
regionsandinequalities ©RSH 27-Mar-10 Page 7 of 17
DOUBLE INEQUALITIES
Example
Draw a diagram to represent the region defined by the
inequalities 1 x 2 and 3 y 0
Solution
There are four boundary lines;
x 1,
x 2,
y 3 and
y 0.
Each boundary line is drawn and the
unwanted region shaded.
The region which is unshaded represents the
inequalities.

REGIONS AND INEQUALITIES Higher Tier
regionsandinequalities ©RSH 27-Mar-10 Page 8 of 17
EXERCISE 3
Draw diagrams to represent the following inequalities.
1. 2 x 4, 1 y 3
2. 2 x 2, 2 y < 2
3. 3 < x 2, y 1
4. 0 x 4, 0 y 3
5. 4 x 0, 2 < y 2
6. 3 x, 0 y 1

REGIONS AND INEQUALITIES Higher Tier
regionsandinequalities ©RSH 27-Mar-10 Page 9 of 17
TWO VARIABLE REGIONS
So far, the boundary lines have either been
o Parallel to the x – axis or
o Parallel to the y – axis.
Two variable inequalities involve both x and y and are not parallel to the axes.
Example 1
Draw the diagram to represent the inequality x + y 4
SOLUTION
Step 1
Draw the boundary line x + y = 4.
This line represents all the points for which x
+ y = 4.
A solid line is used since it is included in the
region.
Step 2
Shade the unwanted region.
The easiest way to find which side of the line
is needed is to test one point.
Test the point (0, 0).
At this point, x = 0 and y = 0.
x + y = 0
This not greater than or equal to 4, so the
side containing (0, 0) is not wanted.
REGIONS AND INEQUALITIES Higher Tier
regionsandinequalities ©RSH 27-Mar-10 Page 10 of 17
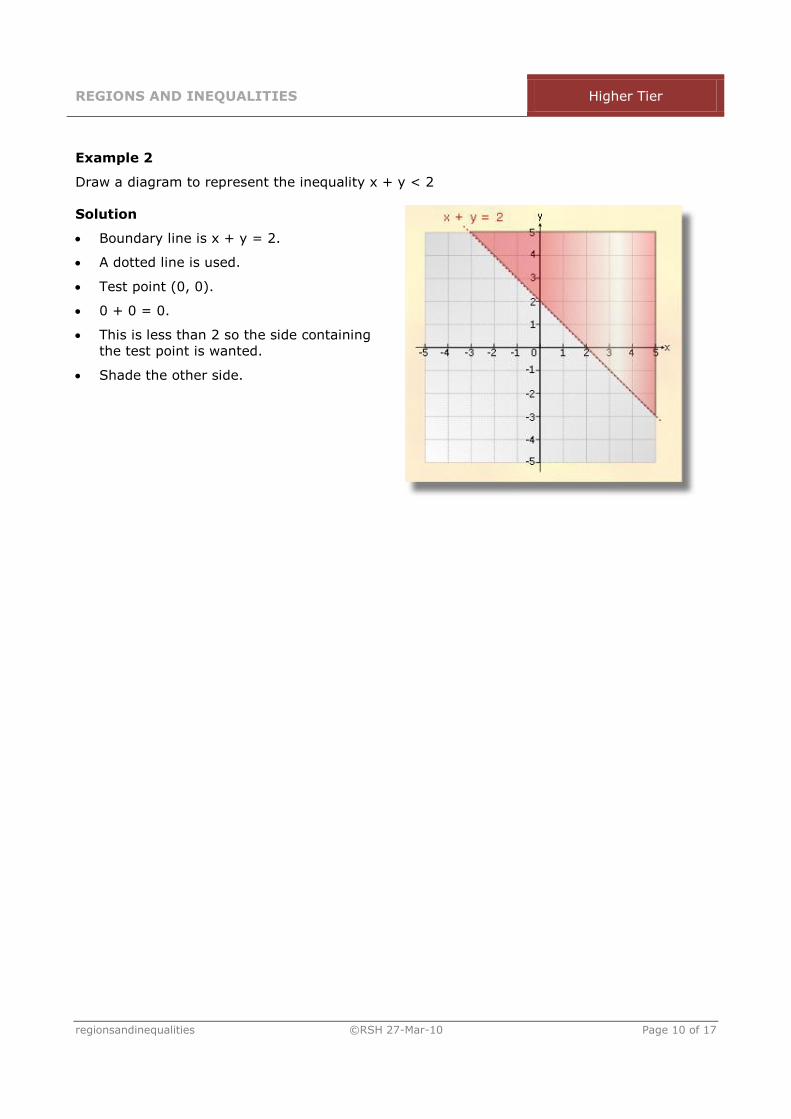
Example 2
Draw a diagram to represent the inequality x + y < 2
Solution
Boundary line is x + y = 2.
A dotted line is used.
Test point (0, 0).
0 + 0 = 0.
This is less than 2 so the side containing
the test point is wanted.
Shade the other side.

REGIONS AND INEQUALITIES Higher Tier
regionsandinequalities ©RSH 27-Mar-10 Page 11 of 17
EXERCISE 4
Draw diagrams to represent the following inequalities.
1. x + y 4
2. x + y > 3
3. x + y 2
4. y x
5. y 2x 0
6. y + 2x 3

REGIONS AND INEQUALITIES Higher Tier
regionsandinequalities ©RSH 27-Mar-10 Page 12 of 17
MULTIPLE BOUNDARIES
At Higher Tier, you will have to draw a diagram to represent multiple two variable
inequalities.
Take each inequality in turn, shade the unwanted region.
Make sure that the required region is clearly marked.
Example 1
Draw a diagram to represent the region defined by the inequalities:
2x + y 4
y 2x < 2
x 1
Solution
First inequality
Boundary line is 2x + y = 4.
Table of values:
x 0 2
y 4 0

REGIONS AND INEQUALITIES Higher Tier
regionsandinequalities ©RSH 27-Mar-10 Page 13 of 17
Test point (0, 0).
2 0 + 0 = 0.
This is less than 4, so (0, 0) is in the
required region.
Shade out the other side of the boundary.

REGIONS AND INEQUALITIES Higher Tier
regionsandinequalities ©RSH 27-Mar-10 Page 14 of 17
Second inequality
Boundary line is y 2x = 2.
Table of values:
x 0 1
y 2 0
Test point (0, 0).
0 2 0 = 0.
This is less than 2, so (0, 0) is in the
required region.
Shade out the other side of the boundary.

REGIONS AND INEQUALITIES Higher Tier
regionsandinequalities ©RSH 27-Mar-10 Page 15 of 17
Third inequality
Boundary line is x = 1.
Shade unwanted region.
Make sure that the correct region is clearly
marked.

REGIONS AND INEQUALITIES Higher Tier
regionsandinequalities ©RSH 27-Mar-10 Page 16 of 17
Example 2 – A GCSE Question
a) Draw a diagram to clearly indicate the region which satisfies all of the following
inequalities. [4]
y < x
y 2x + 5
x > 1
y 1
b) Write down the coordinates of all the points whose coordinates are integers and lie in
the region which satisfies all the inequalities given in (a). [3]
Solution
a)
Boundary lines are:
y = x
y = 2x + 5
x = 1
y = 1

REGIONS AND INEQUALITIES Higher Tier
regionsandinequalities ©RSH 27-Mar-10 Page 17 of 17
b)
The points marked are the only whole
number (integer) coordinates inside
the region.
Those on a solid line are okay.
Those on a dotted line are not
included.
The points are
(2, 1), (2, 0), (2, 1) and (3, 1)


![Convergence of Wachspress coordinates: from polygons to ...jiri/papers/14KoBa.pdf · convex polygons are Wachspress coordinates [14], mean value coordinates [4], and harmonic coordinates](https://img.dokumen.tips/doc/110x75/5f6dfe23261f61015179236e/convergence-of-wachspress-coordinates-from-polygons-to-jiripapers-convex.jpg)