Embed Size (px)
DESCRIPTION
Indutrade Annual Report 2009
Citation preview

2009
2005 2006 2007 2008 2009
EBITA-MARGIN, %12
10
8
6
4
2
08.7 10.2 11.5 12.1 9.5
Indutrade ABBox 6044SE-164 06 KistaPhone +46 (0)8 703 03 00Fax +46 (0)8 752 79 39e-mail: [email protected]
For addresses of Indutrade subsidiaries, visit www.indutrade.se
IND
UTR
AD
E AN
NU
AL R
EP
OR
T 2009
TARGET
Sol
ber
g

CONTENTS
1 Year in brief 2 Indutrade at a glance 4 CEO’s message 6 Share data 8 Mission, goals and strategies 10 The aquisition process 12 The value chain 13 Snapshot 15 A decentralised organisation 16 Sustainable development
18 Market 20 Acquisitions during the year 22 Engineering & Equipment 24 Flow Technology 26 Industrial Components 28 Special Products 30 Risk management 32 Several-year overview 35 Definitions
36 Directors’ report 41 Consolidated income statement 42 Consolidated balance sheet 45 Consolidated cash flow statement 46 Parent company income statement/cash flow statement 47 Parent company balance sheet 48 Accounting principles and notes 65 Audit report
66 Corporate Governance Report 70 Board of Directors and Auditors 71 Executive Management 72 Annual General Meeting and reporting dates
Indutrade AB (publ) ”Indutrade” is a Swedish company that is subject to Swedish jurisdiction. Amounts are presented in Swedish kronor (SEK). Amounts in mil-lions of kronor are abbreviated as SEK million. Figures in parentheses refer to 2008, unless stated otherwise. Income statements, balance sheets and key data for the years 2000-2003 have not been adjusted to international Financial Report-ing Standards (IFRS), but are based on the recommendations of the Swedish Financial Accounting Standards Council. Information about markets and competi-tors is based on Indutrade’s own estimates, unless a specific source is stated. These estimates are based on the best and most recently available information. Pages 36-64 have been audited.
Earnings per share for the year. Proposed dividend for the year per share.
8.53SEK
4.30SEK
Text and production: Indutrade in co-operation with SolbergDesign: SolbergPhoto: Indutrade, Christoffer Edling and Mats BengtssonPrinted by: Billes tryckeri

Indutrade Annual Report 2009 I
YEAR IN BRIEF
year in brief
Net sales fell 7% during the period to SEK 6,271 million (6,778).
For comparable units net sales fell 15%.
Operating profit before amortisation of intangible assets
(EBITA) decreased by 28% to SEK 594 million (820) and the
EBITA margin was 9.5% (12.1).
Earnings per share were SEK 8.53 (12.75).
The Board proposes a dividend of SEK 4.30 per share (6.40).
The Board decided to raise the target for the EBITA margin to a
minimum of 10% (8) over a business cycle.
3,822 4,516 5,673 6,778 6,271
594650
820
333
460
0
1,000
2,000
3,000
4,000
5,000
6,000
7,000
NET SALES AND EARNINGS TRENDS■ Net sales, SEK million EBITA, SEK million
2005 2006 2007 2008 2009
0
100
200
300
400
500
600
700
800
900
Key DaTa 2009 2008 Change, %
Net sales, SEK million 6,271 6,778 -7.5
EBITA, SEK million 594 820 -27.6
EBITA margin, % 9.5 12.1 -2.6 1)
Net profit for the year, SEK million 341 510 -33.1
Return on equity, % 21.3 38.1 -16.8 1)
Return on operating capital, % 22.2 36.7 -14.5 1)
Earnings per share, SEK 8.53 12.75 -33.1
Dividend per share 4.302) 6.40 -32.8
Net debt/equity ratio, % 57 61 -4 1)
Equity, % 41.1 36.2 4.9 1)
Average number of employees 3,122 2,728 -14.5
1) Percentage points
2) Proposed by the Board of Directors
EBITA of the year during the year
9.5per cent
6acquisitions

2 Indutrade Annual Report 2009 Indutrade Annual Report 2009 3
INDUTRADE AT A GLANCE
inDUTraDe aT a GLanCe
Indutrade is a group of more than 120 companies in 18 countries in four
parts of the world. The business has two main focuses – industrial
technology sales and companies that manufacture their own
products. Net sales in 2009 totalled SEK 6,271 million,
with an EBITA margin of 9.5%. The average
number of employees in the Group was 3,122.
The Group’s fundamental governance
principle is based on decentralisation of
decision-making as well as of responsibility.
The organisation is distinguished by entrepreneurship,
technical know-how and a tried-and-tested acquisition
strategy combined with a well balanced spread of risk with
respect to customers, products, suppliers, industries and
geographic markets.
A substantial share of the Group’s growth has consisted of
company acquisitions, and future growth is also expected to be
achieved partly through company acquisitions. The goal is to acquire a
number of profitable companies every year with combined net sales
exceeding SEK 30 million.
Indutrade is listed on NASDAQ OMX Stockholm, Mid Cap list.
1978–1985 1986–1991 1992–1998 1999–2000 2001–2002 2003–2006 2007 2008-2009
Bengtssons Maskin
Carlsson & Möller
Sonesson Trading2)
G.A. Lindberg
Diatom (DK)
Colly Components
Colly Filter
Colly VT
Colly Teknik
Colly (FI)
Colly (DK)
Lining (FI)
Linatex1) (DK)
Seltek1)
Tehovoitelu2)
Granzow (DK)
ETP
YTM (FI)
HITMA (NL)
Aluglas (NL)
Novum
Novatool2)
Mandorf2)
CCMP1) (BE)
Alnab
Euronord2)
GPA
GPA (DK)
Indutek (EE)
Industek (LV)
Ventim
Maanterä (FI)
Edeco Tool
Vipmek (FI)
Kiinnike- Kolmio (FI)
Indutek (RU)
Industek (LT)
Belos
Lyma
Akamex (FI)
Lining Components (FI)
Pinteco (FI)
Processpumpar
Teollisuusapu (FI)
Novum (NO)
Techflow
Liljegrens
EIE Maskin
Elmeko (NO)
EIE (FI)
Pentronic
GEFA (DE)
G. Fagerberg (FI)2)
Tecalemit (FI)
G. Fagerberg
Teck Instrument1)
G. Fagerberg (NO)
G. Fagerberg (DK)
Tecalemit (EE)
Tecalemit (LV)
Tecalemit (LT)
Tecalemit (RU)
Euro Energy2)
Warla Trade (FI)
Maansähkö (FI)
Kontram (FI)
Granaths2)
Hanwel (NL/BE)
HP Valves (NL)
Gimex (NL)
Satron2)
Saniflex
Puwimex (FI)
Robota
SPT (FI)
Gedevelop
PRP-Plastic (FI)
Tribotec
Spinova
Damalini
ES Hydagent
Axelvalves
SAV (DK)
Sigurd Sørum (NO)
Carrab Industri
Aluflex Group
Labkotec (FI)
MWS
Palmstiernas
ELRA (NO)
IPS (UK)
Recair (FI)
Ammertech (NL)
Precision Prod-ucts (UK)
Douwes Intl. (NL)
KG Enterprise (FI)
EssMed
Flintec Group
Kabetex
Inkal
Brinch (NO)
Rossing & Jans-son
Flintec Brasil (BR)
KVT (ROK)
Dominator Pump
1) Subsequently sold by Indutrade.2) Now a department of other Indutrade subsidiary.
0
1,000
2,000
3,000
4,000
5,000
6,000
7,000
0908070605040302010099989796959493929190898887868584838281807978
■ Net sales, SEK million EBITA, SEK million
Average annual growth of 18.3% during the period 1978–2009
Average annual growth of 13.6% during the period 2000–2009
0
200
400
600
800
1,000
earninGs anD aCqUisiTion hisTory

2 Indutrade Annual Report 2009 Indutrade Annual Report 2009 3
1978–1985 1986–1991 1992–1998 1999–2000 2001–2002 2003–2006 2007 2008-2009
Bengtssons Maskin
Carlsson & Möller
Sonesson Trading2)
G.A. Lindberg
Diatom (DK)
Colly Components
Colly Filter
Colly VT
Colly Teknik
Colly (FI)
Colly (DK)
Lining (FI)
Linatex1) (DK)
Seltek1)
Tehovoitelu2)
Granzow (DK)
ETP
YTM (FI)
HITMA (NL)
Aluglas (NL)
Novum
Novatool2)
Mandorf2)
CCMP1) (BE)
Alnab
Euronord2)
GPA
GPA (DK)
Indutek (EE)
Industek (LV)
Ventim
Maanterä (FI)
Edeco Tool
Vipmek (FI)
Kiinnike- Kolmio (FI)
Indutek (RU)
Industek (LT)
Belos
Lyma
Akamex (FI)
Lining Components (FI)
Pinteco (FI)
Processpumpar
Teollisuusapu (FI)
Novum (NO)
Techflow
Liljegrens
EIE Maskin
Elmeko (NO)
EIE (FI)
Pentronic
GEFA (DE)
G. Fagerberg (FI)2)
Tecalemit (FI)
G. Fagerberg
Teck Instrument1)
G. Fagerberg (NO)
G. Fagerberg (DK)
Tecalemit (EE)
Tecalemit (LV)
Tecalemit (LT)
Tecalemit (RU)
Euro Energy2)
Warla Trade (FI)
Maansähkö (FI)
Kontram (FI)
Granaths2)
Hanwel (NL/BE)
HP Valves (NL)
Gimex (NL)
Satron2)
Saniflex
Puwimex (FI)
Robota
SPT (FI)
Gedevelop
PRP-Plastic (FI)
Tribotec
Spinova
Damalini
ES Hydagent
Axelvalves
SAV (DK)
Sigurd Sørum (NO)
Carrab Industri
Aluflex Group
Labkotec (FI)
MWS
Palmstiernas
ELRA (NO)
IPS (UK)
Recair (FI)
Ammertech (NL)
Precision Prod-ucts (UK)
Douwes Intl. (NL)
KG Enterprise (FI)
EssMed
Flintec Group
Kabetex
Inkal
Brinch (NO)
Rossing & Jans-son
Flintec Brasil (BR)
KVT (ROK)
Dominator Pump
bUsiness area enGineerinG & eqUipmenT fLow TeChnoLoGy inDUsTriaL ComponenTs speCiaL proDUCTs
Description Engineering & Equipment offers customised niche prod-ucts, design solutions, after-market service and special processing. The main product areas are industrial equip-ment, vavles, measuring instruments, pumps and pipe systems.
Flow Technology offers com-ponents and systems for the management, control and supervision of flows. The main product areas are valves, pipe systems, measuring and an-alysis instruments, pumps, hydraulics and pneumatics and service.
Industrial Components offers a wide range of technic-ally advanced components and systems for production and maintenance. The main product areas are automation, adhesives and chemical tech-nology, filters and process technology, cutting tools, fas-teners and medical technol-ogy.
Special Products offers spe-cially manufactured niche products, design solutions, aftermarket service and assembly, and special processing. The main product areas are valves, measuring instruments, hydraulic coup-lings, filters and process technology, and glass and ceramics.
Net sales
SEK 1,569 m SEK 1,689 m SEK 1,163 m SEK 1,877 m
EBITA
SEK 83 m SEK 186 m SEK 72 m SEK 288 m
Average number of employees 618 486 395 1,615
INDUTRADE AT A GLANCE
neT saLes per proDUCT area
Automation 5%
Filters & process technology 6%
Chemical technology 4%
Glass/Plastics/Ceramics 3%
Pipe systems 6%
Measurement technology 16%
Valves 29%
Pumps 5%
Service 3%
Fasteners 2% Other 4%
Hydraulics andindustrial equipment 17%
neT saLes per GeoGraphiC marKeT
Sweden 35%
Finland 26%
Denmark 8%
Norway 4%
Baltic countries/Russia 3%
Benelux 14%
Germany 5%
UK 3%ROW 2%
ebiTa per GeoGraphiC marKeT
Sweden 29%
Finland 19%
Denmark 5%
Norway 5%
Benelux 26%
Germany 6%
Baltic countries/Russia 1%
UK 3%
Other 6%
neT saLes per CUsTomer seGmenT
Chemical 4%
Pulp & paper 4%
Car repair shops 3%
Steel 5%
Engineering 22%
Commercial vehicles 3%
Energy 25%
Construction 6%
Water/wastewater/environment 15%
Food 5%
Pharmaceutical 7%
Automotive industry 1%
4 Indutrade Annual Report 2009 Indutrade Annual Report 2009 5
CEO’S MESSAGE
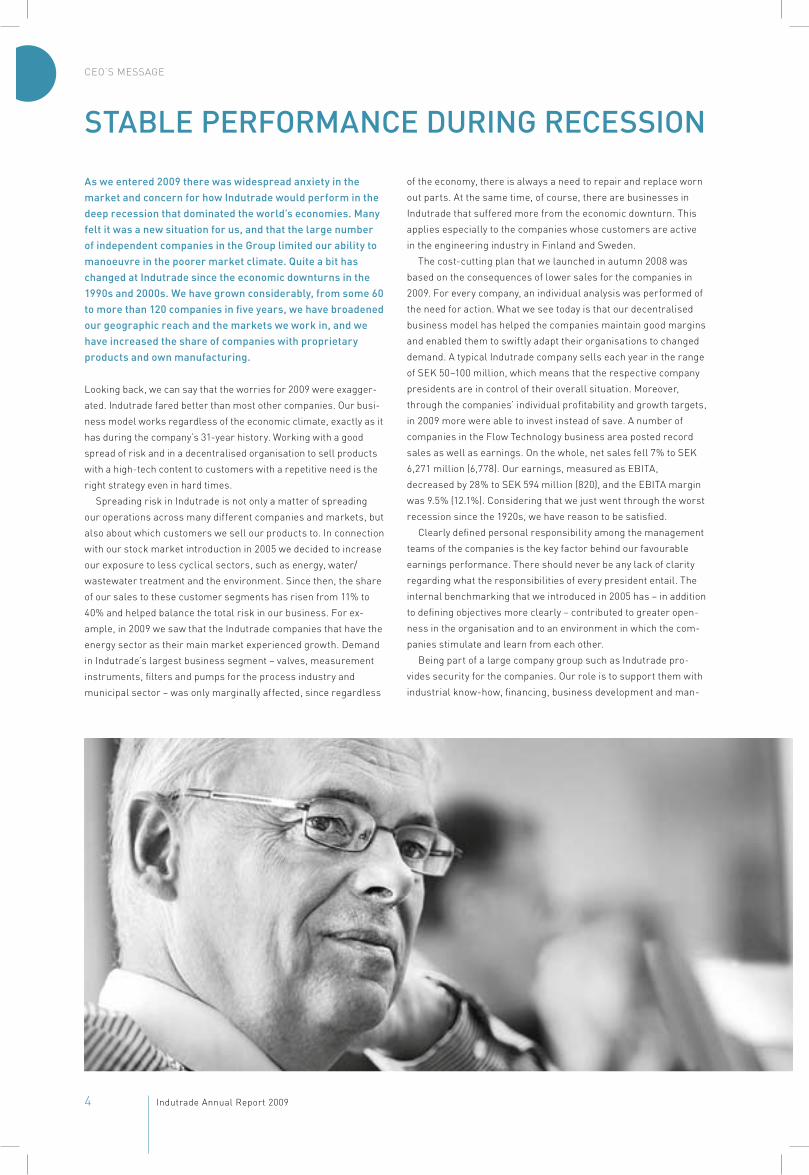
as we entered 2009 there was widespread anxiety in the market and concern for how indutrade would perform in the deep recession that dominated the world’s economies. many felt it was a new situation for us, and that the large number of independent companies in the Group limited our ability to manoeuvre in the poorer market climate. quite a bit has changed at indutrade since the economic downturns in the 1990s and 2000s. we have grown considerably, from some 60 to more than 120 companies in five years, we have broadened our geographic reach and the markets we work in, and we have increased the share of companies with proprietary products and own manufacturing.
Looking back, we can say that the worries for 2009 were exagger-
ated. Indutrade fared better than most other companies. Our busi-
ness model works regardless of the economic climate, exactly as it
has during the company’s 31-year history. Working with a good
spread of risk and in a decentralised organisation to sell products
with a high-tech content to customers with a repetitive need is the
right strategy even in hard times.
Spreading risk in Indutrade is not only a matter of spreading
our operations across many different companies and markets, but
also about which customers we sell our products to. In connection
with our stock market introduction in 2005 we decided to increase
our exposure to less cyclical sectors, such as energy, water/
wastewater treatment and the environment. Since then, the share
of our sales to these customer segments has risen from 11% to
40% and helped balance the total risk in our business. For ex-
ample, in 2009 we saw that the Indutrade companies that have the
energy sector as their main market experienced growth. Demand
in Indutrade’s largest business segment – valves, measurement
instruments, filters and pumps for the process industry and
municipal sector – was only marginally affected, since regardless
of the economy, there is always a need to repair and replace worn
out parts. At the same time, of course, there are businesses in
Indutrade that suffered more from the economic downturn. This
applies especially to the companies whose customers are active
in the engineering industry in Finland and Sweden.
The cost-cutting plan that we launched in autumn 2008 was
based on the consequences of lower sales for the companies in
2009. For every company, an individual analysis was performed of
the need for action. What we see today is that our decentralised
business model has helped the companies maintain good margins
and enabled them to swiftly adapt their organisations to changed
demand. A typical Indutrade company sells each year in the range
of SEK 50–100 million, which means that the respective company
presidents are in control of their overall situation. Moreover,
through the companies’ individual profitability and growth targets,
in 2009 more were able to invest instead of save. A number of
companies in the Flow Technology business area posted record
sales as well as earnings. On the whole, net sales fell 7% to SEK
6,271 million (6,778). Our earnings, measured as EBITA,
decreased by 28% to SEK 594 million (820), and the EBITA margin
was 9.5% (12.1%). Considering that we just went through the worst
recession since the 1920s, we have reason to be satisfied.
Clearly defined personal responsibility among the management
teams of the companies is the key factor behind our favourable
earnings performance. There should never be any lack of clarity
regarding what the responsibilities of every president entail. The
internal benchmarking that we introduced in 2005 has – in addition
to defining objectives more clearly – contributed to greater open-
ness in the organisation and to an environment in which the com-
panies stimulate and learn from each other.
Being part of a large company group such as Indutrade pro-
vides security for the companies. Our role is to support them with
industrial know-how, financing, business development and man-
sTabLe performanCe DUrinG reCession

4 Indutrade Annual Report 2009 Indutrade Annual Report 2009 5
CEO’S MESSAGE
agement by objective, with a focus on growth through acquisi-
tions, among other things.
We made six acquisitions in 2009 – all during the second half of
the year. This somewhat slower pace of acquisitions was mainly
due to the uncertain economic outlook at the start of the year.
With the exception of the acquisition of Key Valve Technologies in
South Korea, the acquisitions were small. All six acquisitions
were identified by our subsidiaries, which is yet another good
example of how our decentralised structure works. Our Dutch
subsidiary HP Valves was behind the acquisition of Key Valve
Technologies, which is a niche manufacturer of high pressure
valves for the power and process industries, with annual sales of
roughly SEK 150 million. It was our first direct acquisition in Asia,
in a technologically very prominent country, and has given us our
first bridgehead in the region. From having been primarily active
in the Nordic region, Indutrade today is established in 18 coun-
tries. In addition to our acquisition in South Korea, in 2009 we
established a sales organisation in China and in Brazil. At the
same time, expanding into new markets is no end in itself. What’s
most important is that we focus on the right products and make
acquisitions at the right price, in industries with a favourable out-
look. On average, Indutrade has acquired seven companies per
year during the last five years, and we will continue to acquire
companies at a high pace in coming years as well. At the start of
2010 we acquired Techno Skruv, Corona Control, Metallcenter
Sverige’s construction plastics business, AxMediTec in Poland and
the Lekang Group, with combined annual sales of SEK 400 million.
Acquisition opportunities abound, both among technology sales
companies and companies with proprietary brands.
The share of companies with proprietary brands today amounts
to 30%. These contribute to greater profitability, as their margins
are generally higher and their market potential is greater than for
“ The main reason for our successful development is still the competent and committed people who work in all of the Group’s companies”
technology sales companies. In contrast, technical sales com-
panies are more flexible and their operation requires less capital.
HP Valves, which grew its sales to SEK 377 million in 2009, with
good profitability, is today our largest company with own brands.
Since we acquired them in 2005, their sales have grown by 253%.
In certain sectors we are working to build up clusters of com-
panies in the aim of creating faster and more focused growth. One
such cluster is our focus on medical technology. This is being
done within the framework of our subsidiary EssMed’s organisa-
tion, where the goal is to build up a larger business in this area.
Despite the fact that 2009 was a year of recession, we once
again exceeded our EBITA margin target of a minimum 8% over a
business cycle. As a result, in February 2010 the Board of Direct-
ors decided to raise the target for the EBITA margin to a minimum
of 10% over a business cycle. We have also achieved our growth
target – for average sales growth of 10% over a business cycle. It
is true that net sales fell 7% in 2009; however, since 2005, when
the target was set, our sales have grown by an average of 12.5%
per year.
Indutrade’s financial position has also developed well. Our
equity ratio is higher today than it was at our stock market debut
in 2005, and we have distributed a minimum of 50% of profit after
tax, in accordance with our dividend policy.
Indutrade’s four-plus years as a listed company clearly reflect
the company’s 31-year history. Nothing has changed at the core.
Our business model works, and the main reason for our success-
ful development is still the competent and committed people who
work in all of the Group’s companies. To our employees, I want to
once again direct special thanks to you for your contributions dur-
ing the past year.
Johnny Alvarsson, President and CEO

6 Indutrade Annual Report 2009 Indutrade Annual Report 2009 7
SHARE DATA
share DaTa
indutrade’s shares are listed on nasdaq omX stockholm, mid Cap list. indutrade’s market capitalisation on 31 December 2009 was seK 5,400 million (2,650).
Indutrade’s share price rose 104% for the year, from SEK 66.25 to
SEK 135.00 per share. The Stockholm Stock Exchange (Nasdaq
OMX Stockholm) gained 47% for the year, and the OMX Industrials
index rose 50%. Including reinvested dividends, the total return
for Indutrade shares was 116%. The highest price paid during the
year was on 21 October (SEK 153), and the lowest price paid was
on 2 January (SEK 69.50). Since the stock market introduction on
5 October 2005, Indutrade’s shares have delivered a total return of
139% including reinvested dividends, while the SIX Return Index,
which measures the total return of the market as a whole, showed
a total return of 25% during the same period.
TraDinG voLUme
Trading in Indutrade shares increased in 2009. A total of 8.5 mil-
lion Indutrade shares were traded (6.7) for a combined value of
SEK 0.9 billion (0.8). This corresponds to a turnover rate of 21%
(17%). Average daily trading volume was 33,964 shares (26,552),
with an average of 69 transactions (44) in Indutrade shares per
trading day.
share CapiTaL anD boarD aUThorisaTion
Indutrade’s share capital was SEK 40 million on 31 December
2009 (40), divided among 40,000,000 shares with a quota value of
SEK 1. All shares have equal voting power. The Board of Indutrade
has proposed that the Annual General Meeting 2010 authorise the
Board, during the time until the next Annual General Meeting, to
decide on new issues of a maximum of 4,000,000 shares and in
doing so be able to deviate from the shareholders’ pre-emption
rights.
ownership sTrUCTUre
Indutrade had 5,369 shareholders on 31 December 2009 (4,577).
At year-end the ten largest owners controlled 76% of the capital
and votes (77%). Swedish legal entities, including institutions such
as insurance companies and mutual funds, owned 84% of the cap-
ital and votes at year-end (83%). Foreign ownership in the Com-
pany was 8% (9%).
incentive programme
In November 2005, Indutrade’s board of directors, in co-operation
with AB Industrivärden, established an incentive programme for
senior executives of the Group. The aim of the programme is to
encourage management’s long-term commitment and participa-
tion in the Company. The term of the programme extends until 30
June 2010. A total of 30 senior executives have acquired a combined
total of 169,600 shares and 284,800 stock options in the Company, at
market price.
The stock options were issued by AB Industrivärden. Indutrade
compensates the executives participating in the programme with a
total of 40% of the invested amount. The total cost for the Company
is estimated to be approximately SEK 7 million, of which SEK 1.2 mil-
lion was charged against 2009 earnings.
DiviDenD anD DiviDenD poLiCy
The Board’s goal is to offer shareholders an attractive dividend
yield and high dividend growth. The goal is that the dividend over
time will amount to a minimum of 50% of net profit. For 2009,
Indutrade’s board has proposed a dividend of SEK 4.30 per share
(6.40), corresponding to 50% of net profit for the year. During the
last five-year period, of Indutrade’s aggregate profit after tax,
totalling SEK 1,792 million, dividends of SEK 898 million have been
paid to the shareholders (including the proposed dividend for
2009), which corresponds to a dividend of slightly more than 50%
of net profit.
ConTaCTs wiTh invesTors anD anaLysTs
Indutrade maintains regular contact with various players in the
financial market in an effort to clearly inform about the Compa-
ny’s performance and events. This is done, among other things,
through presentations in connection with quarterly reports and
through participation in conferences and seminars.
For more information about IR activities and the analysts who
monitor Indutrade, visit www.indutrade.se.

6 Indutrade Annual Report 2009 Indutrade Annual Report 2009 7
The Ten LarGesT sharehoLDers per 31 DeCember 2010
number of shares Capital / votes, %
AB Industrivärden 14,757,800 36.89
AFA Insurance 4,724,570 11.81
L E Lundbergföretagen 4,000,000 10.00
Handelsbanken Pension foundation 1,978,000 4.95
Handelsbanken Pension fund 1,969,300 4.92
Nordea funds Sweden 1,079,668 2.70
Swedbank Robur funds 658,298 1.65
Handelsbanken funds incl. XACT 555,412 1.39
SSB CL Omnibus OM07 (15 PCT) 509,875 1.27
KAS Depository Trust Company 300,000 0.75
Others 9,467,077 23.67
Key DaTa per share
2009
Share price per 31 December, SEK 135.00Market capitalisation at 31 December, SEK m 5.400
Dividend 1), SEK 4.30
Earnings, SEK 8.53
Number of shares outstanding, thousands 40.000
Number of shareholders on 31 December 5.369
Highest price paid during the financial year, SEK 153.00
Lowest price paid during the financial year, SEK 69.50
Dividend yield 2), % 3.2
Shareholders’ equity, SEK 41.10
Cash-flow from operating activities, SEK 13.95
1) Proposed by the Board of Directors.2) Dividend divided by the share price as per 31 December.
DisTribUTion amonG sweDish/foreiGn
sharehoLDers
share priCe TrenD 2009
Left axis:
Trading volume, thousands of shares
0
200
400
600
Omsatt antal
0
50
100
150
jmf (INDT.SE SX20PI) Dagjmf (INDT.SE OMXSPI) DagINDT.SE Dag
Jan Feb Mar Apr Maj Jun Jul Aug Sep Oct Nov Dec
SHARE DATA
Swedish 92%
Foreign 8%
sharehoLDers GroUpeD by size
holding
number of shareholders
share of capital and votes, %
1 – 500 3,604 2.04
501 – 1,000 887 1.85
1,001 – 2,000 374 1.50
2,001 – 5,000 271 2.30
5,001 – 10,000 91 1.77
10,001 – 20,000 54 1.98
20,001 – 50,000 31 2.47
50,001 – 100,000 22 4.01
100,001 – 500,000 28 13.04
500,001 – 1,000,000 2 3.23
1,000,001 – 5,000,000 4 28.9110,000,001 – 1 36.89
right axis, share price: seK
Indutrade Stockholm Industrials OMX All Share
0
200
400
600
Omsatt antal
0
50
100
150
jmf (INDT.SE SX20PI) Dagjmf (INDT.SE OMXSPI) DagINDT.SE Dag
Jan Feb Mar Apr Maj Jun Jul Aug Sep Oct Nov Dec
0
200
400
600
Omsatt antal
0
50
100
150
jmf (INDT.SE SX20PI) Dagjmf (INDT.SE OMXSPI) DagINDT.SE Dag
Jan Feb Mar Apr Maj Jun Jul Aug Sep Oct Nov Dec

8 Indutrade Annual Report 2009 Indutrade Annual Report 2009 9
mission
Indutrade markets, manufactures, develops and sells compon-
ents, systems and services with a high-tech content in selected
niches. Through in-depth knowledge about customers’ systems
and processes and a high level of technical expertise, Indutrade
strives to be the most effective partner for its customers and sup-
pliers.
overaLL GoaLs
The Group strives to continuously grow in selected geographical
markets, product areas and niches with limited business risk.
Growth is pursued organically as well as through acquisitions.
The Group’s overall goals for creating profitable growth are
● to be the leading technology sales group in northern Europe in
terms of net sales and profitability as well as technical expert-
ise. The technology sales companies’ sales are mainly to cus-
tomers based in the local market;
● to be an international group with proprietary products and
brands. The companies conduct own product development and
sales in selected technology and market niches. The business
is distinguished by innovation, high-tech content and good
profitability. The customers are international and sales are
usually designated for export.
finanCiaL TarGeTs
● Average sales growth shall amount to 10% per year over a
business cycle, of which organic growth is to exceed GDP
growth in the geographic markets in which Indutrade operates.
The remaining growth will be achieved through acquisitions.
During the period 2005–2009, consolidated net sales increased
from SEK 3,486 million to SEK 6,271 million, corresponding to
average annual sales growth of 12.5%. Net sales in 2009
decreased by 7%, of which organic growth was –10% including
currency effects, and acquired growth was approximately 3%.
● In February 2010 the Board of Directors decided to raise this
target to a minimum of 10% per year over a business cycle
(8%). The average EBITA margin during the last five years
(2005–2009) was 10.6%. The EBITA margin in 2009 was 9.5%.
● Return on operating capital shall exceed 25% on average per
year over a business cycle. During the last five years (2005–
2009), the average return on operating capital was 32.7%. In
2009 the return was 22.2%.
● The net debt/equity ratio should normally not exceed 100%.
During the last five years (2005-2009), the net debt/equity ratio
varied between 53% and 61%, and was thus below 100% by a
wide margin. The debt/equity ratio at year-end 2009 was 57.2%.
sTraTeGies
Indutrade has adopted the following strategies to achieve these
targets:
Growth with limited operational risk.
Growth shall be pursued in three dimensions:
● In new and existing technology areas
● Through a broadened offering, such as extended support,
training and other aftermarket services
● Geographically in selected markets
Growth shall take place organically as well as through acquisitions.
In pace with Indutrade’s growth, the entry barriers for potential
competitors are expected to increase. At the same time, the risk of
Indutrade’s suppliers establishing their own sales organisations in
the Company’s markets will decrease. Business development and
growth are thus strategic tools for lowering operational risk.
MISSION, GOALS AND STRATEGIES
mission, GoaLs anD sTraTeGies
neT saLes anD earninGs DeveLopmenT
n Net sales, SEK million EBITA, SEK million
0
2,000
4,000
6,000
8,000
10,000
20092008200720062005
0
200
400
600
800
1,000
3,822 4,516 5,673 6,271
460
333
650594
6,778
820
0
8
6
4
2
10
12
14
16
20092008200720062005
8.7 10.2 11.5 9.512.1
ebiTa marGin
n % Target

8 Indutrade Annual Report 2009 Indutrade Annual Report 2009 9
MISSION, GOALS AND STRATEGIES
reTUrn on operaTinG CapiTaL
n % Target
neT DebT/eqUiTy raTio
n %
strong market positions
Indutrade focuses on selling products in niches in which it can
attain a leading position. Strong market positions are often a con-
dition for good profitability. They also make it easier to attract the
best suppliers, which further enhances Indutrade’s position.
Long-term partnerships with leading suppliers
Indutrade gives priority to suppliers who, through own product
development, provide market-leading, high-quality products with
a high-tech content. A partnership with Indutrade should be the
most profitable way for suppliers to sell their products in the geo-
graphic markets in which Indutrade operates.
A range of market-leading products from the best suppliers,
coupled with Indutrade’s technology and market know-how,
makes Indutrade a more attractive business partner for existing
and potential customers.
Companies with proprietary products and brands
Indutrade balances its technology sales companies with a number
of companies with proprietary products and brands. The products
are to have a high-tech content, while the companies should have
a strong market position and favourable growth potential. Since
2004 the share of companies with proprietary products has
increased by 18 percentage points, and in 2009 they accounted for
30% of consolidated sales.
high share of repetitive sales and focus on selected customer
segments
Indutrade offers components, systems and services for custom-
ers with a recurring need. This contributes to operating stability
and predictable revenue flows.
The Group gives priority to customers with a recurring need that
are active in industries with favourable prospects for maintaining
competitive production in Indutrade’s home markets. Many of
these industries are characterised by a high degree of automa-
tion, high distribution costs and/or high start-up investment.
sales organisation with high level of technical expertise
Indutrade’s range of products and services, which are aimed at
both end users and OEM customers (customers that integrate
Indutrade’s products in their own products), shall have a high-
tech content and incorporate a high level of service and qualified
technical consulting.
Indutrade’s sales representatives have a high level of technical
expertise in their respective fields and a depth of knowledge about
the customers’ production processes. This makes Indutrade an
attractive business partner that can create value-added for cus-
tomers and suppliers.
Decentralised organisation with strong local presence
Indutrade’s governance model is characterised by decentralisa-
tion, as the best business decisions are made close to customers
by people who have a solid understanding of the customers’ needs
and processes.
The subsidiaries are responsible for their own profitability,
which contributes to greater flexibility and a stronger entrepre-
neurial spirit.
0
20
15
10
5
25
30
35
40
20092008200720062005
30.0 35.4 39.7 22.236.70
30
20
10
40
50
60
70
20092008200720062005
57.4 53.0 54.7 57.260.9
10 Indutrade Annual Report 2009 Indutrade Annual Report 2009 11
THE ACQUISITION PROCESS
1. iDenTifiCaTion 2. evaLUaTion 3. neGoTiaTion 4. impLemenTaTion 5. foLLow-Up
anaLysis eXeCUTion impLemenTaTion
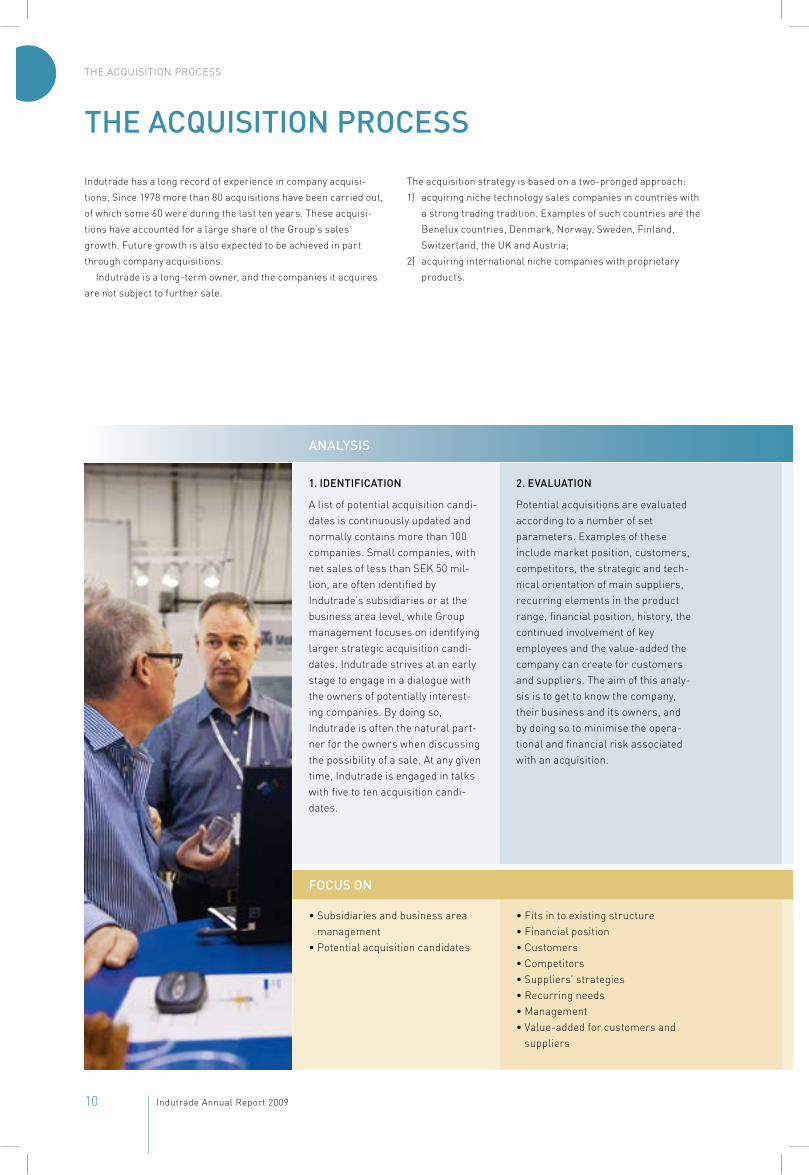
A list of potential acquisition candi-dates is continuously updated and normally contains more than 100 companies. Small companies, with net sales of less than SEK 50 mil-lion, are often identified by Indutrade’s subsidiaries or at the business area level, while Group management focuses on identifying larger strategic acquisition candi-dates. Indutrade strives at an early stage to engage in a dialogue with the owners of potentially interest-ing companies. By doing so, Indutrade is often the natural part-ner for the owners when discussing the possibility of a sale. At any given time, Indutrade is engaged in talks with five to ten acquisition candi-dates.
• Subsidiaries and business area management
• Potential acquisition candidates
Potential acquisitions are evaluated according to a number of set parameters. Examples of these include market position, customers, competitors, the strategic and tech-nical orientation of main suppliers, recurring elements in the product range, financial position, history, the continued involvement of key employees and the value-added the company can create for customers and suppliers. The aim of this analy-sis is to get to know the company, their business and its owners, and by doing so to minimise the opera-tional and financial risk associated with an acquisition.
• Fits in to existing structure• Financial position• Customers• Competitors• Suppliers’ strategies• Recurring needs• Management• Value-added for customers and
suppliers
The aCqUisiTion proCess
foCUs on
Indutrade has a long record of experience in company acquisi-
tions. Since 1978 more than 80 acquisitions have been carried out,
of which some 60 were during the last ten years. These acquisi-
tions have accounted for a large share of the Group’s sales
growth. Future growth is also expected to be achieved in part
through company acquisitions.
Indutrade is a long-term owner, and the companies it acquires
are not subject to further sale.
The acquisition strategy is based on a two-pronged approach:
1) acquiring niche technology sales companies in countries with
a strong trading tradition. Examples of such countries are the
Benelux countries, Denmark, Norway, Sweden, Finland,
Switzerland, the UK and Austria;
2) acquiring international niche companies with proprietary
products.

10 Indutrade Annual Report 2009 Indutrade Annual Report 2009 11
THE ACQUISITION PROCESS
1. iDenTifiCaTion 2. evaLUaTion 3. neGoTiaTion 4. impLemenTaTion 5. foLLow-Up
anaLysis eXeCUTion impLemenTaTion
In connection with an acquisition, a structured review is conducted of the acquired company. This review is focused primarily on three areas:• Customers and suppliers –
broadening of the customer base and product range;
• Organisation – streamlining with the primary aim of increasing focus on customers and sales;
• Costs, margins and inventory turnover – to boost profitability and ensure a stable financial position.
New financial targets are established
and adjusted to the company’s spe-
cific conditions.
• Decentralisation• Action programme• Customers and suppliers• Organisation• Costs and margins
Group management and the man-agement of the respective business areas carry on a continuing dia-logue with the company’s manage-ment. The day-to-day management is goal-oriented, with focus on growth, margins and tied-up capi-tal. Normally, most key employees of acquired companies continue to work for the company, even after an earn-out payment. A key reason for this is Indutrade’s company culture, with a strongly decentralised organisation that gives entrepre-neurs freedom to continue develop-ing their businesses.
• Growth• Margin• Tied-up capital
The primary aims of the negotiation phase are to ensure:• that the acquisition can be carried
out at a price that makes it a value-creating deal. Historically, Indutrade has acquired businesses at a price of 4–8 times net profit;
• the continued involvement of key employees after the acquisition. Since the key persons are often part-owners of the company being acquired, usually an acquisition structure with an earn-out pay-ment is used. This gives the key persons an incentive to continue working with the company and contribute to continued growth in net sales and earnings;
• that the acquisition candidate’s main suppliers approve of the acquisition, to prevent the loss of key product agencies.
• Reasonable price• Incentive for key persons• Suppliers’ approval
foCUs on
The goal is to acquire a number of companies each year with net
sales exceeding SEK 30 million each. Through a network of cus-
tomers, suppliers and other market actors, Indutrade has a good
picture of potential acquisition candidates in the market. Due to
the fragmented market structure, access to acquisition candi-
dates is good. By virtue of its strong acquisition history, its size
and its good reputation, Indutrade has the experience and condi-
tions needed to carry out value-creating acquisitions.
The aCqUisiTion proCess
Indutrade works according to a tried-and-tested process for ana-
lysing, executing and implementing company acquisitions. The
aim is to structure the acquisition process and ensure the quality
of the acquisitions that are made. This process involves five steps:

12 Indutrade Annual Report 2009
THE VALUE CHAIN
indutrade creates value for customers and manufacturers by structuring and streamlining the value chain.
vaLUe is CreaTeD for CUsTomers ThroUGh:
Technical problem-solving regarding choices of components
and systems. Indutrade’s subsidiaries offer a wide array of
technically advanced products in selected niches. The products
are often important for the customers’ production processes
and are designed to meet exacting demands on quality, dur-
ability and temperature tolerance, among other things. A large
share of the products meet recurring needs among customers
and have a high-tech content. Indutrade strives to establish
close co-operation with customers and contribute to problem-
solving early in the planning and development stages.
● Customised end-to-end solutions. A number of Indutrade’s sub-
sidiaries conduct their own manufacturing, further processing
and product development. This allows Indutrade to offer custom-
ised solutions with a high degree of value-added and to create
specialised system solutions. In 2009 sales of proprietary and
further-developed products amounted to approximately SEK 850
million, corresponding to roughly 30% of consolidated net sales.
● Support, training and other aftermarket services, and access
to a local business partner. Some 40 Indutrade subsidiaries
offer aftermarket service, such as repairs, monitoring, tech-
nical service, laboratory services, validation, product adapta-
tion, assembly and tool sharpening. All services have a natural
connection to the Group’s products and customer relation-
ships. Sales related to aftermarket service amounted to
approximately SEK 270 million in 2009, or approximately 4% of
consolidated net sales. Indutrade also offers training in use of
the Group’s products and their integration in large systems.
for manUfaCTUrers, vaLUe is CreaTeD ThroUGh:● Access to a technically qualified sales organisation with estab-
lished customer relationships and local market knowledge.● Access to information about customers’ production processes
through the technology sales companies’ established customer
relationships.● Broader areas of application for manufacturers’ products by
enabling the technology sales companies to combine products
and systems from different manufacturers and thereby offer
customised solutions.● The opportunity to sell products in markets in which it is not
considered to be economically feasible to build up an own sales
organisation.● Local support and training.
CreaTinG vaLUe for CUsTomers anD manUfaCTUrers
Indutrade’s companies specialise in small technology niches and provide customers with technical, specialist expertise, customised solutions, service and training. In addition, Indutrade helps structure the value chain and thereby reduce the number of capacity-demanding business transactions.
Since 2004 the share of companies with proprietary products has increased by 18 percentage points.
bUsiness moDeL
CUSTOMERS
INDUTRADE
MANUFACTURERS
Serviceand
training
Customised solutions
Technicalproblem-
solving
Partnership
0
20
40
60
80
100
20092004
12%
30%
88%
70%
COMPANIES WITHIN-HOUSE MANUFACTURING
share proprieTary proDUCTs, %
n Technical sales n Proprietary products

Indutrade Annual Report 2009 13
Despite the weak economy, Gustaf Fagerberg succeeded in setting records in both sales and earnings in 2009.
“Through our good reputation with the nuclear power industry and
tremendous teamwork in our projects, we managed to achieve
record sales and earnings in 2009,” says Göran Kortz, President
of Gustaf Fagerberg, a leading player in Sweden in technical
advanced control and regulation of flows in the process industry.
Gustaf Fagerberg AB was established in 1897. The company
started out by delivering quality products to shipyards, the ship-
ping industry and industry in general, but a great deal has hap-
pened since then. Today Gustaf Fagerberg represents several of
the world’s foremost manufacturers of process components, and
its customers can be found in a range of different industries, not
least the steadily growing energy sector.
“We have been a supplier to the Nordic nuclear power industry
for many years, and since early 2009 we have agreements with all
of Sweden’s nuclear power plants,” says Kortz. “To be able to sign
these agreements, we have had to show that we have routines,
knowledge and products that meet the nuclear power industry’s
and Swedish Radiation Safety Authority’s standards and rules. As
a result, our share of sales in power and heating, which includes
nuclear power, grew from 20% to 34% in 2009. We also estab-
lished a number of contracts in the area of alternative energy,
including deliveries of valves to a plant in Piteå [Sweden] that
manufactures components for so-called green diesel.”
Indutrade became the new owner of Gustaf Fagerberg in 2001
after buying the business from its former owner, Hexagon. In its
nine years as an Indutrade company, Gustaf Fagerberg’s sales
have grown from SEK 140 million to last year’s record SEK 210.5
million. Profitability has always been in focus at Gustaf Fagerberg
– the EBITA margin during Indutrade’s ownership has varied
between 9.0% and 11.9%.
“In January 2009 we held a big meeting in the company, where
we agreed to hold costs down but at the same time intensify our
sales activities,” Kortz recalls. “Through teamwork – external
sales reps, internal sales reps and product heads working
together – we made sure that we met with all conceivable custom-
ers in order to drum up business. Our strategy succeeded – at both
ends. Overheads were within budget, but sales were considerably
higher than expectations.”
The employees have been instrumental to Gustaf Fagerberg’s
success. Many of the 55 employees have been with the company
for a long time, which has helped build up unique expertise in a
number of product and customer areas.
“Our product specialists have built up knowledge about technol-
ogy and applications over a long period of time, and they give the
sales people vital support in their contacts with customers. At the
same time, we are facing a major generation shift. The average
age at Gustaf Fagerberg today is above 50, so we need employees
who, step-by-step, can take over the know-how and capacity that
has been built up,” says Kortz, who himself has worked for the
company since 1974 and been President since 1998.
“In this regard, Indutrade is an important sounding board that
provides a depth of knowledge about industry and flow technology.
Together we can meet our talent succession needs and continue the
successful development of Gustaf Fagerberg for years to come.”
ProFitability is always in Focus at GustaF FaGerberG
SNAPSHOT – FAGERBERG
Göran Kortz, President of Gustaf Fagerberg

belonging to a major company group like indutrade gives essmed greater strength in relation to customers and sup-pliers, along with opportunities for rapid growth.
“With Indutrade as our owner we can more quickly carry out our
planned expansion in new markets and in new customer segments,”
says Stefan Helgesson, President of Essmed, a market-leading
agency in the Nordic countries for ophthalmology equipment.
Essmed was established in 1997, after Helgesson, together with
Bertil Blomgren, bought out the agencies for ophthalmology prod-
ucts from their then employer, Sunrise Medical. Up until 2008 they
developed the business, focusing on Swedish and Finnish custom-
ers in the public and private ophthalmology care sectors. When
the time then came to expand into other markets in the Nordic
region and increase sales to the optometrist segment, they real-
ised they would need a bigger partner. Their choice fell on
Indutrade, whose growth experience and acquisition process
could offer Essmed the right conditions for rapid growth.
“We were acquired by Indutrade in March 2008,” notes
Helgesson. “A year and a half later we carried out acquisitions that
enabled us to expand both geographically and in new product and
customer segments.”
At the end of 2008, Essmed acquired Brinch A/S, which markets
eye surgery products and services in Norway, and in autumn 2009
Sefo Consulting AB was acquired, which markets instruments,
products and services primarily for optometrists in Sweden. These
two acquisitions have enabled Essmed not only to strengthen its
position in the optometrist segment, but also to become a stronger
partner to its existing customers in ophthalmology.
In January 2010, the company AxMediTec Sp z o.o in Poland was
acquired, which specialises in medical technology equipment for
healthcare applications in operating rooms, intensive care wards,
emergency wards, and cardio and neonatal units.
lonG-term aPProach
“In the longer perspective, the market for eye care is growing
more than for the healthcare sector as a whole, partly as a result
of a rise in common afflictions like diabetes and cataracts,” says
Helgesson. “In addition, we are seeing that Swedish, private clinics
for eye surgery, such as Memira and Vårda Ögonklinik, are grow-
ing not only in Sweden, but also internationally. This, together with
an increasingly stronger position with large optometrist chains
like Specsaver, Synsam and Synoptik, is leading to a greater need
for us to also grow and strengthen our product offering.”
Essmed markets products from leading European manufactur-
ers in ophthalmology, mainly from Switzerland and Germany. The
products, ranging from microscopes to comprehensive laser sys-
tems, are in the upper price segments. As a result of the reces-
sion, many eye clinics and optometrists have become more tenta-
tive about their investments in new equipment. Essmed has felt the
effects of this, even though it has managed to soften the blow by
increasing its share of service and spare parts sales. In 2009 the
company had SEK 77 million in sales, with continued good profita-
bility. The EBITA margin was 14%, which can be partly credited to a
focus on keeping overhead costs down during the year.
Essmed’s organisation has grown in pace with its expansion. In
March 2010 the company had 66 employees in four countries, with
head offices in Mölnlycke, outside Gothenburg. Over time, addi-
tional people will be brought into the organisation.
“Belonging to a large company group like Indutrade gives us
greater strength in relation to our customers and suppliers. This
also makes it easier for us to attract and retain new talent – some-
thing that will be essential ahead of the future expansion we are
facing,” concludes Helgesson.
Stefan Helgesson, President of Essmed
14 Indutrade Annual Report 2009 Indutrade Annual Report 2009 15
SNAPSHOT – ESSMEd
essmeD is exPeriencinG raPiD exPansion in oPhthalmoloGy

CUSTOMERS
SUB
SID
IAR
IES
BU
SIN
ESS
AR
EAS
GR
OU
PM
ANAG
EMEN
T
CEO
ACCOUNTING AND FINANCE BUSINESS DEVELOPMENT
ENGINEERING &EQUIPMENT
FLOWTECHNOLOGY
INDUSTRIALCOMPONENTS
SPECIALPRODUCTS
orGanisation
14 Indutrade Annual Report 2009 Indutrade Annual Report 2009 15
A dECENTRALISEd ORGANISATION
a DecentraliseD orGanisation
the best decisions are made by the people who have the best knowledge about the customers’ needs and processes. since its start in 1978, indutrade’s philosophy has been to run a decentralised organisation in which the financial responsi-bility rests with the Group companies that generate busi-ness, earnings and cash flow.
Indutrade is a group of some 120 companies that each have their
own president, all with total responsibility for their respective
companies. By virtue of the companies’ size (a typical Indutrade
company has annual sales of SEK 50–100 million), the respective
presidents can maintain control over the entire operation and rel-
atively quickly adapt the business to the customers’ needs. The
companies all have individual profitability and growth targets,
which means that while some companies may be cutting back on
costs, others may be investing in more employees.
inDePenDence remains aFter acquisition
The latitude of independence that the subsidiaries keep leads to
customer specialisation and flexibility, and creates favourable
conditions for retaining entrepreneurship in the organisation.
Moreover, the subsidiary heads’ self determination is a key factor
in retaining key persons in acquired companies. With Indutrade’s
acquisition model, the companies keep their name, culture and
management after becoming part of Indutrade’s organisation.
Acquired companies are not subsequently sold.
concentration on sPeciFic niches
decentralisation is also a natural consequence of the Group’s
niche strategy. To build up the expertise that is required to create
customer value – and thus profitability – it is necessary to concen-
trate business on a number of niches. However, the conditions dif-
fer quite a bit between the various niches, which makes it neces-
sary for each subsidiary to formulate its own strategy.
enDurinG relationshiPs
The Group is structured into four business areas: Engineering &
Equipment, Flow Technology, Industrial Components and Special
Products (see also pages 22–29). The companies vary in size, but
typically have 15–40 employees, most of whom are sales engin-
eers or technical consultants. Most of the companies have built up
enduring, close relationships with their customers over several
decades and have gradually become specialists in their respective
technology areas. The business of the agency companies often
revolves around a couple of strong, well established suppliers,
backed up by a number of smaller agencies. Companies with own
manufacturing are also characterised by enduring relationships
with customers and subcontractors, with sharp focus on a limited
number of product lines.
Focus on ProFit marGin anD Growth
The parent company’s and business areas’ role is to support the
subsidiaries with industrial know-how, financing, business devel-
opment and management by objective. Management by objective
is primarily focused on profit margins and growth. The subsidiar-
ies can also benefit from internal benchmarking and the informal
exchange of ideas and experience between different companies in
the Group. In 2006 an annual internal benchmarking system was
established, consisting of a ranking list to lay out goals for the com-
panies and to give the company presidents knowledge about best
practice in other companies within the Group.
continuous comPetence DeveloPment
Serving as a technical problem-solver for customers is one of the
most important measures of value-added that Indutrade contrib-
utes. This ability is based in large part on the employees’ business
and technical competence. Consequently, the Group strongly
emphasises continuous competence development within the sub-
sidiaries – which also helps in their efforts to attract and retain key
persons. Business competence is strengthened through leadership
development and sales training, among other things. Technical
training is conducted primarily under the direction of suppliers.
16 Indutrade Annual Report 2009
SUSTAINABLE dEVELOPMENT
indutrade strives for sustainable development, which entails taking long-term environmental aspects into account as well as maintaining a balance between social and economic demands. the Group strives to develop and maintain profit-able, long-term sustainable businesses, with products and services that meet or exceed customers’ expectations.
In response to rising demands in recent years for general
improvements in the environment and more effective energy gen-
eration, together with growth in international trade, Indutrade is
increasingly focusing on industrial segments such as energy,
water and wastewater, and the environment. Indutrade gives pri-
ority to products that help industries measure, regulate, control
and streamline their processes, along with products that support
industries’ environmental requirements and energy needs.
Indutrade’s mission and strategies should support constructive
environmental work and social responsibility also in the Group’s
own organisation. Indutrade’s long history of doing responsible
business is a compelling obligation for the future. The Group’s
business is based on long-term, strong relationships with cus-
tomers and suppliers, good ethics and respect for all individuals
within the Company as well as in external contacts. As in other
parts of the Group’s operations, the concrete work with the envir-
onment and corporate social responsibility is highly decentral-
ised. As support for the subsidiaries in their work in this regard is
a Group-wide policy for social responsibility and environmental
work.
continuous environmental imProvements
The goal is to continuously minimise the environmental impact of
operations through the use of environmental plans and system-
atic improvement work. A fundamental aspect of this is an
approach that leads to long-term sustainable development. This
means that the companies all strive for high efficiency in the use
of energy and natural resources, that they promote systems for
recycling and reusing material and energy, and that they prevent
and limit pollution. The ambition is to be highly attentive to cus-
tomers’ and suppliers’ preferences and thereby be able to meet
the environmental standards made by the market.
The Group strives for transparent reporting, both with respect to
its successes as well as to any problems that may arise in the
environmental area. Indutrade’s core business involves trade and
distribution, however, the share of the Group’s companies that
conduct own manufacturing has risen. Indutrade’s environmental
impact is thus limited and mainly arises through transports of fin-
ished products, business travel and waste handling.
Today 17 of the Group’s subsidiaries are certified according to
ISO 14001. Certification processes are conducted if warranted by
demands from customers or suppliers. However, even subsidiar-
ies without any certification conduct systematic environmental
work focused on continuous improvement.
Nine of the Group’s Swedish subsidiaries conduct operations
requiring permits according to the Environmental Code. Of the
Group’s foreign subsidiaries, three conduct operations with simi-
lar requirements for permits or notification.
Focus on hiGh quality
Indutrade is intent on ensuring that its products and services
meet or exceed customers’ expectations. Therefore, high quality
always has top priority. Customers should associate Indutrade
with quality products, delivery reliability, excellent technical sup-
port and a positive and professional attitude.
Quality assurance work covers products as well as processes,
where all aspects – from purchasing and stock-keeping routines
to delivered products and technical solutions – shall maintain the
highest possible quality. Indutrade’s quality systems are distin-
guished by attention to detail, long-term perspective and continu-
ous improvement with a distinct customer focus.
When co-operation is initiated with a new supplier, major
emphasis is placed on evaluating quality aspects.
Of Indutrade’s subsidiaries, 35 are certified according to ISO
9001 and/or QS 9000. All companies with ISO certification have
quantifiable goals (such as delivery times to customers and the
number of returns), which are continuously followed up and com-
pared to outcome. Subsidiaries seek certification only when this is
deemed necessary for market reasons. Even subsidiaries without
any certification conduct quality assurance work aimed at con-
tinuous improvement.
sustainable DeveloPment
Indutrade Annual Report 2009 17

16 Indutrade Annual Report 2009
corrosion is a constant, indiscriminate and costly enemy of metal parts, especially when packaged for storage and distri-bution. traditional anti-corrosion methods are messy, costly, and can be hazardous to personnel and the environment. the solution to this problem can be found at tribotec ab, in Gothenburg, sweden – a subsidiary of indutrade since 2006.
“With the vision of being the first-hand choice in environmentally
adapted rust protection, Tribotec has been selling knowledge and
products to Nordic customers for 30 years,” says Joakim dock,
President of Tribotec. “Apart from being at the forefront in our
own environmental work, we focus on offering our customers the
best possible technology and product range from an environmen-
tal perspective. We have watched demand for environmentally
adapted anti-corrosion solutions climb during the last four to five
years in pace with growing environmental awareness in industry.”
Among other things, Tribotec offers a complete anti-corrosion
programme based on VpCl (Vapor Phase Corrosion Inhibitor)
technology. VpCI was developed by the US company Cortec, a
world leader in developing biodegradable anti-corrosion prod-
ucts. Cortec puts high demands on its retailers. Tribotec’s con-
cept for environmentally adapted anti-corrosion solutions is
therefore a good fit for Cortec’s demand specifications. Today
Tribotec is one of the world’s five biggest retailers of Cortec’s
environment-friendly anti-corrosion products for packaging solu-
tions, surface treatment and cleaners.
Tribotec’s largest product based on Cortec’s technology is an
anti-corrosion packaging concept, consisting of a bag that
encloses the metal product in a molecular barrier to protect it
from corrosion. A large share of the bags are sold to customers
who transport products that are shipped in containers. Here it is
important to “stop time”, especially for transports between differ-
ent climate zones.
“We also conduct a corrosion-prevention school for our cus-
tomers,” continues dock. “The aim is to increase their under-
standing of the advantages – such as a lower total cost – that
packaging has compared with chemicals and greases. during the
last five years we have hosted more than 100 participants.”
Tribotec’s 17 employees receive continuous training from the
company’s suppliers, including Cortec. In addition, the employees
are trained in environmental issues in order to gain an under-
standing of the environmental consequences of their actions and
to be able to take responsibility for the environmental impact of
their work.
Tribotec has all of the environmental and quality management
systems required by the market, such as ISO 14001 and ISO 9001.
environmentally aDaPteD anti-corrosion concePt
SUSTAINABLE dEVELOPMENT
Indutrade Annual Report 2009 17
Joakim Dock, President of Tribotec
18 Indutrade Annual Report 2009 Indutrade Annual Report 2009 19
MARKET
marKet
indutrade’s sales are made in many product areas and to customers from an array of sectors and countries. this broad spread reduces the Group’s sensitivity to fluctuations in the economy.
Indutrade is a technology sales company active primarily in the
northern European market for industrial components, systems
and services. In this market, sales are made either directly
through the manufacturers’ own sales organisations, or indirectly
through technology sales companies and wholesalers.
Technology sales companies differ from wholesalers in that
they offer technical advice, customised solutions and generally
more technologically advanced products. In addition, technology
sales companies often offer high-quality support, training and
other aftermarket services. From the manufacturer’s perspec-
tive, working through a technology sales company is like having
an own sales organisation.
ProDucts
The market can be broken down into products for recurring needs
and products of an investment nature. Products for recurring
needs generate more stable revenue flows. Indutrade focuses on
products for recurring needs with a high-tech content in selected
niches. Indutrade’s spread of business over various product seg-
ments is reasonably well balanced. The two largest product
groups are valves and measurement/analysis instruments.
marKet size
Indutrade conducts business in 18 countries. In 2009 the Group’s
three most important geographic markets, Sweden, Finland and
Benelux, together accounted for about 74% of consolidated net
sales. Indutrade estimates that the market for the niches in which
the Group operates is worth approximately SEK 15 billion in
Sweden and about SEK 8 billion in Finland. This means that
Indutrade has an estimated market share of about 20% in its niches
in the Swedish and Finnish markets, respectively. In the other geo-
graphic markets, Indutrade is a relatively minor player at present.
marKet Growth anD cyclical DePenDence
Indutrade’s sales are made to many different industries, each of
which is affected differently by a certain economic climate. This
means that, compared with other companies with similar opera-
tions, Indutrade’s profitability is normally less sensitive to eco-
nomic swings. The four largest sectors for Indutrade are energy;
engineering; water/wastewater treatment/environment and medi-
cine.
DrivinG Forces anD trenDs
Following is a description of the main trends and driving forces in
Indutrade’s markets.
Focus on core businesses
Many industrial companies in northern Europe are narrowing
their focus to their core businesses. In many cases, non-core
activities are being given lower priority, which is leading to a
decline in the level of knowledge in these areas. Consequently,
industrial companies today have a greater need to work closely
with suppliers that possess a high level of technical expertise and
knowledge about their customers’ processes and needs. This is
well in line with Indutrade’s strategy and business orientation.
Greater demand for services
Many customers are striving to reduce the size of their internal
service and maintenance departments as they concentrate on
their core businesses. This is leading to growing demand for ser-
vice and support, which opens up opportunities for Indutrade to
extend its service and offer complementary services.
Fewer suppliers
Industrial companies are generally striving to use fewer suppliers
in an effort to lower their administrative overhead at the same
time that close alliances with a limited number of suppliers con-
tribute to shorter lead times and thus lower levels of tied-up cap-
ital. As a result, each supplier is expected to be able to offer a
broader range of products and services, which normally benefits
large technology sales companies. One way that customers can
reduce the number of suppliers is to use the same supplier for
several geographic markets. Many large customers regard the
Nordic region as a single market, and Indutrade believes it will
become increasingly important to be able to deliver throughout
the Nordic region.
Indutrade’s objective is to offer a wide range of products with
pan-Nordic coverage in the respective niches, thereby creating
conditions to be a total supplier.
relocation of production to low-cost countries
Industrial production is being relocated away from the Nordic
countries and the rest of Western Europe to low-cost countries.
The effect of this shift on Indutrade is limited, mainly because
the Group has chosen to focus on customers with recurring needs
in sectors deemed as having solid enough bases to maintain com-
petitive production in Indutrade’s home markets.
consolidation among manufacturers
When a manufacturer acquires a company, this can result in
Indutrade’s subsidiaries acquiring more products in their product
range. However, there is also a risk that growing numbers of sup-
pliers will choose to invest in their own sales organisations. Con-
solidation among manufacturers is also creating opportunities for
suppliers to provide leading products due to a greater allocation
of capital to research and development. This, in turn, enhances
the competitive strength of Indutrade’s products.
18 Indutrade Annual Report 2009 Indutrade Annual Report 2009 19
MARKET
rise in imports from low-cost countries
In Indutrade’s markets as a whole, a general trend can be seen in
the rise of imports of products and semi-finished products from
countries outside of Europe, mainly China and India. Several of
Indutrade’s suppliers have moved parts of their production to low-
cost countries. This trend is expected to continue and lead to
lower prices, thereby enabling Indutrade to maintain its competi-
tive strength.
competitors
Since the Nordic region is a relatively small market for global
players, they usually choose to work in this market via technology
sales companies, rather than setting up their own sales organisa-
tions. Indutrade’s main competitors are thus other technology
sales companies. The market is fragmented and consists primar-
ily of a large number of small, family-owned technology sales
companies. Structurally, many family businesses are similar to
Indutrade’s subsidiaries and normally represent one or a few
manufacturers in a select number of niches. Examples of such
competitors include Eugen Wiberger in mechanical components
and Rollco in linear systems. The market also has a few larger
players, like Indutrade, as well as manufacturers that sell
through their own sales organisations. In some markets,
Indutrade competes with specific subsidiaries of other major play-
ers, such as Addtech, B&B Tools, G&L Beijer and OEM Inter-
national. However, these companies do only limited business in
Indutrade’s niches, and Indutrade estimates that competition
from these pertains to less than 10% of consolidated net sales.
Competition from these companies is more tangible in the search
for acquisition candidates.
Examples of major international manufacturers that compete
with Indutrade through their own sales organisations include
Hydac (filters), Loctite (chemical-technical products), Emhart
(fasteners), and Sandvik and Seco Tools (cutting tools). The Nordic
market also has a number of wholesalers that distribute primarily
high-volume products. Examples of such companies include
Ahlsell and the Bufab Group. What these companies all have in
common is that they market a broad range of products in which
the degree of technical advice and customer adaptation is gener-
ally lower. The main competitive advantages of the wholesalers
are broad product portfolios, logistics and low prices.
Since Indutrade operates mainly in product niches with a high-
tech content which require solid knowledge of the customer’s
processes, competition from these companies is limited to a
small share of Indutrade’s sales. Indutrade estimates that less
than 10% of the Group’s net sales face competition from pure-play
wholesalers.
20 Indutrade Annual Report 2009 Indutrade Annual Report 2009 21
ACQUISITIONS dURING THE yEAR
acquisitions DurinG the year
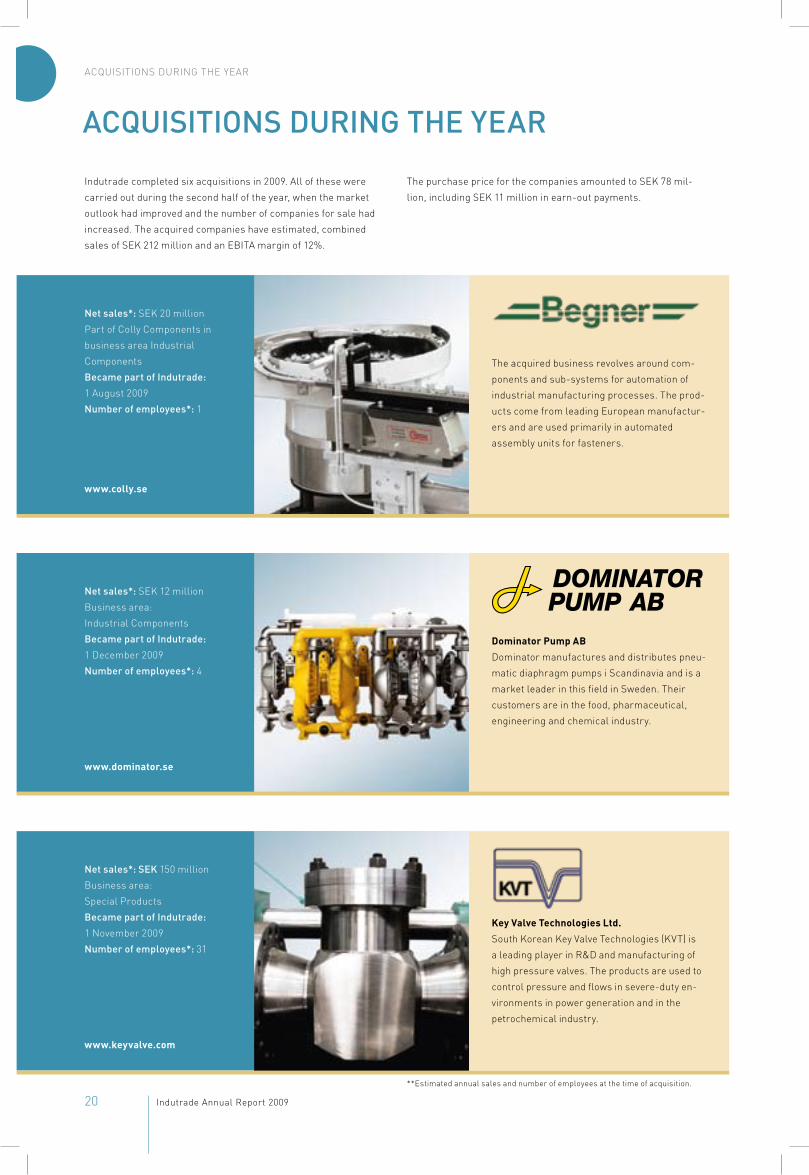
Indutrade completed six acquisitions in 2009. All of these were
carried out during the second half of the year, when the market
outlook had improved and the number of companies for sale had
increased. The acquired companies have estimated, combined
sales of SEK 212 million and an EBITA margin of 12%.
The purchase price for the companies amounted to SEK 78 mil-
lion, including SEK 11 million in earn-out payments.
**Estimated annual sales and number of employees at the time of acquisition.
net sales*: SEK 20 million
Part of Colly Components in
business area Industrial
Components
became part of indutrade:
1 August 2009
number of employees*: 1
www.colly.se
The acquired business revolves around com-
ponents and sub-systems for automation of
industrial manufacturing processes. The prod-
ucts come from leading European manufactur-
ers and are used primarily in automated
assembly units for fasteners.
net sales*: seK 150 million
Business area:
Special Products
became part of indutrade:
1 November 2009
number of employees*: 31
www.keyvalve.com
Key Valve Technologies Ltd.
South Korean Key Valve Technologies (KVT) is
a leading player in R&d and manufacturing of
high pressure valves. The products are used to
control pressure and flows in severe-duty en-
vironments in power generation and in the
petrochemical industry.
net sales*: SEK 12 million
Business area:
Industrial Components
became part of indutrade:
1 december 2009
number of employees*: 4
www.dominator.se
Dominator Pump AB
dominator manufactures and distributes pneu-
matic diaphragm pumps i Scandinavia and is a
market leader in this field in Sweden. Their
customers are in the food, pharmaceutical,
engineering and chemical industry.

20 Indutrade Annual Report 2009 Indutrade Annual Report 2009 21
ACQUISITIONS dURING THE yEAR
Ingenjörsfirman Rossing & Jansson AB
Rossing & Jansson supplies complete system
solutions, standalone products and services in
the areas of automation and control technology
for energy production, industry and shipping.
net sales*: seK 6 million
Business area:
Industrial Components
became part of indutrade:
1 October 2009
number of employees*: 3
www.sefo.se
net sales*: SEK 4 million
Business area:
Special Products
became part of indutrade:
1 September 2009
number of employees*: 4
www.flintec.com
The acquired business revolves around instru-
ments, products and service for opticians, ocu-
lists and ophthalmic clinics. The products
come from leading Japanese, American and
European manufacturers.
Flintec Brasil Ltda
Flintec Brasil, previously a dealer for Flintec’s
products in Brazil, delivers load cells for the
Brazilian marknad.
net sales*: SEK 20 million
Business area:
Flow Technology
became part of indutrade:
1 September 2009
number of employees*: 4
www.rossingjansson.se

22 Indutrade Annual Report 2009 Indutrade Annual Report 2009 23
ENGINEERING & EQUIPMENT BUSINESS AREA
Engineering & Equipment’s operations are characterised by components sales as well as a relatively high share of cus-tomisation, combinations and installations of products from various suppliers. Compared with the other business areas, sales consist to a slightly higher degree of investment goods.
The five largest subsidiaries are Tecalemit, Lining, Kontram,
YTM-Industrial and Labkotec, which together accounted for 74%
of the business area’s net sales. In early 2009, Tecalemit’s five
business units were each converted to standalone companies in
order be able to better serve customers and suppliers in various
segments.
MARKET
Although the business area’s geographic focal point is in Finland,
it also has subsidiaries in Sweden, Estonia, Latvia and Lithuania.
Engineering & Equipment has a particularly strong position in the
Finnish market in most businesses. Competitors consist mainly of
small family-owned companies and international manufacturers’
sales companies in the respective product areas.
CUSTOMERS
Customers are primarily in the pulp & paper, chemical, commer-
cial vehicles and engineering industries. Major customers include
Kemira, municipal water treatment companies, Metso, Stora Enso
and Wärtsilä.
PRODUCT AREAS
The business area is organised into six product areas: Industrial
Equipment, Transmission, Flow Products, Hydraulics & Pneu-
matics, Measurement Equipment and Service.
Industrial Equipment
This product area features a comprehensive range of workshop
equipment, with related project design for the refurbishing and
new construction of automotive workshops. It also develops and
designs special equipment for car repair shops. Other products
include pumps for process industries and equipment for fire
safety, central lubrication systems, industrial painting and sur-
face treatment processes.
Transmission
The offering includes customised conveyor belts and power trans-
mission belts for the engineering, food and paper industries.
Flow Technology
The product area, which is the business area’s biggest, consists
primarily of valves, pumps and pump systems, pipes, couplings
and wastewater handling solutions.
Hydraulics & Pneumatics
This product area includes hydraulic and compressed air com-
ponents and compressors. The product range also includes pipes,
quick connect/disconnect couplings and accessories, pneumatic
components and magnetic valves.
Measurement Equipment
A relatively comprehensive range of instruments from leading
manufacturers for measuring, controlling and analysing flows,
pressure, temperature and levels. The instruments are used pri-
marily in general process industries and the energy sector.
Service
Includes repairs, maintenance and service of valves, pumps and
compressors. Service activities, with direct ties to sold products,
are handled by most of the business area’s companies.
YEAR IN REVIEW
Net sales decreased by 17% to SEK 1,569 million (1,900). For com-
parable units, net sales fell 25%, while currency movements had
a favourable effect on net sales, by 8%. Demand in Finland, which
is the business area’s largest market, was weak during the entire
year. Finland’s economy is dominated by a large industrial sector
with a high share of exports and has been strongly impacted by
the downturn in the global economy and the strong euro.
Demand for the business area’s products for the industrial sec-
tor fell sharply in early 2009 and remained at a low level through-
out the year, even though a slight improvement in demand could be
noted towards the end of the year. An extensive inventory clear-out
took place among industrial customers throughout 2009. Due to
weakness among many of the competitors, the business area man-
aged to take market shares in several product areas. The business
area’s sales to the public sector, including the Water/wastewater
treatment/environment customer segment, were stable during the
year, entailing that its share of total sales increased.
The poorer net sales affected EBITA, which amounted to SEK 83
million (189) for the year, corresponding to an EBITA margin of
5.3% (9.9%). Projects for reducing the level of overheads have
been carried out by the companies hurt by the drop in demand.
EBITA was charged with SEK 10 million in one time costs.
ENgINEERINg & EqUIPMENT

22 Indutrade Annual Report 2009 Indutrade Annual Report 2009 23
ENGINEERING & EQUIPMENT BUSINESS AREA
NET SAlES PER CUSTOMER SEgMENT NET SAlES PER PRODUCT AREA
NET SAlES PER gEOgRAPHIC MARKET KEY RATIOS, FIVE YEARS
Water/wastewater/environment 31%
Pulp & paper 4%
Chemical 3%
Pharmaceutical 2%
Food 1%
Construction 10%
Steel 8%
Car repair shops 12%
Energy 12%
Engineering 16%
Other 1%
Finland 86%
Sweden 4%
Baltic countries 10%
Industrial equipment 29%
Hydraulics & pneumatics 2%
Valves 27%
Pumps 13%
Pipe systems 6%
Service 3%
Transmission 3%
Measurement equipment 17%
Key ratios 2009 2008 2007 2006 2005
Net sales, SEK million 1,569 1,900 1,689 1,342 1,176EBITA, SEK million 83 189 176 129 119
EBITA margin, % 5.3 9.9 10.4 9.6 10.1Average number of employees 618 657 581 546 453
“ The year was characterised by
weak demand and cost-cutting.” Curt Kock, President of Engineering & Equipment business area

24 Indutrade Annual Report 2009 Indutrade Annual Report 2009 25
FLOW TECHNOLOGY BUSINESS AREA
The Flow Technology business area offers components and systems for controlling, measuring, monitoring and regu- lating flows. The business unit includes companies that spe-cialise in various areas of industrial flow technology.
The five largest companies are Gustaf Fagerberg AB, Gustaf
Fagerberg A/S, GPA, Alnab and Ventim, which together accounted
for approximately 48% of the business area’s sales in 2009.
MARKET
The business area is the premier industrial flow technology group
in the Nordic countries. Sweden and Denmark account for the
bulk of sales, however, the business area also does business in
Norway, Russia and the UK. Competitors consist primarily of indi-
vidual companies in the subsidiaries’ respective markets.
CUSTOMERS
Flow Technology’s customers work in a large number of indus-
tries – primarily the energy, chemical, water/wastewater treat-
ment/environment, pulp & paper, medical technology and food
industries. The breadth of customers across a wide range of
industries is a strength in contacts with suppliers, whose prod-
ucts are often suitable for several different market segments.
Examples of major customers are Aalborg Industries, Akzo/EKA,
Alstom Power, Areva, Novo Nordisk, Ringhals, Siemens Turbo
Machinery and Tetra Pak.
PRODUCT AREAS
The business area is organised into seven product areas: Valves,
Measuring and Analysis Instruments, Pipe Systems, Pumps,
Hydraulics, Compressors and Service.
Valves
The Swedish market’s widest range of valves and fittings for
industrial, energy, water treatment and environmental applica-
tions. A high level of expertise forms a foundation for close co-
operation and partnerships with customers.
Measuring and Analysis Instruments
A comprehensive range of instruments for measuring and analys-
ing flows, pressure, temperature and levels. The products often
play a key role in ensuring the operation of the customers’ pro-
cesses.
Pipe Systems
Plastic valves, pipes, pipe parts and couplings, and Teflon-coated
materials for systems with aggressive fluids. System solutions for
pipes, pumps and tanks using customised materials. A high level of
expertise in, among other things, material selection for corrosive
fluids and gases.
Pumps
Pumps and customised system solutions in which pumps, regu-
lating systems, valves and pipes are assembled together to form a
complete unit. Many of these are turnkey systems. The product
area also includes special products for handling aggressive, cor-
rosive and environmentally hazardous fluids.
Hydraulics
Design and marketing of hydraulic systems for mobile industrial
applications that combine hydraulics and electricity, often in the
form of customised special solutions.
Compressors
Pneumatic compressors and vacuum pumps, as well as manufac-
turing of compressed-air and vacuum systems.
Service
Repair, maintenance and service of valves, actuators, pumps,
compressors, and regulating and vacuum equipment. Service
activities directly related to sold products are provided by several
of the business area’s subsidiaries as well as by a separate serv-
ice company.
YEAR IN REVIEW
Net sales for the business area were stable during the year and
amounted to SEK 1,689 million (1,712). For comparable units,
sales decreased by 3%, while currency movements had a favour-
able effect on net sales, by 2%.
Demand in the energy and Water treatment/environment cus-
tomer segments, which account for slightly more than half of the
business area’s sales, was strong during the year. The positive
development in the water treatment segment is mainly due to a
higher share of public sector projects. Other customer segments
showed weak or stable performance in 2009, with a slight
strengthening in demand at the end of the year.
EBITA increased to SEK 186 million (185), entailing that the
EBITA margin remained at the same level as a year ago, at 11.0%
(10.8%). Profitability was favourably affected by a continued focus
on products and customers segments with higher gross margins,
among other things. Sales activities were also intensified during
the year. In addition, activities were initiated to reduce working
capital in the companies, mainly by improving the efficiency of
inventory management.
During the year, the company Rossing & Jansson was acquired,
with annual sales of approximately SEK 20 million. For nearly 40
years, Rossing & Jansson has been delivering turnkey system
solutions, individual products and services in the areas of auto-
mation and control technology to the energy generation, industrial
and shipping industries. The acquisition strengthens the business
area’s depth of expertise in control technology.
The business area’s focus on leadership training in its com-
panies continued during the year. Thirty-five managers and senior
executives participated in the “Future Leaders” training pro-
gramme, which was designed to retain and develop prospective
leaders.
FlOW TECHNOlOgY

24 Indutrade Annual Report 2009 Indutrade Annual Report 2009 25
NET SAlES PER CUSTOMER SEgMENT NET SAlES PER PRODUCT AREA
NET SAlES PER gEOgRAPHIC MARKET KEY RATIOS, FIVE YEARS
Energy 36%
Chemical 9%
Commercial vehicles 4%
Steel 3%
Engineering 4%
Construction 3%
Food 5%
Pulp & paper 6%
Pharmaceutical 5%
Water/wastewater/environment 25%
Sweden 50%
UK 6%
Russia 8%
Denmark 23%
Norway 13%
Valves 49%
Pumps 7%
Service 6%
Pipe systems 18%
Hydraulics 6%
Compressors 2%
Measuring & analysis instruments 12%
Key ratios 2009 2008 2007 2006 2005
Net sales, SEK million 1,689 1,712 1,474 1,073 966EBITA, SEK million 186 185 145 93 67
EBITA margin, % 11.0 10.8 9.8 8.7 6.9Average number of employees 486 485 428 341 329
FlOW TECHNOlOgY
FLOW TECHNOLOGY BUSINESS AREA
“ Continuous focus on products
with higher gross margins.” Peter Eriksson, President of Flow Technology business area
26 Indutrade Annual Report 2009 Indutrade Annual Report 2009 27
The Industrial Components business area offers a wide range of technically advanced components and systems for production and maintenance, and medical technology equip-ment. Products consist to a great extent of consumables. The companies in the business area typically work in close co-operation with their customers’ development, production and maintenance departments. Major emphasis is put on identifying and understanding customers’ production pro-cesses and needs.
The five largest companies are G.A. Lindberg ChemTech, EIE
Maskin, Bengtssons Maskin, Edeco Tool and Colly Components.
Together these companies accounted for approximately 43% of
the business area’s sales in 2009.
MARKET
Most of the business area’s sales are in Sweden, although it does
a significant amount of business in Finland, Denmark and Norway.
Competitors consist of international companies with own sales
organisations as well as small, family-owned companies.
CUSTOMERS
Key customer groups are in the engineering, energy, pulp & paper,
commercial vehicles, food, pharmaceutical and medical technology
industries. Major customers include ABB, Metso, Stora Enso, Astra-
Zeneca, Novo Nordisk, Tetra Pak, Rolls Royce and Scania.
PRODUCT AREAS
The business area is organised into six product areas: Filters,
Pumps and Process Technology; Fasteners and Mechanical Com-
ponents; Medical Technology; Cutting Tools; Lubricants, Rust
Protection and Adhesives; and Transmission and Automation.
Filters, Pumps and Process Technology
The business area works with leading manufacturers primarily of
filter components and systems, pumps, instruments, diagnostic
equipment, water separation equipment, hoses and quick con-
nect/disconnect couplings.
Fasteners and Mechanical Components
The product offering consists of a wide array of fasteners and
mechanical components with related assembly and automation
equipment. The products are often included as subcomponents in
customers’ own products. Products also include box and flat gas-
kets as well as a number of specialised sealants for demanding
fluid and gas seals.
Medical Technology
In co-operation with leading manufacturers, the business area
offers equipment, consumables and service for private and public
sector ophthalmology applications.
Cutting Tools
Through this product area, Indutrade is a leading importer of cut-
ting tools in Sweden and Finland, and offers a wide range of high-
quality tools for drilling, cutting, turning, milling and thread cutting.
Adhesives and chemical technology
Companies in this product area work with leading suppliers of
lubricants, adhesives, silicone and rust protection. They also offer
environmentally adapted oils and fluids for metalworking, corro-
sion protection, hydraulics and tissue production.
Automation
The product area offers high-quality transmission products to the
engineering industry in the Nordic countries, as well as products
and machine systems for the pulp & paper industry in Sweden and
Finland. In addition, it includes one of the market’s most tried-
and-tested and comprehensive building systems in the area of alu-
minium profiles, rail guide systems and integrated linear modules.
YEAR IN REVIEW
Net sales decreased by 17% to SEK 1,163 million (1,401). For com-
parable units, net sales fell 22%, while acquired growth was 3%.
Currency movements had a favourable effect on net sales, by 2%.
Due to the business area’s exposure to subcontractors, sales are
highly affected by drops in demand among end customers. The
demand situation for companies in the Cutting Tools product area,
which are commonly subcontractors for the automotive industry,
deteriorated considerably during the first half of the year. A slight
recovery was noted towards the end of the year. Energy, medical
technology and food were customer segments that showed stable
or stronger development during the year.
EBITA decreased by 48% to SEK 72 million (150). The EBITA
margin fell to 6.2% (10.7%), mainly due to lower volumes. The
weak Swedish krona gave rise to higher purchasing costs, which
hurt margins. Cost-cutting programmes were initiated in the
companies affected by the drop in demand, resulting in costs of
SEK 7 million that were charged against EBITA in 2009.
The business area is steadily building up its exposure in the
medical technology segment. The companies Essmed and Brinch,
which were acquired in 2008 and are active in the ophthalmology
sector in the Nordic and Baltic countries, continued to develop well.
In 2009 the business area acquired Sefo Consulting’s Optic Prod-
ucts business, with annual sales of approximately SEK 6 million.
Annual sales in the medical technology segment now amount to
roughly SEK 80 million.
Other acquisitions during the year were of the company Domi-
nator Pump, with annual sales of approximately SEK 12 million,
and the Automation Products business of Begner AB, with annual
sales of approximately SEK 20 million.
G A Lindberg’s co-operation with ExxonMobil as a new distribu-
tor of lubricating oils in the Swedish market continued during the
year, with favourable growth.
INDUSTRIAL COMPONENTS BUSINESS AREA
INDUSTRIAl COMPONENTS

26 Indutrade Annual Report 2009 Indutrade Annual Report 2009 27
Net sales per customer segmeNt Net sales per product area
Net sales per geographic market keY ratios, FiVe Years
Engineering 40%
Food 8%
Construction 6%
Other 2%
Pulp & paper 6%
Commercial vehicles 7%
Energy 11%
Steel 7%
Pharmaceutical 13%
Sweden 67%
Norway 6%
Denmark 7%
Finland 20%
Adhesives & chemical technology 21%
Cutting tools 16%
Fasteners 14%
Medical technology 7%
Filters & process technology 17%
Automation 25%
key ratios 2009 2008 2007 2006 2005
Net sales, SEK million 1,163 1,401 1,219 1,031 900EBITA, SEK million 72 150 131 94 60
EBITA margin, % 6.2 10.7 10.7 9.1 6.6Average number of employees 395 410 381 343 321
INDUSTRIAL COMPONENTS BUSINESS AREA
“ The venture into medical
technology continues.” Olof Paulsson, President of Industrial Components business area
28 Indutrade Annual Report 2009 Indutrade Annual Report 2009 29
The Special Products business area offers custom-fabri-cated niche products, design solutions, aftermarket service and assembly, and special processing. Special Products comprises companies that conduct a considerable amount of own manufacturing and is the Indutrade business area with the highest share of proprietary products.
The five largest companies are HP Valves, Flintec, GEFA, HITMA
and Aluglas, which together accounted for 61% of the business
area’s net sales in 2009.
MARKET
The business area is active primarily in Sweden, Germany, Bene-
lux, the USA, the UK, and starting in 2009, also in South Korea.
CUSTOMERS
Customers are primarily in the pharmaceutical, energy, food and
engineering industries. Major customers include Tetra Pak, Wärt-
silä, Siemens, Sandvik, Alstom, MAN and GE.
PRODUCT AREAS
The business area is structured in nine product areas:
Valves
Development, manufacturing and marketing of butterfly valves,
ball valves and complete systems in valve and flow control tech-
nology. As a rule, the valves are specially designed – primarily for
applications in the energy sector.
Filters and Process Technology
The offering consists primarily of filters for cleaning various types
of media as well as of instruments, hoses and couplings for the
process and pharmaceutical industries.
Hydraulic Couplings
Development, manufacturing and marketing of hydraulic connec-
tions, couplings and chucks used in the assembly and disassem-
bly of drills and similar machinery with a high level of precision
and quality.
Electrical Components
This product area includes electrical components and surge protec-
tion products sold mainly to customers in the construction industry.
glass and Ceramics
The offering consists of glass products and customer-specific
technical ceramic products, primarily for the pharmaceutical and
cosmetics industries.
Measurement Technology
In this product area Indutrade develops, produces, refines and
markets advanced equipment and products in the following areas:
Industrial measurement of temperatures and flows
Laser-based measurement systems for use in alignment and
geometric measurement
Products and systems for advanced weighing
Construction Plastics
The offering includes customised products and finished plastic
components. Plastic materials with specific properties are used
in a large number of applications, from heavy industry to the food
and pharmaceutical industries.
Industrial Springs
Manufacturing of customised spiral springs, plate springs and
wire forms used in hydraulic systems, locks, doors, pumps, heat-
ing and plumbing applications, and equipment for the food indus-
try, among others.
Piston Rings
Development, production and marketing of metal piston rings
designed primarily for diesel engines and industrial applications
in the energy sector.
YEAR IN REVIEW
Net sales rose 4% to SEK 1,877 million (1,812). For comparable
units, sales decreased by 11%, while acquired growth was 7%.
Currency movements had a favourable effect on sales, by 8%. The
business area’s companies in the Netherlands and Belgium,
which are mainly active in process technologies and the pharma-
ceutical industry, continued to perform well and accounted for
most of organic growth.
EBITA totalled SEK 288 million (337), and the EBITA margin was
15.3% (18.6%). Together Indutrade’s own manufacturing comp-
anies accounted for 71% of the business area’s sales in 2009.
The lower EBITA margin is attributable in part to a slight shift
during the year towards products with lower margins, and in part
to lower demand, which mainly affected the business unit’s Swed-
ish companies. In these companies, measures have been initiated
to adapt capacity to the lower volumes.
The acquisition of the measurement technology company Flin-
tec has progressed well. Even though the EBITA margin
decreased in 2009, the company managed to capture market
share in profitable segments, including medical technology. Flin-
tec is also investing in development of more qualified products
than previously, which will open up opportunities to obtain a
higher margin.
During the year, HP Valves acquired the South Korean company
Key Valve Technologies Ltd (KVT), with annual sales of approxi-
mately SEK 150 million. KVT is a leading player in research, devel-
opment and manufacturing of high-pressure valves and has
worked closely with HP Valves for many years. Today nearly 50%
of KVT’s sales are through HP Valves. Through this acquisition
Indutrade has increased its presence in the Asian market and
strengthened its position in the energy segment.
The business area’s orientation became even more inter-
national in 2009. In addition to the acquisition of KVT in South
Korea, sales companies were established in Brazil and China.
SPECIAL PRODUCTS BUSINESS AREA
SPECIAl PRODUCTS

28 Indutrade Annual Report 2009 Indutrade Annual Report 2009 29
Net sales per customer segmeNt Net sales per product area
Net sales per geographic market keY ratios, FiVe Years
Energy 34%
Pharmaceutical 9%
Commercial vehicles 4%
Steel 2%
Chemical technology 3%
Water/wastewater/environment 1%
Construction 7%
Food 8%
Engineering 32%
Benelux 48%
UK 4% ROW 2%
Germany 18%
USA 4%
Sweden 24%
Electrical components 3%
Valves 33%Filters & process technology 10%
Glass & ceramics 6%
Industrial springs 3%
Piston rings 3%
Construction plastics 3%
Hydraulic couplings 11%Measurement
technology 28%
key ratios 2009 2008 2007 2006 2005
Net sales, SEK million 1,877 1,812 1,322 1,094 805EBITA, SEK million 288 337 234 179 108
EBITA margin, % 15.3 18.6 17.7 16.4 13.4Average number of employees 1,615 1,168 531 520 424
SPECIAL PRODUCTS BUSINESS AREA
“ Acquired companies generated
sales growth.” Johnny Alvarsson, President of Special Products business area

30 Indutrade Annual Report 2009 Indutrade Annual Report 2009 31
RISK MANAGEMENT
OPERATIONAl RISKS
Indutrade conducts operations in 18 countries, in four parts of the world, through some 120 companies. Operational risks are mitigated by this spread along with a large number of cus-tomers in various sectors and a large number of suppliers.
Changes in the economy
Indutrade’s business is dependent on its customers’ purchases
and investments. However, profitability is less affected by eco-
nomic fluctuations, since the Company is represented in a large
number of industries, and investment goods constitute a relatively
small portion of total net sales. As a result of these factors,
demand for Indutrade’s products follows GDP growth in the
Group’s geographic markets.
Relocation of operations
Relocation of industrial production to low-cost countries takes
place in the markets in which Indutrade works. This has had a
limited impact on Indutrade, however, mainly due to the Group’s
focus on customers with recurring needs in industries with a high
degree of automation, high distribution costs and/or large initial
investments.
Competition from low-cost countries
Sales of products from low-cost countries are on the rise in
Indutrade’s markets. The risk that Indutrade will be adversely
affected by this competition is counterbalanced by the fact that
the Group offers products and services with a high-tech content, a
high level of service and qualified technical advice.
In addition, Indutrade strives to establish close partnerships
with its customers by becoming involved early in the planning
and development phases, where its employees can contribute
their expertise in various processes.
Changes at the supplier level
There is always a risk of suppliers leaving a partnership with a
technology sales company to set up their own sales organisation.
Consolidation among manufacturers is one trend in the market
that points to this. Indutrade addresses this risk by choosing sup-
pliers who view a partnership with Indutrade as the most cost-
effective sales method.
Stable supplier relationships are one of the parameters that
are assessed prior to Indutrade’s acquisition of a company. To
ensure that an acquired company does not lose its product agency
agreements, its primary suppliers must give their consent to the
acquisition.
Key person dependence
The risk of losing experienced employees is accentuated in con-
nection with company acquisitions. Consequently, Indutrade’s
acquisition strategy includes ensuring that the target company’s
key employees are motivated to continue running the company
after the acquisition.
To attract and retain key personnel, Indutrade also conducts
continuous competence development and special management
development programmes.
Environmental issues
Of Indutrade’s subsidiaries, 9 in Sweden and 3 outside Sweden
conduct operations that require permits or reporting under the
Environmental Code in their respective countries and are sub-
jected to regulatory oversight.
30 Indutrade Annual Report 2009 Indutrade Annual Report 2009 31
RISK MANAGEMENT
FINANCIAl RISKS
In the course of its business Indutrade is exposed to various types of financial risk, including financing and liquidity risk, interest rate risk, currency risk, and customer and counter-party risks (credit risk). The group’s financial activities are centralised in the Parent Company in order to benefit from economies of scale and to minimise handling risks.
Financial activities are co-ordinated by the Parent Company,
which executes all important external financial transactions and
serves as an internal bank for the Group’s transactions in the cur-
rency and bond markets. Each year Indutrade’s board of directors
adopts a finance policy, which serves as the framework for man-
aging financial risks and financial activities. The policy also regu-
lates applicable limits for counterparties.
Financing and liquidity risk
Financing and liquidity risk refer to the risk of an inability to meet
payment obligations due to insufficient liquidity or difficulties in
obtaining credit from external financing institutions. This risk is
mitigated as far as possible by ensuring that the Company has a
maturity structure in place that creates conditions to secure ne-
cessary alternative means of raising capital should this be neces-
sary.
Interest rate risk
Interest rate risk refers to the risk that unfavourable changes in
interest rates will have an excessive adverse impact on the
Group’s balance of net financial income and expense as well as
earnings. To limit the negative effect on the Group’s earnings
caused by interest rate movements in the market, the Company
maintains a staggered structure in the fixed-interest periods of its
debt portfolio.
Currency risk
Currency risk pertains to the risk of unfavourable movements in
exchange rates affecting the Group’s earnings and shareholders’
equity measured in Swedish kronor (SEK). The Group’s net flows
in foreign currencies are hedged primarily through currency
clauses in customer contracts.
Customer and counterparty risk
Credit risk in the Group’s treasury management arises in connec-
tion with investments of liquid assets and as counterparty risk in
connection with the use of forward contracts and other derivative
instruments. These risks are mitigated by dealing with counter-
parties that have been approved in accordance with the guidelines
stipulated in the finance policy. Assessment of credit risk in com-
mercial transactions is handed by the individual subsidiaries.
Indutrade’s exposure to individual customers is small, and the
spread of risk is considered to be favourable.
Sensitivity analysis
Based on the debt structure at year-end, a 1% rise in interest
rates on an annualised basis would result in higher interest
expense of approximately SEK 8.3 million. Indutrade estimates
that the Company’s translation exposure entails that a 1% change
in the value of the Swedish krona (SEK) relative to other curren-
cies would result in an annual positive/negative effect of approxi-
mately SEK 40 million on net sales and approximately SEK 2.8
million on net profit.

32 Indutrade Annual Report 2009 Indutrade Annual Report 2009 33
SEVERAl-YEAR OVERVIEW
Condensed cash flow statements (SEK m) 2009 2008 2007 2006 2005 2004 2003 2002 2001 2000
Net sales 6,271 6,778 5,673 4,516 3,822 3,486 3,197 3,078 3,109 1,919
Cost of goods sold –4,207 –4,520 –3,826 –3,027 –2,582 –2,367 –2,166 –2,083 –2,123 –1,276
Gross profit 2,064 2,258 1,847 1,489 1,240 1,119 1,031 995 986 643
Development costs –44 –32 –20 –15 –12 –11 –10 –9 –9 –6
Selling costs –1,169 –1,169 –972 –835 –725 –677 –663 –642 –623 –393
Administrative expenses –323 –299 –250 –205 –182 –175 –167 –149 -157 –94
Other operating income/expenses –3 2 4 2 3 0 4 7 0 28
Operating profit 525 760 609 436 324 256 195 202 197 178
Financial income and expenses –64 –68 –31 –20 –15 –13 –13 –21 –21 –1
Profit after financial items 461 692 578 416 309 243 182 181 176 177
Tax –120 –182 –159 –116 –87 –75 –67 –67 –64 –60
Net profit for the year 341 510 419 300 222 168 115 114 112 117
EBITA 594 820 650 460 333 264 229 238 234 198
Condensed balance sheets (SEK m) 2009 2008 2007 2006 2005 2004 2003 2002 2001 2000
Assets
Goodwill 514 574 378 265 210 156 167 133 166 60
Other intangible assets 555 599 364 183 88 15 4 4 5 7Property, plant and equipment 563 554 388 327 287 277 266 255 225 132
Financial assets 48 52 43 25 31 18 13 19 20 21
Inventories 1,064 1,207 936 719 615 556 567 571 625 382
Current receivables 1,026 1,202 959 748 585 517 480 447 468 293
Cash and cash equivalents 229 223 203 119 117 97 168 172 213 119
Total assets 3,999 4,411 3,271 2,386 1,933 1,636 1,665 1,601 1,722 1,014
Liabilities and equity
Equity 1,644 1,597 1,189 892 714 708 688 643 611 375
Non-current interest-bearing liabilities 794 705 470 356 411 175 283 449 545 174Non-current noninterest-bearing liabilities
224 373 198 123 48 24 39 25 19 19
Current interest-bearing liabilities 375 490 383 236 116 204 188 42 82 145
Accounts payable, trade 424 584 470 398 322 263 228 225 227 154Other current noninterest-bearing liabilities
538 662 561 381 322 262 239 217 238 147
Total liabilities and equity 3,999 4,411 3,271 2,386 1,933 1,636 1,665 1,601 1,722 1,014
SEVERAL-YEAR OVERVIEW
Figures for 2000–2003 not adjusted according to IFRS

32 Indutrade Annual Report 2009 Indutrade Annual Report 2009 33
Condensed cash flow statements (SEK m) 2009 2008 2007 2006 2005 2004 2003 2002 2001 2000
Cash flow from operating activities before changes in working capital 438 619 526 369 313 251 210 210 201 193
Changes in working capital 120 –129 –127 –104 9 16 –8 44 –66 –37
Cash flow from operating activities 558 490 399 265 322 267 202 254 135 156
Net investment in non-current assets1) –90 –130 –67 –57 –41 –24 –53 -77 –46 –26
Company acquisitions and divestments –276 –307 –157 –148 –14 –57 6 –343 –33
Change in other financial assets 0 0 1 – –8 2 – 13 2 –13Cash flow from investing activities –278 –406 –373 –214 –197 –36 –110 –58 –387 –72
Net borrowing/-amortisation –12 131 203 65 192 –157 –83 –91 340 –51Dividend payout, Group contributions and shareholder contributions –256 –210 –150 –110 –301 –144 –11 –144 –1 –105Cash flow from financing activities –268 –79 53 –45 –109 –301 –94 –235 339 –156
Cash flow for the year 12 5 79 6 16 –70 –2 –39 87 –72
Cash and cash equivalents at start of year 223 203 119 117 97 168 172 213 119 189Exchange rate differences –6 15 5 –4 4 –1 –2 –2 7 2Cash and cash equivalents at end of year 229 223 203 119 117 97 168 172 213 119
1) Refers to the sum of the year’s investements/divestments of property, plant and equipment and intangible non-current assets (not including company acquisitions and divestments).
Financial ratios (SEK m) 2009 2008 2007 2006 2005 2004 2003 2002 2001 2000
Non-current interest-bearing liabilities 794 705 470 356 411 175 283 449 545 174
Current interest-bearing liabilities 375 490 383 236 116 204 188 42 82 145
Cash and cash equivalents –229 –223 –203 –119 –117 –97 –168 –172 –213 –119
Group net debt 940 972 650 473 410 282 303 319 414 200
Net dept/equity ratio, % 57 61 55 53 57 40 44 50 68 53
Interest coverage ratio 7.6 10.4 15.8 18.4 18.2 16.3 10.7 7.8 6.6 20.4
Equity ratio, % 41.1 36.2 36.3 37.4 36.9 43.3 41.3 40.2 35.5 37.0
Return ratios (SEK m) 2009 2008 2007 2006 2005 2004 2003 2002 2001 2000
Return on equity, % 21.3 38.1 41.1 38.5 32.5 24.3 17.3 18.2 22.7 32.0
Return on operating capital, % 22.2 36.7 39.7 35.4 30.0 26.0 23.5 24.0 29.3 36.7
Key data per employee 2009 2008 2007 2006 2005 2004 2003 2002 2001 2000
Average number of employees 3,122 2,728 1,929 1,673 1,510 1,415 1,377 1,351 1,375 846
Net sales, SEK 000 2,009 2,485 2,941 2,699 2,531 2,464 2,322 2,278 2,261 2,268
Pre-tax profit, SEK 000 148 254 300 249 205 172 132 134 128 209
SEVERAL-YEAR OVERVIEW

34 Indutrade Annual Report 2009 Indutrade Annual Report 2009 35
SEVERAL-YEAR OVERVIEW
EqUITY RATIO
%
15
25
35
45
20092007 20082006200520042003200220012000
30
35
40
45
2009200820072006200520042003200220012000
32.0
22.7
18.2
17.3
24.3
38.5
32.5
41.1
38.1
21.3
37.0
35.5
40.2
41.3
43.3
36.9
37.4
36.3 36.2
41.1
15
25
35
45
20092007 20082006200520042003200220012000
30
35
40
45
2009200820072006200520042003200220012000
32.0
22.7
18.2
17.3
24.3
38.5
32.5
41.1
38.1
21.3
37.0
35.5
40.2
41.3
43.3
36.9
37.4
36.3 36.2
41.1
RETURN ON EqUITY
%
0
200
400
600
800
1,000
2009200820072006200520042003200220012000
319414200 303 282 410 473 650 972 940
50
68
5344 40
57 61 5753 55
0
20
40
60
80
100
0
20
40
60
80
100
120
140
160
180
2005 2006 2007 2009
©NASDAQ OMX
20080
5,000
10,000
15,000
NET DEbT AND DEbT/EqUITY RATIO
n Net debt, SEK million Debt/equity ratio, %
SHARE PRICE TREND 2005–2009Right axis:
n Trading volume, thousands of shares
left axis: share price, SEK
Indutrade OMX Stockholm_PI OMX Stockholm Industrials
0
200
400
600
Omsatt antal
0
50
100
150
jmf (INDT.SE SX20PI) Dagjmf (INDT.SE OMXSPI) DagINDT.SE Dag
Jan Feb Mar Apr Maj Jun Jul Aug Sep Okt Nov Dec
0
200
400
600
Omsatt antal
0
50
100
150
jmf (INDT.SE SX20PI) Dagjmf (INDT.SE OMXSPI) DagINDT.SE Dag
Jan Feb Mar Apr Maj Jun Jul Aug Sep Okt Nov Dec

34 Indutrade Annual Report 2009 Indutrade Annual Report 2009 35
DEFINITIONS
Earnings per share:
Net profit for the period divided by the number of shares out-
standing.
EBITA:
Operating profit before amortisation of intangible assets.
EBITA margin:
EBITA divided by net sales.
Equity per share:
Equity divided by the number of shares outstanding.
Equity ratio:
Equity divided by total assets.
Gross margin:
Gross profit divided by net sales.
Interest-bearing net debt:
Interest-bearing liabilities, including pension liabilities, less cash
and cash equivalents.
Interest coverage ratio:
Operating profit plus financial income divided by financial
expenses.
Investments:
Gross investments in property, plant and equipment, excluding
company acquisitions.
Net debt/equity ratio:
Net debt devided by equity.
Operating capital:
Equity plus net debt.
Operating cash flow:
Cash flow from operating activities and net investments in non-
current assets (not including company acquisitions and divest-
ments).
Return on equity:
Net profit for the period divided by average equity per quarter.
Return on operating capital:
EBITA divided by average operating capital per quarter.
DEFINITIONS

36 Indutrade Annual Report 2009 Indutrade Annual Report 2009 37
DIRectoRs’ RepoRt
The Board of Directors and President of Indutrade AB (publ), reg. no. 556017-9367, herewith submit the annual report and consolidated financial statements for the 2009 financial year.
OPerATIOns
Indutrade markets and sells components, systems and
services with a high-tech content to industrial companies
in selected niches. the Group is organised in four business areas:
engineering & equipment, Flow technology, Industrial compon-
ents and special products. Business is conducted through more
than 120 subsidiaries in 18 countries in four parts of the world.
Indutrade’s shares are listed on Nasdaq oMX stockholm, Mid cap
list.
neT sAles AnD eArnIngs
Business during the year was hurt by weak demand,
which affected performance above all of the engineering & equip-
ment and Industrial components business areas.
Incoming orders for the Group amounted to seK 6,000
million (6,911), a decrease of 13%. For comparable units, in coming
orders fell 20%, while acquired growth was 3%. currency move-
ments had a positive impact on incoming orders, by 4%.
Net sales for the year fell 7% to seK 6,271 million (6,778). For
comparable units, net sales fell 15%, while acquired growth was
3%. the positive currency effect was 5%.
operating profit before amortisation of intangible assets
(eBItA) was seK 594 million (820), a decrease of 28%. the eBItA
margin narrowed by 2.6 percentage points to 9.5% (12.1%). Meas-
ures have been taken in the companies affected by the lower
demand, with the goal of reducing overheads by seK 200 million
on a full-year basis and the number of employees by 250. During
the fourth quarter, costs savings amounted to approximately seK
53 million. the number of employees decreased by 270 persons
compared with year-end 2008.
Net financial items totalled seK -64 million (-68).
profit after tax decreased by 33% to seK 341 million (510),
corresponding to earnings per share of seK 8.53 (12.75).
DIrecTOrs’ rePOrT
BUsIness AreAs
engineering & equipment
Net sales in 2009 amounted to seK 1,569 million (1,900), a
decrease of 17%. For comparable units, sales fell 25%, while cur-
rency movements had a positive effect on net sales, by 8%. eBItA
decreased by 56%, to seK 83 million (189). the eBItA margin was
5.3% (9.9%). Finland, the business area’s largest market, was hurt
by weak performance during the year for the Finnish export
industry. the companies in the business area that have been hurt
by the weak trend have focused on reducing their overheads,
which had a gradual effect during the year. eBItA was charged
with seK 9 million in costs for adaptation to the lower business
volume.
Flow Technology
Net sales in 2009 amounted to seK 1,689 million (1, 712). For com-
parable units, net sales fell 3%, while currency movements had a
positive effect on net sales, by 2%. eBItA for the year was seK 186
million (185), and the eBItA margin reached 11.0% (10.8%) due to
a greater share of products with higher margins.
Industrial components
Net sales amounted to seK 1,163 million (1,401), a decrease of
17%. For comparable units, net sales fell 22%, while acquired
growth was 3%. currency movements had a positive effect on net
sales, by 2%. eBItA was seK 72 million (150), and the eBItA mar-
gin was 6.2% (10.7%). cost reduction programmes have been car-
ried out in the companies hurt by lower demand. eBItA was
thereby charged with seK 8 million in one-time costs.
special Products
Net sales for the year rose 4% to seK 1,877 million (1,812). For
comparable units, net sales fell 11%, while acquired growth was
7%. currency movements had a positive effect on net sales, by
8%. eBItA was seK 288 million (337), and the eBItA margin was
15.3% (18.6%). the eBItA margin was affected by a shift towards
products with lower margins. Measures were taken during the
year in certain swedish companies to adapt overheads to antici-
pated outgoing delivery volumes.
36 Indutrade Annual Report 2009 Indutrade Annual Report 2009 37
DIRectoRs’ RepoRt
cOmPAny AcqUIsITIOns
the following four companies were acquired during the year:
Ingenjörsfirman Rossing & Jansson AB (sweden), with annual
sales of approximately seK 20 million.
Flintec Brasil Ltda (Brazil), with annual sales of approximately
4 million.
Key Valve technologies Ltd (south Korea), with annual sales of
approximately seK 150 million.
Dominator pump AB (sweden), with annual sales of approxi-
mately seK 12 million.
In addition, two businesses with combined annual sales of
approximately seK 26 million were acquired; both are included in
the Industrial components business area.
PrOFITABIlITy, FInAncIAl POsITIOn AnD cAsh FlOw
the return on operating capital was 22.2% (36.7%), and the equity
ratio was 41.1% (36.2%) at year-end. equity per share was seK
41.10 (39.93).
the Group’s interest-bearing net debt, after deducting cash and
cash equivalents, was seK 940 million (972), corresponding to a net
debt/equity ratio of 57.2% (60.9%).
cash flow from operating activities was seK 558 million (490). the
increase is attributable to a lower level of working capital.
Net investments in property, plant and equipment, excluding com-
pany acquisitions, amounted to seK 90 million (130). Investments in
company acquisitions during the year amounted to seK 56 million
(266). In addition, seK 132 million (10) was paid in earn-out payments
for previous years’ acquisitions.
emPlOyees
Indutrade had 3,040 employees (3,269) at year-end. the workforce
decreased by 270 persons as a result of the weak business situ-
ation.
IncenTIve PrOgrAmme
At the end of 2005, Indutrade’s board of directors, in co-operation
with AB Industrivärden, established an incentive programme
directed at senior executives of the Group. the aim of the pro-
gramme was to encourage management’s long-term participation
and commitment in the company. the term of the programme
extends until 30 June 2010.
A total of 30 senior executives, the members of the executive
management, and a number of subsidiary presidents have
acquired a combined total of 169,900 shares and 284,800 stock
options in the company, at market price. the stock options were
issued by AB Industrivärden.
Indutrade has compensated the executives participating in the
programme for a total of 40% of the invested amount.
the total cost for the company amounts to approximately seK
7 million, of which seK 1.2 million was charged against 2009
earnings.
PrIncIPles FOr cOmPensATIOn OF senIOr execUTIves
Information provided at the 2009 Annual general meeting per-
taining to the 2009 financial year
the chairman and members of the Board of Directors are paid
fees in accordance with a decision by the Annual General Meeting.
According to the currently applicable AGM decision, the chairman
receives a fee of seK 400,000. A fee of seK 200,000 is paid to each
of the other directors. However, no fee is paid to directors who are
employees of companies belonging to the Indutrade Group. the
Audit committee chair is paid a fee of seK 25,000, while no par-
ticular fee is paid for other committee work.
compensation of the ceo and other senior executives consists
of a base salary, variable compensation, other benefits and pen-
sion. the term ”other senior executives” refers to five persons:
the chief Financial officer (cFo), three business area presidents,
and the Group controller. senior executives employed by subsid-
iaries receive their compensation from the respective subsidiar-
ies. For the ceo of the parent company, the variable salary com-
ponent has a cap of seven months’ salary, i.e., 58% of his base
salary. For other senior executives, the variable compensation
has a cap of between 3 and 7 months’ salaries, or 25%–58% of
base salary. the variable compensation is related to the earnings
performance of the Group or of the respective business units.
the retirement age for the ceo is 65. In addition to statutory
pension benefits, Indutrade is to pay pension premiums corres-
ponding to 35% of his base salary. the ceo is entitled to choose
his pension solution, within the said cost framework and subject
to the approval of the chairman. other senior executives are
entitled to pension benefits corresponding to an average of 29%
of their base salaries. the retirement age is 65. earned pension
benefits are not conditional upon future employment by
Indutrade.

38 Indutrade Annual Report 2009 Indutrade Annual Report 2009 39
DIRectoRs’ RepoRt
Terms of notice
In the event of the company serves notice, the ceo is entitled to a 24
month term of notice with retained employment benefits. In the event
the ceo gives notice, a six month term of notice applies. For other
senior executives, a notice period of 6–24 months applies for notice
served by the respective companies, depending on the employee’s
age. salary paid out during the notice period is not deducted from
other income.
The Board’s proposed principles for compensation and other
terms of employment for company management to be presented
to the 2010 Annual general meeting
By company management is meant in this context the president
and ceo, the chief Financial officer, three business area presi-
dents and the Group controller.
compensation of company management shall normally consist
of a fixed and variable salary component. the variable component
shall reward clear, target-related improvements in simple and
transparent structures and shall have a cap.
the base salary for members of company management shall
be in line with the going rate in the market and be commensurate
with the executive’s competence, responsibility and performance.
the variable salary component for members of company manage-
ment shall normally not exceed 7 months’ salary and shall be
related to the achievement of improvements in the company’s and
respective business area’s earnings and the Group’s growth. Vari-
able compensation of company management can amount to a
maximum of approximately seK 5 million, based on 2010 salary
levels.
Incentive programmes in the company shall mainly be share
price–related and cover persons in senior positions in the com-
pany that have a significant influence on the company’s earnings
and growth, and shall be conditional upon the achievement of set
targets. Incentive programmes shall ensure long-term commit-
ment to the company’s development and shall be implemented at
market terms.
the pension terms for members of company management shall
be in line with the going rate for peer executives in the market in
which the respective executives work and should be based on
defined contribution pension solutions or correspond to a general
pension plan (in sweden, the Itp plan). salary during the notice
period for members of company management shall not exceed 24
months in the event the company serves notice and 6 months in
the event a member of company management gives notice.
the Board’s remuneration committee handles and conducts
drafting work on compensation matters pertaining to company
management for decision by the Board. the Remuneration com-
mittee thus prepares and drafts proposals for decisions regarding
the terms of employment for the ceo, and the Board evaluates the
ceo’s performance annually. the ceo consults with the Remu-
neration committee on the terms of employment for other mem-
bers of company management. the Board shall have the right to
depart from the above-described principles for compensation of
company management in individual cases if there are special rea-
sons.
rIsks AnD UncerTAInTIes
the Indutrade Group conducts business in 18 countries, in four
world regions, through more than 120 companies. Business risks
are mitigated by this spread along with a large number of custom-
ers in various sectors and a large number of suppliers in different
technology areas.
In the course of its business, Indutrade is exposed to various
types of financial risks: financing and liquidity risk, interest rate
risk, currency risk, and customer and counterparty risks (credit
risk). the Group’s financial activities are centralised in the parent
company in order to benefit from economies of scale and minim-
ise handling risks. the parent company executes all major exter-
nal financial transactions and acts as an internal bank for the
Group’s transactions in the foreign exchange and bond markets.
each year Indutrade’s board of directors adopts a finance policy,
which serves as the framework for managing financial risks and
financial activities. the policy also regulates the applicable limits
for counterparties. For a more detailed discription on how
Indutrade manages its various financial risks, see Note 2.
envIrOnmenTAl ImPAcT
Nine of the Group’s swedish subsidiaries conduct operations that
require permits or reporting in accordance with the swedish en-
vironmental code. three foreign subsidiaries conduct operations
subject to an equivalent permit or reporting obligation.
None of the Group’s companies are involved in any environ-
ment-related disputes.
reseArch AnD DevelOPmenT
Development of proprietary products is conducted primarily by com-
panies in the special products business area.
AccOUnTIng PrIncIPles
Indutrade prepares its financial statements in accordance with
International Financial Reporting standards (IFRs) as adopted by
the european Union (eU).
cOmPOsITIOn AnD wOrk OF The BOArD
the Board of Directors had seven members during the financial
year. A presentation of the board members can be found on page
70.
During the year, the Board held nine meetings plus the statu-
tory meeting. the Board’s work focused on the Group’s strategies,
goals, company acquisitions and investments, among other

38 Indutrade Annual Report 2009 Indutrade Annual Report 2009 39
DIRectoRs’ RepoRt
things. For a detailed description of the Board’s duties, its work
methods, routine matters, committees, etc., see the corporate
Governance Report on pages 66–69.
PArenT cOmPAny
the parent company’s sales, which consisted entirely of invoicing
of services to other Group companies, amounted to seK 1 million
(1). the parent company’s investments in financial assets, which
consist primarily of company acquisitions and capital contribu-
tions to subsidiaries, amounted to seK 4 million (539). Invest-
ments in intangible non-current assets amounted to seK 1 million
(1), and investments in property, plant and equipment amounted to
seK 0 million (0). the number of employees on December 31 was
8 (8).
the parent company’s primary functions are to take responsi-
bility for business development, major acquisitions and financing
of the Group’s operations.
shAre cAPITAl AnD shArehOlDers
the share capital amounts to seK 40 million, divided by a total of 40,000,000 shares with a share quota value of seK 1. All shares have equal voting power.
the Board of Indutrade AB (publ) proposes that the 2010 Annual
General Meeting authorises the Board, on one or more occasions
during the time up until the next Annual General Meeting, to
decide on new issues of a maximum of 4,000,000 shares with
departure from the shareholders’ pre-emption rights. the Board
shall only be able to decide on new issues in kind or through set-
off. set-off shall only be possible in exchange for a promissory
note issued by Indutrade as payment for shares in companies that
Indutrade seeks to purchase.
Indutrade had 5,369 shareholders as per 31 December 2009.
three shareholders together control more than 10% of the share
capital and votes:
AB Industrivärden 36.89%
AFA Insurance 11.81%
L e Lundbergföretagen AB 10.00%
evenTs AFTer The BAlAnce sheeT DATe
company acquisitions
In January, four businesses were acquired: techno skruv i
Värnamo AB, with annual sales of approximately seK 70 million,
has a strong market position in customer-specific fasteners and
mechanical products. AxMeditec sp.Z.o.o., in Bialystok, poland,
with annual sales of approximately seK 70 million, specialises in
sales of medical technology equipment used for healthcare appli-
cations in operating rooms, intensive care wards, emergency
wards, and cardio and neonatal units. techno skruv and AxMeditec
are part of the Industrial components business area as from
1 January 2010. corona control AB, which is included in the Flow
technology business area as from 1 January 2010, has annual
sales of approximately seK 50 million. the company is a total sup-
plier of solutions for industrial valves. In February, Lekang Group
was acquired, which specialises primarily in liquid filtration prod-
ucts and services. Lekang Group, which has annual sales of
approximately seK 200 million and conducts business in Norway,
sweden and Denmark, will be included in the special products
business area. In addition, a small construction plastics business
was acquired by the special products business area.
rAIseD TArgeT FOr eBITA mArgIn
In February the Board decided to raise the target for the eBItA
margin to a minimum of 10% (8%) over a business cycle, as a
result of the company’s favourable earnings performance com-
bined with a higher share of manufacturing companies.
FUTUre OUTlOOk
Indutrade’s ambition in 2010 is to achieve its set profitability tar-
get by adapting operations to the prevailing conditions in the busi-
ness environment. However, there is great uncertainty regarding
performance in 2010 in the markets and segments in which
Indutrade works, and therefore no forecast for the current year
has been given.
40 Indutrade Annual Report 2009 Indutrade Annual Report 2009 41
DIRectoRs’ RepoRt
PrOPOseD DIsTrIBUTIOn OF eArnIngsThe Annual general meeting has the following funds at its disposal:(seK million)Retained earnings 547Net profit for the year 289 836
the dividend proposed by the Board of Directors corresponds to
20% of the parent company’s equity and 10% of the Group’s
equity.
Indutrade’s dividend policy is that the dividend shall amount to
at least 50% of net profit over time.
the Board is of the opinion that the proposed dividend is well-
balanced with respect to the goals, scope and risks of the opera-
tions and with respect to the opportunities to meet the company’s
future obligations.
If the dividend had been paid out at year-end, the equity ratio
would have been 37%. After payment of the proposed dividend, it
is judged that Indutrade will continue to have good liquidity and a
net debt/equity ratio that is within the target limit.
The Board of Directors proposes the following distribution of earnings:(seK million)Dividend of seK 4.30 per share 172to be carried forward 664 836
The BOArD’s AssUrAnce
the Board of Directors and president certify that the consolidated
financial statements and annual report have been prepared in
accordance with International Financial Reporting standards
(IFRs) and generally accepted accounting principles and give a
true and fair view of the Group’s and parent company’s position
and result of operations. the Directors’ Report for the Group and
parent company give a true and fair overview of the Group’s and
parent company’s operations, position and result of operations
and describe material risks and uncertainties facing the parent
company and companies included in the Group.the Group’s and parent company’s result of operations and
position in general are shown in the following income statements, balance sheets, cash flow statements and notes.
stockholm, 11 March 2010
Bengt KjellChairman of the Board
owe Andersson Michael Bertorp Gerald engström
Director Director Director
eva Färnstrand Ulf Lundahl
Director Director
Johnny AlvarssonPresident and CEO, Director
our audit report was submitted on 15 March 2010.
Öhrlings pricewaterhousecoopers AB
Lennart DanielssonAuthorised Public Accountant

40 Indutrade Annual Report 2009 Indutrade Annual Report 2009 41
coNsoLIDAteD INcoMe stAteMeNt
cOnsOlIDATeD IncOme sTATemenT
cOnsOlIDATeD sTATemenT OF cOmPrehensIve IncOme
GRoUp
seK million Note 2009 2008
Net sales 3 6,271 6,778
cost of goods sold –4,207 –4,520
gross profit 2,064 2,258
Development costs –44 –32
selling costs –1,169 –1,169
Administrative expenses –323 –299
other operating income 4 24 25
other operating expenses 4 –27 –23
Operating profit 5, 6, 7, 8, 13, 30 525 760
Financial income 9 8 12
Financial expenses 10 –72 –80
Profit after financial items 461 692
tax 12 –120 –182
net profit for the year 341 510
earnings per share, seK 1) 8.53 12.75
proposed dividend per share, seK 4.30 6.40
1) profit for the period divided by 40,000,000 shares. there is no dilutive effect.
GRoUp
seK million 2009 2008
net profit for the year 341 510
Other comprehensive income
Actuarial gains/losses 12 –1
tax attributable to actuarial gains/losses –3 0
exchange rate differences –47 109
Other comprehensive income, net after tax –38 108
Total comprehensive income for the year 303 618

42 Indutrade Annual Report 2009 Indutrade Annual Report 2009 43
coNsoLIDAteD BALANce sHeet
cOnsOlIDATeD BAlAnce sheeT
GRoUp
SEK million Note 31 Dec. 2009 31 Dec. 2008
AssetsNon-current assets
Intangible assets14
Goodwill 514 574
other intangible assets 555 599
Total intangible assets 1,069 1,173
Property, plant and equipment 15
Land and buildings 273 254
Machinery 133 135
equipment 141 150
construction in progress and advances for property, plant and equipment 16 15
Total property, plant and equipment 563 554
Financial assets
Financial assets available for sale 16 7 8
Non-current receivables 17 13 13
Deferred tax assets 12 28 31
Total financial assets 48 52
Total non-current assets 1,680 1,779
current assets
Inventories 18 1,064 1,207
Accounts receivable, trade 19 901 1,102
tax assets 47 17
other current receivables 29 38
prepaid expenses and accrued income 20 49 45
cash and cash equivalents 29 229 223
Total current assets 2,319 2,632
Total assets 3,999 4,411

42 Indutrade Annual Report 2009 Indutrade Annual Report 2009 43
coNsoLIDAteD BALANce sHeet
GRoUp
SEK million Note 31 Dec. 2009 31 Dec. 2008
eqUITy AnD lIABIlITIes
Equity
share capital 40 40
Reserves 79 126
profit brought forward incl. net profit for the year 1,525 1,431
Total equity 1,644 1,597
Non-current liabilities
Borrowings 22 672 568
other non-current liabilities 2 1
pension obligations 23 122 136
Deferred tax liabilities 12 128 146
other provisions 24 94 227
Total non-current liabilities 1,018 1,078
Current liabilities
Borrowings 22 375 490
Accounts payable, trade 424 584
current tax liabilities 32 60
other current liabilities 164 168
provisions 24 87 132
Accrued expenses and deferred income 25 255 302
Total current liabilities 1,337 1,736
Total equity and liabilities 3,999 4,411
Pledged assets 27 236 329
contingent liabilities 28 1 1
cOnsOlIDATeD BAlAnce sheeT
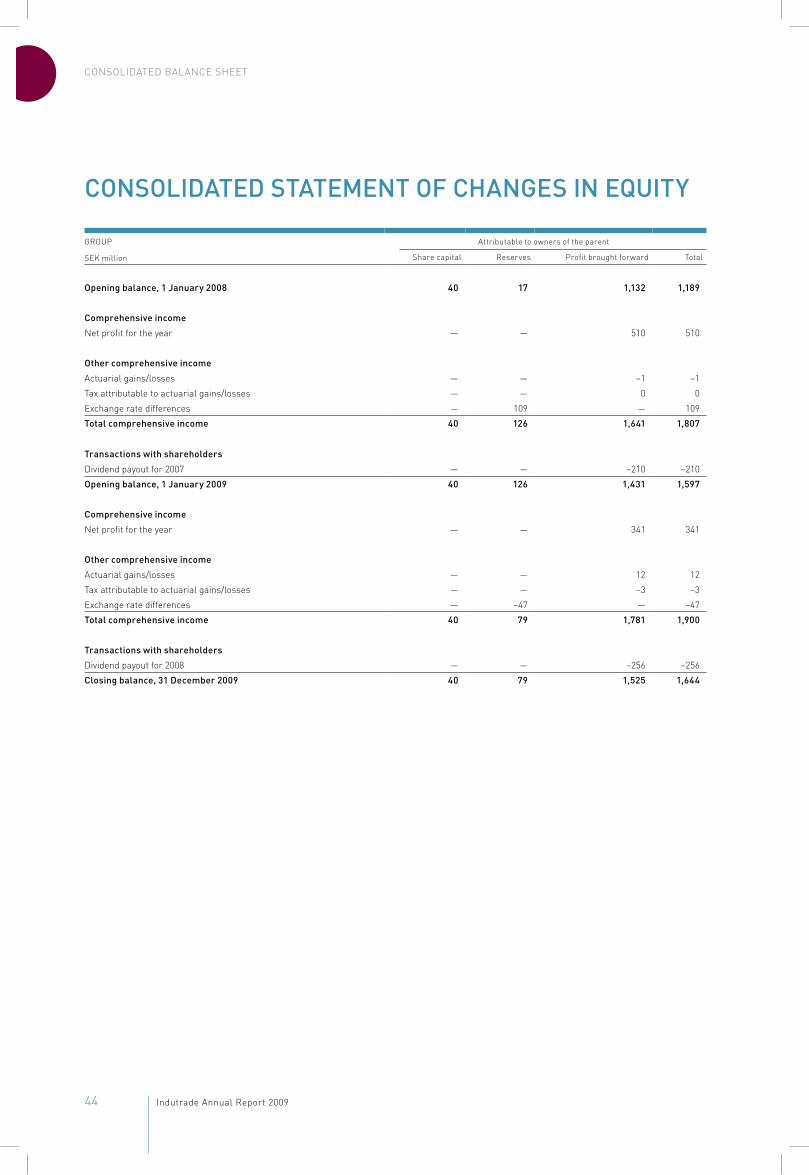
44 Indutrade Annual Report 2009 Indutrade Annual Report 2009 45
coNsoLIDAteD BALANce sHeet
cOnsOlIDATeD sTATemenT OF chAnges In eqUITy
GRoUp Attributable to owners of the parent
seK million share capital Reserves profit brought forward total
Opening balance, 1 January 2008 40 17 1,132 1,189
comprehensive income
Net profit for the year — — 510 510
Other comprehensive income
Actuarial gains/losses — — –1 –1
tax attributable to actuarial gains/losses — — 0 0
exchange rate differences — 109 — 109
Total comprehensive income 40 126 1,641 1,807
Transactions with shareholders
Dividend payout for 2007 — — –210 –210
Opening balance, 1 January 2009 40 126 1,431 1,597
comprehensive income
Net profit for the year — — 341 341
Other comprehensive income
Actuarial gains/losses — — 12 12
tax attributable to actuarial gains/losses — — –3 –3
exchange rate differences — –47 — –47
Total comprehensive income 40 79 1,781 1,900
Transactions with shareholders
Dividend payout for 2008 — — –256 –256
closing balance, 31 December 2009 40 79 1,525 1,644
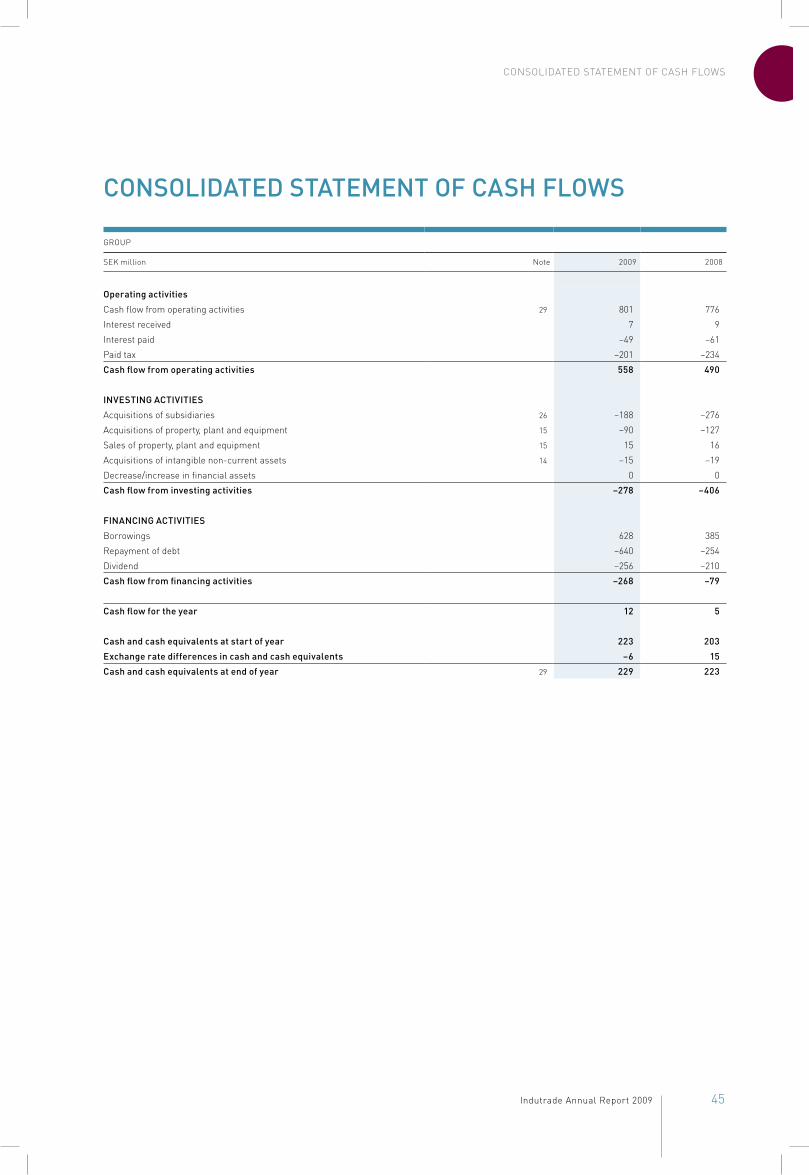
44 Indutrade Annual Report 2009 Indutrade Annual Report 2009 45
coNsoLIDAteD stAteMeNt oF cAsH FLows
cOnsOlIDATeD sTATemenT OF cAsh FlOws
GRoUp
seK million Note 2009 2008
Operating activities
cash flow from operating activities 29 801 776
Interest received 7 9
Interest paid –49 –61
paid tax –201 –234
cash flow from operating activities 558 490
InvesTIng AcTIvITIes
Acquisitions of subsidiaries 26 –188 –276
Acquisitions of property, plant and equipment 15 –90 –127
sales of property, plant and equipment 15 15 16
Acquisitions of intangible non-current assets 14 –15 –19
Decrease/increase in financial assets 0 0
cash flow from investing activities –278 –406
FInAncIng AcTIvITIes
Borrowings 628 385
Repayment of debt –640 –254
Dividend –256 –210
cash flow from financing activities –268 –79
cash flow for the year 12 5
cash and cash equivalents at start of year 223 203
exchange rate differences in cash and cash equivalents –6 15
cash and cash equivalents at end of year 29 229 223
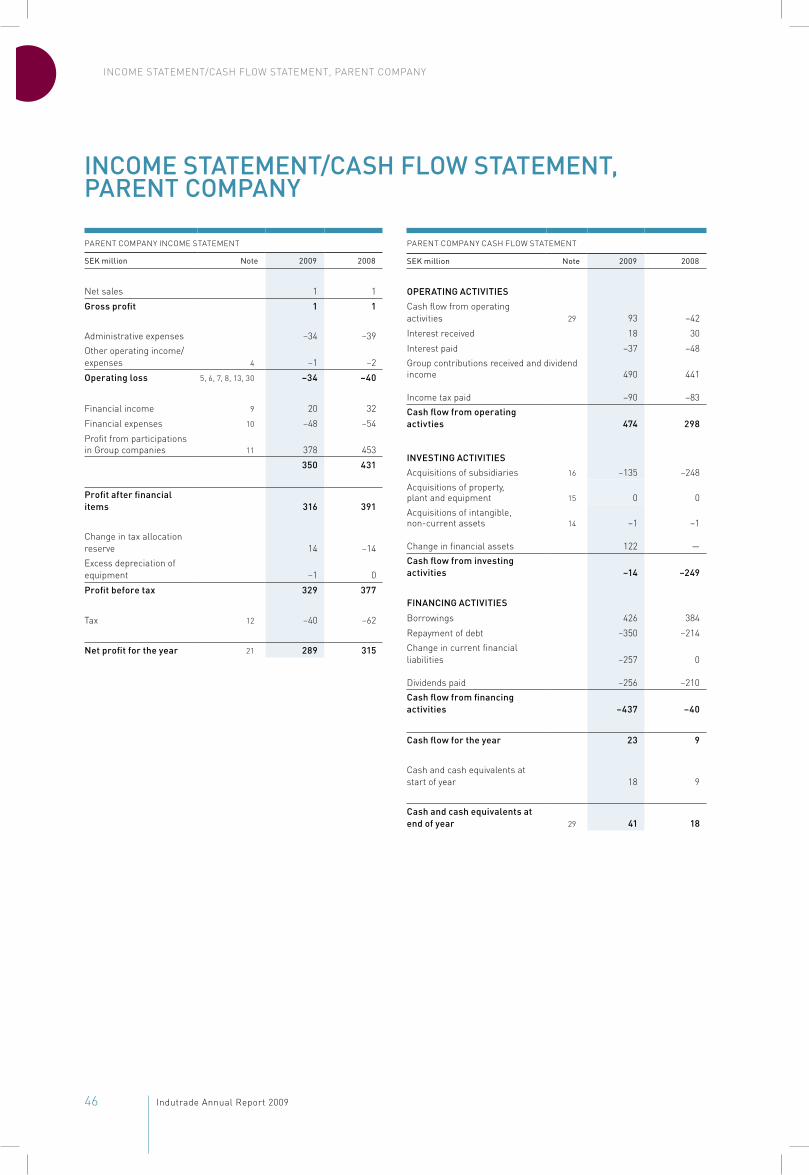
46 Indutrade Annual Report 2009 Indutrade Annual Report 2009 47
INcoMe stAteMeNt/cAsH FLow stAteMeNt, pAReNt coMpANy
IncOme sTATemenT/cAsh FlOw sTATemenT, PArenT cOmPAny
pAReNt coMpANy INcoMe stAteMeNt
SEK million Note 2009 2008
Net sales 1 1
gross profit 1 1
Administrative expenses –34 –39other operating income/expenses 4 –1 –2
Operating loss 5, 6, 7, 8, 13, 30 –34 –40
Financial income 9 20 32
Financial expenses 10 –48 –54
profit from participations in Group companies
11 378 453
350 431
Profit after financial items 316 391
change in tax allocation reserve 14 –14excess depreciation of equipment –1 0
Profit before tax 329 377
tax 12 –40 –62
net profit for the year 21 289 315
pAReNt coMpANy cAsH FLow stAteMeNt
SEK million Note 2009 2008
OPerATIng AcTIvITIescash flow from operating activities 29 93 –42
Interest received 18 30
Interest paid –37 –48Group contributions received and dividend income 490 441
Income tax paid –90 –83cash flow from operating activties
474
298
InvesTIng AcTIvITIesAcquisitions of subsidiaries 16 –135 –248Acquisitions of property, plant and equipment 15 0 0Acquisitions of intangible, non-current assets 14 –1 –1
change in financial assets 122 —cash flow from investing activities
–14
–249
FInAncIng AcTIvITIes
Borrowings 426 384
Repayment of debt –350 –214change in current financial liabilities –257 0
Dividends paid –256 –210cash flow from financing activities
–437
–40
cash flow for the year 23 9
cash and cash equivalents at start of year 18 9
cash and cash equivalents at end of year 29 41 18
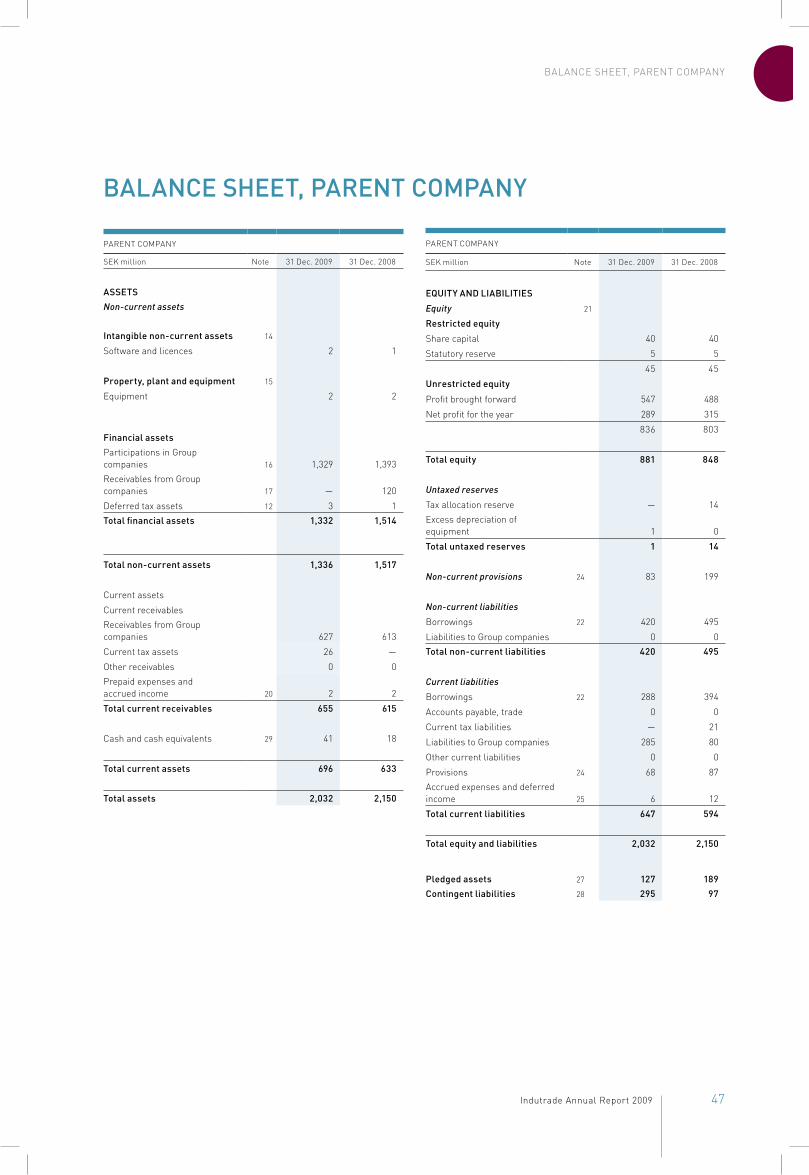
46 Indutrade Annual Report 2009 Indutrade Annual Report 2009 47
BALANce sHeet, pAReNt coMpANy
BAlAnce sheeT, PArenT cOmPAny
pAReNt coMpANy
seK million Note 31 Dec. 2009 31 Dec. 2008
AsseTsNon-current assets
Intangible non-current assets 14
software and licences 2 1
Property, plant and equipment 15
equipment 2 2
Financial assetsparticipations in Group companies 16 1,329 1,393Receivables from Group companies 17 — 120
Deferred tax assets 12 3 1Total financial assets 1,332 1,514
Total non-current assets 1,336 1,517
current assets
current receivablesReceivables from Group companies 627 613
current tax assets 26 —
other receivables 0 0prepaid expenses and accrued income 20 2 2
Total current receivables 655 615
cash and cash equivalents 29 41 18
Total current assets 696 633
Total assets 2,032 2,150
pAReNt coMpANy
seK million Note 31 Dec. 2009 31 Dec. 2008
eqUITy AnD lIABIlITIes
Equity 21
restricted equity
share capital 40 40
statutory reserve 5 5
45 45
Unrestricted equity
profit brought forward 547 488
Net profit for the year 289 315
836 803
Total equity 881 848
Untaxed reserves
tax allocation reserve — 14excess depreciation of equipment 1 0
Total untaxed reserves 1 14
Non-current provisions 24 83 199
Non-current liabilities
Borrowings 22 420 495
Liabilities to Group companies 0 0Total non-current liabilities 420 495
Current liabilities
Borrowings 22 288 394
Accounts payable, trade 0 0
current tax liabilities — 21
Liabilities to Group companies 285 80
other current liabilities 0 0
provisions 24 68 87Accrued expenses and deferred income 25 6 12
Total current liabilities 647 594
Total equity and liabilities 2,032 2,150
Pledged assets 27 127 189contingent liabilities 28 295 97

48 Indutrade Annual Report 2009 Indutrade Annual Report 2008 49
NOTES
Accounting principles And notesAmounts stated in the notes are in seK million unless otherwise indicated.
NotE 1generAl Accounting And vAluAtion principles
generalThe Indutrade Group markets and sells components, systems and services with a high-tech content to industrial companies in selected niches. The Group is organ-ised in four business areas: Engineering & Equipment, Flow Technology, Indus-trial Components and Special Products. Business is conducted through subsidi-aries in Sweden, Finland, Norway, Denmark, Estonia, Latvia, Lithuania, Russia, Germany, the Netherlands, Belgium, the UK, Sri Lanka, the USA, Brazil and Korea. Indutrade’s shares are listed on Nasdaq OMX Stockholm, Mid Cap list.
The Parent Company is a limited liability company with registered office in Stockholm.
This annual report and the consolidated financial statements were approved by the Board of Directors for publication on 11 March 2010. The consolidated and Parent Company income statements and balance sheets will be presented for adoption by the Annual General Meeting on 24 May 2010.
Basis of preparationThe consolidated accounts for the Indutrade Group have been prepared in accord-ance with International Financial Reporting Standards (IFRS) as endorsed by the European Union and in accordance with RFR 1.2 and the Swedish Annual Accounts Act. The consolidated accounts have been prepared in accordance with the cost method, with the exception of revaluations of derivative instruments, which have been stated at fair value through profit or loss.
Preparation of reports in accordance with IFRS requires the use of a number of important accounting estimations. Further, application of the Company’s accounting principles requires that management make certain assessments. Areas that involve a high degree of assessment, or areas in which assumptions and estimations are of material significance for the consolidated financial state-ments, are described below. See the section “Important estimations and assump-tions for accounting purposes”.
Standards, amendments and interpretations that apply as from 1 January 2009Effective 1 January 2009 the Group applies IFRS 8 Operating Segments, the amendment of IAS 32 Financial Instruments: Presentation, and IAS 1 R Presenta-tion of Financial Statements. None of these has any material impact on Indutrade’s financial statements or any impact on Indutrade’s result of operations and position. However, the new standard, IFRS 8, entails that Note 3 has acquired certain additional supplementary disclosures, and the amendment of IAS 1 has resulted in the addition of a new financial statement for the Group: the consoli-dated statement of changes in equity. In addition to these new standards are requirements that the Group apply the amendment of IFRS 2 Share-based Pay-ment and the amendment of IAS 23 Borrowing Costs. However, IFRS 2 has no effect on the Group, and IAS 23 does not affect the Group at all, since there are currently no assets for which borrowing costs can be capitalised. The interpreta-tions IFRIC 13 and IFRIC 14 were approved in 2008, with application as from 1 July 2009. IFRIC 13 is not relevant for Indutrade, and IFRIC 14, which provides guidance for IAS 19, has not had any effect on the Group’s result of operations or position.
Standards, amendments and interpretations that apply as from 1 January 2010No newly issued IFRSs or interpretations have been applied prospectively.
Effective 1 January 2010, the Group will begin to apply two revised standards: IAS 27 R: Consolidated and Separate Financial Statements, and IFRS 3 R Business Combinations. Even though the Group acquires many companies, application of these revised standards is not expected to result in any material differences. This is because the major changes pertain to companies that do not acquire 100% of the interests, which Indutrade’s basic principle is to always do. A change that will have some effect is that acquisition costs will no longer be capitalised. Apart from these two changes, there are no new IFRSs or IFRIC pronouncements that will have a material impact on the Group’s result of operations or position in 2010.
Basis of consolidationThe consolidated accounts include subsidiaries in which the Parent Company directly or indirectly has a controlling interest. Subsidiaries are recognised in the consolidated accounts from the date when the controlling interest is transferred to the Group. They are derecognised from the consolidated accounts from the date when the controlling interest ceases.
The consolidated accounts have been prepared in accordance with the pur-chase method, which means that the subsidiaries’ equity at the date of acquisi-tion, defined as the difference between the fair value of assets and liabilities, is eliminated in its entirety. This means that only the portion of a subsidiary’s equity that arose after its acquisition is included in the Group’s equity.
If the consolidated cost of shares exceeds the value of the Company’s net assets used in the purchase price allocation, then the difference is reported as consolidated goodwill.
translation of foreign currencyItems that are included in the financial statements for the Group’s different units have been valued in the currency that is used in the economic environment where each company mainly operates (functional currency). In the consolidated accounts, the Swedish krona (SEK) is used. This is the Parent Company’s func-tional currency and reporting currency. The result and financial position of all Group companies that have a different functional currency than their reporting currency are translated to the Group’s reporting currency in accordance with the following: – assets and liabilities for each of the subsidiaries’ balance sheets are translated
at the exchange rate on the balance sheet date, – income and expenses for each of the income statements are translated at the
average exchange rate, and – all exchange rate differences that arise are reported as a separate part of equity.
Goodwill and fair value adjustments that arise in connection with the acquisition of a foreign business are treated as assets and liabilities in the acquired company and are translated at the exchange rate in effect on the balance sheet date.
transactions and balance sheet items in foreign currencyTransactions in foreign currency are translated to the functional currency at the exchange rate in effect on the transaction date. Exchange rate gains and losses that arise upon payment in such transactions and when translating monetary assets and liabilities in foreign currency at the exchange rate on the balance sheet date are reported in the income statement. Exchange rate differences that arise upon translation or realisation of operating assets/liabilities are reported as other income/expenses, while exchange rate differences that arise upon pay-ment of financial assets/liabilities are reported as financial income/expenses.
intangible non-current assetsGoodwillGoodwill represents the amount by which the cost exceeds the fair value of the Group’s share of the acquired subsidiary’s identifiable net assets at the time of acquisition. Goodwill is tested annually for impairment and is carried at cost less accumulated impairment. Gains or losses on the disposal of an entity include the remaining carrying amount of goodwill relating to the entity sold. Goodwill is allo-cated at the segment level for impairment testing. For impairment testing during the year, see ”Impairment testing of non-financial assets ” below.
Agencies, trademarks, customer lists, licences, etc.The Group’s standpoint is that agencies, trademarks, customer lists, licences, etc., have a limited useful life and are carried at cost less accumulated amortisa-tion. In connection with nearly all company acquisitions completed by Indutrade, a value is identified for purchased agencies, trademarks and the customer relation-ships that are included as part of the acquisition. Since most of Indutrade’s acqui-sitions are small, it is not possible to break down the intangible assets. According to IFRS, supplementary disclosures are to be made for each significant intangible asset. Since the Indutrade Group’s intangible assets mainly consist of many small sub-items, where none constitutes an intangible item with material impact on the Group’s result or position, no supplementary disclosures are made for these minor intangible assets. To date, Indutrade has only identified one trademark that constitutes a significant intangible asset for the Group, for which a supplementary disclosure is provided.
Amortisation is calculated on a straight-line basis to allocate the cost of these assets over their estimated useful lives (usually 5–10 years). Acquired software licences are valued at cost and are amortised over their estimated useful lives (not more than 3 years).
property, plant and equipmentProperty, plant and equipment are stated at cost less accumulated depreciation according to plan. Additional charges are added to the asset’s carrying amount or are reported as a separate asset, depending on which is suitable, only when it is probable that the future economic benefit associated with the asset will accrue to the Group and the asset’s cost can be measured in a reliable manner. All other forms of repairs and maintenance are reported as costs in the income statement in the period in which they were incurred. Property, plant and equipment are depreciated over their estimated useful lives. The following depreciation periods are used:
Buildings 25–40 yearsMachinery 5–10 yearsEquipment 3–10 yearsNo depreciation is booked for land.
impairment of non-financial assetsGoodwill, land and the Flintec brand are judged to have an indefinite useful life and are not amortised, but are instead tested annually for impairment. Impair-ment of assets is judged on the basis of a decline in value whenever events or changes in conditions indicate that the carrying amount is not recoverable.

48 Indutrade Annual Report 2009 Indutrade Annual Report 2008 49
NOTES
Impairment is booked for the amount in which the asset’s carrying amount exceeds its recoverable value. The recoverable value is the higher of the asset’s fair value less selling costs and its value in use. When determining any need to recognise impairment, assets are grouped at the lowest levels in which there are separate, identifiable cash flows (cash-generating units). For Indutrade this entails that such determination is done at the segment level. For assets other than financial assets and goodwill for which an impairment loss has previously been recognised, a test is performed as per each balance sheet date to determine if any reversals should be done.
inventoriesInventories are stated at the lower of their cost and net realisable value. The cost of inventories is calculated using the first-in first-out (FIFO) method. The cost of finished goods and work in progress consists of raw materials, direct wages, other direct costs and related indirect manufacturing costs (based on normal manufacturing capacity). Net realisable value is the estimated selling price in the normal course of business, less relevant variable selling costs.
Financial instrumentsThe Group mainly has the following financial instruments: trade accounts receiv-able, cash and cash equivalents, trade accounts payable, borrowings and deriva-tive instruments.
Trade accounts receivableTrade accounts receivable are initially stated at fair value and thereafter in the amount that is expected to be received after individual assessment. A provision for decreases in the value of trade accounts receivable is made when there is objective evidence that the Group will not be able to receive all amounts due according to the original terms of the receivable. Testing is conducted locally in the respective subsidiaries. The asset’s carrying amount is reduced through use of a value impairment account, and the loss is reported in the income statement under the item Selling costs. Recoveries of previous impairment losses are cred-ited to Selling costs in the income statement.
Since the Group consists of 120 active companies, the item Trade accounts receivable consists of many small amounts. The subsidiaries have close contact with their customers, and thus valuation of trade accounts receivable seldom does pose any difficulty. The risk is lower, and the subsidiaries can act quickly if a cus-tomer does not pay in accordance with the terms and conditions. See also Note 2. Since Indutrade’s trade accounts receivable normally have a remaining lifetime of less than six months, the carrying amount is considered to reflect the fair value.
Cash and cash equivalentsCash and cash equivalents include cash at bank and in hand. Drawn bank over-draft facilities are stated in the balance sheet under Borrowings.
Trade accounts payableTrade accounts payable are initially stated at fair value and thereafter at amor-tised cost using the effective interest method. Since Indutrade’s trade accounts payable normally have a remaining lifetime of less than six months, the carrying amount is considered to reflect the fair value.
BorrowingsLoans are stated initially at fair value, net after deducting transaction costs. They are thereafter stated at amortised cost, and any difference between the amount received (net after transaction costs) and the repayment amount is stated in the income statement, allocated over the duration of the loans using the effective interest method. Borrowings are classified as non-current liabilities unless the Group has an unconditional right to defer repayment by at least 12 months after the balance sheet date.
Derivative instrumentsThe Group’s derivative instruments consist of forward contracts. Reporting is done in the balance sheet on the contract date at fair value. Realised and unreal-ised gains and losses as a result of changes in fair value are included in the income statement during the period in which they arise. Profits and losses arising from forward cover of payments in foreign currencies are posted as other operat-ing income/expense, and the earnings effect of forward contracts used to hedge loans is reported among financial income and expenses.
Available-for-sale financial assetsAvailable-for-sale financial assets are non-derivative financial assets that are designated as available for sale or have not been classified in any other category. These are included in non-current assets unless management has the intention of selling the asset within 12 months after the balance sheet date. The Group has only negligible holdings of such assets. The carrying amount is not considered to deviate noticeably from the fair value.
provisionsA provision is reported in the balance sheet when the Group has a formal or con-structive obligation as a result of an event that has occurred and it is probable that an outflow of resources will be required to settle the obligation, and the amount has been calculated in a reliable manner. A provision is made for esti-mated, future earn-out payments associated with purchases of shares. The earn-out payment is based on future profits in the acquired company. The provision is stated at fair value by discounting the provision for the earn-out payment using a discount rate of 5%.
Future obligations for guarantee commitments are based on outlays for similar costs during the financial year or calculated costs for the respective obligations.
leasesIAS 17 defines a lease as an agreement whereby a lessor conveys to the lessee in return for a payment or series of payments the right to use an asset for an agreed period of time.
The Group leases certain non-current assets, mainly cars. Leases in which the Group in all essential respects accepts the financial risks are classified as finance leases. At the start of the lease period, finance leases are carried on the balance sheet at the lower of the leased asset’s fair value and the present value of the minimum lease payments. Every lease payment is allocated among amortisa-tion of the principal and financial expenses to achieve a fixed rate of interest for the reported liability. Corresponding payment obligations, after deducting finan-cial expenses, are included in the balance sheet under long-term and short-term borrowings. The interest portion of financial expenses is reported in the income statement allocated over the period of the lease so that every reporting period is charged with an amount that corresponds to a fixed interest rate for the liability reported during the respective periods. Non-current assets held under finance leases are depreciated during the shorter of the asset’s useful life or lease period.
segment reportingThe Group applies IFRS 8, effective from the 2009 financial year. Segment report-ing is based on the internal reporting to the chief operating decision maker. For Indutrade, this means the Group CEO and the key ratios that he receives on a monthly basis for the business areas. The segment classification has not been affected compared with 2008; the Group’s business areas constitute operating segments in the same way that they constituted primary segments in accordance with the previous rules.
taxesIncome tax consists of current tax and deferred tax. Income taxes are reported in the income statement, except in cases where the tax is attributable to items that are reported directly against equity.
Current tax is tax that is to be paid or received in the current year using the tax rates that apply on the balance sheet date; this also includes adjustments of cur-rent tax attributable to earlier periods. Tax is calculated according to the tax rate in the respective countries.
Deferred taxes attributable to temporary differences between the book value and the taxable value of assets and liabilities are reported in full in the consoli-dated accounts, while the Parent Company still reports the difference pertaining to machinery and equipment as an untaxed reserve. Valuation of deferred tax is based on how the underlying asset or liability is expected to be realised or set-tled. Deferred tax is calculated using the tax rates that apply on the balance sheet date or announced as per the balance sheet date and which are expected to apply when the deferred tax asset in question is realised or the tax liability is settled. Deferred tax assets attributable to deductible, temporary differences and unuti-lised tax-loss carryforwards are reported to the extent that it is probable that they will be utilised in the foreseeable future.
employee benefitsThe Group has both defined benefit and defined contribution pension plans. A defined benefit pension plan is a pension plan that specifies a level of post-retire-ment pension benefits. A defined contribution pension plan is a pension plan to which the Group makes set contributions to a separate legal entity.
The liability carried on the balance sheet pertaining to defined benefit pension plans consists of the present value of the defined benefit obligations on the bal-ance sheet date, less the fair value of the plan assets. The defined benefit obliga-tion is calculated annually by independent actuaries using the projected unit credit method. The present value of the defined benefit obligations is calculated by discounting the anticipated future cash flows using the rate of interest for gov-ernment bonds that have been issued in the same currency that the benefits will be paid in and with maturity periods comparable to those of the current pension liabilities.
Actuarial gains and losses arising from experience adjustments and changes in actuarial assumptions are recognised directly in equity after taking into account payroll tax and deferred tax.
Pension costs relating to past service are recognised directly in the income statement.
For defined contribution pension plans, the Group pays contributions to pub-licly or privately administered pension plans on a statutory, contractual or volun-tary basis. The Group has no further payment obligations once the contributions have been paid. The contributions are reported as payroll cost when they are due for payment.
Termination benefitsTermination benefits are payable when employment is terminated before the nor-mal retirement date or when an employee accepts voluntary departure in exchange for such benefits. The Group reports severance pay when it is demon-strably committed to either terminating the employment of current employees according to a detailed formal plan without the possibility of withdrawal, or to providing termination benefits as a result of an offer made to encourage voluntary departures.
50 Indutrade Annual Report 2009 Indutrade Annual Report 2008 51
NOTES
Profit-sharing and bonus plansThe Parent Company and most of the subsidiaries have bonus or profit-sharing systems based on the earnings performance of each unit. The Group reports a liability and an expense for these programmes. Reporting is done in the period the cost pertains to.
development costsThe Group conducts only product-specific development activities. Outlays for development are reported as development costs in the income statement as they arise. If the requirements in IAS 38 for internally prepared intangible assets are fulfilled, then the development that has been conducted is capitalised and is included in Other intangible assets in Note 14. The requirements of this standard are that it is possible to identify the asset, that it will generate future economic benefit, and that the cost can be determined in a reliable manner.
revenue recognitionThe Group recognises revenue when its amount can be measured in a reliable manner and it is probable that future economic benefit will accrue to the Com-pany. Revenue is recognised excluding value added tax and discounts. The Group’s sales consist in all essential respects of sales of products. Revenue from sales of products is recognised when ownership, i.e., the benefits and risks, has been transferred to the buyer. The date on which ownership is transferred is reg-ulated in most sales made by the Group in written agreements with the buyer. For the small portion of sales that pertain to services, the revenue is recognised when the services are rendered.
Interest income is recognised taking into account accrued interest on the bal-ance sheet date. Dividend income is recognised when the right to receive payment has been determined.
important estimations and assumptions for accounting purposesThe Group makes estimations and assumptions about the future. By definition, the estimations for accounting purposes that are a consequence of these rarely match the actual outcome. The estimations and assumptions that entail a consid-erable risk for significant adjustments in the carrying amount of assets and liabil-ities in the next financial year are discussed below.
Impairment testing of non-financial assetsIn connection with the annual impairment testing of goodwill and other non-financial assets, which was conducted most recently in December 2009, Indutrade applied a model in which assumptions were made about such items as revenue growth, gross margins, investments and cost of capital. The following important assumptions were made for estimations of value in use: The rate of growth for all segments has been estimated at 2%, and the discount rate before tax has been estimated at 14%. The gross margin has been assumed as the reported gross margin for 2009. The impairment test was performed at the seg-ment level, which is the Group’s lowest cash-generating unit.
The impairment test did not result in any need to recognise impairment. Even if the discount rate before tax used in the model had been 1 percentage point higher and the gross margin had been 1 percentage point lower than manage-ment’s estimations as per 31 December 2009, no need to recognise impairment would have arisen.
Valuation of pension obligationsIn calculating the liability in the balance sheet pertaining to defined benefit pen-sion plans, various assumptions have been made, as described in Note 23. If the discount rate were to be lowered by 1 percentage point, the PRI liability would increase by SEK 21 million, including payroll tax, and other defined benefit plans would increase by SEK 35 million. If the discount rate were to be increased by 1 percentage point, the PRI liability would decrease by SEK 16 million, and other defined benefit plans would decrease by SEK 30 million.
parent companyThe Parent Company has prepared its annual report in accordance with the Swedish Annual Accounts Act and RFR 2.2, Reporting for Legal Entities. Accord-ing to RFR 2.2, in the annual report for a legal entity, the Parent Company shall apply all IFRSs and statements endorsed by the EU as far as possible within the confines of the Annual Accounts Act and taking into account the connection between reporting and taxation. The recommendations indicate which exceptions and amendments are to be applied with respect to IFRS. The Company has not chosen to apply new rules prospectively.
Participations in Group companies are reported in the Parent Company using the cost method. Dividends and Group contributions received are reported as income under the condition that these stem from profits earned after the acquisi-tion.
Untaxed reserves are reported in the Parent Company including deferred tax liabilities and not as in the Group (broken down into deferred tax liabilities and equity).
NotE 2 risKs And risK mAnAgement
market risksThe Indutrade Group conducts business in Sweden, Finland, Denmark, Norway, the Netherlands, Belgium, Germany, the UK, Sri Lanka, the USA, the Baltic coun-tries, Russia, Korea and Brazil. The geographic spread along with a large number of customers and products provides relatively limited risk exposure and sensitiv-ity to economic fluctuations.
A trading group such as Indutrade is exposed to the risk of an agency relation-ship being terminated. This could occur, for example, in connection with a struc-tural change at the supplier level. This is a natural occurrence in an agency’s operations, and the organisation has experience in dealing with this. Indutrade’s approximately 120 companies have, on average, 2–3 main agencies per company, complemented by a number of smaller agencies. As a result of the large number of agencies, no individual agency accounts for a decisive economic risk from the Group’s perspective.
The risk associated with major customers deciding to bypass the agency level and trade directly with the producers is judged to be marginal, since customers attach great value to the technical expertise, availability and delivery reliability provided by an inventory-holding local technology sales company such as Indutrade. Indutrade’s companies also provide aftermarket services such as servicing.
Financial risksOwing to its international operations, the Indutrade Group is exposed to various types of financial risk:– Financing risks– Interest rate risks– Currency risks– Customer and counterparty risks
Finance policyIndutrade’s board of directors adopts the Company’s finance policy on a yearly basis. This policy establishes the Company’s financial strategy and internal dele-gation of responsibilities. The policy also governs such matters as how financing, liquidity management and currency risk management should be handled within the Group and the restrictions that should be considered in terms of counterpar-ties.
Financing riskFinancing risk is the risk that financing of the Group’s capital requirement is impeded or becomes more expensive. This is mitigated as far as possible by ensuring that the Company has a maturity structure that facilitates the taking of necessary alternative actions required to secure the raising of capital should this be necessary.
Indutrade takes a central approach to the Group’s financing. In principle, all external financing is conducted by the Parent Company, which then finances the Group’s subsidiaries, both in and outside Sweden, in local currencies. Group account systems are established in Sweden, Finland, Norway and the Nether-lands.
At year-end 2009 the Parent Company had external interest-bearing loans worth SEK 708 million (889). The corresponding amount for the Group was SEK 1,047 million (1,058). After taking interest-bearing provisions and cash and cash equivalents into account, the Group’s interest-bearing net debt, including other interest-bearing liabilities, was SEK 940 million at year-end, compared with SEK 972 million a year earlier.
At year-end 2009 the Group had SEK 229 million (223) in cash and cash equiva-lents and SEK 497 million (767) in granted, unutilised overdraft facilities. Of the Group’s interest-bearing loans, 64% of the total amount falls due for payment after 31 December 2010. For a more detailed analysis of maturities, see the description of the Group’s borrowings in Note 22.
Indutrade defines its managed assets as equity in the Group. Management of the capital structure aims to create a balance between equity, debt financing and liquidity to enable the Group to secure financing at a reasonable capital cost. The Group’s goal is that the net debt/equity ratio, defined as interest-bearing liabili-ties less cash and cash equivalents in relation to equity, will normally not exceed 100%. At year-end the debt/equity ratio was 57% (61%).
interest rate riskInterest rate risk is the risk that unfavourable changes in interest rates will have an excessive impact on the Group’s net financial items and earnings. At year-end 2009 most of the Group’s loans carried variable rates of interest. At the preceding year-end, the average remaining fixed interest term for the Group’s loans was 1 month. Based on the loan structure at year-end, a 1% rise in the interest rate on an annualised basis would result in an increase of about SEK 8.3 million in inter-est expense (9.2), without taking into account the loans’ fixed interest periods. Taking into account the existing fixed interest periods, the effect would be approx-imately SEK 8.3 million (6.3). Earnings after tax would be affected by SEK -6.1 mil-lion (-6.8).
The table below shows the remaining contract terms of loans until maturity. Bank overdraft facilities are not included. For information on the utilisation of bank overdraft facilities and granted credit limits, see Note 22.

50 Indutrade Annual Report 2009 Indutrade Annual Report 2008 51
noteS
GRoup pARent CompAny
2009 2008 2009 2008
Maturity dates for financial liabilities:
maturity 2009 — 365 — 318
maturity 2010 315 216 258 159
maturity 2011 322 297 223 280
maturity 2012 167 41 43 38
maturity 2013 73 67 67 63
maturity 2014 or thereafter 130 — 115 —
Total borrowings incl. interest, SEK m 1 007 986 706 858
Currency riskCurrency risk is the risk of unfavourable movements in exchange rates affecting consolidated earnings and equity measured in SeK:
– transaction exposure arises as a result of the Group having incoming and outgoing payments in foreign currencies.
– translation exposure arises as a result of the Group, via its foreign subsidi-aries, having net investments in foreign currencies.
the Indutrade Group’s transaction exposure arises primarily when subsidiar-ies import products for sale in the domestic market. exchange rate effects are eliminated as far as possible by using currency clauses in customer contracts and by buying and selling in the same currency. In special cases, forward con-tracts are used. Indutrade therefore considers its transaction exposure to be lim-ited.
the consolidated income statement includes SeK 3 million (-5) in exchange rate differences in operating profit and SeK 0 million (-6) in net financial items.
With respect to transaction exposure, at year-end 2009 Indutrade had net exposure of SeK -90 million in foreign currency (-115). See the breakdown of cur-rencies in the following table.
Transaction exposure in foreign currency
GRoup
net exposure 2009 2008
in millionslocal
currency SeKlocal
currency SeK
euR –5,7 –59 –9,5 –103
GBp –2,6 –30 –2,1 –24
uSD –1,2 –9 –2,4 –18
CHF –1,0 –7 2,2 13
DKK 10,8 15 5,7 8
other currencies 0 9
total net exposure –90 –115
At year-end the Group had outstanding forward contracts worth SeK 41 million (135) to reduce the currency risk associated with future flows, of which SeK 1 mil-lion (35) pertains to euR, and SeK 44 million (99) pertains to uSD. the contracts in euR expire within six months. market valuation of outstanding forward con-tracts as per 31 December 2009 has resulted in an unrealised loss/gain of SeK 0 million (-2.7).
In addition, the parent Company has hedged outstanding receivables from subsidiaries. Forward contracts pertain to DKK 31 million (37), noK 20 million (11), GBp 17 million (16) and euR 135 million (191). All contracts have a term of less than one year.
the Group is exposed to a translation risk on the translation of the accounts of foreign subsidiaries into the Group currency, SeK. this type of currency risk is not hedged. net investments in foreign subsidiaries at year-end are shown in the following table. Indutrade also had net investments in other currencies both in 2009 and 2008, but the amounts were insignificant.
Net investments in foreign subsidiaries
GRoup
net exposure 2009 2008
in millionslocal
curreny SeKlocal
currency SeK
euR 73,2 758 69,6 761
LKR 2 233 141 1 888 129
DKK 52,4 73 67,0 98
noK 48,2 60 44,5 49
GBp 7,4 85 7,4 83
Indutrade estimates that the Company’s translation exposure entails that a 1% change in the value of the Swedish krona vs. other currencies would result in a yearly positive/negative effect corresponding to approximately SeK 40 million (36) on net sales and approximately SeK 2.8 million (3.8) on net profit.
Customer and counterparty risksCredit risks in the treasury management activities arise in connection with investments of cash and cash equivalents, and as counterparty risks in connec-tion with the use of forward contracts. these risks are limited by using counter-parties that have been approved in accordance with the guidelines contained in the finance policy.
the risk of the Group’s customers failing to meet their obligations, i.e., of pay-ment not being received from customers, constitutes a customer credit risk. Assessment of Indutrade’s credit risk in commercial transactions is handled by the respective subsidiaries. Indutrade’s exposure to individual customers is small, and the risk spread is considered to be favourable. no single customer accounts for more than 2% of sales. the Indutrade Group conducts business in many coun-tries, which leads to a spread of credit risk exposure over several geographic mar-kets. For information on sales and profit per geographic area, see note 3.
For information on age analysis, provisions for impaired trade accounts receivable and customer losses, see note 19.
NotE 3 SEgMENT rEporTiNg
Starting in 2009, Indutrade applies a new IFRS standard that covers reporting of the Group’s operating segments, see also note 1.
the Group is organised into four business areas: engineering & equipment, Flow technology, Industrial Components and Special products, which constitute the Group’s operating segments; these are identical to the primary segments according to a previous IFRS. the Group’s business areas conduct business pri-marily in the nordic countries and northern europe.
the engineering & equipment business area offers customised niche prod-ucts, design solutions, aftermarket service and special processing. products consist primarily of hydraulics, equipment for automotive workshops, flow prod-ucts, transmissions and measuring instruments.
the Flow technology business area offers components and systems for regu-lating, controlling and monitoring flows. products consist primarily of valves, pumps, measuring and analysis instruments, pipe systems, hydraulics, compres-sors and service.
the Industrial Components business area offers a wide range of technically advanced components and systems for production and maintenance. Its prod-ucts, which consist mainly of consumables for recurring needs, include – among others – fasteners, mechanical components, filters, pumps, lubricants, corrosion prevention products, adhesives, transmissions, cutting tools and medical tech-nology.
the Special products business area offers custom-fabricated niche products, design solutions, aftermarket service, assembly and special processing. Its products include, among others, valves, filters, hydraulic couplings, electrical components, glass, technical ceramics, measurement technology products, spe-cial plastics, industrial springs and piston rings.
According to IFRS, the part of operations that does not constitute its own operating segment is to be designated as a segment called ”other”. Indutrade AB lacks a major revenue source, which is why the parent Company does not consti-tute its own operating segment. In the table below, the other segment is not reported separately, but is instead reported together with eliminations.
the operating segments are followed up through net sales, which include both external and internal sales. However, the scope of internal sales between the subsidiaries is very limited. At most, internal sales account for 1% of an indi-vidual business area’s net sales.
Since IFRS requires reporting of more earnings metrics than the ones that are followed up by the chief operating decision maker, additional earnings metrics are included in the table below. However, the central earnings metric for Indutrade is eBItA.
the business areas are followed up using the same accounting principles as the Group. the principles for calculation have not been affected compared with earlier periods or due to application of IFRS 8. the primary segments according to the reporting for 2008 are the same as Indutrade’s operating segments.
the Indutrade Group does not receive revenue from any single customer that amounts to 10% of total, which is why no data is reported on this.
Investments in non-current assets include purchases of intangible assets (note 14), and of property, plant and equipment (note 15).
the principle for breaking down external revenue and non-current assets per geographic area in the tables below is that such reporting is based on the location of the subsidiary’s registered office. Since the Group’s companies receive most of their revenue from agency operations, sales are conducted in the same country in which the companies have their registered offices.
the products that Indutrade sells can be broken down into roughly 20 product groups. the largest – valves – accounted for 29% of net sales in 2009, or SeK 1,836 million (1,464). Hydraulics and industrial equipment accounted for 17%, or SeK 1,039 million (1,121), and measurement technology products accounted for SeK 992 million (559). other product groups accounted for 6% or less of net sales.
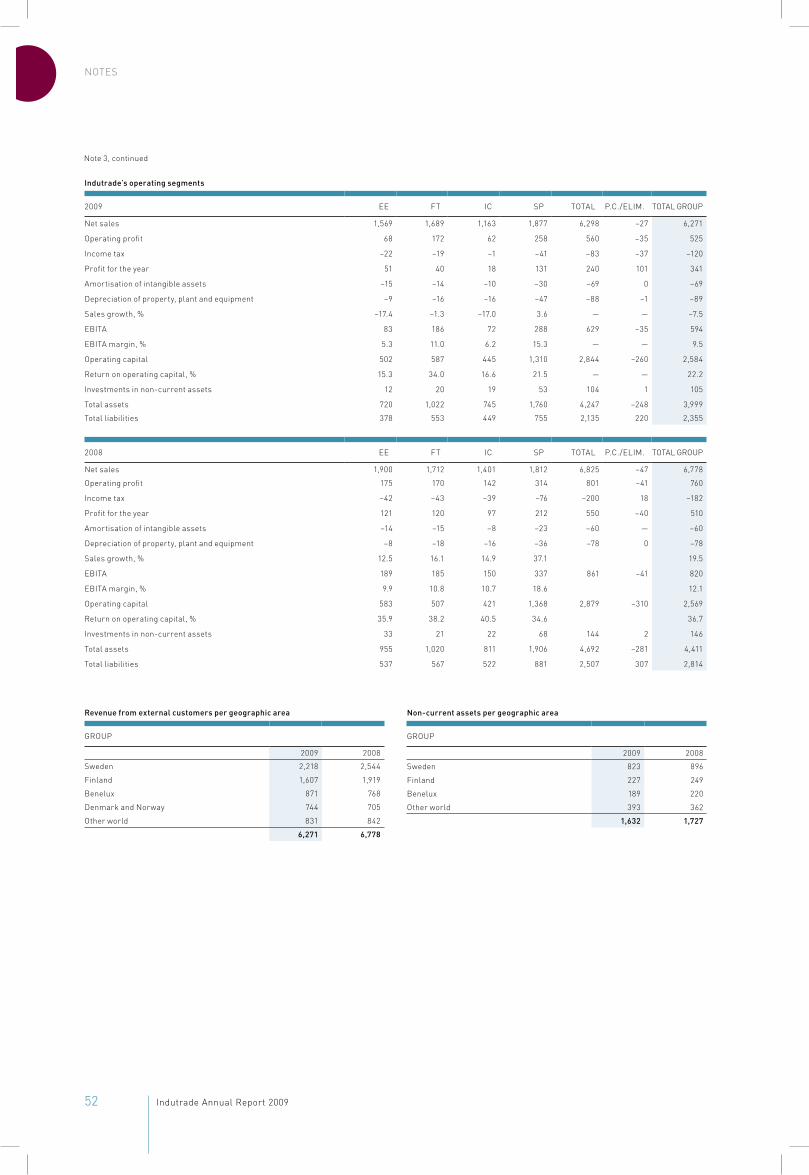
52 Indutrade Annual Report 2009 Indutrade Annual Report 2008 53
NOTES
indutrade’s operating segments
2009 EE FT IC SP TOTAL P.C./ELIM. TOTAL GROUP
Net sales 1,569 1,689 1,163 1,877 6,298 –27 6,271
Operating profit 68 172 62 258 560 –35 525
Income tax –22 –19 –1 –41 –83 –37 –120
Profit for the year 51 40 18 131 240 101 341
Amortisation of intangible assets –15 –14 –10 –30 –69 0 –69
Depreciation of property, plant and equipment –9 –16 –16 –47 –88 –1 –89
Sales growth, % –17.4 –1.3 –17.0 3.6 — — –7.5
EBITA 83 186 72 288 629 –35 594
EBITA margin, % 5.3 11.0 6.2 15.3 — — 9.5
Operating capital 502 587 445 1,310 2,844 –260 2,584
Return on operating capital, % 15.3 34.0 16.6 21.5 — — 22.2
Investments in non-current assets 12 20 19 53 104 1 105
Total assets 720 1,022 745 1,760 4,247 –248 3,999
Total liabilities 378 553 449 755 2,135 220 2,355
2008 EE FT IC SP TOTAL P.C./ELIM. TOTAL GROUP
Net sales 1,900 1,712 1,401 1,812 6,825 –47 6,778
Operating profit 175 170 142 314 801 –41 760
Income tax –42 –43 –39 –76 –200 18 –182
Profit for the year 121 120 97 212 550 –40 510
Amortisation of intangible assets –14 –15 –8 –23 –60 — –60
Depreciation of property, plant and equipment –8 –18 –16 –36 –78 0 –78
Sales growth, % 12.5 16.1 14.9 37.1 19.5
EBITA 189 185 150 337 861 –41 820
EBITA margin, % 9.9 10.8 10.7 18.6 12.1
Operating capital 583 507 421 1,368 2,879 –310 2,569
Return on operating capital, % 35.9 38.2 40.5 34.6 36.7
Investments in non-current assets 33 21 22 68 144 2 146
Total assets 955 1,020 811 1,906 4,692 –281 4,411
Total liabilities 537 567 522 881 2,507 307 2,814
revenue from external customers per geographic area
GROUP
2009 2008
Sweden 2,218 2,544
Finland 1,607 1,919
Benelux 871 768
Denmark and Norway 744 705
Other world 831 842
6,271 6,778
non-current assets per geographic area
GROUP
2009 2008
Sweden 823 896
Finland 227 249
Benelux 189 220
Other world 393 362
1,632 1,727
Note 3, continued

52 Indutrade Annual Report 2009 Indutrade Annual Report 2008 53
NOTES
NotE 4 other operAting income/expenses
GROUP PARENT COMPANy
2009 2008 2009 2008
other operating income
Exchange rate gains 23 18 — —
Other 1 7 — —
24 25 — —
other operating expenses
Exchange rate losses –27 –23 –1 –2
–27 –23 –1 –2
other operating income/expenses –3 2 –1 –2
NotE 5 AverAge numBer oF employees
2009 2008
No. employees
Of whom, women
No. employees
Of whom, women
Parent Company 8 4 8 4
Subsidiaries in Sweden 865 160 913 191
total sweden 873 164 921 195
subsidiaries outside sweden
Denmark 149 23 151 24
Finland 587 100 617 101
Netherlands 177 44 169 38
Norway 60 10 57 8
Sri Lanka1) 870 392 464 193
UK 118 15 106 14
Germany 117 37 104 33
Other 171 38 139 30
total outside sweden 2 249 659 1 807 441
group total 3 122 823 2 728 636
1) Included for 6 months in 2008.
The Parent Company’s board is composed of one woman and six men, compared with one women and seven men a year earlier. As in the preceding year, subsidi-aries’ boards of directors and management include two women. There are no women in the Parent Company’s management.
NotE 6WAges, sAlAries And other remune-rAtion, And sociAl security costs
2009 2008
Wag
es, s
alar
ies
and
othe
r re
mu-
nera
tion
Soci
al s
ecur
ity
cost
s
Of w
hich
, pen
-si
on c
osts
Wag
es, s
alar
ies
and
othe
r re
mu-
nera
tion
Soci
al s
ecur
ity
cost
s
Of w
hich
, pen
-si
on c
osts
Parent Company 11 7 3 14 8 3
Subsidiaries in Sweden 366 175 49 372 177 43
total sweden 377 182 52 386 185 46
subsidiaries outside sweden
Denmark 103 11 8 96 8 6
Finland 287 61 48 282 65 49
Netherlands 87 26 14 77 26 16
Norway 38 8 1 31 4 1
Sri Lanka1) 19 — — 9 — —
UK 42 6 2 35 8 2
Germany 58 10 0 53 9 0
Other 41 9 0 33 7 0
total outside sweden 675 131 73 616 127 74
group total 1 052 313 125 1 002 312 120
Of the Parent Company’s pension costs, SEK 1 million (1) pertains to the Board of Directors and President. The corresponding amount for the Group is SEK 19 mil-lion (17).
Wages, salaries and other remuneration broken down by country and between company management and other employees
2009 2008
Com
pany
m
anag
emen
t
Of w
hich
, bo
nuse
s an
d si
mila
r
Oth
er
empl
oyee
s
Com
pany
m
anag
emen
t
Of w
hich
, bo
nuse
s an
d si
mila
r
Oth
er
empl
oyee
s
Parent Company 5 0 5 7 2 7
Subsidiaries in Sweden 46 5 321 44 7 328
total sweden 51 5 326 51 9 335
subsidiaries outside swe-den
Denmark 8 0 95 6 1 90
Finland 31 1 257 24 3 258
Netherlands 6 2 81 4 0 73
Norway 6 0 32 5 0 26
Sri Lanka1) 2 0 18 1 0 8
UK 4 1 39 2 — 33
Germany 6 1 52 4 1 49
Other 3 0 35 4 1 29
total outside sweden 66 5 609 50 6 566
group total 117 10 935 101 15 901
1) Included for 6 months in 2008.
Total absence due to illness in the Parent Company in 2009 was 32 hours of a total of 12,874 hours, i.e., 0.25% (3.46%) of the total number of work hours. Long-term absence due to illness accounted for 0 hours (456). By long-term absence is meant uninterrupted absence due to illness lasting more than 60 days.
executive compensationInformation provided at the 2009 Annual General Meeting pertaining to the 2009 financial yearThe Chairman and members of the Board of Directors are paid fees in accordance with a decision by the Annual General Meeting. According to the currently appli-cable AGM decision, a fee of SEK 400,000 is payable to the Chairman. A fee of SEK 200,000 is payable to each of the other non-executive directors, and a fee of SEK 25,000 is payable to the Audit Committee chair. Compensation for the CEO and other senior executives consists of a base salary, variable compensation, other benefits and pension. By other senior executives is meant five persons: the Chief Financial Officer (CFO), three business area presidents and the Group Controller. Senior executives employed by the subsidiaries receive their compensation from the respective subsidiaries. For the CEO of the Parent Company, the variable sal-ary component has a cap corresponding to seven months’ salary, i.e., 58% of his base salary. For other senior executives, the variable compensation has a cap corresponding to between 3 and 7 months’ salaries, or 25%–58% of base salary. The variable compensation is related to the earnings performance of the Group or of the respective business units. The retirement age for the CEO is 65. In addition to statutory pension benefits, Indutrade is to pay pension premiums correspond-ing to 35% of his base salary, but not more than the amount that is tax deductible for the Company. The CEO is entitled to choose his pension solution, within the said cost framework and subject to the approval of the Chairman. Other senior executives are entitled to pension benefits corresponding to an average of 29% of their base salaries. The retirement age is 65. Earned pension benefits are not conditional upon future employment by Indutrade.
Terms of noticeIn the event of the Company serves notice, the CEO is entitled to a 24-month term of notice with retained employment benefits. In the event the CEO gives notice, a six month term of notice applies. For other senior executives, a notice period of 6–24 months applies for notice served by the respective companies, depending on the employee’s age. Salary paid out during the notice period is not deducted from other income.

54 Indutrade Annual Report 2009 Indutrade Annual Report 2008 55
NOTES
Incentive programmeIndutrade’s board of directors, in co-operation with AB Industrivärden, has established an incentive programme directed at senior executives of Indutrade. The aim of the programme is to encourage management’s long-term commit-ment and participation in the Company. The term of the programme extends until 30 June 2010. A total of 30 senior executives – including the Executive Manage-ment and a number of subsidiary presidents – have acquired a combined total of 169,900 shares at market price and 284,800 stock options, issued by AB Indus-trivärden. Indutrade pays 40% of the invested amount to the executives partici-pating in the programme. The total cost for the Company will amount to approxi-mately SEK 7 million, of which SEK 1.2 million was charged against 2009 earnings.
The Board’s proposed principles for compensation and other terms of employment for Company management to be presented to the 2010 Annual General Meeting By Company management is meant in this context the President and CEO, the Chief Financial Officer, business area presidents and the Group Controller. Com-pensation of Company management shall normally consist of a fixed and variable salary component. The variable component shall reward clear, target-related improvements in simple and transparent structures and shall have a cap. The base salary for members of Company management shall be in line with the going rate in the market and be commensurate with the executive’s competence, responsibility and performance. The variable salary component for members of Company management shall normally not exceed 7 months’ salary and shall be related to the achievement of improvements in the Company’s and respective business area’s earnings and the Group’s growth. Variable compensation for members of Company management can amount to a maximum of approximately SEK 5 million, based on 2010 salary levels. Incentive programmes in the Company shall mainly be share price–related and cover persons in senior positions in the Company who have a significant influence on the Company’s earnings and growth, and shall be conditional upon the achievement of set targets. An incentive pro-gramme shall ensure a long-term commitment to the Company’s development and be implemented at market terms. The non-monetary benefits payable to members of Company management shall facilitate them in the execution of their duties and correspond to what can be considered reasonable in relation to prac-tice in the market in which the respective executive is active.
The pension terms for members of Company management shall be in line with the going rate for peer executives in the market in which the respective execu-tives work and should be based on defined contribution pension solutions or cor-respond to a general pension plan (in Sweden, the ITP plan). Severance pay for a member of Company management shall not exceed a combined total of 24 months in the event the Company serves notice and 6 months in the event a member of Company management gives notice. The Board’s remuneration committee han-dles and conducts drafting work on compensation matters pertaining to Company management for decisions by the Board. The Remuneration Committee thus pre-pares and drafts proposals for decisions regarding the terms of employment for the CEO, and the Board evaluates the CEO’s performance annually. The CEO con-sults with the Remuneration Committee on the terms of employment for other members of Company management. The Board shall have the right to depart from the above-described principles for compensation of Company management in individual cases if there are special reasons.
COMPENSATION AND OTHER BENEFITS, 2009
SEK 000s Bas
e sa
lary
/di
rect
ors’
fees
Vari
able
co
mpe
nsat
ion1)
Oth
er b
enefi
ts
Pen
sion
cos
t
Tota
l
Bengt Kjell, Chairman of the Board 400 — — — 400
Eva Färnstrand, Director 200 — — — 200
Michael Bertorp, Director, Audit Com-mittee chair 225 — — — 225
Owe Anderssson, Director 200 — — — 200
Ulf Lundahl, Director 200 — — — 200
Gerald Engström, Director 200 — — — 200
Johnny Alvarsson, President and CEO 3,660 188 103 1,329 5,280
Other senior executives (5 persons) 7,741 1,170 475 2,289 11,675
total 12,826 1,358 578 3,618 18,380
COMPENSATION AND OTHER BENEFITS, 2008
SEK 000s Bas
e sa
lary
/di
rect
ors’
fees
Vari
able
co
mpe
nsat
ion)
Oth
er b
enefi
ts
Pen
sion
cos
t
Tota
l
Bengt Kjell, Chairman of the Board 400 — — — 400
Eva Färnstrand, Director 200 — — — 200
Michael Bertorp, Director, Audit Com-mittee chair 225 — — — 225
Owe Anderssson, Director 200 — — — 200
Mats Jansson, Director 200 — — — 200
Ulf Lundahl, Director 200 — — — 200
Gerald Engström, Director 200 — — — 200
Johnny Alvarsson, President and CEO 3,391 2,233 106 1,196 6,926
Other senior executives (5 persons) 7,330 2,977 461 2,573 13,341
total 12,346 5,210 567 3,769 21,892
1) Incl. compensation for senior executives participating in the incentive programme described above.
NotE 7 depreciAtion And AmortisAtiondepreciation of property, plant and equipment and amortisation of intangible non-current assets are included in the following functions in the amounts of:
GROUP PARENT COMPANy
2009 2008 2009 2008
Cost of goods sold 99 84 — —
Development costs 4 1 — —
Selling costs 40 41 — —
Administrative expenses 15 12 0 0
158 138 0 0
NotE 8 operAting leAses
GROUP PARENT COMPANy
2009 2008 2009 2008
leasing payments expensed during the year: 132
92 7
7
Future contracted leasing payments
Maturity year 1 112 103 4 4
Maturity year 2 67 67 4 4
Maturity year 3 46 40 2 4
Maturity year 4 22 25 — 2
Maturity year 5 16 12 — 0
Maturity year 6- 41 33 — —
total future leasing payments 304 280 10 14
Operating leases in the Parent Company and Group pertain primarily to premises.
NotE 9 FinAnciAl income
GROUP PARENT COMPANy
2009 2008 2009 2008
Interest 7 10 18 30
Other 1 2 2 2
8 12 20 32
of which, pertaining to group companies:
Interest — — 18 29
Note 6, continued

54 Indutrade Annual Report 2009 Indutrade Annual Report 2008 55
NOTES
NotE 10 FinAnciAl expenses
GROUP PARENT COMPANy
2009 2008 2009 2008
Interest expenses, bank loans –48 –57 –35 –48
Interest expenses, pension liability –7 –5 — —
Interest expenses, finance leases –2 –3 0 0
Interest expenses, earn-out payments –13 –9 –11 –6
total interest expenses –70 –74 –46 –54
Exchange rate differences 0 –6 0 0
Other –2 0 –2 0
total financial expenses –72 –80 –48 –54
of which, pertaining to group companies in the indutrade groupinterest
Interest 0 0
NotE 11proFit From pArticipAtions in group compAnies
PARENT COMPANy
2009 2008
Dividends from subsidiaries 198 161
Group contributions 190 292
Write-down of investments in subsidiaries –10 —
378 453
NotE 12 tAxes
GROUP PARENT COMPANy
2009 2008 2009 2008
tax expense
Current tax –140 –193 –43 –63
Deferred tax 20 11 3 1
–120 –182 –40 –62 The Group’s tax expense amounted to 26.0% (26.3%) of consolidated pre-tax profit. The difference between the reported tax expense and anticipated tax expense is explained below.
GROUP PARENT COMPANy
2009 2008 2009 2008
Profit before tax 461 692 329 377
Weighted average tax based on national tax rates (Group 25.6% and 27.0%, respectively, and Parent Company 26.3% and 28.0%, respectively) –118 –187 –87 –106
tax effect of:
Non-deductible interest expense on earn-out payments discounted to present value –3 –2 –2 –3
Other non-deductible other expenses/non-taxable income –4 4 49 47
Utilisation of tax-loss carryforward where tax was not previously reported 3 — — —
Adjustment of previous years’ current tax 1 — — —
Change in tax rate 1 3 — 0
–120 –182 –40 –62
26,0% 26,3% 12,2% 16,4%
Deferred tax assets in temporary differences whose value has not been estimated amount to SEK 0 million (0).
GROUP PARENT COMPANy
Deferred tax liability 2009 2008 2009 2008
Intangible assets –95 –114 — —
Land and buildings –14 –13 — —
Fixtures and equipment –12 –10 — —
Current assets 4 5 0 —
Untaxed reserves –2 –5 — —
Pension obligations 11 16 — —
Accrued income and prepaid expenses 5 3 3 1
Tax-loss carryforward 3 3 — —
–100 –115 3 1
of which, deferred tax asset 28 31 3 1
of which, deferred tax liability –128 –146 — — In applying IFRS, Indutrade has exercised its option to offset the total effect of actuarial gains and losses related to pensions directly against equity in consider-ation of deferred tax. At the end of the financial year, the deferred tax asset for this was SEK 7 million (10).
GROUP PARENT COMPANy
2009 2008 2009 2008
Deferred tax liability, 1 January –115 –83 1 0
Deferred tax asset attributable to actuarial gains/losses –3 0 — —
Deferred tax liability attributable to acquisitions –4 –39 — —
Deferred tax liability in income state-ment 20 8 2 1
Deferred tax liability attributable to revaluation of company acquisitions 0 3 — —
Deferred tax liability attributable to revaluation of company aquisitions. — 0 — —
Exchange rate differences 2 –4 — —
deferred tax liability, 31 december –100 –115 — —
deferred tax asset, 31 december — — 3 1
NotE 13 Auditors’ Fees
GROUP PARENT COMPANy
2009 2008 2009 2008
Auditing fees
Öhrlings PricewaterhouseCoopers 9 8 1 1
KPMG Bohlins 1 1 — —
Other auditing firms 1 0 — —
total auditing fees 11 9 1 1
Fees for other assignments
Öhrlings PricewaterhouseCoopers 3 2 — 1
KPMG Bohlins 1 1 1 —
Other auditing firms 0 0 — —
total fees for other assignments 4 3 1 1
total 15 12 2 2
Auditing assignments pertain to review of the annual report and bookkeeping as well as of the Board’s and President’s administration, other work duties that are incumbent upon a company auditor, and consulting or other assistance stemming from observations in connection with such review or implementation of other duties. Everything else constitutes other assignments.

56 Indutrade Annual Report 2009 Indutrade Annual Report 2009 57
Notes
NotE 14 IntangIble assets
GRoup
Goo
dwill
Age
ncie
s, tr
ade-
mar
ks, c
usto
mer
lis
ts, l
icen
ces,
etc
.
oth
er in
tang
ible
as
sets
tota
l int
angi
ble
asse
ts
as per 1 January 2008
Cost 380 470 8 858
Accumulated amortisation and impairment charges —2 –109 –5 –116
book value 378 361 3 742
1 January–31 December 2008
opening book value 378 361 3 742
exchange rate differences 22 16 0 38
Investments during the year — 18 1 19
Company acquisitions 174 258 3 435
sales and disposals — 0 — 0
Revaluation of company acquisitions — –1 — –1
Amortisation (Note 7) — –59 –1 –60
Closing book value 574 593 6 1,173
as per 31 December 2008
Cost 576 778 14 1368
Accumulated amortisation and impairment charges –2 –185 –8 –195
book value 574 593 6 1,173
1 January–31 December 2009
opening book value 574 593 6 1,173
exchange rate differences –9 –7 0 –16
Investments during the year — 11 4 15
Company acquisitions 19 19 0 38
sales and disposals — 0 — 0
Revaluation of company acquisitions –70 –2 — –72
Amortisation (Note 7) — –67 –2 –69
Closing book value 514 547 8 1,069
as per 31 December 2009
Cost 516 797 18 1,331
Accumulated amortisation and impairment charges –2 –250 –10 –262
book value 514 547 8 1,069
In connection with the acquisition of Flintec Group AB, the Flintec brand was identified as an intangible asset with an indefinite useful life. the brand is valued at seK 113 million, and no amortisation has been made of this item. the brand is included above in the 2008 figure for Company acquisitions during the year.
As a result of a revaluation of future earn-out payments, an adjustment has been made of the items Goodwill and Agencies, trademarks, customer relation-ships, licences, etc., in the value of seK 72 million, of which seK 59 million is attributable to the acquisition of Flintec. see also Note 24.
a summary of the breakdown of goodwill at the segment level is as follows:
2009 2008
engineering & equipment 117 123
Flow technology 110
Industrial Components 38 39
special products 249 302
Indutrade group 514 574
pAReNt CompANy
2009 2008
opening cost 1 —
Investments during the year 1 1
Closing accumulated cost 2 1
opening amortisation — —
Amortisation for the year 0 —
Closing accumulated amortisation 0 —
Planned residual value 2 1
NotE 15 ProPerty, Plant anD equIPment
GRoup
Land
and
bui
ld-
ings
mac
hine
ry
Fixt
ures
and
eq
uipm
ent
Con
stru
ctio
n in
pr
ogre
ss
tota
l pro
pert
y,
plan
t and
eq
uipm
ent
as per 1 January 2008
Cost 310 188 392 7 897
Accumulated depreciation and impairment charges –114 –125 –270 — –509
book value 196 63 122 7 388
1 January–31 December 2008
opening book value 196 63 122 7 388
exchange rate differences 13 7 6 1 27
Investments during the year1) 6 30 72 19 127
Company acquisitions 41 53 9 3 106
transferred from construction in progress 9 6 — –15 —
sales and disposals — –1 –15 — –16
Depreciation (Note 7) –11 –23 –44 — –78
Closing book value 254 135 150 15 554
as per 31 December 2008
Cost 391 329 482 15 1,217
Accumulated depreciation and impairment charges –137 –194 –332 — –663
book value 254 135 150 15 554
1 January–31 December 2009
opening book value 254 135 150 15 554
exchange rate differences –5 –4 –3 0 –12
Investments during the year1) 6 22 52 10 90
Company acquisitions 27 2 3 3 35
transferred from construction in progress 5 7 — –12 —
sales and disposals — 0 –15 — –15
Depreciation (Note 7) –14 –29 –46 — –89
Closing book value 273 133 141 16 563
as per 31 December 2009
Cost 421 347 483 16 1,267
Accumulated depreciation and impairment charges –148 –214 –342 — –704
book value 273 133 141 16 563
1) of net investments in property, plant and equipment, seK 75 million (111) had an effect on cash flow, while seK 0 million (0) are investments financed through finance leases.
Not 14 ImmaterIella tIllgångar
Not 15materIella anläggnIngstIllgångar

56 Indutrade Annual Report 2009 Indutrade Annual Report 2009 57
Notes
the item Fixtures and equipment includes leased assets held by the group under finance leases in the following amounts:
2009 2008
Cost – capitalised finance leases 71 70
Accumulated depreciation –23 –20
book value 48 50 the tax assessment value of swedish property was seK 119 million (120), of which seK 95 million (95) pertains to buildings and seK 24 million (25) land. the corre-sponding book value of swedish property was seK 104 million (111).
pAReNt CompANy
2009 2008
opening cost 6 6
Investments during the year — 0
sales and disposals — —
Closing accumulated cost 6 6
opening depreciation –4 –4
Depreciation for the year 0 0
sales and disposals — —
Closing accumulated depreciation –4 –4
Planned residual value 2 2
NotE 16 shares anD PartICIPatIons
the pAReNt CompANy’s DIReCt hoLDINGs oF shARes AND pARtICIpAtIoNs IN suBsIDIARIes
Company name/reg. no. Domicile share NumberBook value
Gustaf Fagerberg holding AB, 556040-9087 Gothenburg 100% 100,000 17
Bengtssons maskin AB, 556037-8670 Arlöv 100% 2,000 16
C&m plast AB, 556554-3856 malmö 100% 1,000 0
GeFA processtechnik Gmbh, Germany Dortmund 100% — 25
Colly Company AB, 556193-8472 stockholm 100% 30,000 31
etp transmission AB, 556158-5398 Linköping 100% 20,000 26
AB Novum, 556296-6126 helsingborg 100% 5,000 9
Indutrade A/s, Denmark Glostrup 100% 167,443 45
Indutrade Benelux B.V., Netherlands uithoorn 100% 3,502 33
Indutrade Flödesteknik AB, 556364-7469 stockholm 100% 1,000 210
Indutrade oy, Finland helsinki 100% 42,000 48
Ingenjörsfirman GA Lindberg AB, 556606-8747 stockholm 100% 1,000 8
saniflex AB, 556441-5882 stockholm 100% 2,500 2
pentronic AB, 556042-5141 Västervik 100% 30,000 17
Carlsson & möller AB, 556057-0011 helsingborg 100% 1,800 12
eie maskin AB, 556029-6336 stockholm 100% 30,000 24
Robota AB, 556042-4912 täby 100% 1,000 13
Gedevelop AB, 556291-8945 helsingborg 100% 9,868 27
spinova AB, 556188-7430 torsås 100% 20,000 70
tribotec AB, 556234-6089 mölnlycke 100% 4,000 33
Damalini AB, 556474-3705 mölndal 100% 1,000,000 51
palmstiernas svenska AB, 556650-7314 Karlstad 100% 100 4
International plastic systems Ltd, uK Newcastle 100% 10,000 112
Carrab Industri AB, 556092-1214 mönsterås 100% 10,000 19
Aluflex system AB, 556367-4067 helsingborg 100% 20,000 41
precision products Ltd, uK Chesterfield 100% 157,500 53
essmed AB, 556545-2215 härryda 100% 1,000 45
Flintec Group AB, 556736-7098 Västerås 100% 100,000 327
Kabetex Kullager & transmission AB, 556254-1523 mark 100% 2,500 11
total 1 329
the group’s holdings of shares and participations in other companies
Domicile
share of capital, %
share of votes, % Number
Book value
A s Fors mW tallinn, estonia 11 11 14,324 3
honkakoli oy Finland — — 18 1
Kytäjän Golf oy Finland — — 6 1
other — — — 2
available-for-sale financial assets 7
shares and participations
GRoup pAReNt CompANy
2009 2008 2009 2008
opening cost 8 7 1,926 1,388
external acquisitions — 0 — 491
shareholder contribution — — 4 48
sales — 0 — —
Adjustment of estimated earn-out payments — — –59 –1
Company acquisitions — 1 — —
exchange rate differences –1 0 1 —
Closing accumulated cost 7 8 1,872 1,926
opening revaluations — — 8 8
Closing accumulated revaluations — — 8 8
opening impairment charges — — –541 –541
Impairment charges during the year — — –10 —
Closing accumulated impairment charges — — –551 –541
book value 7 8 1,329 1,393
effect on cash flow
purchase price, external acquisitions — –491
purchase price not paid — 247
purchase price paid from previous years –48 —
earn-out payments made –87 –4
–135 –248
NotE 17 non-Current reCeIvables
GRoup pAReNt CompANy
2009 2008 2009 2008
opening balance 13 7 120 104
Additional receivables 0 1 — —
Repaid deposits/Amortisation 0 –1 –120 —
Company acquisitions 0 6 — —
exchange rate differences 0 0 — 16
13 13 — 120
the Group’s non-current receivables pertain primarily to endowment insurance policies and deposits. the book value is judged to correspond to fair value. the maturity dates for the endowment insurance policies is dependent on the date of retirement for the persons insured. the parent Company’s non-current receiva-bles pertain exclusively to receivables on long-term loans to subsidiaries.

58 Indutrade Annual Report 2009 Indutrade Annual Report 2009 59
Notes
NotE 18 InventorIes
GRoup
Inventories are broken down into the following items: 2009 2008
Raw materials and consumables 175 190
products in process 78 103
Finished products and goods for resale 811 914
total 1,064 1,207
At year-end 2009, total accumulated impairment amounted to seK 85 million (93).
NotE 19 traDe aCCounts reCeIvableage breakdown of trade accounts receivable and provisions for impaired trade accounts receivable
GRoup
trade accounts receivable 2009 2008
trade accounts receivable not due 655 860
trade accounts receivable past-due 0–3 months 202 223
trade accounts receivable past-due more than 3 months 61 34
total 918 1,117
provision for impaired trade accounts receivable 2009 2008
provision for trade accounts receivable, less than 3 months past-due –2 –3
provision for trade accounts receivable, 3–6 months past-due –3 –4
provision for trade accounts receivable, more than 6 months past-due –12 –8
total –17 –15
Change in the provision for impaired trade accounts receivable during the year
GRoup 2009 2008
opening provision –15 –9
Receivables written off as customer losses 3 2
Reversed, unutilised provisions 3 2
provision for the year for impaired trade accounts receivable –8 –7
Company acquisitions – –2
exchange rate differences 0 –1
Closing reserve –17 –15
For a description of risks associated with the Company’s trade accounts receiva-ble, see Note 2.
NotE 20PrePaID exPenses anD aCCrueD InCome
GRoup pAReNt CompANy
2009 2008 2009 2008
prepaid rents 10 14 — 1
prepaid leases 1 1 — —
prepaid service and maintenance charges 10 5 — 0
prepaid insurance premiums 7 4 1 1
prepaid marketing costs 0 1 — —
Accrued income 1 1 — —
prepaid pension premiums 0 1 — —
Derivative instruments — — 1 —
other items 20 18 — —
total 49 45 2 2
NotE 21 Change In equIty
pAReNt CompANy
share capital1)
Reserv-fond
Fritt eget kapital
summa eget
kapital
equity at 1 January 2008 40 5 698 743
Dividend payout — — –210 –210
Net profit for the year — — 315 315
equity at 31 December 2008 40 5 803 848
Dividend payout — — –256 –256
Net profit for the year — — 289 289
equity at 31 December 2009 40 5 836 881
1) on 31 December 2008 and 2009, the share capital consisted of 40,000,000 shares with a share quota value of seK 1.
At the Annual General meeting on 24 may 2010, a dividend for the 2009 financial year of seK 4.30 per share, totalling seK 172 million, will be proposed. the pro-posed dividend has not been reported as a liability in these financial statements.
NotE 22 borrowIngs
GRoup pAReNt CompANy
2009 2008 2009 2008
long-term borrowings
Future leasing obligations for finance leases 26 30 — —
seK-denominated loans with terms longer than 1 year 319 219 305 205
euR-denominated loans with terms longer than 1 year 296 298 115 290
Loans in other currencies with terms longer than 1 year 31 21 — —
672 568 420 495
short-term borrowings
utilised bank overdraft facilities 99 162 60 110
Future leasing obligations for finance leases 22 20 — —
seK-denominated loans with terms shorter than 1 year 155 60 155 60
euR-denominated loans with terms shorter than 1 year 92 238 73 224
Loans in other currencies with terms shorter than 1 year 7 10 — —
375 490 288 394
total borrowings 1,047 1,058 708 889
Car leases are reported as finance leases in accordance with IFRs, entailing an increase in both assets and liabilities of seK 48 million. of the Group’s long-term leasing obligations, seK 15 million fall due for payment in 2011 and seK 11 million in 2012.
externally granted bank overdraft facilities amounted to seK 510 million (624) for the Group and seK 257 million (457) for the parent Company.
GRoup pAReNt CompANy
maturity dates for long-term loans in euR: 2009 2008 2009 2008
Amounts in euR million
maturity 2010 — 7.0 — 7.0
maturity 2011 6.5 20.0 — 19.5
maturity 2012 10.3 — — —
maturity 2013 — — — —
maturity 2014 11.8 — 11.0 —
total long-term borrowings in eur million 28.6 27.0 11.0 26.5
Corresponding amounts in seK million 296 298 115 290

58 Indutrade Annual Report 2009 Indutrade Annual Report 2009 59
Notes
All long-term loans in euR carry variable rates of interest. the carrying amount corresponds to fair value.
GRoup pAReNt CompANy
maturity dates for long-term loans in seK: 2009 2008 2009 2008
Amounts in seK million
maturity 2010 — 74 — 60
maturity 2011 224 50 210 50
maturity 2012 35 35 35 35
maturity 2013 60 60 60 60
total long-term borrowings in seK million 319 219 305 205
All seK-denominated loans carry a variable interest rate. the carrying amount corresponds to fair value.
LoANs IN otheR CuRReNCIes GRoup
maturity dates for long-terms loans 2009 2008
Amounts in seK million
maturity 2010 — 11
maturity 2011 6 6
maturity 2012 5 1
maturity 2013 5 3
maturity 2014 and thereafter 15 —
total long-term borrowings in seK mil-lion 31 21
By other currencies is meant usD, GBp, KRW and LKR. All loans carry variable interest rates.
GRoup 2009 2008 2007 2006 2005
Assumptions in calculating pension obligations sweden
Nether-lands sweden
Nether-lands sweden
Nether-lands sweden
Nether-lands sweden
Nether-lands
Discount rate, % 3.80 5.65 3.00 6.40 4.30 5.50 3.90 4.50 3.90 4.25
Anticipated return on plan assets, % — 5.65 — 6.40 — 5.50 — 4.50 — 5.00
Future salary increases, % 3.50 2.50 3.50 2.50 3.50 2.50 3.00 2.50 3.00 2.00
Anticipated inflation, % 2.00 2.00 2.00 2.00 2.00 2.00 1.80 1.80 1.80 2.00
Future pension increases, % 2.00 2.00 2.00 1.80 2.00 1.80 1.80 2.00 1.80 2.00
employee turnover, % 2.00Age
dependent 2.00Age
dependent 2.00Age
dependent 0Age
dependent 0Age
dependent
In accordance with IAs 19 employee Benefits, an actuary has, under assignment by Indutrade, computed the Group’s pension liability and the provisions to be made on a regular basis for pensions for the Group’s employees. the pension plans in the Indutrade Group are both defined benefit and defined contribution plans.
Defined benefit plansthe Group’s defined benefit pension plans include retirement pension, disability pension and family pension. Apart from the pRI plan in sweden, the Group has defined benefit plans in the Netherlands. the liability is broken down as follows:
Breakdown of liability in seK million
pRI plan 96
Defined benefit plans, Netherlands 14
total defined benefit plans 110
other pension obligations 12
total 122
the Group’s plan assets, totalling seK 199 million, consist of investments with insurance companies, mainly in bonds. the pension obligation is vested.
Defined contribution plansthe Group’s defined contribution pension plans include retirement pension, disa-bility pension and family pension. premiums are paid on a regular basis during the year to independent legal entities. the size of the pension premiums is based on the individual’s salary, and the cost of the premium is reported on a continuing basis in the income statement. According to a statement from the emerging Issues task Force of the swedish Financial Accounting standards Council, retire-ment pension and family pension obligations secured through insurance with Alecta for salaried employees in sweden are classified as multi-employer defined benefit plans. In 2009 Indutrade did not have access to such information that would make it possible to report this plan as a defined benefit plan, which is why the plan is reported as a defined contribution plan. premiums paid during the year for pension plans with Alecta amounted to approximately seK 14 million. Alecta’s collective funding ratio was 124% as per December 2009.
Actuarial gains and losses, including payroll taxes in sweden, are reported directly against equity.
assumptions used in actuarial calculationsthe discount rate is based on the market return of high-grade corporate bonds.
the anticipated return on plan assets is a weighted average of the anticipated return from the respective asset classes.
NotE 23 PensIon oblIgatIons
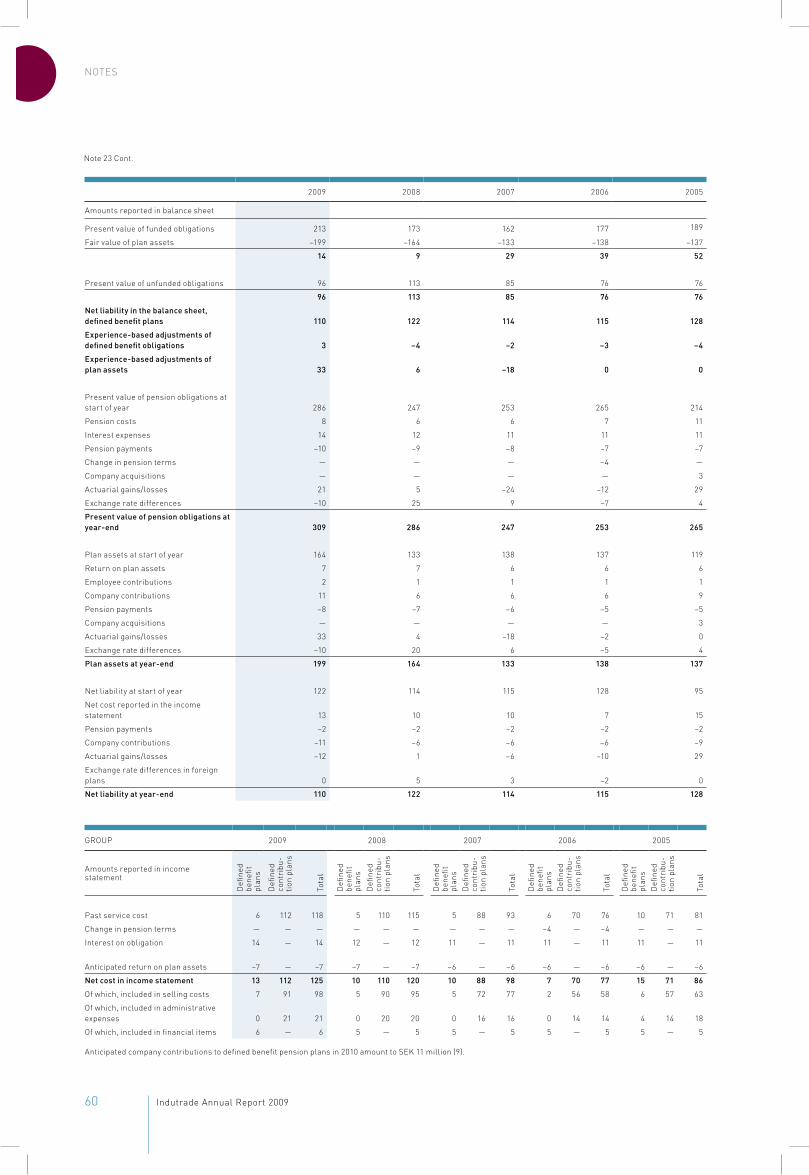
60 Indutrade Annual Report 2009 Indutrade Annual Report 2009 61
Notes
2009 2008 2007 2006 2005
Amounts reported in balance sheet
present value of funded obligations 213 173 162 177 189
Fair value of plan assets –199 –164 –133 –138 –137
14 9 29 39 52
present value of unfunded obligations 96 113 85 76 76
96 113 85 76 76
net liability in the balance sheet, defined benefit plans 110 122
114
115 128
experience-based adjustments of defined benefit obligations 3 –4 –2 –3 –4
experience-based adjustments of plan assets 33 6 –18 0 0
present value of pension obligations at start of year 286 247 253 265 214
pension costs 8 6 6 7 11
Interest expenses 14 12 11 11 11
pension payments –10 –9 –8 –7 –7
Change in pension terms — — — –4 —
Company acquisitions — — — — 3
Actuarial gains/losses 21 5 –24 –12 29
exchange rate differences –10 25 9 –7 4
Present value of pension obligations at year-end 309
286
247
253 265
plan assets at start of year 164 133 138 137 119
Return on plan assets 7 7 6 6 6
employee contributions 2 1 1 1 1
Company contributions 11 6 6 6 9
pension payments –8 –7 –6 –5 –5
Company acquisitions — — — — 3
Actuarial gains/losses 33 4 –18 –2 0
exchange rate differences –10 20 6 –5 4
Plan assets at year-end 199 164 133 138 137
Net liability at start of year 122 114 115 128 95
Net cost reported in the income statement 13 10 10 7 15
pension payments –2 –2 –2 –2 –2
Company contributions –11 –6 –6 –6 –9
Actuarial gains/losses –12 1 –6 –10 29
exchange rate differences in foreign plans 0 5 3 –2 0
net liability at year-end 110 122 114 115 128
GRoup 2009 2008 2007 2006 2005
Amounts reported in income statement
Defi
ned
bene
fit
plan
s
Defi
ned
cont
ribu
-tio
n pl
ans
tota
l
Defi
ned
bene
fit
plan
sD
efine
d co
ntri
bu-
tion
plan
s
tota
l
Defi
ned
bene
fit
plan
sD
efine
d co
ntri
bu-
tion
plan
s
tota
l
Defi
ned
bene
fit
plan
sD
efine
d co
ntri
bu-
tion
plan
s
tota
l
Defi
ned
bene
fit
plan
sD
efine
d co
ntri
bu-
tion
plan
s
tota
l
past service cost 6 112 118
5
110
115
5
88
93
6
70
76 10 71 81
Change in pension terms — — — — — — — — — –4 — –4 — — —
Interest on obligation 14 — 14 12 — 12 11 — 11 11 — 11 11 — 11
Anticipated return on plan assets –7 — –7 –7 — –7 –6 — –6 –6 — –6 –6 — –6
net cost in income statement 13 112 125 10 110 120 10 88 98 7 70 77 15 71 86
of which, included in selling costs 7 91 98 5 90 95 5 72 77 2 56 58 6 57 63
of which, included in administrative expenses 0 21 21 0 20 20 0 16 16 0 14 14 4 14 18
of which, included in financial items 6 — 6 5 — 5 5 — 5 5 — 5 5 — 5
Anticipated company contributions to defined benefit pension plans in 2010 amount to seK 11 million (9).
Note 23 Cont.

60 Indutrade Annual Report 2009 Indutrade Annual Report 2009 61
Notes
NotE 24 other ProvIsIons
GRoup pAReNt CompANy
2009 2008 2009 2008
Guarantee commitments 2 2 — —
earn-out payments 92 225 83 199
total long-term provisions 94 227 83 199
earn-out payments payable within 1 year 87 132 68 87
total provisions 181 359 151 286
Guaran-tee com-
mitmentsearn-out
payments
Guaran-tee com-
mitmentsearn-out
payments
opening balance, 1 January 2009 2 357 — 286
earn-out payments for new acquisitions — 11 — —
earn-out payments made — –130 — –87
earn-out payments reversed — –72 — –59
effect of present value adjustment — 13 — 11
exchange rate difference — 0 — 0
Closing balance, 31 December 2009 2 179 — 151
provisions for earn-out payments in 2009 pertained to the acquisitions of Ingengörsfirman Rossing & Jansson AB, Key Valves technologies Ltd and the Auto-mation products business. If they result in payment, this will take place in 2010–2013.
earn-out payments for company acquisitions are based on future profits of the acquired companies. A revaluation has been conducted in connection with the 2009 book-closing, which is based on 2009 profits and where it is suitable for future, anticipated profits. of the revaluation, totalling seK -72 million, seK 59 million pertains to the Flintec acquisition. the value of intangible assets has been written down by the same amount.
NotE 25aCCrueD exPenses anD DeFerreD InCome
GRoup pAReNt CompANy
2009 2008 2009 2008
Accrued personnel-related expenses 182 213 4 6
Derivative expenses 1 2 1 5
other 72 87 1 1
total 255 302 6 12
NotE 26 aCquIsItIons/sales oF subsIDIarIes
aCquIsItIons 2009During the year, all of the shares were acquired in four companies: Rossing & Jansson AB (sweden), Flintec Brasil Ltda (Brazil), Key Valves technologies Ltd (Korea), and Dominator pump AB (sweden). In addition, two businesses were acquired: the Automation products business from B Begner AB, and the optics products business from sefo Consulting.
Flow technologyRossing & Jansson, with annual sales of approximately seK 20 million, is a sup-plier of complete system solutions, standalone products and services in the areas of automation and control technology for energy production, industry and ship-ping. the company is included in the Group as from 1 september 2009.
Industrial ComponentsDominator, with annual sales of approximately seK 12 million, distributes pneu-matic membrane pumps in the Nordic countries and is a market leader in swe-den. Customers are in the food, pharmaceutical, engineering and chemical industries. the company is included in the Group as from 1 December 2009.
the Automation products business, which covers components and sub-sys-tems for automation of industrial manufacturing processes, with annual sales of approximately seK 20 million, is included in the Group as from 1 october 2009. the optics products business, with annual sales of approximately seK 6 million,
is included in the Group as from october 2009. the business covers instruments, products and service for optometrists, ophthalmologists and eye clinics.
special ProductsFlintec Brasil Ltda, a former distributor of Flintec’s products in Brazil, was acquired in september. Annual sales amount to approximately seK 4 million.
Key Valves technologies Ltd, in south Korea, is a leading player in research, development and manufacturing of high pressure valves. the company’s prod-ucts are used for control of pressure and flows in severe duty applications in power generation and in the petrochemical industry. Annual sales amount to approximately seK 150 million. the company is included in the Group as from 1 November 2009.
effects of acquisitions made in 2009 and 2008
mKR Net sALes eBItA
Business area effect of acquisitions Jan–Dec Jan–Dec
engineering & equipment
KG enterprise oy 0 0
Flow technology Ingenjörsfirman Rossing & Jansson AB
6 1
Industrial Components
essmed AB, Kabetex Kullager & transmission AB, Brinch As och Dominator pump AB
35 0
special products Douwes International BV, preci-sion products Ltd., Flintec Group AB, Inkal Industrikalibreringar AB, Flintec Brasil Ltda och Key Valves technologies Ltd.
134 10
effect on group
175 11
Acquisitions completed 2008 162 9
Acquisitions completed 2009 13 2
effect on group 175 11
If the acquired units had been consolidated as from 1 January 2009, net sales for the full year would have amounted to seK 6,409 million, and eBItA would have been seK 610 million.
Acquired assets in Ingenjörsfirman Rossing & Jansson AB, Flintec Brasil Ltda, Key Valves technologies Ltd and Dominator Pump AB, and in the Automation Products and optics Products businesses.
Preliminary purchase price allocationseK million
Purchase price including earn-out payment 78
Acquired assetsBook value
Fair value adjust-
mentFair
value
Goodwill — 19 19
Agencies, trademarks, customer lists, licences, etc. — 19 19
property, plant and equipment 35 — 35
Financial assets — — —
Inventories 36 — 36
other current assets 22 — 22
Cash and cash equivalents 11 — 11
Deferred tax liability –2 –2 –4
Borrowings and pension obligations –24 — –24
other operating liabilities –36 — –36
42 36 78
since disclosures about the individual acquisitions, with the exception of Flintec, are insignificant, they are provided here in aggregate form. the cost of customer lists and agencies has been valued at one year’s contribution margin and has been recorded in the balance sheet as agencies, trademarks, customer lists, licences, etc., and is amortised over a period of ten years. Goodwill is justified by the good profitability of the companies.
effect on cash flow
purchase price including earn-out payment 78
purchase price not paid out –11
Cash and cash equivalents in acquired companies –11
earn-out payments pertaining to previous years' acquisitions 132
total effect on cash flow 188
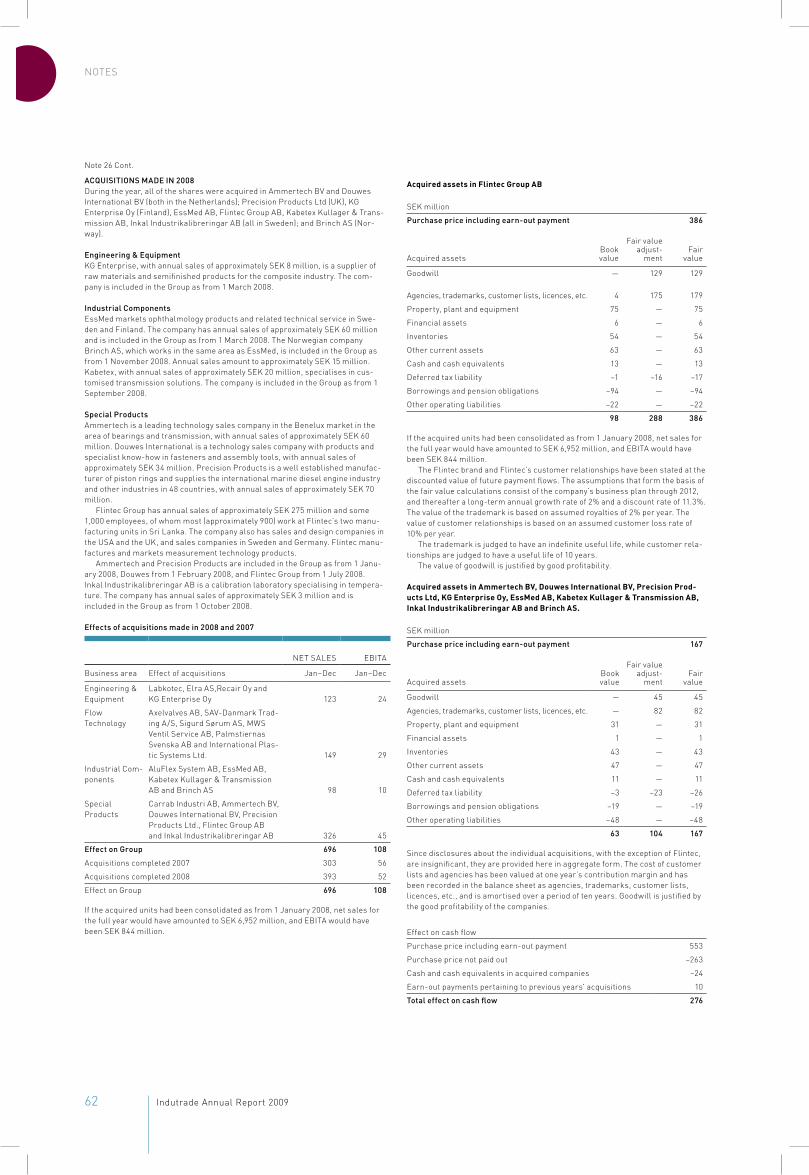
62 Indutrade Annual Report 2009 Indutrade Annual Report 2009 63
Notes
aCquIsItIons maDe In 2008During the year, all of the shares were acquired in Ammertech BV and Douwes International BV (both in the Netherlands); precision products Ltd (uK), KG enterprise oy (Finland), essmed AB, Flintec Group AB, Kabetex Kullager & trans-mission AB, Inkal Industrikalibreringar AB (all in sweden); and Brinch As (Nor-way).
engineering & equipmentKG enterprise, with annual sales of approximately seK 8 million, is a supplier of raw materials and semifinished products for the composite industry. the com-pany is included in the Group as from 1 march 2008.
Industrial Componentsessmed markets ophthalmology products and related technical service in swe-den and Finland. the company has annual sales of approximately seK 60 million and is included in the Group as from 1 march 2008. the Norwegian company Brinch As, which works in the same area as essmed, is included in the Group as from 1 November 2008. Annual sales amount to approximately seK 15 million. Kabetex, with annual sales of approximately seK 20 million, specialises in cus-tomised transmission solutions. the company is included in the Group as from 1 september 2008.
special ProductsAmmertech is a leading technology sales company in the Benelux market in the area of bearings and transmission, with annual sales of approximately seK 60 million. Douwes International is a technology sales company with products and specialist know-how in fasteners and assembly tools, with annual sales of approximately seK 34 million. precision products is a well established manufac-turer of piston rings and supplies the international marine diesel engine industry and other industries in 48 countries, with annual sales of approximately seK 70 million.
Flintec Group has annual sales of approximately seK 275 million and some 1,000 employees, of whom most (approximately 900) work at Flintec’s two manu-facturing units in sri Lanka. the company also has sales and design companies in the usA and the uK, and sales companies in sweden and Germany. Flintec manu-factures and markets measurement technology products.
Ammertech and precision products are included in the Group as from 1 Janu-ary 2008, Douwes from 1 February 2008, and Flintec Group from 1 July 2008. Inkal Industrikalibreringar AB is a calibration laboratory specialising in tempera-ture. the company has annual sales of approximately seK 3 million and is included in the Group as from 1 october 2008.
effects of acquisitions made in 2008 and 2007
Net sALes eBItA
Business area effect of acquisitions Jan–Dec Jan–Dec
engineering & equipment
Labkotec, elra As,Recair oy and KG enterprise oy 123 24
Flow technology
Axelvalves AB, sAV-Danmark trad-ing A/s, sigurd sørum As, mWs Ventil service AB, palmstiernas svenska AB and International plas-tic systems Ltd. 149 29
Industrial Com-ponents
AluFlex system AB, essmed AB, Kabetex Kullager & transmission AB and Brinch As 98 10
special products
Carrab Industri AB, Ammertech BV, Douwes International BV, precision products Ltd., Flintec Group AB and Inkal Industrikalibreringar AB 326 45
effect on group 696 108
Acquisitions completed 2007 303 56
Acquisitions completed 2008 393 52
effect on Group 696 108
If the acquired units had been consolidated as from 1 January 2008, net sales for the full year would have amounted to seK 6,952 million, and eBItA would have been seK 844 million.
Acquired assets in Flintec Group AB
seK million
Purchase price including earn-out payment 386
Acquired assetsBook value
Fair value adjust-
mentFair
value
Goodwill — 129 129
Agencies, trademarks, customer lists, licences, etc. 4 175 179
property, plant and equipment 75 — 75
Financial assets 6 — 6
Inventories 54 — 54
other current assets 63 — 63
Cash and cash equivalents 13 — 13
Deferred tax liability –1 –16 –17
Borrowings and pension obligations –94 — –94
other operating liabilities –22 — –22
98 288 386
If the acquired units had been consolidated as from 1 January 2008, net sales for the full year would have amounted to seK 6,952 million, and eBItA would have been seK 844 million.
the Flintec brand and Flintec’s customer relationships have been stated at the discounted value of future payment flows. the assumptions that form the basis of the fair value calculations consist of the company’s business plan through 2012, and thereafter a long-term annual growth rate of 2% and a discount rate of 11.3%. the value of the trademark is based on assumed royalties of 2% per year. the value of customer relationships is based on an assumed customer loss rate of 10% per year.
the trademark is judged to have an indefinite useful life, while customer rela-tionships are judged to have a useful life of 10 years.
the value of goodwill is justified by good profitability.
Acquired assets in Ammertech BV, Douwes International BV, Precision Prod-ucts Ltd, KG Enterprise oy, EssMed AB, Kabetex Kullager & transmission AB, Inkal Industrikalibreringar AB and Brinch AS.
seK million
Purchase price including earn-out payment 167
Acquired assetsBook value
Fair value adjust-
mentFair
value
Goodwill — 45 45
Agencies, trademarks, customer lists, licences, etc. — 82 82
property, plant and equipment 31 — 31
Financial assets 1 — 1
Inventories 43 — 43
other current assets 47 — 47
Cash and cash equivalents 11 — 11
Deferred tax liability –3 –23 –26
Borrowings and pension obligations –19 — –19
other operating liabilities –48 — –48
63 104 167
since disclosures about the individual acquisitions, with the exception of Flintec, are insignificant, they are provided here in aggregate form. the cost of customer lists and agencies has been valued at one year’s contribution margin and has been recorded in the balance sheet as agencies, trademarks, customer lists, licences, etc., and is amortised over a period of ten years. Goodwill is justified by the good profitability of the companies.
effect on cash flow
purchase price including earn-out payment 553
purchase price not paid out –263
Cash and cash equivalents in acquired companies –24
earn-out payments pertaining to previous years' acquisitions 10
total effect on cash flow 276
Note 26 Cont.

62 Indutrade Annual Report 2009 Indutrade Annual Report 2009 63
Notes
aCquIsItIons aFter the enD oF the FInanCIal yearFive businesses have been acquired to date in 2010. techno skruv i Värnamo, with annual sales of approximately seK 70 million, has a strong market position in customer-specific fasteners and mechanical products. Axmeditec sp.Z.o.o., in Bialystok, poland, with annual sales of approximately seK 70 million, specialises in sales of medical technology equipment used for healthcare applications in operating rooms, intensive care wards, emergency wards, and cardio and neona-tal units. techno skruv and Axmeditec are included in the Industrial Components business area as from 1 January 2010. Corona Control AB, which is included in the Flow technology business area as from 1 January 2010, has annual sales of approximately seK 50 million. the company is a total supplier of solutions for industrial valves.
Lekang Group, comprising the companies Lekang maskin As (Norway), Filter-teknik i sverige AB (sweden) and Filterteknik A/s (Denmark), is included in the special products business area as from 1 February 2010. Lekang Group, with annual sales of approximately seK 200 million, specialises in products and serv-ices primarily in liquid filtration system solutions for all types of industrial com-panies in scandinavia. In addition, a small construction plastics business was acquired by the special products business area.
acquired assets in techno skruv i värnamo ab, axmeditec ab, Corona Control ab and lekang group.
Preliminary purchase price allocationseK million
Purchase price including earn-out payment 264
Acquired assetsBook value
Fair value adjust-
mentFair
value
Goodwill — 83 83
Agencies, trademarks, customer lists, licences, etc. — 141 141
property, plant and equipment 57 — 57
Financial assets — — —
Inventories 71 — 71
other current assets 54 — 54
Cash and cash equivalents 30 — 30
Deferred tax liability –5 –37 –42
Borrowings and pension obligations –72 — –72
other operating liabilities –58 — –58
77 187 264
Agencies, trademarks, customer lists, licences, etc. will be amortised over a period of 10 years. the acquisitions have affected cash flow in 2010 by seK 222 million.
NotE 27 PleDgeD assets
GRoup pAReNt CompANy
2009 2008 2009 2008
For own liabilities
Real estate mortgages 36 61 — —
Chattel mortgages 22 27 — —
Assets subject to liens 48 50 — —
shares in subsidiaries 127 189 127 189
endowment insurance policies 2 2 — —
other 0 0 — —
total pledged assets 236 329 127 189
Car leases are reported as finance leases in accordance with IFRs, entailing an increase in assets, liabilities and pledged assets of seK 48 million (50).
NotE 28 ContIngent lIabIlItIes
GRoup pAReNt CompANy
2009 2008 2009 2008
Contingent liabilities for subsidiaries' pRI liabilities — — 71 70
Guarantees pledged on behalf of subsidiaries — — 224 27
Contingent liabilities for own pRI liabilities 1 1 — —
other contingent liabilities — 0 — —
total 1 1 295 97

64 Indutrade Annual Report 2009 Indutrade Annual Report 2009 65
Notes
NotE 29 Cash Flow From oPeratIons
GRoup pAReNt CompANy
2009 2008 2009 2008
net profit for the year 341 510 289 315
adjustments for:
Income tax 120 182 40 62
Amortisation of intangible assets 69 60 0 —
Depreciation of property, plant and equipment 89 78 0 1
Gain/loss on sale of property, plant and equipment 0 0 — —
Net change in other provisions –2 7 –13 14
Financial income –8 –12 –20 –32
Financial expenses 72 80 48 54
Dividend income, etc. — — –378 –453
total adjustments 340 395 –323 –354
Changes in working capital:
Inventories 144 –79 — —
trade accounts receivable and other receivables 196 –48 135 4
trade accounts payable and other liabilities –220 –2 –8 –7
total changes in working capital 120 –129 127 –3
Cash flow from operations 801 776 93 –42
Cash and cash equivalents in the balance sheet and cash flow statement consist of:
2009 2008 2009 2008
Cash and bank balances 229 223 41 18
short-term investments — — — —
total 229 223 41 18
NotE 30InCome statement ClassIFIeD by tyPe oF Cost
GRoup pAReNt CompANy
2009 2008 2009 2008
Changes in inventories of finished products –318 –328 — —
Raw materials and consumables –3 015 –3 290 — —
Costs for employee benefits –1 301 –1 314 –18 –21
Depreciation/amortisation/impairment charges –142 –138 –1 0
other costs –967 –950 –15 –18
total costs –5 743 –6 020 –34 –39
NotE 31 relateD Party transaCtIons
Intra-Group purchases and sales have been negligible. Investments with and bor-rowings from Group companies are made according to market terms.
the parent Company and five of the Group’s subsidiaries rent premises in the malax 3 property in Akalla from the Group company Colly Company AB, which in turn rents the property from an external party.
the lease expires on 30 June 2012. If notice of cancellation of the lease is not given within two years prior to its expiration, the term of the lease will be renewed for five years at a time. Colly Company bears the operating and maintenance costs as well as property tax assessed on the property. the rent was seK 7 mil-lion in 2009 and is adjusted annually based on changes in the consumer price index.
64 Indutrade Annual Report 2009 Indutrade Annual Report 2009 65
AuDIt RepoRt
auDIt rePortto the annual meeting of the shareholders of Indutrade ab (publ) Corporate identity number 556017-9367
We have audited the annual accounts, the consolidated accounts,
the accounting records and the administration of the board of
directors and the president of Indutrade AB for the financial year
2009. the company’s annual accounts and consolidated accounts
are included on pages 36–64 in the printed version of this docu-
ment. the board of directors and the president are responsible
for these accounts and the administration of the company as well
as for the application of the Annual Accounts Act when preparing
the annual accounts and application of International Financial
Reporting standards (IFRs) as adopted by the eu and the Annual
Accounts Act when preparing the consolidated accounts. our
responsibility is to express an opinion on the annual accounts, the
consolidated accounts and the administration based on our audit.
We conducted our audit in accordance with generally accepted
auditing standards in sweden. those standards require that we
plan and perform the audit to obtain reasonable assurance that
the annual accounts and the consolidated accounts are free of
material misstatement. An audit includes examining, on a test
basis, evidence supporting the amounts and disclosures in the
accounts. An audit also includes assessing the accounting princi-
ples used and their application by the board of directors and the
president and significant estimates made by the board of direc-
tors and the president when preparing the annual accounts and
consolidated accounts as well as evaluating the overall presenta-
tion of information in the annual accounts and the consolidated
accounts. As a basis for our opinion concerning discharge from
liability, we examined significant decisions, actions taken and cir-
cumstances of the company in order to be able to determine the
liability, if any, to the company of any board member or the presi-
dent. We also examined whether any board member or the presi-
dent has, in any other way, acted in contravention of the Compa-
nies Act, the Annual Accounts Act or the Articles of Association.
We believe that our audit provides a reasonable basis for our
opinion set out below.
the annual accounts have been prepared in accordance with
the Annual Accounts Act and give a true and fair view of the com-
pany’s financial position and results of operations in accordance
with generally accepted accounting principles in sweden. the
consolidated accounts have been prepared in accordance with
International Financial Reporting standards (IFRs) as adopted by
the eu and the Annual Accounts Act and give a true and fair view
of the group’s financial position and results of operations. the
statutory administration report is consistent with the other parts
of the annual accounts and the consolidated accounts.
We recommend to the Annual General meeting of shareholders
that the income statements and balance sheets of the parent
company and the group be adopted, that the profit of the parent
company be dealt with in accordance with the proposal in the
administration report and that the members of the board of direc-
tors and the president be discharged from liability for the finan-
cial year.
stockholm, 15 march 2010
Öhrlings pricewaterhouseCoopers AB
Lennart DanielssonAuthorised Public Accountant

66 Indutrade Annual Report 2009 Indutrade Annual Report 2009 67
CORPORATE GOVERNANCE REPORT
This report has not been audited by Indutrade’s external auditors and is not part of the formal Annual Report. Indutrade adheres to the Swedish Code of Corporate Govern-ance since 1 July 2006. Indutrade did not make any depar-tures from the Code during the 2009 financial year.
Delegation of responsibilities
Responsibility for management and control of the Group is dele-
gated among the shareholders (via general meetings), the Board
of Directors, its elected committees and the CEO in accordance
with the Swedish Companies Act, other laws and regulations,
applicable rules for listed companies, the Company’s Articles of
Association and the Board’s internal governance instruments.
Shareholders
Indutrade, which was previously a wholly owned subsidiary of AB
Industrivärden, was listed on the Stockholm Stock Exchange on
5 October 2005. At year-end 2009 Indutrade had 5,369 sharehol-
ders. The ten largest shareholders controlled 76.3% of the share
capital and votes, of which Industrivärden’s share was 36.9%.
Swedish legal entities, including institutions such as insurance
companies and mutual funds, owned 84.5% of the share capital
and votes at year-end. Foreign investors owned 7.5% of the share
capital and votes.
Articles of Association
Indutrade’s Articles of Association stipulate that Indutrade is a
public company, whose business is to “itself or through subsidiar-
ies, pursue trade in connection with the import and export of
machines, raw materials and finished and semi-manufactured
products as well as industrial necessities, including production,
preferably within the plastics, mechanical and chemical indus-
tries, and activities compatible therewith.” In votes at general
meetings of shareholders, there is no limitation on the number of
votes for represented shares.
The Board shall consist of a minimum of three and a maximum
of eight directors, who are elected each year at the Annual General
Meeting. Notices of Annual General Meetings shall be issued not
earlier than six weeks and not later than four weeks before the
meeting. Notice of an extraordinary general meeting that does not
concern an amendment to the Articles of Association, shall be
issued not earlier than six weeks and not later than two weeks
before the meeting. Notices shall be made through advertise-
ments in the Official Swedish Gazette (Post- och Inrikes Tidningar)
and in Dagens Nyheter.
General shareholders’ meetings
General shareholders’ meetings are Indutrade’s highest govern-
ing body. At the Annual General Meeting (AGM), which is held
within six months after the end of each financial year, the income
statement and balance sheet are adopted, the dividend is set, the
Board and auditors (where applicable) are elected, their fees are
determined, other items of legally ordained business are con-
ducted, and decisions are made on proposals submitted by the
Board and shareholders.
All shareholders who are registered in the shareholder register
on a specified record date and who have notified the Company in
due time of their intention to participate at the general meeting
are entitled to attend the meeting and vote for the total number of
shares they have. Shareholders can be represented by proxy.
More information about the 2010 Annual General Meeting is pro-
vided on page 72.
The notice of the Annual General Meeting scheduled for 24 May
2010 is scheduled for publication in the Official Swedish Gazette,
Dagens Nyheter, and on Indutrade’s website on 21 April 2010. The
notice will provide a detailed proposed agenda including pro-
posals for the dividend, the election of directors, directors’ fees
(broken down by the Chairman and other directors), recommen-
dation for auditors and auditors’ fees, and proposed guidelines on
compensation of the Company’s senior executives.
2009 Annual General Meeting
At the Annual General Meeting on 4 May 2009, attorney Klaes
Edhall presided as chairman.
At the meeting, the annual report and audit report were pre-
sented. In connection with this, Chairman of the Board Bengt Kjell
provided information on the work of the Board and reported on
the principles of compensation of the executive management and
on the work of the Audit and Remuneration Committees. In add-
ition, CEO Johnny Alvarsson gave an address on Indutrade’s oper-
ations in 2008. The auditors presented relevant parts of their audit
report and audit report for the Group for 2008.
The 2009 AGM made the following resolutions:
to set the dividend at SEK 6.40 per share;
to re-elect as directors Bengt Kjell, Gerald Engström, Eva
Färnstrand, Ulf Lundahl, Michael Bertorp, Owe Andersson and
Johnny Alvarsson;
to re-elect Bengt Kjell as Chairman of the Board;
in accordance with the Nomination Committee’s recommenda-
tion, that the Nomination Committee shall consist of repre-
sentatives of four of the largest shareholders in terms of votes
as well as the Chairman of the Board until the composition of
the next year’s nomination committee has been publicly
announced;
that the Nomination Committee’s composition shall be based
on ownership information as per 31 August 2009 and shall be
publicly announced not later than six months prior to the
Annual General Meeting;
in accordance with the Board’s recommendation, that
Indutrade shall apply compensation levels for senior execu-
tives which shall normally consist of a fixed and variable por-
tion, shall be in line with the going rate in the market, and shall
be commensurate with the executives’ level of competence,
CORPORATE GOVERNANCE REPORT

66 Indutrade Annual Report 2009 Indutrade Annual Report 2009 67
CORPORATE GOVERNANCE REPORT
responsibility and performance. Non-monetary benefits and
pension benefits for members of Company management shall
correspond to what is considered to be reasonable in relation
to common practice in the markets in which the respective
executives work; and
in accordance with the Board’s proposal, to authorise the
Board to decide on the new issue of a maximum of 4,000,000
shares in the Company with stipulations on issues in kind or
set-off.
Members of the Board of Directors
Indutrade’s board of directors, which is elected by the Annual
General Meeting, consists of seven members, including the CEO.
Indutrade has not set any specific age limit for directors, nor any
term limit for how long a director may serve on the Board.
Prior to the 2009 Annual General Meeting, Mats Jansson had
declined re-election. The other directors elected by the 2008
Annual General Meeting were re-elected at the 2009 Annual
General Meeting.
The Chairman of the Board, Bengt Kjell, is a former Executive
Vice President of Industrivärden and currently CEO of AB Handel
och Industri. Eva Färnstrand is a former Site Manager at Södra Cell
Mönsterås. Gerald Engström is President and CEO of Systemair.
Michael Bertorp is a former Executive Vice President of Svenska
Cellulosa Aktiebolaget. Owe Andersson is a former CEO of
Mekonomen. Ulf Lundahl is an Executive Vice President of L E
Lundbergföretagen. Johnny Alvarsson is President and CEO of
Indutrade.
A presentation of the current assignments of the members of
the Board can be found on page 70.
Other executives participate at board meetings to present
reports when necessary.
All of the directors, except for Johnny Alvarsson, are independ-
ent in relation to Indutrade. Johnny Alvarsson, Eva Färnstrand,
Michael Bertorp, Gerald Engström, Owe Andersson and Bengt
Kjell are independent in relation to Indutrade’s major sharehol-
ders. Only one director, Johnny Alvarsson, has an operational role
in the Company.
The work of the Board of Directors
Each year, the Board adopts a formal work plan that governs the
Board’s work and its internal delegation of duties including the
committees, decision-making procedures within the Board, meet-
ing procedure and duties of the Chairman. The Board has also
issued instructions for the CEO and instructions on financial
reporting to the Board. In addition, the Board has adopted a
number of policies, including a finance policy and an investment
policy.
The Board is responsible for the Company’s organisation and
for the administration of its affairs. This entails ensuring that the
organisation is suited for its purpose and designed in such a way
so as to ensure satisfactory control of its accounts, treasury
management and financial conditions in general. In addition, the
Board is responsible for ensuring that the Company has satisfac-
tory internal control and risk management and continuously eval-
uates the effectiveness of the Company’s internal control sys-
tems. The Board is also responsible for developing and following
up the Company’s strategies by drawing up plans and setting
objectives. The Board maintains constant oversight of the CEO’s
and operative management’s work.
In accordance with the current work plan, the Board has seven
regular meetings each year, including the statutory meeting after
the Annual General Meeting, and on any other occasions when the
situation demands.
In 2009 the Board had a total of ten meetings including the statu-
tory meeting and one meeting held by conference call.
The Board conducted its work in 2009 in accordance with the
work plan. Matters requiring special attention by the Board during
the year pertained to strategy, finance and acquisitions. All Board
decisions were unanimous.
All directors were in attendance at all board meetings.
The Chairman’s role
The Chairman organises and leads the work of the Board to ensure
that this is carried out in compliance with the Swedish Companies
Act, other laws and directives, applicable rules for listed compa-
nies (including the Code), and the Board’s own internal governance
documents. The Chairman monitors business activities by main-
taining regular contact with the CEO and ensuring that the other
directors are provided with relevant information and decision-
making documentation. The Chairman is also responsible for mak-
ing sure that an annual evaluation is conducted of the Board’s work
and that the results of this evaluation are presented to the Nomina-
tion Committee. The Chairman represents the Company in owner-
ship matters.
Remuneration Committee
The Board has appointed a remuneration committee consisting of
the Chairman of the Board, Bengt Kjell, and one other director, Ulf
Lundahl. The Remuneration Committee draws up “the Board’s pro-
posed principles for compensation and other terms of employment
for senior executives”. This proposal is discussed by the Board and
submitted to the AGM for approval.
In accordance with an AGM resolution, the committee conducts
drafting work for decisions to be made by the Board on the CEO’s
compensation and terms of employment, and decides on matters
pertaining to the compensation and terms of employment for other
senior executives, and informs the Board about decisions made.
The Remuneration Committee met on five occasions during the
year.
Audit Committee
The Board has appointed an audit committee, consisting of the
entire board excluding the CEO. Michael Bertorp served as chair-
man of the Audit Committee.
The Audit Committee has an oversight role with respect to the
Company’s risk management, governance and control, and finan-
cial reporting. The committee maintains regular contact with the
Company’s auditors to ensure that the Company’s internal and
external accounting satisfies requirements made on market-
listed companies and to discuss the scope and focus of auditing
work. The Audit Committee evaluates performed audit activities

68 Indutrade Annual Report 2009 Indutrade Annual Report 2009 69
CORPORATE GOVERNANCE REPORT
and informs the Company’s nomination committee about the
results of its evaluation and assists the Nomination Committee on
drawing up recommendations for auditors and fees for their
auditing work.
The Audit Committee had three meetings in 2009, at which all
members were present.
On two occasions in 2009 the committee performed reviews
and received reports from the Company’s external auditors. The
auditors’ reports did not give rise to any special action by the
Audit Committee.
Nomination Committee
The AGM on 4 May 2009 resolved that the Nomination Committee
shall consist of representatives of four of the largest shareholders
in terms of votes as well as the Chairman of the Board, who shall
also summon the first meeting of the Nomination Committee. The
member representing the largest shareholder shall be appointed as
committee chair. The composition of the Nomination Committee
ahead of the 2010 Annual General Meeting was to be based on own-
ership information as per 31 August 2009 and was to be publicly
announced not later than six months prior to the Annual General
Meeting. The composition of the Nomination Committee ahead of
the 2010 Annual General Meeting was published on 12 October 2009.
Ahead of the 2010 Annual General Meeting, the Nomination Com-
mittee has the following members:
Carl-Olof By, Industrivärden (committee chair)
Claes Boustedt, L E Lundbergföretagen
Håkan Sandberg, Handelsbanken Pension Foundation and
Handelsbanken Pension Fund
Lars Öhrstedt, AFA Insurance
Bengt Kjell, Chairman of the Board, Indutrade
The Nomination Committee had four meetings, at which it was
presented the evaluation of the Board’s work during the past year
and discussed the Board’s composition.
The Nomination Committee is tasked with drawing up pro-
posals to be presented to the AGM for decisions regarding a per-
son to serve as AGM chairman, the Chairman of the Board and
other directors, directors’ fees, auditors’ fees and, where applica-
ble, election of auditor and the principles for the composition of
the Nomination Committee.
Based on the results of the Board’s evaluation and the current
directors’ availability for re-election – among other things – the
Nomination Committee makes an assessment of whether the cur-
rent board currently meets the requirements that will be made for
the Board in view of the Company’s situation and future orienta-
tion, or if the composition of competencies and experience needs
to be changed.
Ahead of the 2010 AGM, the Nomination Committee proposes
re-election of board members Bengt Kjell, Ulf Lundahl, Eva Färn-
strand, Michael Bertorp and Johnny Alvarsson. Directors Gerald
Engström and Owe Andersson have declined re-election. The
committee has proposed new election of Mats Olsson (born 1948);
he is Chairman of the Board of KnowIT and a director of Fenix
Outdoor AB. The committee has proposed re-election of Bengt
Kjell as Chairman of the Board. The Nomination Committee’s pro-
posal entails that the Board will be reduced by one member, and
during the coming mandate period it will consist of six members.
A more detailed presentation of the members of the Board is pro-
vided on page 70 of the Annual Report. In addition, the Nomination
Committee proposes election of PricewaterhouseCoopers AB to
serve as auditor for a term extending until the end of the 2014
Annual General Meeting.
Operating activities
The CEO is responsible for the administration of Indutrade’s day-
to-day affairs, which are managed by the Company’s executive
management team. The CEO’s decision-making authority regard-
ing investments and financing matters is governed by rules set by
the Board.
President and CEO
Indutrade’s President and CEO, Johnny Alvarsson, has been
employed by Indutrade since 2004. He was CEO of Elektronikgrup-
pen from 2001 to 2004, CEO of Zeteco AB from 1988 to 2000, and
held various management positions at Ericsson from 1975 to 1987.
Johnny Alvarsson owns 25,000 shares of Indutrade stock and
100,000 stock options issued by Industrivärden.
Executive compensation
The principles for compensation and other terms of employment
for senior executives of Indutrade were approved by the 2009
AGM. For more information on compensation, including fixed and
variable compensation, see the Directors’ Report or Note 6 in the
Annual Report.
Auditors
At the 2006 Annual General Meeting, the chartered accounting
firm Öhrlings PricewaterhouseCoopers AB was appointed as
auditor for a term extending through the 2010 Annual General
Meeting. Ahead of the 2010 Annual General Meeting, the Nomina-
tion Committee has proposed election of Pricewaterhouse-
Coopers AB as auditors for a term extending until the end of the
2014 Annual General Meeting.
The auditors maintain regular contact with the Chairman of the
Board, the Audit Committee and Company management.
The chief auditor was Authorised Public Accountant Lennart
Danielsson.
In 2009, PricewaterhouseCoopers had a total of 94 audit assign-
ments for companies listed on Nasdaq OMX Stockholm, of which
one was conducted in co-operation with another accounting firm,
and 14 audit assignments for companies listed on the NGM Equity
list. Auditors’ fees are described in Note 13 on page 55 of the
Annual Report.
INTERNAL CONTROL OF FINANCIAL REPORTING
In accordance with the Swedish Companies Act and the Swedish
Code of Corporate Governance, the Board is responsible for inter-
nal control. This report has been prepared in accordance with the
Code and describes how the internal control of the financial
reporting is organised.

68 Indutrade Annual Report 2009 Indutrade Annual Report 2009 69
CORPORATE GOVERNANCE REPORT
Control environment
Effective board work is a prerequisite for good internal control.
The Board’s work plan and the instructions for the CEO and the
Board’s committees ensure a clear delegation of roles and
responsibilities to the benefit of effective management of opera-
tional risks.
In addition, the Board has adopted a number of fundamental
guidelines and policies designed to create the conditions for a
good control environment. These include, among other things,
economic and financial reporting, a finance policy and an invest-
ment policy. One of the aims of these policies is to create a plat-
form for good internal control. These policies are followed up and
revised as needed.
Company management continuously draws up instructions on
the Group’s financial reporting which, together with the policies
adopted by the Board, such as the finance policy and the invest-
ment policy are included in the Group’s financial manual.
The Group has a joint reporting system that serves as the plat-
form for the Group’s monthly consolidation work.
Risk assessment
The Company has implemented a structured process for assess-
ing risks that could affect financial reporting. This is an annually
recurring process and is evaluated by the Audit Committee and
the Board.
Through this risk assessment it has been ascertained that the
Group’s structure, consisting of a multitude of stand-alone com-
panies that are independent from each other in various sectors
and of varying size, offers a considerable spread of risk. The risk
assessment also covered the Group’s income statement and bal-
ance sheet items to identify areas in which the aggregate risk for
error would be greatest. The areas identified consisted primarily
of revenue recognition, trade accounts receivable and inventories.
In addition, continuous risk assessment is conducted in con-
nection with strategic planning, budgeting/forecasts and acquisi-
tion activities, aimed at identifying events in the market or oper-
ations that could give rise to changes in valuations of assets or
liabilities, for example.
Control activities
The Group’s companies are organised in four business areas. In
addition to a business area president, the respective business
area management teams include a controller. The controller
plays a central role in analysing and following up the business
area’s financial reporting and in ensuring compliance by the com-
panies in the business area with Group policies that could have an
impact on the financial reporting. In addition, the Parent Company
has a function for continuous analysis and follow-up of financial
reporting by the Group, the business areas and subsidiaries. The
Parent Company’s finance department also initiates the work on
the annual self-evaluation routine regarding the internal control
of financial reporting. This is a process that involves several parts.
In this evaluation, the Group’s companies have been grouped
into three categories, based on the nature and scope of the
respective companies’ businesses. For each group of companies,
a questionnaire for evaluation of internal control has been pre-
pared based on the performed risk analysis. A minimum accept-
able level of internal control has been determined for each
respective group, which served as the baseline for the evaluation.
All companies owned by Indutrade at the start of 2009 were
required to respond to the evaluation questionnaire. An evaluation
of the responses was made per group of companies and for the
Group as a whole. As a complement to Indutrade’s own work, the
auditors conducted a validation of the respective companies’ com-
pleted questionnaires. Both the evaluation performed by Indutrade
and the result of the auditors’ validation have been reported and
discussed with the Audit Committee and the Board of Directors.
The overall assessment of the evaluation of the internal control of
the Group’s financial reporting will serve as documentation for
subsequent years’ self evaluation and work on further strengthen-
ing internal control.
Information and communication
The Company’s key governance documents, consisting of policies,
guidelines and manuals – to the extent that these pertain to financial
reporting – are updated on a regular basis and communicated via
relevant channels to the companies within the Group.
Systems and routines have been created to provide management
with necessary reports on the business results in relation to set tar-
gets. Necessary information systems are in place to ensure that reli-
able and current information is available, to enable management to
perform its duties in a correct and effective manner.
Follow-up
The Board conducts a monthly evaluation of business development,
earnings, position and cash flow based on a report packet contain-
ing outcomes, forecasts and comments on certain key factors.
The Audit Committee, which reports to the Board on a regular
basis, has an oversight role regarding the Company’s financial
reporting, risk management, and governance and control. In add-
ition, the Audit Committee maintains regular contact with the
Company’s auditors to ensure that the Company’s internal and
external accounting satisfies requirements made on market-
listed companies and to follow up any observations that emerge
from the audit.
Internal audit
The Company has a simple operative structure consisting pri-
marily of small and medium-sized stand-along operations that
are independent of each other, with varying conditions for internal
control. Compliance with governance and internal control sys-
tems that have been drawn up by the Company is regularly
checked by the controllers at the business area and Parent Com-
pany level. In addition, the controllers conduct ongoing analyses
of the companies’ reporting to verify their performance. In view of
the above, the Board has opted to not have any special internal
audit function.
AuDITORS’ REVIEw
This corporate governance report and the report on internal con-
trol of the financial reporting have not been reviewed by the Com-
pany’s auditors.

70 Indutrade Annual Report 2009 Indutrade Annual Report 2009 71
BOARD OF DIRECTORS
BOARD OF DIRECTORS
Bengt KjellBorn: 1954Chairman of the Board since: 2005Director since: 2002CEO of AB Handel och IndustriEducation: MBA, Stockholm School of EconomicsOther directorships: Executive Vice President and Head of Invest-ment Operations, Industrivärden; Authorised Public Accountant; Head of Corporate Finance, Securum; Senior Partner, NavetNumber of shares: 30,100
Michael BertorpBorn: 1949Director since: 2003Education: LL.B.Other directorships: Director of Handelsbanken FonderProfessional experience: Executive Vice President, Svenska Cellulosa Aktiebolaget Number of shares: 1,800
Eva FärnstrandBorn: 1951Director since: 1998Education: M.Sc. Chemistry, Royal Institute of TechnologyOther directorships: Chairman of Profilgruppen Director of Sveaskog and IVAProfessional experience: Site Manager, Södra Cell Mönsterås; President, Tidningstryckarna Aftonbladet Svenska Dagbladet; Newsprint Business Area Manager, SCA Graphic SundsvallNumber of shares: 400
Johnny AlvarssonBorn: 1950 Director since: 2004President and CEOEducation: B.Sc. Engineering, Management studiesOther directorships: Director of VBG Group and CardoProfessional experience: President, Elektronikgruppen; Presi-dent, Zeteco; various management positions at EricssonNumber of shares: 25,000Antal optioner: 100,000
ulf LundahlBorn: 1952
Director since: 2006Vice President and Deputy CEO of L E Lundbergföretagen
Education: LL.B. and B.Sc. Econ.Other directorships: Director of Holmen, Ramirent Oyj,
Husqvarna, Cardo, Brandkontoret, Lorentzen och Wettre, and SHB Regional Bank Stockholm
Professional experience: President, Östgöta Enskilda Bank; CEO, Danske Securities
Number of shares: 0
Owe AnderssonBorn: 1942
Director since: 2005Education: MBA, Stockholm School of Economics
Other directorships: Chairman of JOFRAB and the Naval Academy of Sweden
Director of Calix GroupProfessional experience: President and CEO, Mekonomen;
President of Mekonomen DetaljistNumber of shares: 10,000
AuditorsÖhrlings PricewaterhouseCoopers AB
Chief Auditor: Lennart Danielsson, Authorised Public AccountantBorn: 1959
Auditor of Indutrade AB since 2006Other auditing assignments: Clas Ohlson and Sweco
Gerald EngströmBorn: 1948
Director since: 2007President and CEO of Systemair AB
Education: EngineerOther directorships: Director of Repant ASA
Professional experience: Principal owner and founder of Systemair AB
Number of shares: 0
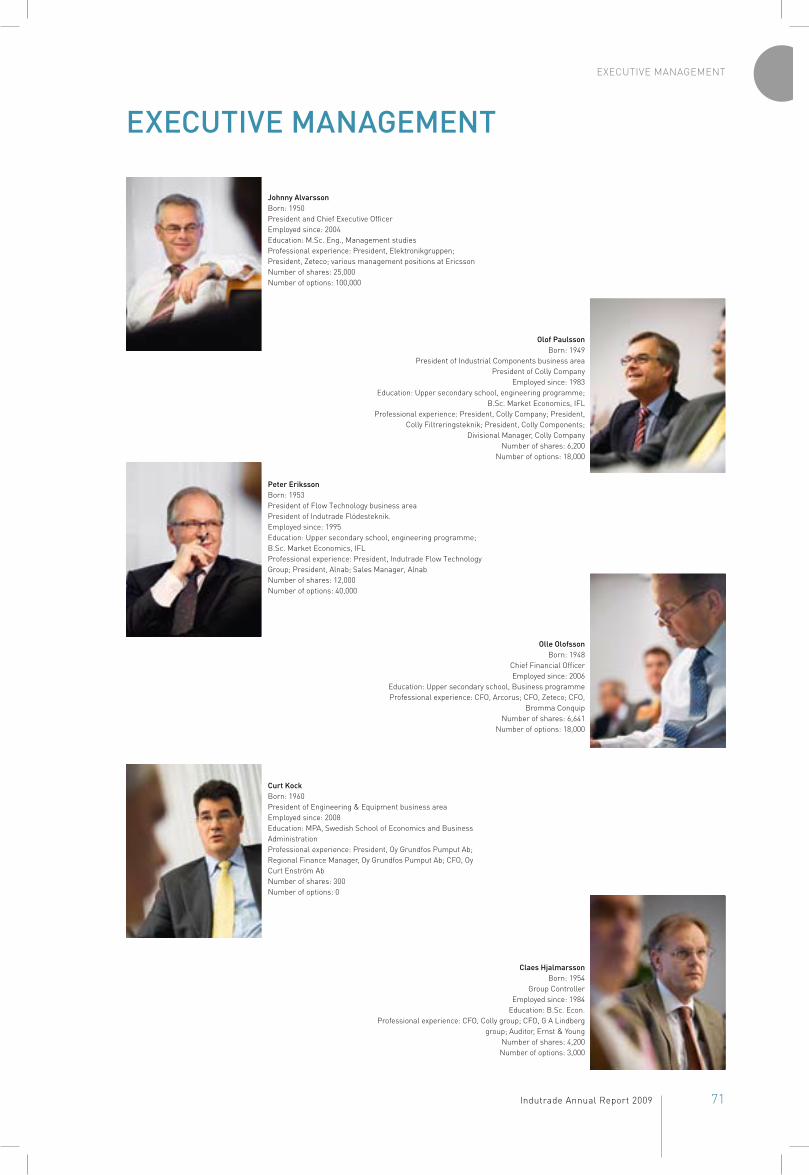
70 Indutrade Annual Report 2009 Indutrade Annual Report 2009 71
EXECUTIVE MANAGEMENT
ExECuTIVE MANAGEMENT
Johnny AlvarssonBorn: 1950President and Chief Executive OfficerEmployed since: 2004Education: M.Sc. Eng., Management studiesProfessional experience: President, Elektronikgruppen; President, Zeteco; various management positions at EricssonNumber of shares: 25,000Number of options: 100,000
Peter ErikssonBorn: 1953President of Flow Technology business areaPresident of Indutrade Flödesteknik.Employed since: 1995Education: Upper secondary school, engineering programme; B.Sc. Market Economics, IFLProfessional experience: President, Indutrade Flow Technology Group; President, Alnab; Sales Manager, AlnabNumber of shares: 12,000Number of options: 40,000
Curt KockBorn: 1960President of Engineering & Equipment business areaEmployed since: 2008Education: MPA, Swedish School of Economics and Business AdministrationProfessional experience: President, Oy Grundfos Pumput Ab; Regional Finance Manager, Oy Grundfos Pumput Ab; CFO, Oy Curt Enström AbNumber of shares: 300Number of options: 0
Olof PaulssonBorn: 1949
President of Industrial Components business areaPresident of Colly Company
Employed since: 1983Education: Upper secondary school, engineering programme;
B.Sc. Market Economics, IFLProfessional experience: President, Colly Company; President,
Colly Filtreringsteknik; President, Colly Components; Divisional Manager, Colly Company
Number of shares: 6,200Number of options: 18,000
Olle OlofssonBorn: 1948
Chief Financial OfficerEmployed since: 2006
Education: Upper secondary school, Business programmeProfessional experience: CFO, Arcorus; CFO, Zeteco; CFO,
Bromma ConquipNumber of shares: 6,641
Number of options: 18,000
Claes HjalmarssonBorn: 1954
Group ControllerEmployed since: 1984
Education: B.Sc. Econ.Professional experience: CFO, Colly group; CFO, G A Lindberg
group; Auditor, Ernst & YoungNumber of shares: 4,200Number of options: 3,000

72 Indutrade Annual Report 2009
ANNUAL GENERAL MEETING AND REPORTING DATES
ANNuAL GENERAL MEETING
Time and place
The Annual General Meeting will be held at 3 p.m. on Monday,
24 May 2010, at Summit, Razorfish room, Grev Turegatan 30,
Stockholm.
who is entitled to participate?
To be entitled to participate in the Annual General Meeting, share-
holders must be listed in the shareholder register maintained by
Euroclear Sweden AB on Tuesday, 18 May 2010 and have notified
the Company of their intention to participate no later than 4 p.m.
(CET) on Tuesday, 18 May 2010.
How to become registered in the shareholder register
Shareholders who have registered their shares in their own name
with Euroclear Sweden are automatically entered in the share-
holder register. Shareholders whose shares are registered in the
names of a trustee must have their shares re-registered tempor-
arily in their own names well in advance of 18 May 2010 to be eli-
gible to participate in the Annual General Meeting.
Notice of attendance
Notice of intention to participate in the Meeting can be made using
one of the following alternatives:
by post to: Indutrade AB, Box 6044,
SE-164 06 Kista, Sweden, attn. Hannelore Söderberg
by phone +46 (0)8 703 03 00
by fax +46 (0)8 752 79 39
via www.indutrade.se
Upon notification, shareholders should indicate their:
name
national ID number or company registration number
address and phone number.
Notification must be received by the Company no later than 4 p.m.
(CET) on Tuesday, 18 May 2010.
Proxies
Shareholders may exercise their right to participate in the Annual
General Meeting through appointment of a proxy with power of
attorney. Such power of attorney must be in writing and should be
sent to the Company well in advance the Meeting at the above
address. Proxies for legal entities must also submit a certified
copy of a certificate of incorporation or corresponding authorisa-
tion document.
ANNuAL GENERAL MEETING
Interim report 1 Jan–31 March 2010 29 April 2010
Interim report 1 Jan–30 June 2010 4 August 2010
Interim report 1 Jan–30 September 2010 2 November 2010

CONTENTS
1 Year in brief 2 Indutrade at a glance 4 CEO’s message 6 Share data 8 Mission, goals and strategies 10 The aquisition process 12 The value chain 13 Snapshot 15 A decentralised organisation 16 Sustainable development
18 Market 20 Acquisitions during the year 22 Engineering & Equipment 24 Flow Technology 26 Industrial Components 28 Special Products 30 Risk management 32 Several-year overview 35 Definitions
36 Directors’ report 41 Consolidated income statement 42 Consolidated balance sheet 45 Consolidated cash flow statement 46 Parent company income statement/cash flow statement 47 Parent company balance sheet 48 Accounting principles and notes 65 Audit report
66 Corporate Governance Report 70 Board of Directors and Auditors 71 Executive Management 72 Annual General Meeting and reporting dates
Indutrade AB (publ) ”Indutrade” is a Swedish company that is subject to Swedish jurisdiction. Amounts are presented in Swedish kronor (SEK). Amounts in mil-lions of kronor are abbreviated as SEK million. Figures in parentheses refer to 2008, unless stated otherwise. Income statements, balance sheets and key data for the years 2000-2003 have not been adjusted to international Financial Report-ing Standards (IFRS), but are based on the recommendations of the Swedish Financial Accounting Standards Council. Information about markets and competi-tors is based on Indutrade’s own estimates, unless a specific source is stated. These estimates are based on the best and most recently available information. Pages 36-64 have been audited.
Earnings per share for the year. Proposed dividend for the year per share.
8.53SEK
4.30SEK
Text and production: Indutrade in co-operation with SolbergDesign: SolbergPhoto: Indutrade, Christoffer Edling and Mats BengtssonPrinted by: Billes tryckeri

2009
2005 2006 2007 2008 2009
EBITA-MARGIN, %12
10
8
6
4
2
08.7 10.2 11.5 12.1 9.5
Indutrade ABBox 6044SE-164 06 KistaPhone +46 (0)8 703 03 00Fax +46 (0)8 752 79 39e-mail: [email protected]
For addresses of Indutrade subsidiaries, visit www.indutrade.se
IND
UTR
AD
E AN
NU
AL R
EP
OR
T 2009
TARGET
Sol
ber
g