Embed Size (px)
Citation preview

Industry Structure and Company Strategies of Major Domestic and Foreign Wind and Solar Energy Manufacturers:
Opportunities for Supply Chain Development in Appalachia
Co-Principal Investigators Gerald I. Susman, Ph.D.
Smeal College of Business 210 Business Building, University Park, PA 16802
814-863-0448
Amy K. Glasmeier, Ph.D. College of Earth and Mineral Sciences
302 Walker Building, University Park, PA 16802 814-865-7323
Technical Advisors Susan K. Stewart, Ph.D.
Research Associate, Energy Science and Power Systems, Applied Research Laboratory David R. Riley, Ph.D.
Associate Professor, Architectural Engineering, College of Engineering The Pennsylvania State University
University Park, PA 16802
Researchers Jared Freer, Graduate Assistant
Barbara B. Kinne, Research Assistant Michael H. Patullo, Research Consultant
Jenna P. Stites, Research Assistant Carmen Strand, Research Assistant
Michael Waldhier, Graduate Assistant
ARC Project Number CO-15810-07 October 1, 2007–February 27, 2009
Final Report Submitted
November 20, 2009
Project Director Gerald I. Susman, Ph.D.
Smeal College of Business The Pennsylvania State University
814-863-0448

2
TABLE OF CONTENTS
Data Dictionary ................................................................................................................................5 Executive Summary .........................................................................................................................6 Phase I. Industry Market Structure, Forecast, and Potential: Part 1: The Solar Industry................................................................................................................8 Demand for Solar Energy ....................................................................................................8 Solar Energy Technologies ................................................................................................10 Markets and Applications ..................................................................................................10 Industry Participants ..........................................................................................................12 Photovoltaic (PV) Supply Chain ........................................................................................16 Competitive Strategies .......................................................................................................17 Strategic Groups.................................................................................................................21 Future Directions ...............................................................................................................25 Part 2: The Wind Industry Demand for Wind Energy ..................................................................................................27 Policies that Stimulate Demand for Wind Energy .............................................................27 Wind Energy Systems ........................................................................................................30 Markets and Applications ..................................................................................................31 Industry Participants ..........................................................................................................32 Wind System Supply Chain ...............................................................................................35 Competitive Strategies .......................................................................................................40 Industry Evolution .............................................................................................................48 Future Directions ...............................................................................................................50 Phase II: Solar and Wind Energy Industry Participation within the Appalachian Region Introduction ........................................................................................................................52
NAICS Codes to Identify Potential Firms and Employment in Solar and Wind Industries .................................................................52
Part 1. Pattern of Manufacturing Activities and Potential Employment in Appalachia ....54 Part 2. Identifying and Surveying Firms Involved in the Solar and Wind Industries ........58 Analysis of Survey Results ....................................................................................68 Part 3. Review of the Policy Landscape in the Appalachian Region .................................77 Demand-Side Incentives ....................................................................................................78 Supply-Side Incentives ......................................................................................................82 Novel Policy Strategies ......................................................................................................83 Major Findings and Observations ..................................................................................................85 Bibliography ..................................................................................................................................91

3
List of Tables
Table 1 Shipments of PV Cells and Modules by Application (peak kilowatts) ...........................11 Table 2 Shipments of PV Cells and Modules by Market and Type (peak kilowatts) ...................12 Table 3 Materials, Components, and Equipment Suppliers in Appalachian Counties .......14 Table 4 Distributors/Installers in Appalachian Counties ....................................................15 Table 5 Plant Locations of Top Fifteen Cell Manufacturers ..............................................18 Table 6 Worldwide MW Additions, Plant Locations, and U.S. Installations of Top Ten Wind Turbine Manufacturers in 2008 .................................................33 Table 7 Wind Turbine Suppliers and Locations .................................................................37 Table 8 Component and Equipment Suppliers in Appalachian Counties ...........................39 Table 9 Product Line Range of the Global Top-Ten Turbine Manufacturers ....................41 Table 10 Size Distribution of Turbines from 1998–2007 .....................................................42 Table 11 R&D as a Percentage of Sales for Top-Ten Turbine Manufacturers .....................45 Table 12 NAICS 2007 Codes of Solar and Wind Industry Participants ...............................62 Table 13 Founding Years of Responding Firms ...................................................................69 Table 14 NAICS 2007 Codes of Survey Respondents .........................................................70 Table 15 Sectors Served by Founding Years of Responding Firms .....................................71 Table 16 Position in the Supply Chain..................................................................................71 Table 17 Products/Services Provided by Survey Respondents, by Sector ...........................72 Table 18 Preparedness of Employees for Participation in the Solar or Wind Industry ........75 Table 19 Renewable Portfolio Standards in Appalachian States ..........................................78 Table 20 Tax Incentives that Apply to Solar and/or Wind Installations, by State ................79 Table 21 ARC State Grant and Loan Programs Applicable to Solar and/or Wind ...............80 Table 22 Profile of Typical Established and Emergent Firms ..............................................87
List of Figures
Figure 1 PV Solar Supply-Chain ..........................................................................................17 Figure 2 Strategic Groups––PV Solar Industry ....................................................................24 Figure 3 Supply-Chains for Two Major Wind System Components ...................................36 Figure 4 Strategic Groups in the Wind Industry – 2004 ......................................................49 Figure 5 Potential Renewable Energy Manufacturing Employment in ARC Counties (by State) ................................................................................................................55 Figure 6 Total Establishments with Renewable Manufacturing Potential in ARC Counties (by State) ...................................................................................55 Figure 7 Counties with Potential Solar Manufacturing Jobs over 500 .................................56 Figure 8 The Number of Firms and Components for Counties with Potential Solar Job Totals over 500 ......................................................................................56 Figure 9 Counties with Potential Wind Manufacturing Job Totals over 1,000 ....................57 Figure 10 Number of Firms and Components in Counties with Potential Wind Manufacturing Jobs over 1,000 ....................................................................57 Figure 11 Phase II––Construction of Firm Database .............................................................60 Figure 12 Collection of Firms ................................................................................................61

4
List of Maps
Map 1 Potential Participants in Solar and/or Wind Industry ............................................64 Map 2 Participants in Solar and/or Wind Industry ............................................................65 Map 3 Manufacturers in Solar and/or Wind Industry .......................................................66 Map 4 Service Providers (Including Installers) in Solar and/or Wind Industry ................67
List of Appendices
Appendix I Profiles of Solar Energy Industry Companies by Strategic Groups ......................99 Appendix II Acquisitions, Partnerships, and Framework Agreements between Turbine
Manufacturers, Suppliers and Buyers ..................................................................104 Appendix III NAICS Codes for Manufacturing Firms with Technical Potential to Enter Solar PV and/or Wind Turbine Markets ..............................................................109 Appendix IV Summary State Potential Employment and Establishment Data by Renewable
Resource ...............................................................................................................110 Appendix V Survey Instrument ...............................................................................................112 Appendix VI Database of Potential Participants in Solar and/or Wind Energy Industry ..........117

5
DATA DICTIONARY ARC Appalachian Regional Commission AWEA American Wind Energy Association BIPV Building Integrated Photovoltaic CNC Computer Numerical Controlled CPV Concentrated Photovoltaic CSP Concentrated Solar Power CPS Concentrated Power Systems DFIG Double Fed Induction Generators EEC European Economic Community EPACT Energy Policy Act EPV Energy Photovoltaic EVA Ethyl Vinyl Acetate Feed-in Tariff The price per unit of electricity that a utility or supplier has to pay for
renewable electricity from private generators. The government regulates the tariff rate. [http://glossary.eea.europa.eu]
FERC Federal Energy Regulatory Commission GW Gigawatt [1 gigawatt = 1,000 megawatts = 1 billion watts] IPO Intellectual Property Owner IPP Independent Power Producers ISO Independent System Operators ITC Investment Tax Credit Kerf Loss Material loss associated with any type of cutting and sectioning kW Kilowatt [1 kilowatt = 1,000 watts] kWh Kilowatt Hour [1 kWh = 1,000 watts of electricity used for one hour] Likert Scale Psychometric scale used in attitude/opinion research MW Megawatts [1 megawatt = 1,000 kilowatts = 1 million watts] MWh Megawatt Hour [1 MWh = 1,000 kilowatts of electricity used for one hour] NAICS North American Industrial Classification System NREL National Renewable Energy Laboratory NYSERDA New York State Energy Research and Development Authority OECD Organization for Economic Co-operation and Development PM Permanent Magnet PPA Power Purchase Agreement PTC Production Tax Credit PV Photovoltaic REC Renewable Energy Credit RES Renewable Energy Standards ROI Return on Investment RPS Renewable Portfolio Standards RTO Regional Transportation Organization SCADA Supervisory Control And Data Acquisition VEETC Volumetric Ethanol Excise Tax W Watt [standard unit of power, or energy unit per time]

6
EXECUTIVE SUMMARY This report presents results from a two-phase study of the status of the solar and wind industries in the U.S., with special focus on product and service suppliers in the thirteen Appalachian states, and the challenges these firms and their state governments face in preparing for and competing in these two rapidly emerging worldwide industries. Phase I concerns the structure of the solar and wind energy industries, and focuses on sets of firms that follow similar competitive strategies. A brief overview of the dimensions of these competitive strategies is provided, including choice of market, geographical region, breadth of product line, and vertical integration. Other factors that influence competitive strategy are cost dynamics, differentiation, technology choice, and technology leadership. The evolution of these industries depends on demand that is stimulated by government mandates, feed-in tariffs, tax incentives, rebates, price of conventional energy and carbon offsets. It also depends on supply that is influenced by production capacity, availability of raw materials, process innovation, rate of learning, and economies of scale. Some of these demand and supply factors affect all firms in these industries equally, while others affect strategic groups differently, and thus their current and future market share and profitability. The performance of firms in these industries also depends on strategic choices (e.g., preemptive moves, plant location, and rate of market expansion). This report provides an overview of current and projected structure in these two industries, and speculates on the challenges that firms within these industries face now and in the future. Phase II, Part 1 reviews a previously sponsored ARC study that focuses on the spatial location of establishments and employment in the component elements of the solar and wind industries. The study adopted a commonly used methodology that relates NAICS codes that are associated with manufacturing solar and wind components to establishments in the targeted region. The study identified two distinct geographical patterns: concentration and dispersal; that is, although most jobs and plants are concentrated in a few predominantly urban counties, a significant number of counties have at least one plant within them. At the state level, potential solar and wind employment and plants are found in relatively few states. Pennsylvania, Tennessee, North Carolina, South Carolina, Georgia and New York embrace the lion’s share of employment and plants in the Appalachian region. Pennsylvania alone accounts for 30% of total employment in the two industries. At the county level, a state’s plants and potential employment in the wind or solar industry is concentrated in very few, generally urban counties. In eight of the 13 ARC states, 30% or more of solar-related employment is concentrated in one county. Additionally, single plants rather than small numbers of jobs are found in many counties. Part 2 presents findings from a survey of firms that operate facilities in the ARC region. These firms were identified by using relevant NAICS codes and by consulting industry association websites and published reports that list firms reputed to be in the solar or wind industry. The survey documented the characteristics of the firms (e.g., age, size, corporate structure), their typical means of market entry, their awareness of their competitive context, the extent of their

7
awareness of and need for specific resources, including skilled labor, and the extent of their involvement in international markets. Of the 363 firms in ARC designated counties we contacted in the survey, 72 (20%) reported that they were involved in the solar or wind industry. The survey revealed a limited number of manufacturing firms that were potential suppliers to the solar or wind industry. Manufacturers are generally older, established firms with a small percentage of their domestic or international sales derived from the solar or wind industry. Few reported that the solar or wind industry was the primary function of the business. We found many more service providers that had the capacity to serve as installers or distributors of renewable energy products, primarily to residential customers. The barriers to market entry are lower for them than for their manufacturing counterparts. The workforce of established firms requires specialized training that is transferable between making renewable and non-renewable products. The workforce of emergent firms focuses mainly on installing, servicing, or selling renewable energy products, and requires more general skills development. In Phase II, Part 3, we examine the policy environment in the region on a state-by-state basis and the programs available to stimulate and support the development of renewable energy industries in the region. The states are predominantly emphasizing conventional economic development practices, including tax abatements, location incentives and grant and loan programs. Seven of the 13 Appalachian states have a renewable energy portfolio standard or goal. New York and Pennsylvania have aggressive policies that encourage experimentation and demonstrate a variety of innovative industry-state collaborative approaches to solar and wind energy development. Although nationwide policies that would promote wind and solar industry development have been proposed, nothing has developed thus far. States that do have rapid growth in solar or wind installations and/or manufacturing have introduced a set of mutually reinforcing policies that lower the initial capital outlay for solar or wind installations (e.g., feed-in tariffs, rebates, low interest loans, sales or property tax abatement), have a renewable portfolio standard (usually with a solar or wind set-aside), and/or have energy costs above the national average, thus shortening the payback period for these investments. The highly decentralized policy environment that is characteristic of the U.S. has impeded growth of the renewable energy industry. States have myriad policies that are varied and subject to change. Appalachia, more than other regions of the nation, is unlikely to emerge as a leader in the global renewable energy industry due to insufficient incentives and the general lack of a supportive policy framework that would encourage industry development. The presence of so many firms that could contribute to the wind and solar industry supply chain in Appalachia means that there is a great deal of potential for development of the industry, given the right mix of policies and incentives. In some states, wind energy is at grid parity with conventional energy sources. However, in states with low energy prices, energy efficiency improvements are a more cost-effective way to reduce energy costs and avoid carbon emissions. Thus, it may make sense to focus policy, incentives, and resources on improving energy efficiency in the near term, while continuing to encourage a policy environment that is more conducive for development of the domestic wind and solar industry.

8
PHASE I. INDUSTRY MARKET STRUCTURE, FORECAST, AND POTENTIAL PART 1: THE SOLAR INDUSTRY Demand for Solar Energy Solar cell production grew 85% in 2008; 7.9 gigawatts (GW) were added worldwide. The top five photovoltaic (PV)-producing countries are China, Germany, Japan, Taiwan, and the U.S.1 Cumulative PV power installed worldwide jumped from 9 GW in 2007 to almost 15 GW in 20082. Worldwide photovoltaic (PV) installations reached a record high of 5.95 GW in 2008. Spain led the world in new solar installations in 2008 (2,011 MW); Germany (1,500), United States (342), Korea (274), Italy (258), and Japan (230) follow in that order3. Cumulative installations in the U.S. in 2008 totaled 9,183 MW, an increase of 16% from 2007. California accounted for the lion’s share of installations (178.6 MW). New Jersey was second in installations (22.5 MW). Colorado (21.6 MW) Nevada (14.9 MW) and Hawaii (11.6 MW) are third, fourth, and fifth, respectively4. Germany has one of the highest electricity rates (cost/kWh) in the world, and is heavily dependent on imported oil. That explains why political support in the German parliament was sufficient to enact a strong feed-in tariff in 1999 (revised in 2004 and 2008). The feed-in tariff requires utilities and other power providers to buy renewable energy at above market rates for up to 20 years. Thus, they pay owners of solar panels more for the energy they generate (via rebates) than the owners pay utilities or independent power producers (IPPs) for conventional energy. This subsidy is scheduled to decrease each year in order to encourage the industry to pass on lower costs to the end users. The feed-in tariff in Germany is 0.50-0.60 USD/kWh. It is lower in other EEC countries, but still substantial. Spain’s generous feed-in tariff prompted a huge increase in solar installations during 2008. In September, the government significantly reduced payments under the feed-in tariff and capped annual PV installation from 2009 through 2010, aiming at a target of 3,000 MW by the end of 20105. One might expect demand to be highest where solar is most efficient; for example, where the hours/days of solar radiation per year (i.e., insolation) are highest, but this fact matters far less than government subsidies. Solar insolation in Los Angeles, California is 5.62 KWh/m2/day when a solar array is providing peak output; it is 2.63 kWh/m2/day in Hamburg, Germany6. This clearly suggests that Germany’s current leadership in cumulative solar installations is less related to insolation than it is to subsidies.
1 PHOTON International. (2009, March). Little smiles on long faces. PHOTON International, p. 170. 2 Li, Y. (2009, June 20). Solar Power Experiences Strongest Year of Growth Yet. Worldwatch Institute. 3 LaPedas, M. (2009, March 24). U.S. lags in top 10 solar markets. EE Times. 4 Solar Energy Industries Association. (2009, March). US solar industry year in review. 5 RenewableEnergyWorld.com. (2008, September 29). Spain Makes Changes to Solar Tariff. Retrieved from RenewableEnergyWorld.com. 6 NASA Atmospheric Science Data Center. (2009). NASA surface meteorology and solar energy data set. Retrieved from http://eosweb.larc.nasa.gov/cgi-bin/sse/sse.cgi?+s01#s01

9
In the U.S., investors in solar energy are allowed a 30% investment tax credit (ITC)7. Also most forms of renewable energy are eligible for accelerated depreciation over five years. The Emergency Economic Stabilization Act (October 2008) extended the ITC for eight years, removed the $2,000 cap on residential installations and allowed participation of utilities. The American Reconstruction and Recovery Act (February 2009) provides commercial businesses with a cash payment to cover 30% of the cost of installing solar equipment. The Act also created a fund to provide up to $60 billion in loan guarantees for renewable energy and transmission projects8. Twenty-nine U.S. states and the District of Columbia have renewable portfolio standards (RPSs), which mandate that a certain percentage of renewable energy be available by a specific date9. Five states have renewable portfolio goals (Virginia, Vermont, North Dakota, South Dakota, and Utah). Liberal RPSs include those in California (20% by 2010), New Jersey (20% by 2020 of which 1,500 MW must be solar) and New York (24% by 2013). Some states also offer cash incentives or rebates for solar investments. For example, the California Solar Initiative offers cash incentives up to $2.50 per watt (based on system performance) for installations on existing homes in areas served by specified public utilities. California has set a goal to create 3,000 MW of new solar-produced electricity by 2017 at a cost of $3.3 billion. Solar must be offered as an option on all new homes in 2011. Other states offer a mix of grants, loans and rebates to support the goals of their RPS. Several states also allow renewable energy credits (RECs) to be traded like commodities. REC owners can claim to have purchased renewable energy equal to 1 MWh of electricity that was generated from an eligible renewable energy source. Buyers of RECs (e.g., utilities) raise the cost of producing conventional electricity (to comply with a state’s RPS) and subsidize producers of electricity generated from renewable sources (REC sellers). Subsidies are expected to remain in place in most countries until “grid parity” is reached sometime around 2012. Grid-parity (when the price/kWh for solar is the same as grid-based price/kWh for oil, gas, coal) already exists in California and New Jersey, and in 15% of OECD countries (for peak load rates). Solar demand in the U.S. is highest in areas with the highest price/kWh, e.g., New England ($0.14), Mid-Atlantic ($0.11), and California ($0.12)10. Most north and south central states and southeastern states have low average cost per kWh ($0.06-$0.07), so there are fewer subsidies and less use of solar energy.
7 Database of State Incentives for Renewables & Efficiency (DSIRE). (n.d.). Retrieved August 25, 2008, from http://www.dsireusa.org 8 Solar Energy Industries Association. (2009, March). US solar industry year in review. 9 Database of State Incentives for Renewables & Efficiency (DSIRE). (n.d.). Retrieved August 25, 2008, from http://www.dsireusa.org 10 Think Energy Management. (n.d.). Electricity Costs. Retrieved from http://www.think-energy.net/electricitycosts.htm

10
Solar Energy Technologies
The most common solar energy technology is based on the photovoltaic effect that was discovered by A.E. Becquerel in 1830. This effect occurs in solar cells that are comprised of two layers of semiconducting material: P+ and N-. The boundary between P+ and N- acts as a diode: electrons can move from N- to P+ but not the other way. The voltage difference can be used as a power source. The P+ and N- layers are created by doping silicon or similar materials with boron and phosphorous, respectively. Silicon-based PV cells (mono- and multi-crystalline) made up 87% market share in 2007. Thin-film-based PV cells make up about 13% of market share11. The conversion efficiency (ratio of sunlight to energy produced) of mono-crystalline cells is higher than for multi-crystalline cells12. However, multi-crystalline cells are cheaper to make. The conversion efficiency of thin-film is lower than for silicon-based cells, but they have other advantages. For example, they use much less material – the cell's active area is usually only 1 to 10 micrometers thick, whereas silicon-based cells typically are 100 to 300 micrometers thick. Also, thin-film cells usually can be produced with an automated, continuous production process. Finally, thin-film material can be deposited on flexible substrates (e.g., metal, plastic, glass) that enhance their utility, (e.g., integrated into roofs and windows). Major thin-film producers are: Uni-Solar and EPV Solar (uses amorphous silicon); First Solar (uses cadmium telluride (CdTe)); and Heliovolt, Nanosolar, Miasole (uses copper indium gallium selenide (CIGS)). Thin-film market share is expected to grow to 20% in the next four years13. Finally, concentrator PV or CPV uses Fresnel lenses to concentrate diffuse sunlight onto a smaller, but highly focused cell or module area (Amonix, Concentrix). Solar thermal is another solar energy technology. Concentrating solar power (CSP) uses mirrors to heat fluids and thereby create steam that drives turbines. CSP projects are large-scale and expensive, thus mainly utilities or large power producers use this technology. Different companies use different types of solar thermal technologies, e.g., parabolic troughs (Ausra and Schott Solar), dish-Stirling engines (Stirling Engine Systems), Distributed Power Towers (Luz II). Solar thermal technology can also be used to heat hot water tanks and swimming pools (Heliodyne, Thermomax). Markets and Applications By far, the most common application of solar energy in the U.S. is electricity generation for private and public buildings (94% - See Table 1)14. This percentage includes crystalline-based, thin-film silicon, and concentrator silicon cells and modules15. The remaining 6% of applications include government and industrial, (e.g., street lights, roadside call boxes, telecommunications, water pumps, and health). Also included are space applications, (e.g., satellites).
11 PHOTON International. (2008c, March). The Q factor, Sharp and the market. PHOTON International, p. 140. 12 Solarbuzz.com. (n.d.). Solar cell technologies. Retrieved from http://www.solarbuzz.com/Technologies.htm 13 Bradford, T., Grama, S., Wesoff, E., & Bhargava, A. (2007, August). The future of thin film solar. Greentech Media and Prometheus Institute , 1 (1). 14 Energy Information Administation. (n.d.). Annual photovoltaic module/cell manufacturers survey, Form EIA-63B. 15 Although these figures are for cells and modules, they are a reasonable proxy for installed systems in the U.S. EIA data show that 130,757 kilowatts (39%) were exported.

11
Table 1. Shipments of PV Cells and Modules by Application (peak kW)
Application (end-use) Total (2007) Percent of Total (2007) Electricity Grid Connected 253,101 .902 Off-Grid 10,867 .039Communications 2,836 .010Consumer Goods 589 .002Transportation 4,018 .014Water Pumping 3,852 .014OEMs16 4,802 .017Health 410 .001Total 280,475 100.00
Source: Energy Information Administration, Form EIA-63B, “Annual Module/Cell Manufacturing Survey” On-grid/Off-grid. Utilities and independent power providers (IPPs) generate solar energy from a centralized location (large PV power plant or CSP plant) to customers in relatively populated areas via state or regional grids. In such cases, solar energy generally supplements conventional energy, and is especially useful during peak loads when conventional energy is most expensive. Off-grid applications are more common in rural settings or in developing countries, and for industrial applications such as those mentioned above. In the U.S., 90% of total installed PV systems were on-grid in 200717. Centralized/Decentralized. As previously discussed, on-grid solar energy originates from a central location, but private residences, government agencies or businesses that install small PV solar systems (5-8 kW) on or around their structures are decentralized. If the latter are also off-grid, such systems may need batteries to store solar energy generated during sunlight. Solar energy systems are sold in residential, commercial, industrial, electric power and transportation (See Table 2)18. Crystalline-based systems are used more than twice as often in commercial (50%) and residential (24%) markets. The ratio is nearly identical for thin-film systems; commercial (50%) and residential (25%) (percentages by type are not shown in Table 1). Although the percentages of use of thin-film are small in the remaining markets, its use in the commercial market grew faster than in other markets between 2006 and 2007. This trend is assumed to have continued in 200819. Thin-film may be preferred in commercial applications because it is cheaper to produce, but its lower conversion efficiency means that thin-film installations require more space (i.e., fewer kilowatts generated per square meter). Higher efficiency crystalline-based systems have an advantage in roof-based residential installations, where limited space is more an issue.
16 Original Equipment Manufacturer 17 Energy Information Administation. (n.d.). Annual photovoltaic module/cell manufacturers survey, Form EIA-63B. 18 Energy Information Administation. (n.d.). Annual photovoltaic module/cell manufacturers survey, Form EIA-63B. 19 EIA data for 2008 not available as of November 2009

12
Solar energy systems may be roof-based or ground-based. They also may be retrofitted on existing buildings (e.g., installed on roofs) or integrated into the walls, windows or roofs when buildings are constructed (BIPV or building integrated PV). Major home builders are starting to make solar standard in new construction (e.g., Lennar Homes, Lyon Homes, and Clarum Homes in California). Lennar is the third largest builder in the U.S. Clarum and Lyon are prominent builders in the Western states. Table 2. Domestic Shipments of PV Cells and Modules by Market and Type (peak kW)
Market Crystalline Silicon20
Thin-Film Silicon
Concentrator Silicon
Total (2007) Percent of Total (2007)
Residential 54,793 13,624 -- 68,417 .24Commercial 113,780 26,404 250 140,434 .50Industrial 22,064 10,638 -- 32,702 .11Electric Power 32,682 1,876 737 35,294 .13Transportation 3,627 -- -- 3,627 .02Total 226,946 52,542 987 280,475 100.00Source: Energy Information Administration, Form EIA-63B, “Annual Module/Cell Manufacturing Survey” Industry Participants Manufacturers. The top-fifteen PV cell producers in 2008 were Q-Cells (582 MW), First Solar (504 MW), Suntech (498 MW), Sharp (473 MW), JA Solar (300 MW), Kyocera (290 MW), Yingli (282 MW), Motech (272 MW), SunPower (237 MW), Sanyo (215 MW), Trina Solar (210 MW), SolarWorld (190 MW), Gintech Energy (180 MW), Ningbo Solar (175 MW), and Solarfun (160-180 MW). These fifteen companies produced 4.57 GW, which represents 58% of the world’s PV cell production21. By region, two companies are European, three are Japanese, six are Chinese, two are American, and two are Taiwanese. Three Asian companies became top-fifteen cell producers in 2008 (Trina Solar, Solarfun and Gintech). Two European companies (BP Solar, Isofoton), and one Japanese company (Mitsubishi) dropped out of the top-fifteen. Most of these companies are also major module manufacturers, but a few are “pure play” cell producers. Some are completely integrated from polysilicon to distribution of complete solar energy systems. Others buy from or become partners with suppliers of materials or components along various segments of the supply-chain. Further details on vertical integration will be provided later. Most of these fifteen companies focus mainly on producing crystalline-based cells. First Solar is the only one that uses thin-film material exclusively. Other companies are increasingly adding thin-film cells to their product mix. Sanyo’s cells are hybrids of single crystalline silicon surrounded by ultra-thin amorphous silicon layers. Sharp and Sanyo are planning to build large thin-film solar manufacturing facilities in Japan22. Q-Cells has invested in a number of small thin-film companies, but remains predominately a crystalline-based cell producer.
20 Includes single crystal and cast and ribbon types 21 Dividing this number by total worldwide production of 7900 MW equals 58% (see PHOTON International. (2009, March). Little smiles on long faces. PHOTON International , p. 170.) 22 PV TECH. (2007, November 27). Sanyo and Sharp boost solar cell production in 2008. PV TECH.

13
Polysilicon Suppliers. The top-seven polysilicon producers are Hemlock, Wacker, Tokuyama, MEMC, REC, Mitsubishi, and Sumitomo23. Several also make ingots and wafers (e.g., Wacker, REC, and MEMC). These suppliers are currently in a strong bargaining position because of the very high demand for use of polysilicon in solar cells. The price for solar grade polysilicon has risen substantially since 2004, and has encouraged many new entrants24,25. The U.S. supplies nearly half of the world’s polysilicon production. Hemlock (MI) and MEMC (MO) are based in the US. REC (Norway) owns two facilities in Montana and Washington. AE Polysilicon recently started to produce in Bucks County, Pennsylvania. RSI Silicon, another start-up, plans to begin production in 2009 in Northhampton County, Pennsylvania. One of the key reasons for AE Polysilicon’s investment is that Pennsylvania offered the company over $7 million in low-interest loans and grants in addition to a 13-year tax holiday from most state and local taxes. Also, the company’s CEO said “Try recruiting highly skilled engineers to the middle of nowhere versus the heart of the Northeast near New York City and Philadelphia”26. The shortage and high prices for polysilicon have also led to a significant increase in the number of start-up companies that use thin-film materials. More than thirty companies in the U.S. are actively involved in the commercialization of thin-film PV technologies27. The U.S. currently leads the world in thin-film PV cell production28. Materials, Components, and Equipment Suppliers. A prominent solar industry website, solarbuzz.com, divides solar manufacturers into nine categories: solar process equipment, test equipment, solar materials, cells, module, inverters, batteries, charge controllers, and solar products29. Another website, energy.sourceguides.com, covers six of these nine categories. Table 3 shows the combined number of U.S. firms in each category that is listed on the two websites30. Also shown are the names of firms that are located in counties that the Appalachian Regional Commission recognizes as Appalachian counties. 23 PV News. (2007, May). Polysilicon Update -- Careening Ahead... PV News , 26 (5). 24 PV News. (2007, May). Polysilicon Update -- Careening Ahead... PV News , 26 (5). 25 Solarbuzz.com. (2008). Marketbuzz™ 2008: Annual world solar photovoltaic industry report. Retrieved from http://www.solarbuzz.com/Marketbuzz2008-intro.htm 26 PHOTON International. (2008, April). A brighter future under the sun, p. 48. 27 Winegarner, R. M. (2007). A comprehensive report on the use of silicon wafers, silicon ingot, and polysilicon in the semiconductor industry on a fab by fab basis. Healdsburg, CA: Sage Concepts. 28 Maycock, P., & Bradford, T. (2007). PV Technology,Pperformance and Cost-2007 Update. PV Energy Systems and Prometheus Institute. 29 Solarbuzz.com. (n.d.). Retrieved from http://solarbuzz.com/solarindex.expo.htm 30 Energy Source Guides (www.energy.sourceguides.com) does not have categories for test equipment (separate from process equipment), solar products, and solar materials. For the remaining six categories, the numbers shown in the table reflect elimination of duplicate entries at the two websites. The combined numbers do not represent all U.S. companies in the industry.

14
Table 3. Materials, Components, and Equipment Suppliers in Appalachian Counties
Type of Supplier United States
(Counties) Appalachian Counties (in parentheses)
Solar process equipment31 88 (1) Kurt J. Lesker, Clairton, PA (Allegheny) Solar test equipment 16(1) Thermal Product Solutions, White Deer, PA (Union) Solar materials32 19 (2) AFG Industries, Kingsport, TN; Kurt J. Lesker Clairton, PA (Allegheny) Cells 85 (1) Solar Power, Inc., Belle Vernon, PA (Fayette) Modules
317 (15) PowerQuest Inc., Duluth, GA (Gwinnett); Solairgen Inc., Dahlonega, GA (Lumpkin); Four Winds Renewable Energy, Arkport, NY (Steuben); Great Brook Renewable Energy, South New Berlin, NY (Chenango); Marsland Renewable Energy, Greene, NY (Chenango); Tri-State Life Safety & Electric Systems Inc., Murphy, NC (Cherokee); Friedman & Sun Access Store, Dillsboro, NC (Jackson); Rock Castle Solar Inc., Asheville, NC (Buncombe); Sundance Power Systems, Mars Hill, NC (Madison); Jetstream Power International, Holmesville, OH (Holmes); Solar Power Industries Inc., Belle Vernon, PA (Fayette); Springhouse Energy Systems Inc., Washington, PA (Washington); Big Frog Mountain, Chattanooga, TN (Hamilton); National Solar Supply, Tellico Plains, TN (Monroe); GreenBrilliance, Sterling, VA (Floyd)
Inverters 411 (9) Solairgen Inc., Dahlonega, GA (Lumpkin); Stationary Power Services, Norcross, GA (Gwinnett); SureOn Power Systems, Acworth, GA (Cherokee); Creative Energy Technologies, Summit, NY (Schoharie); Marsland Renewable Energy, Greene, NY (Chenango); Jetstream Power International, Holmesville, OH (Holmes); Motors & Controls International, Hazelton, PA (Luzerne); Big Frog Mountain, Chattanooga, TN (Hamilton); National Solar Supply, Tellico Plains, TN (Monroe)
Batteries 834 (25) Jones Batteries, Clanton, AL (Chilton); Symmetry Resources Inc., Arab, AL (Marshall); Digital Communications Systems, Dallas, GA (Paulding); Solairgen Inc., Dahlonega, GA (Lumpkin); Stationary Power Services, Norcross, GA (Gwinnett); Supreme Battery, Waleska, GA (Cherokee); SureOn Power Systems, Acworth, GA (DeKalb); Superior Battery Manufacturing Company, Russell Springs, KY (Russell); Alternative Traxx, New Berlin, NY (Chenango); Silicon Solar, Sidney, NY (Delaware); Saft American Inc., Valdese, NC (Burke); Command Mobility, Franklin, NC (Forsyth); Douglas Battery Manufacturing Company, Winston-Salem, NC (Forsyth); Progressive Technologies Inc., Pilot Mountain, NC (Surry); Jetstream Power International, Holmesville, OH (Holmes); Batteries Plus, Pittsburgh, PA (Allegheny); A. C. Moore Inc., Pittsburgh, PA (Allegheny); Battery Systems Inc., Washington, PA (Washington); Gorilla Solar Company, East Stroudsburg, PA (Monroe); New Castle Battery Manufacturing Company, New Castle, PA (Lawrence); Suntara Energy, Pittsburgh, PA (Allegheny); The Right Way Solar, Williamsburg, PA (Blair); Compact Solutions, Greenville, SC (Greenville); Radford Enterprises, Marietta, SC (Greenville); Big Frog Mountain, Chattanooga, TN (Hamilton)
Charge controllers 79 (1) Sun Selector, Parkersburg, WV (Wood) Solar products 12 (0)
31 This category includes fused silica crucibles, screen printers, PV cell cutters 32 This category includes pastes, chemicals, glass, Tedlar, EVA, tabbing ribbons

15
Distributors/Installers. A few companies have authorized dealerships or alliances with a limited number of distributors (Kyocera, Sharp, BP Solar). However, most cell and module manufacturers (78%) sell their products to wholesale distributors and installers33. Almost 14% of manufacturers sell directly to end-users. Wholesale distributors and installers vary considerably in size; some have multiple outlets across the U.S. (e.g., Akeena, Sunwize, REC Solar) and others are single-outlet sole proprietorships. Many distributors and installers also buy inverters, charge controllers and batteries from manufacturers and sell complete systems to designers, integrators and installers. Table 4 shows the number of distributors/installers that are listed on solarbuzz.com34 and energy.sourceguide as well as the names of firms that are located in Appalachian counties35.
Table 4. Distributors/Installers in Appalachian Counties
Number of firms Appalachian Counties (in parentheses)
1,458 (U.S.)
41 (Appalachian
Counties)
GreenWorks Design/Build, Blountsville, AL (Blount); Solar Enterprises, Enterprise, AL (Marshall); Advanced Energy Systems Inc., Snellville, GA (Gwinnett); One World Sustainable Energy Corporation, Colbert, GA (Madison); Solairgen Inc., Dahlonega, GA (Lumpkin); Southeast Solar Co., Duluth, GA (Gwinnett); TEC Restorations, Canton, GA (Cherokee); Kentucky Solar Living, Richmond, KY (Madison); Energy Elements LLC, Hagerstown, MD (Washington); Creative Energy Technologies Inc. Summit NY (Schoharie); ETM Solar Works, Endicott NY (Broome); Four Winds Renewable Energy, Arkport, NY (Steuben); Great Brook Renewable Energy, South New Berlin, NY (Chenango); Marsland Renewable Energy, Greene, NY (Chenango); Renovus Energy Inc., Ithaca, NY (Tompkins); Advanced Thermal Solutions, Hendersonville, NC (Henderson); Appalachian Energy Services, Brasstown, NC (Clay); Rock Castle Solar Inc., Asheville, NC (Buncombe); Sundance Power Systems, Inc. Mars Hill and Weaverville, NC (Buncombe & Madison); Surry Solar Services, Mount Airy, NC (Surry); Susten.com Building Energy Solutions, Asheville, NC (Yancey); T-Square Builders Inc., Banner Elk, NC (Avery); Thermacraft Energy Services, Asheville, NC (Buncombe); Tri-State Life Safety & Electric Systems Inc., Murphy, NC (Cherokee); Dovetail Solar and Wind, Athens, OH (Athens); Solar Creations, Holmesville, OH (Holmes); Third Sun Solar and Wind Power, Athens, OH (Athens); Control Alt Energy Inc., Auburn, PA (Schuylkill); Fitch Consulting, Berwick, PA (Columbia, Luzerne); Gorilla Solar Company, East Stroudsburg, PA (Monroe); Heat Shed, Inc., Revere, PA (Somerset); K.C. Larson Inc., Williamsport, PA (Lycoming); Rick Bowmaster Construction, Bellefonte, PA (Centre); Solair Energy Ralson, PA (Lycoming); Springhouse Energy Systems, Washington, PA (Washington); Sunspot Solar & Heating, Delaware Water Gap, PA (Monroe); Suntara Energy, Pittsburgh, PA (Allegheny); The Right Way for Solar, Williamsburg, PA (Blair); Solar Heating Specialists, Blacksburg, SC (Cherokee); Sunstore Energy Solutions, Greer, SC (Greenville); Big Frog Mountain, Chattanooga, TN (Hamilton)
33 Energy Information Administation. (n.d.). Annual photovoltaic module/cell manufacturers survey, Form EIA-63B. 34 Solarbuzz.com. (n.d.). United States Solar Organizations. Retrieved from http://www.solarbuzz.com/companylistings/unitedstates.htm 35 The number (1,458) may reflect duplicate entries at the two websites, and thus may be lower than is shown.

16
Public or investor-owned utilities develop large-scale systems or buy completed systems from developers or IPPs and then sell the solar energy that is generated to end-users. Xcel Energy operates the largest PV-based and utility-supported solar energy system in the U.S. (8.2 MW). It is located in Alamosa, Colorado and was financed, built, and will be maintained by SunEdison36. The largest PV-based system in the Eastern United States (3.7 MW) is being built in Falls Township, Pennsylvania for Exelon by Conergy subsidiaries, Epuron and SunTechnics. It started operations in November 200837. Developers/IPPs/financiers invest in and/or develop large-scale solar systems (e.g., SunEdison, MMA Renewable, Epuron, GE Energy Financial Services). After completion, they may sell a large centralized system to a utility or sell the energy that the system produces via a long-term (15-20 years) power purchase agreement (PPA). A similar arrangement exists for consumers who have residential and small commercial systems. If they own their system, they can sell in some countries any excess energy to a utility for a rebate on their monthly bill. Alternatively, they can allow an IPP to install and maintain a system on their premises and then pay the IPP a rate per kWh for the electricity they use. Photovoltaic (PV) Supply Chain The most common solar energy system consists of PV cells that are connected and encased in modules that in turn are connected, configured, and mounted on a roof or the ground. The supply chain for other types of systems, (e.g., solar thermal), will not be discussed in this paper38. The supply-chain for crystalline-based systems typically includes polysilicon, ingots, wafers, cells, modules, systems, and distribution, as shown in Figure 1. Some new manufacturing methods for producing crystalline-based cells eliminate the need for shaping and cutting ingots, going directly from ribbons of liquid silicon to wafers, (e.g., Evergreen’s use of String Ribbon Technology). Suppliers of manufacturing equipment and ancillary raw materials, (e.g., paste, acids, Tedlar, EVA), sell products for use in relevant supply-chain segments39. Suppliers also sell system components such as inverters that convert DC electrical current into the AC current, charge controllers, ground-based or roof-based mounting systems, and storage batteries.
36 Sun Edison News Press Release. (2007, December 17). SunEdison activates largest U.S. photovoltaic power plant for Xcel Energy. 37 Commonwealth of Pennsylvania. (2007, August 30). Governor Rendell says largest solar power facility in eastern U.S. will be built in Bucks County. Retrieved from http://www.state.pa.us 38 Solar thermal systems include concentrating solar power (CSP) and hot water heating. CSP installations require significant sunlight and acreage, both of which are plentiful in the Southwest where virtually all installations are currently being planned. Solar thermal hot water heating is a highly fragmented industry with low entry barriers and localized manufacturing. It doesn’t appear to offer a unique economic development opportunity for Appalachia. 39 The Purchasing Department at BP Solar in Frederick, MD indicated that supplies for manufacturing solar cells include glass, ethylene vinyl acetate (EVA), back-sheet, aluminum frames, wires, connectors, sodium hydroxide, hydrochloric acid, hydrofluoric acid (personal communication, July 2009).

17
Figure 1. PV Solar Supply-Chain Thin-film cells start with different raw materials, (e.g., cadmium telluride, amorphous silicon), and use different manufacturing processes. For example, cells do not start with ingots and wafers; instead the raw material is deposited onto substrates of metal, plastic, or glass. Most thin-film cells are placed in modules, but BIPV products are often shaped directly into roof tiles, windows or walls. Although many companies survive and prosper as specialists in one or more of the above seven supply-chain segments, for reasons to be discussed shortly, they often don’t remain specialists for extended periods of time. Specialist companies are acquiring or are being acquired by other companies upstream or downstream in the supply-chain, or forming strategic partnerships with them. Competitive Strategies Capacity Expansion. The manufacture of PV cells requires significant capital investment, (e.g., $100-200 million to build a 100 MW plant)40. This is true for manufacturing cells composed of silicon or thin-film material. In either case, the cost per watt can be reduced substantially by spreading fixed costs over more units. Virtually every industry incumbent has announced capacity expansion plans for 2008-2010; much of the investment in new capacity will be made in countries that offer significant incentives for renewable energy production, and in low wage countries in Eastern Europe and Asia41. Also, the experience curve reduces production costs (e.g., throughput, yield) by 18-20% for every doubling of production volume. Consequently, most of the major PV cell manufacturers have been expanding capacity rapidly. Minimum efficient scale raises entry barriers for potential new entrants. Larger scale also enhances a firm’s bargaining position when purchasing raw materials from suppliers. Plant Location. The typical configuration of plants among the largest cell and module manufacturers is to produce cells in the home country, usually at or near headquarters where R&D facilities tend to be located. If expansion is required, companies usually build more labor-intensive module assembly plants in low wage countries. Because the dollar value added per unit weight is low, transportation costs are also relatively low, so it pays to manufacture in low-cost regions and ship to where the product is used. Also, U.S. export growth is limited by China’s requirement that at least 80 percent of components used in its solar and wind projects be made in China. World Trade Organization rules ban use of local content requirements that force companies to set up factories in a country instead of exporting to it. However, China has not signed the W.T.O. agreement on government procurement and is technically exempt, even
40 Solarbuzz.com. (n.d.). Solar cell manufacturing plants. Retrieved from http://www.solarbuzz.com/Plants.htm 41 Government incentives play a critical role in plant location. For example, the Malaysian government provided a 15-year income tax holiday as an incentive for First Solar's investment in Malaysia. The Philippine government guaranteed SunPower a “reasonably priced” steady supply of electricity to the plant.
Ingots Polysilicon Wafers Cells Modules Systems Distribution
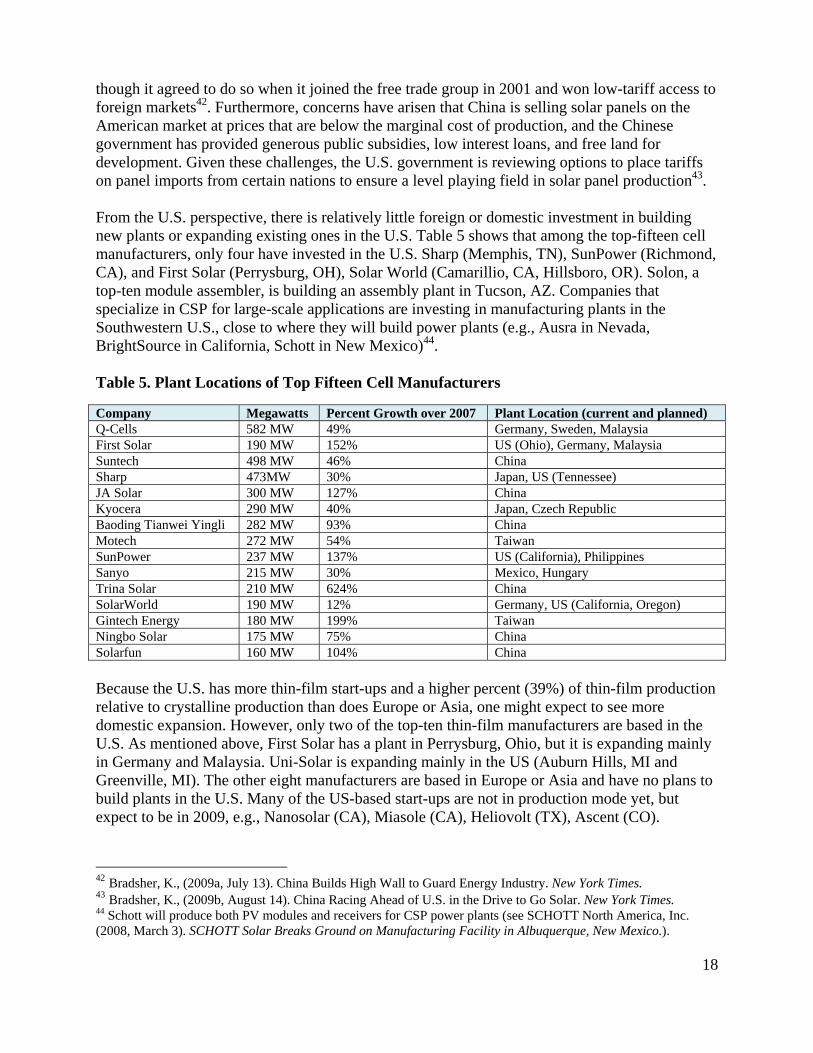
18
though it agreed to do so when it joined the free trade group in 2001 and won low-tariff access to foreign markets42. Furthermore, concerns have arisen that China is selling solar panels on the American market at prices that are below the marginal cost of production, and the Chinese government has provided generous public subsidies, low interest loans, and free land for development. Given these challenges, the U.S. government is reviewing options to place tariffs on panel imports from certain nations to ensure a level playing field in solar panel production43. From the U.S. perspective, there is relatively little foreign or domestic investment in building new plants or expanding existing ones in the U.S. Table 5 shows that among the top-fifteen cell manufacturers, only four have invested in the U.S. Sharp (Memphis, TN), SunPower (Richmond, CA), and First Solar (Perrysburg, OH), Solar World (Camarillio, CA, Hillsboro, OR). Solon, a top-ten module assembler, is building an assembly plant in Tucson, AZ. Companies that specialize in CSP for large-scale applications are investing in manufacturing plants in the Southwestern U.S., close to where they will build power plants (e.g., Ausra in Nevada, BrightSource in California, Schott in New Mexico)44. Table 5. Plant Locations of Top Fifteen Cell Manufacturers
Company Megawatts Percent Growth over 2007 Plant Location (current and planned) Q-Cells 582 MW 49% Germany, Sweden, Malaysia First Solar 190 MW 152% US (Ohio), Germany, Malaysia Suntech 498 MW 46% China Sharp 473MW 30% Japan, US (Tennessee) JA Solar 300 MW 127% China Kyocera 290 MW 40% Japan, Czech Republic Baoding Tianwei Yingli 282 MW 93% China Motech 272 MW 54% Taiwan SunPower 237 MW 137% US (California), Philippines Sanyo 215 MW 30% Mexico, Hungary Trina Solar 210 MW 624% China SolarWorld 190 MW 12% Germany, US (California, Oregon) Gintech Energy 180 MW 199% Taiwan Ningbo Solar 175 MW 75% China Solarfun 160 MW 104% China Because the U.S. has more thin-film start-ups and a higher percent (39%) of thin-film production relative to crystalline production than does Europe or Asia, one might expect to see more domestic expansion. However, only two of the top-ten thin-film manufacturers are based in the U.S. As mentioned above, First Solar has a plant in Perrysburg, Ohio, but it is expanding mainly in Germany and Malaysia. Uni-Solar is expanding mainly in the US (Auburn Hills, MI and Greenville, MI). The other eight manufacturers are based in Europe or Asia and have no plans to build plants in the U.S. Many of the US-based start-ups are not in production mode yet, but expect to be in 2009, e.g., Nanosolar (CA), Miasole (CA), Heliovolt (TX), Ascent (CO).
42 Bradsher, K., (2009a, July 13). China Builds High Wall to Guard Energy Industry. New York Times. 43 Bradsher, K., (2009b, August 14). China Racing Ahead of U.S. in the Drive to Go Solar. New York Times. 44 Schott will produce both PV modules and receivers for CSP power plants (see SCHOTT North America, Inc. (2008, March 3). SCHOTT Solar Breaks Ground on Manufacturing Facility in Albuquerque, New Mexico.).

19
Market Expansion. In tandem with capacity expansion is a parallel drive to expand markets rapidly to new applications, new regions, and new customers. Installations are currently highly geographically concentrated. Sixty-six percent of worldwide installations are in Spain and Germany. Within the U.S., 69% of grid-tied installations in 2008 were in California and New Jersey45. These countries and American states served as platforms for scale economies and learning. Now that costs are lower, significant opportunities must be found for geographical expansion. As will be discussed, companies are finding new applications in new regions. For example, developing countries offer opportunities for off-grid application due to lack of infrastructure (e.g., Kyocera Isofoton). Off-grid applications still account for greater shares of new and existing installed capacity in more than 50% of countries46. Also, most industrial applications are off-grid (e.g., transportation, communications). Some companies are finding opportunities in BIPV, especially in thin-film materials because of the flexibility in shaping them for use in walls, ceilings and roofs. Acquisition, Partnerships, Long-Term Agreements. The need for reliable suppliers and customers has stimulated considerable vertical integration (backward and forward) and/or encouraged partnerships, and long-term agreements (see Appendix I). For example, polysilicon shortages prompted REC (Norway) to acquire two U.S. polysilicon producers in Montana and Washington. DC Chemical (South Korea) acquired a 15% stake in U.S.-based Evergreen Solar in a supply pact that runs through 2014. Also, Suntech Power (China) signed a 10-year supply pact with MEMC (U.S.), which received a warrant equal to a 4.9% stake in Suntech. Motech Industries (Taiwan) entered into a strategic five-year supply agreement with AE Polysilicon (U.S.), which is developing an innovative process for the production of polysilicon feedstock. The fifteen largest PV cell manufacturers that were mentioned earlier vary in their degree of vertical integration. Sharp, Kyocera, BP Solar, and SolarWorld are the most integrated of the companies that focus heavily on residential and/or commercial markets. First Solar, SunPower, and Yingli are the most integrated of the companies that focus on large-scale utilities and industrial markets. Suntech and Ningbo are the least integrated companies in their respective targeted markets. Three companies are “pure play” cell manufacturers that sell most or all of their production to OEMS; JA Solar, Motech and Q-Cells. Depending on how backward integrated they are, they secure reliable supplies of polysilicon, ingots, and/or wafers via joint ventures and long-term contracts. At the systems integration and distribution end of the supply-chain, PV cell manufacturers have sought to develop better access to customers through acquisition or partnership. SunPower acquired developer Powerlight for access to new production homes and to authorized dealers for access to the retrofit market. Powerlight also develops large-scale power plants. First Solar acquired Turner Renewable Energy, which designs and deploys commercial solar projects for utilities and Fortune 500 companies in the U.S. Suntech acquired Japanese BIPV producer MSK. MSK provides customer-tailored PV products that give an esthetic finish to a building by replacing conventional building materials. Suntech also obtained a license from Akeena Solar to
45 Solar Energy Industries Association (SEIA), (2009, March). U.S Solar Industry Year in Review, 2008. 46 Open Energy Technology Bulletin. (2004, June). International Energy Agency, Special Issue IEA Photovoltaic Power Systems Programme, No 19-23.

20
manufacture and distribute Akeena’s patented solar panels. These panels have lower installation costs because of built-in wiring, grounding and racking. The types of customers to which these top-fifteen producers sell systems explain differences in their acquisition and partnership targets. For example, acquisitions made by SunPower and First Solar allowed them to work directly with the customers who will ultimately use their products. Powerlight and Turner Renewable Energy both design and develop large-scale systems. Sharp, Kyocera, and BP Solar focus mainly on residential and small-scale commercial systems, and thus leave system integration and installation to their network of authorized dealers. Technological Innovation. All fifteen manufacturers are investing heavily in R&D to reduce cost/watt. Opportunities for cost reduction exist throughout every segment of the value chain. Q-Cells estimated that investment in cost reduction research in silicon, wafers, cells, modules, and balance of systems has a cumulative cost reduction impact of 40-50%47. Sun Power has drawn a similar conclusion48. Also, the number of patents that surround innovation in each segment is a strong deterrent to new entrants.
Efficient manufacturing processes. Research is being undertaken to find ways to make each production step more efficient or to reduce the number of steps in the production process. For example, Q-Cells makes wafers using String-Ribbon Technology (obtained through EverQ, its joint-venture with Evergreen Solar and REC). With this process, liquid silicon is drawn through two super-heated carbon or quartz fibers or stings. A thin skin is formed between these two strings, which crystallizes into a broad band – the ribbon – when it cools. The ribbon is then cut into square wafers. There is no need to melt ingots and then cut them into wafers, which wastes up to 40 % of the silicon that is used. Solar World is experimenting with a similar process called Ribbon Growth on Substrate. Recycling silicon. Most companies recycle used silicon and if their manufacturing process requires sawing ingots into wafers, they invest in equipment that allows less kerf loss during the sawing process. Kerf is the material lost due to the width of the saw blade’s cut.
Reducing wafer thickness. All manufacturers of crystalline cells are undertaking research to reduce wafer thickness. Thinner wafers reduce the consumption of polysilicon. Q-Cells is testing wafers with a thickness of 160 μm, and expects to reduce thickness to 130 μm by 2010. SolarWorld also expects to reduce thickness from 210 μm to 160 μm. Raising the conversion efficiency of cells. The average cell conversion efficiency is 18-22% for silicon and 8-12% for thin-film49. Higher efficiency cells reduce the number of cells needed per module and the number of modules per system. This in turn reduces total system cost and the area required to install a system. The conversion efficiency of PV cells is enhanced by improving their surface properties so that the infrared and ultraviolet rays captured are more fully utilized,
47 Milner, A. (2006, April). International Advanced Photovoltaic Manufacturing Technology Conference. Munich, Germany. 48 Werner, T. (2006). Letter to Stockholders, SunPower Annual Report. 49 Wikipedia. (2008, June 1). Solar cell. Retrieved from en.wikipedia.org/wiki/Solar-cell

21
and reducing light shading by narrowing the metal grid in the front of a PV cell. Theoretical limits are calculated to be 33% for silicon cells and 28% for thin-film cells50. Increasing wafer size. Similar to semiconductor chips, unit costs can be reduced by increasing wafer size. Since more cells can be cut from a larger wafer, the material unit cost of a cell goes down with increasing wafer size. Q-Cells expects to increase wafer size from 156 mm x 156 mm to 210 x 210 mm or larger by 201051. Automating the assembly of solar modules and panels. The assembly of modules and panels involves encapsulating them between tempered glass and EVA (ethyl vinyl acetate). The entire laminate is installed in an anodized aluminum frame for structural strength and ease of installation. Reducing installation costs. Installation cost is the largest contributor to total solar system cost, mainly due to time and labor. SunPower estimates that 50% of total installed system cost is in installation52. SunPower nearly pre-assembles product to minimize onsite construction costs. Sharp reduces the cost of installation with OnEnergy, which uses a simplified, flexible mounting system to improve both the speed of installation and aesthetics. Systems can be configured online and shipped to the installation site. Akeena also simplifies installation and focuses on esthetics, which play an important role in non-flat roofs and non-penetrating installation. Strategic Groups Strategic groups provide “an intermediate frame of reference between looking at the industry as a whole and considering each firm separately”53. Such groups consist of companies that make similar choices regarding degree of vertical integration and what markets to enter. Other choices are possible, (e.g., technology leadership, diversification), but the above two choices are the most prominent. According to Porter54, the more strategic groups in an industry and the greater the strategic distance (on multiple dimensions) between them, the more intense the competition in the industry (e.g., on price, product performance, branding), especially if each group targets the same markets for a substantial percentage of its sales. In an emerging industry, like solar, mobility barriers between strategic groups are weak (e.g., insufficient economies of scale and branding) and strategic groups tend to pursue overlapping target markets. As industries mature, mobility barriers between strategic groups tend to strengthen, which can stabilize industry competition if it leads these groups to start pursuing separate target markets. Testing these assumptions is beyond the scope of this paper. However, it is appropriate to speculate on the likely direction in which the industry might develop.
50 Ayres, R. U., (Ed.) & Weaver, P. (Asst. Ed.) (1998). Eco-restructuring: Implications for sustainable development. New York: The United Nations University. 51 Milner, A. (2006, April). International Advanced Photovoltaic Manufacturing Technology Conference. Munich, Germany. 52 Werner, T. (2006). Letter to Stockholders, SunPower Annual Report. 53 Porter, M. E. (1980). Competitive Strategy. New York: The Free Press. 54 Porter, M. E. (1980). Competitive Strategy. New York: The Free Press.

22
The top-fifteen PV cell manufacturers produce products that look superficially similar and perform similar functions55. For the purpose of this paper, we will focus on these companies’ primary targeted market. It is clear, however, that some of these companies sell products in more than one market, e.g., sell modules to distributors or installers and cells to original equipment manufacturers (OEMs). There is not space to offer details on the dynamics of the market of every supply-chain segment. Three of the fifteen companies are “pure play” cell manufacturers, and the other twelve companies are part of larger companies that sell modules or integrated systems. They may sell their products directly to end-users (e.g., large-scale utilities) or rely on independent distributors and installers. A review of their annual reports, websites, and industry newsletters suggests that four strategic groups are identifiable among these fifteen manufacturers. Two companies, both Chinese, do not fit easily into any of these strategic groups56. The first strategic group consists of Solar World, Kyocera, Sharp, and BP Solar. These four companies are integrated across six or seven supply-chain segments, (i.e., polysilicon and/or ingots to systems and/or distribution)57. They produce or at least brand some of their own system components, e.g., invertors, racks. They have an authorized dealer network and focus heavily on the residential market. Kyocera and BP solar are wholly-owned businesses within much larger and diversified companies. BP Solar and Sharp are active in the building-integrated photovoltaics (BIPV) market, which focuses mainly on new construction, but also can be used for retrofits. BP Solar recently entered this market by partnering with OCR Solar & Roofing. Both companies’ products can be integrated into roofs of buildings (e.g. shingles), and if made from translucent material, they can be used for skylights and windows. The second strategic group consists of Isofoton, Mitsubishi, and Sanyo. These three companies are integrated across four or five segments, (i.e., ingots to modules). They rely heavily on independent distributors and installers to integrate their modules into systems and sell them to end-users. Their websites suggest their products are used more in commercial than residential markets, but definitive data are lacking. Differences in targeted markets generally are not apparent at the module level, and these companies do not undertake systems integration themselves. Sanyo sells its products through Conergy and Sunwize, which integrate them into systems and sell them through their own sales network. Conergy, for example, uses Sanyo modules in its large-scale utility projects. The Mitsubishi website lists fourteen installers of its products. Some sell Mitsubishi products exclusively and others sell other companies’ products.
55 The following analysis was done for the top-fifteen PV cell manufacturers in 2007 as data on the top-fifteen producers in 2008 were not available when this analysis was performed (in late 2008). Conclusions are not expected to vary significantly for 2008 data. 56 Each of the two companies could be viewed as a strategic group by itself, indicating that there are actually six strategic groups in this industry. Both Chinese companies have grown dramatically in recent years and they eventually may position themselves more like companies in one of the larger groups that focus on residential and/or commercial target markets. 57 Companies in strategic groups have the same number of integrated segments, but may vary in which ones are integrated. For example, BP Solar is more integrated upstream than is Kyocera (polysilicon), but Kyocera is more integrated downstream (distribution). The exact configuration of segments may be more or less important depending on the specific hypotheses that are formulated and tested.

23
The third strategic group consists of First Solar, Yingli, and SunPower. These companies are highly integrated (six or seven value-chain segments) and focus mainly on large-scale utility and commercial projects. Their customers are project developers that typically sell turnkey systems to IPPs or utilities. SunPower and First Solar recently forward integrated by acquiring developers so that they could directly access these customers. SunPower acquired Powerlight and First Solar acquired Turner Renewable Energy. Each company has a highly concentrated customer base. For example, SunPower had two customers that accounted for 49% of sales in 2006 (Conergy, Solon). First Solar had six customers (German) that accounted for 90% of sales in 2006. Its customer base expanded in 2008 to fourteen and now includes Spanish, French, Australian, and American companies. SunPower is more diversified than First Solar. It also makes and sells modules and BIPV products for residential and small commercial markets. It sells these products in the retrofit market though authorized dealers and partners with major home builders (e.g., Lennar) for new construction. Yingli has completed several large projects in Germany, Spain, Portugal, and China. Like First Solar and SunPower, Yingli also has a limited customer base. Its top five customers accounted for 83% of total outstanding accounts receivable in 2007. The fourth strategic group consists of JA Solar, Q-Cells, and Motech. These three companies are “pure play” cell manufacturers, that is, they only make cells for original equipment manufacturers (OEMs) that integrate them into modules and systems. They buy wafers from suppliers and sell their product to companies that manufacture modules. Motech recently integrated backwards by acquiring AE Polysilicon. Motech and Q-Cells are pursuing very different expansion paths. For example, Motech focuses on low cost production and broadening its line of crystalline PV modules. Q-Cells is a technology leader and leverages its expertise in crystalline PV cells to the development and manufacture of cells using a variety of thin-film materials. It also entered into a three-way joint venture with REC and Evergreen Solar (called EverQ) to make crystalline cells using Evergreen’s patented String-Ribbon Technology. It is noteworthy that the two companies that didn’t fit into any strategic group are Chinese. As suggested in footnote 56, this pattern may be transitory. Their cell and module operations have grown rapidly, and if they vertically integrate as many companies have, then Suntech might join the first strategic group, and Ningbo might join the fourth group. Alternatively, they may choose to remain where they are because their current position is attractive. It is too early to draw conclusions about this. Suntech is much different than Ninbo. It is one of the world’s largest solar cell producers and may become the largest by 2009 or 2010. Ningbo is older than Suntech, but Ningbo is more diversified and has much smaller production capacity, but is growing rapidly. Chinese companies in general share some advantages in the world solar market. They are well-financed by IPOs or private equity. Their net margins are good (10-30%), driven by low-cost labor and low tax rates58. They also buy low cost Chinese manufacturing equipment or buy the latest technology from American or European suppliers. Also, strong government incentives encourage solar system installations in China, thereby stimulating domestic demand. All of these factors have encouraged Chinese companies to expand capacity aggressively. Growth has been constrained and excess capacity has been high, however, mainly due to lack of long-term supply contracts for polysilicon, and payment of high spot market prices. This constraint has stimulated significant investment in polysilicon startups in China59. If, as expected, polysilicon shortages 58 PHOTON International. (2006, January). China’s rapid ascent, p. 60. 59 PHOTON International. (2007, June). China’s Rapid Ascent II: Catching Europe, p. 136.

24
ease by 2010, Chinese cell and module manufacturers may become the world’s lowest cost producers and be placed very well for continued expansion60. Figure 2 shows thirteen of the fifteen PV solar companies organized into four strategic groups and positioned according to their level of integration and primary target market (grid-connected applications). The remaining two companies are also positioned in the figure. The symbols that characterize the strategic groups differ to aid visualization of their relative strategic position in the industry. Each strategic group is positioned to reflect the target market that is its primary focus, although companies within it may also compete in other target markets61. Figure 2. Strategic Groups - PV Solar Industry
60 BP Solar announced that it will transfer solar module assembly operations in Frederick, MD to its joint venture partners in China and India in order to reduce unit costs by 25% in 2010. This will result in laying-off 140 workers. Cheyney, T. (2009, April 1). Headline blues: BP Solar puts ‘cost reduction’ spin on job cuts as ‘third-party’ deal looms, Retreived from http://www.PV-Tech.org. 61 Appendix I includes profiles of solar energy industry companies by strategic group.

25
Future Directions The rapid capacity expansion by so many PV cell manufacturers at once may lead to an oversupply of PV cells in 2010. The worldwide recession of 2009 increases this risk, but the recent eight-year extension of the ITC in the U.S. reduces it. Sustained or enhanced incentives in other regions of the world also may reduce the risk of oversupply. As noted previously, PV cell production reached 7.9 GW in 2008, up from 4.28 GW in 2007 (85% increase)62. One solar PV website estimated worldwide PV production capacity to be 16.8 GW and capacity utilization at 64% at the end 2008. The latter figure is up from 40% in 2007. Cell production utilization is estimated to be 40%, 48% and 65% in 2010, 2011 and 2012 respectively63. The capacity expansion will come primarily from incumbents that produce silicon-based cells, not from new entrants. The scale economies that encourage production expansion also raise barriers for new entrants. The rate of expansion could be moderated by the current shortage of polysilicon, which may last until 2010. Most new entrants are assumed to use thin-film materials. The first strategic group may maintain or increase profitability because its companies can brand their products and differentiate them by esthetics and ease of installation, and capture more profits in the supply-chain by selling its products directly to end-users at retail prices. They also may lower operating costs by avoiding “middle-man profits” along their integrated supply-chain. The companies in the second strategic group sell most of their products to distributors at wholesale prices, so don’t capture profits from the systems integration and distribution supply-chain segments. Also, they may face a greater challenge in differentiating their modules. As one might expect, it is very difficult to determine or explain the profitability of specific businesses in large diversified companies. Thus these profit conjectures must remain unanswered for now. The companies in the second strategic group had the slowest rate of cell production growth (19%) compared to the average cell production for all fifteen companies (69%). All three companies dropped in rank among the top-fifteen producers in 2007 compared to 2006. The companies in the first group had slightly higher growth (27%), mainly because of SolarWorld (89%). Sharp actually had negative growth (-16%)64. Six of the seven companies of the combined groups are part of large diversified companies (exception is SolarWorld), which may be investing at a slower rate in this industry than are non-diversified companies. Also, Sharp and Sanyo had unutilized capacity due to polysilicon shortages and both are investing heavily in thin-film capacity, which will not be on-line until 201065. Both factors may have contributed to lower growth rates in cell production for these companies in 2007 and 200866. Companies in both strategic groups will face continuing pressure from thin-film products, which have a broader range of applications than crystalline products. There may be more growth opportunity in the new construction market than in the retrofit market. Even with all the existing incentives, owners of residential and commercial property still have to make a relatively large
62 PHOTON International. (2009, March). Little smiles on long faces. PHOTON International, p. 170. 63 PV Society. (2009, July 6). Waiting for Better Solar Alignment. Retreived from http://www.PVSociety.com 64 PHOTON International. (2008c, March). The Q factor, Sharp and the market. PHOTON International, p. 140. 65 PV TECH “Sanyo and Sharp to boost solar cell production in 2008” 27 November 2007 66 Data for 2008 (see Table 5) is consistent with assessment of these strategic groups. Average cell production for Sanyo, Sharp, Kyocera and Solar World is only 28% versus average cell production for all fifteen companies (69%). BP Solar, Isofoton, Mitsubishi are no longer among the top-fifteen producers.

26
capital investment to install solar systems on their roofs. The cost of solar systems for new construction, conventional or BIPV, can be wrapped into a 30-year mortgage and the interest deducted. This makes use of solar systems in new construction a very attractive option. Also thin-film material offers new opportunities for BIPV use due to more versatility in applications in walls, windows, and ceilings. BIPV applications in new construction suggest a need to develop new distribution and sales channels. Building contractors are as likely as distributors and installers to be customers. Architects who design buildings will need to learn how to design for BIPV applications, and contractors and their employees will need to be trained in how to install them. The initiative and expense for such training may fall on members of this strategic group. The third strategic group had the highest growth of cell production (195%). Companies in this group compete not only against each other, but also against companies that develop concentrated power systems (CPS). The kW/h generated by CPS is considerably larger than generated by any PV facility. For example, Acciona Energy has a CPS project in Nevada that will generate 64 MW, and Ausra’s in California will generate 177 MW67. By comparison, the largest PV-based system in the U.S. at Nellis Air Force Base generates 17 MW from 70,000 panels68. CPS is difficult to match on a cost per kW/h basis69. CPS is more likely to compete with wind farms for utility-based projects. PV-based systems will intensify their focus on large-scale solar commercial projects, where esthetics and land-use are as important as cost70. The fourth strategic group had the second highest overall production growth rate in 2007 (159%)71. Their expansion plans suggest that they may contribute to the oversupply discussed earlier. China became the number one producer of solar cells in 2007, and currently exports 90% of its production, mainly to Germany and Spain72. The firms in this strategic group may benefit from the heavy industry focus on cost reduction until cost/kWh reaches grid parity. Costs undoubtedly will continue to go down afterwards. However, these companies will need to learn how to compete on the basis of differentiation and gain further supply-chain economies by integrating forward into module manufacturing, as Suntech did. Q-Cells is different from the other two companies in this group. Although it is concerned with cost reduction, it also plans to grow by leveraging its development and manufacturing expertise in crystalline cells for application to thin-film materials. 67 Kho, J. (2007, November). Ausra to build 177-megawatt solar-thermal plant. Greentech Media. 68 Metaefficient: The Optimal Green Guide. (2007, December 28). North America's largest solar-electric plant switched on. Retreived from http://www.metaefficient.com. 69 Although the relative advantage of CPV versus PV in cost per KW/remains in 2009, the gap has narrowed considerably. Also, First Solar (688 MW) and SunPower (250 MW) have utility-scale projects in advanced development in California that when completed will easily eclipse in size the Nellis AFB facility and approach the scale of CPS. See PHOTON International. (2009, March). From pipe dream to pipeline. PHOTON International, pp. 14-21. 70 CPS has a slight advantage in land area required, but PV has a clear advantage in water usage - unless CPS goes to dry cooling, Ibid. See PHOTON International. (2009, March). From pipe dream to pipeline. PHOTON International, pp. 14-21. G. Hering 71 This strategic group remained the second highest growth cell producer in 2008 (77%) and the third group retained its position as highest growth cell producer (127%). Initial assessment of the newcomers to the top-fifteen producers suggests the following provisional assignments to strategic groups; Trina Solar (#3), Gintech Energy (#4), and Solarfun (#2). If confirmed, then strategic groups 3 and 4 will retain their 2007 ranks in 2008. The result for strategic group 2 is inconclusive because growth data for the top fifteen drop-outs, Mitsubishi and Isofoton, are unavailable. 72 PHOTON International. (2008c, March). The Q factor, Sharp and the market. PHOTON International, p. 140.

PART 2: THE WIND INDUSTRY
Demand for Wind Energy Wind installations worldwide grew by about 29% in 2008; 28,190 MW were added73. Cumulative worldwide generating capacity in 2008 was 120,800 GW74 and is projected to be 287,000 MW by 2012. This represents an average annual growth rate of 20.7%75. The top five countries in wind capacity additions in 2008 were the U.S. (8,545 MW), China (6,300 MW), India (1,800 MW), Germany (1,665 MW), and Spain (1,609 MW)76. In 2008, the U.S. overtook Germany as the world leader in cumulative installed capacity (25,369 MW)77; Germany, Spain, China and India follow in that order. In 2008, the capacity addition of 8,545 MW in the U.S. represents an overall growth rate of 51% over 2007 (16,823 MW)78. The top five U.S. states in capacity additions were Texas (2,671 MW), Iowa (1,600 MW), Minnesota (456 MW), Kansas (450 MW) and New York (407 MW)79. The top five states in cumulative capacity were Texas (7,118 MW), Iowa (2,791 MW), California (2,517 MW), Minnesota (1,754 MW), and Washington (1,447 MW)80. Policies that Stimulate Demand for Wind Energy Feed-in Tariffs stimulate demand for renewable energy systems by providing system owners with a steady stream of income over a fixed term that is sufficient to recover system costs and make a profit. Many European Union countries have national feed-in tariffs to promote the development of renewable energy (Germany, Austria, Spain, Portugal, France, and Greece). Ontario, Canada has a feed-in tariff and six U.S. states are considering legislation to introduce them (California, Michigan, Minnesota, Illinois, Rhode Island, Hawaii)81. National feed-in tariff legislation also has been introduced82. Typically, feed-in tariffs guarantee owners of renewable energy systems a connection to the electrical grid, and require utilities to pay a premium rate to the system owners so that they can earn a reasonable profit over a fixed term, usually 15-20 years. The premium rate varies by technology to insure that each renewable energy type can profitably be installed and operated83. Utilities spread these added premium costs across all of their customers, thus raising prices for conventional energy. The guaranteed price decreases over time as scale economies lower renewable energy costs and encourage energy system innovation. Feed-in tariffs tend to favor distributed systems that are owned by private residents, small businesses, or communities. This preference is explicit in legislation in California and
73 Global Wind Energy Council (2009). Global Wind Report 2008; BTM Consult (2009). World Market Update 2008. 74 Global Wind Energy Council (2009). Global Wind Report 2008 75 BTM Consult. (2008). International Wind Energy Development, World Market Update 2007, Forecast 2008-2012 76 Wiser, & Bolinger. (2008). Annual report on U.S. wind power installation, cost, and performance trends: 2007. U.S. Department of Energy, Energy Efficiency and Renewable Energy; Global Wind Energy Council (2009). Global Wind Report 2008; American Wind Energy Association (2009) Annual Wind Industry Report Year Ending 2008. 77American Wind Energy Association. (2009). Annual Wind Industry Report Year Ending 2008. 78 American Wind Energy Association. (2009). Annual Wind Industry Report Year Ending 2008. 79 American Wind Energy Association. (2009). Annual Wind Industry Report Year Ending 2008. 80 American Wind Energy Association. (2009). Industry Rankings Factsheet 2008. 81 Rickerson, W., Bennhold, F., & Bradbury, J. (2008). Feed-in Tariffs and Renewable Energy in the USA -- A Policy Update. 82 Hering, G. (2008, April). Whispers of a new direction: First national feed-in legislation introduced in US Congress. PHOTON International, pp. 44-46. 83 Prices of RECs can vary greatly from $5 to $200 per MWh. The fluctuation of prices depends on many factors, including the type of energy, location of the facility generating the RECs, and the supply/demand situation.

28
Minnesota, which limits the size of the systems that qualify for the tariff (e.g., less than 1.5 MW)84. Tax Credits are used extensively in the United States to stimulate demand for renewable energy. The production tax credit (PTC) allows a tax credit of 0.02 per kW/h for the production of electricity from qualified wind energy facilities and other sources of renewable energy for up to ten years85. The PTC is widely viewed as responsible for the accelerated number of wind energy installations in 2007 and 2008. Developers rushed to complete projects before the PTC was assumed to expire at the end of 2008. Congress extended the PTC for another year in October 2008. Additionally, most renewable energy systems are eligible for accelerated depreciation over five years. The Economic Stimulus Act of 2008 allows energy system owners to deduct a bonus depreciation of 50% of the adjusted property basis for eligible renewable-energy systems acquired and placed in service in 200886. The remaining 50% of the adjusted basis of the property is depreciated over the ordinary tax depreciation schedule87. Tax credits and depreciation tend to favor large investors with sizable tax liabilities. Such investors often enter partnerships with other investors only long enough to gain tax benefits and then depart (called “partnership flip structures”), leaving the remaining investors to earn income from land leases or energy sales. The financial crisis of late 2008 and projected economic downturn are expected to reduce the demand for tax equity deals because fewer investors will be profitable enough to have tax liabilities. Renewable Portfolio Standards. The U.S. also uses renewable portfolio standards extensively to stimulate demand for renewable energy. Twenty-nine states and the District of Columbia have renewable portfolio standards (RPS) which mandate that utilities (mostly investor owned) generate a certain percentage of renewable energy by a specific date88,89,90. Most RPSs have interim compliance targets. Utilities that do not meet these targets may be required to make “alternative compliance payments” to a fund that provides grants, loans, and rebates for installation of renewable energy or energy efficient systems. Utilities may also comply with the RPS by buying renewable energy credits (RECs) from owners of renewable energy systems. Each REC is equal to 1 MWh of renewable energy. Utilities that buy RECs subsidize the owners of renewable energy systems.
84 Farrell, J. (2008). Minnesota feed-in tariff could lower cost, boost renewables and expand local ownership. New Rules Project. 85 Rural electric cooperatives and municipal utilities and other government or non-for-profit organizations are eligible for the Renewable Energy Production Incentive (REPI) program instead of the PTC. It operates similarly to the PTC, but provides a direct payment (not a tax credit) per kW/h generated (.015 per kW/h) to publicly owned and cooperatively owned electric utilities. 86Rives, S. (2008). Economic stimulus package allows bonus depreciation for projects completed in 2008. Portland, OR. Retrieved on August 25, 2008 from http://www.renewableenergyworld.com/rea/partner/story?id=51515&src=rss 87 Database of State Incentives for Renewables & Efficiency (DSIRE). (n.d.). Retrieved August 25, 2008, from
http://www.dsireusa.org 88 Database of State Incentives for Renewables & Efficiency (DSIRE). (n.d.). Retrieved July 24, 2009, from
http://www.dsireusa.org 89 Municipal utilities and cooperatives are often exempt or must comply with different rules. 90 Five states have renewable portfolio goals (Virginia, Vermont, North Dakota, South Dakota, and Utah).
29
Each of the five states with the highest wind capacity additions in 2008 has an RPS except for Iowa. Wind is not necessarily weighted higher in most of their RPSs, but there are exceptions. Illinois specifies that 75% of its renewable energy must be met by wind. Also, Minnesota specifies that wind must comprise a substantial percentage of its requirement (30% for its largest utility). Although Texas doesn’t specify a certain percentage for wind, nearly all of the state’s current renewable energy generation is wind. Two more states are relevant if considering cumulative installed capacity, Iowa and Washington. In 2001, Iowa established a voluntary goal of 1,000 MW of wind generating capacity by 2010. It has already reached that goal. Washington indicates no priority for wind. A state’s cumulative wind capacity is moderately related to its wind energy potential. The top-ten states in wind potential are North Dakota, Texas, Kansas, South Dakota, Montana, Nebraska, Wyoming, Oklahoma, Minnesota and Iowa91. Only three of the top-five states in cumulative wind capacity (Texas, Minnesota, and Iowa) are among the top-ten in wind energy potential. Finally, a state’s cumulative capacity is not related to the retail cost of electricity. The retail cost (in cents per kWh) of conventional electricity across all sectors in Texas ($0.104) and California ($0.139) is above the national average ($0.096), but it is below average in the other three states with high cumulative capacity ($0.063-$0.078)92. Policy Context for Appalachian States. Seven of the thirteen Appalachian states have RPSs (Pennsylvania, Maryland, New York, North Carolina, Ohio, Virginia, and West Virginia93). New York, Maryland and Virginia have provisions that specifically promote wind. The installed capacity of wind in the Appalachian states and their rank among the fifty states are New York (832 MW, 9th), Pennsylvania (361 MW, 16th), West Virginia (330 MW, 17th), Tennessee (29 MW, 27th), and Ohio (7 MW, 31st )94. The Tennessee Valley Authority offers utilities in the southeastern Appalachian states an opportunity to participate in its Power Switch Generation Program95. Utilities in six states (Alabama, Georgia, Mississippi, North Carolina, Kentucky, and Tennessee) are currently participating in this program. TVA offers a 10-year contract to purchase the entire output of qualifying customer-sited systems at .15/kWh for residential/small commercial (< 50 kWh) and 0.20/kWh for larger commercial customers (> 50 kW) plus an additional $500 for start-up costs. The TVA retains sole rights to any RECs96.
91 Wind potential is measured by annual energy potential in the billions of kWhs, factoring in environmental and land-use exclusion for wind power class 3 and higher. Wind power classes range from class 1 (the lowest) to class 7 (the highest). Each class represents a range of mean wind power density (in units of W/m2) or equivalent mean wind speed at 10m and 50m above ground. Areas designated as class 3 or greater are suitable for most wind turbine applications (National Renewable Energy Laboratory. (2008a). Wind Energy Atlas of the United States. Retreived from http://rredc.nrel.gov/wind/pubs/atlas/). 92 Energy Information Agency. (2008). Average retail price of electricity to ultimate customers by end-use sector, by state. Electric Power Monthly, Table 5.6.A. 93 Virginia has a voluntary system that rewards compliance by allowing utilities to raise their allowable profit. West Virginia recently enacted a standard that allows use of “alternative energy resources” including natural gas and coal liquefaction and gasification to meet its goal. 94 American Wind Energy Association. (2009). Annual Wind Industry Report Year Ending 2008. 95 Database of State Incentives for Renewables & Efficiency (DSIRE). (n.d.). Retrieved August 25, 2008, from http://www.dsireusa.org 96 See Tennessee Valley Authority. (n.d.). Green Power Switch Generation Partners. Retrieved from http://www.tva.gov/greenpowerswitch/partners/index.htm.

30
General Policy Assumption. There is frequent discussion regarding how long renewable energy should be subsidized to encourage its development. Subsidies stimulate demand, which in turn promote economies of scale and learning effects that reduce the cost of renewable energy. The general assumption is that renewable energy should be subsidized until the cost per kWh reaches “grid parity”; that is, when the cost of renewable energy equals that of conventional energy (e.g., fossil fuels). However, such comparisons are difficult to make. They depend on the type of renewable and conventional energy compared, geographical location, and time of use. They must account for investments in infrastructure, capacity (intermittency), transmission costs, operations and maintenance, etc. Also, the cost of conventional energy should include its own subsidies and the cost of carbon emission. In such comparisons, wind energy has likely reached grid parity in select settings. Wind Energy Systems The Renewable Energy Policy Program (REPP) study97 divided wind energy systems into four major components. Each major component contains several sub-components, some of which are mentioned in the paragraphs below. Nacelles. The nacelle is the external shell or structure that houses all of the generating components, i.e., gearbox, shaft, generator, etc. Turbine size ranges from 1 kW to 7 MW. Small wind turbines that are less than 100 kW are discussed in a separate section. A rotor aerodynamically converts wind energy into mechanical energy on a slowly turning shaft. A gearbox increases the rotor-shaft speed for the generator, which converts shaft speed into electrical energy. Most turbines have gearboxes, but generators can run at rotor-shaft speed and not require a gearbox (e.g., Enercon). The yaw drive turns the turbine horizontally on its tower toward angles that maximize advantage of wind direction. Rotors/Blades. Rotors typically have three blades that are secured to a hub by extenders. The dominant design for large wind turbines (above 100 kW) is variable speed and variable pitch. Also, the, rotor is located on the wind side (upwind) of the tower. In such systems, a pitch drive turns the blades to optimal angles for wind speed and desired rotation speed, e.g., perpendicular to the wind at low speeds and parallel at high speeds. Rotor diameter generally increases with turbine size for application in low and medium wind locations. Towers. For lighter wind power classes, turbines need to be raised to heights where the average wind speed is greater and the effects of local obstructions are fewer. Utility scale towers are 60-100 meters in height. Towers can be made of rolled tubular or lattice-structured steel or cement. Most towers in the U.S. are made of rolled steel tube sections that are bolted together. Balance of System Components. These components include transformers to step up voltage for transmission to electrical grids, underground cables, circuit breakers, power substations, supervisory control and data acquisition (SCADA), fiber optic cables, a control station, crane pad, access roads, and maintenance buildings.
97 Renewable Energy Policy Project. (2004). Wind Turbine Development: Location of Manufacturing Activity.

31
Markets and Applications The most common application of wind energy is electricity generation from onshore wind turbines and transmission to a state or regional grid for distribution to homes and businesses. An application may be a single wind turbine or hundreds of them that are clustered on wind farms. In the latter case, the turbines must be strategically placed on the farm so that the performance of each turbine is maximized or at least none interferes with the performance of another. Also, some turbines may produce electricity when others do not because of variation in wind speed, direction, and location. In 2007, the most common turbine sizes (in number of installations in the U.S.) were 1 MW (Mitsubishi), 1.5 MW (GE Wind), 1.65 MW (Vestas), 2.3 MW (Siemens), and 2 MW (Gamesa)98. Grid-tied/Off-grid. Wind turbines may be connected to the grid or be independent, stand-alone units. A significant percent (41%) of small wind systems (<100 kW) are still off-grid. However, there has been a substantial shift recently toward grid-tied applications (80.4%) in this market segment99. Centralized/Distributed. Centralized wind energy systems originate from wind farms, but decentralized systems originate from private residences, government agencies or businesses that install small wind systems (1-100 kW) on or around their structures. Distributed systems may be grid-tied, in which case their owners may be able to sell the electricity they generate to the grid (e.g., net or dual metering). If these systems are off-grid, they may need batteries to store the energy that was generated when there was adequate wind. Small Wind Systems. Small wind systems are 100 kW or less and can be roof-based or ground-based. These systems are sold to residential, commercial, industrial, agricultural, transportation utilities, and government markets. A total of 17.3 MW were installed in the U.S. in 2008, representing 78% growth100. The majority of sales were for on-grid applications (80.4%). Cumulative installed capacity in the U.S. was 80 MW in 2008101. Of the units sold in the U.S. 94% were produced by U.S. manufacturers (a decline of 4% from 2007)102. U.S. manufacturers include Southwest Windpower (AZ), Bergey Windpower (OK), Wind Turbine Industries (MN), Entegrity Wind Systems (CO; PEI, Canada) and Northern Power (VT). Exports accounted for less than 40% of the U.S. manufacturers’ sales in 2008103. On-Shore/Off-Shore. Worldwide cumulative installed off-shore wind capacity reached 1,471 MW in 2007, roughly 1.2 % of all installed worldwide capacity; 314 MW were added to capacity in 2008104. The top-five countries in installed off-shore capacity are U.K. (591 MW), Denmark (409 MW), Netherlands (247 MW), Sweden (133 MW), and Belgium (30 MW). The U.K. overtook Denmark in 2008 as expected, yet, counter to expectations, Germany did not move into
98 American Wind Energy Association. (2008a). 2007 Market Report. 99 American Wind Energy Association. (2009). Annual Wind Industry Report Year Ending 2008. 100 American Wind Energy Association. (2009). Annual Wind Industry Report Year Ending 2008. 101 American Wind Energy Association. (2009). Small Wind Turbine Global Market Study, Year Ending 2008 102 American Wind Energy Association. (2009). Small Wind Turbine Global Market Study, Year Ending 2008. 103 American Wind Energy Association. (2009). Small Wind Turbine Global Market Study, Year Ending 2008. 104 European Wind Energy Association. (2009). Sea of Change: Offshore Wind Energy Report.

32
the top-five. The U.S. has no presence in this market currently. However, several projects are in various stages of development off the coasts of Massachusetts, Rhode Island, New Jersey, Delaware and Texas, with feasibility studies being conducted also in the Great Lakes, Virginia, South Carolina, Georgia, and along the West Coast. Off-shore wind sites are generally close to shorelines because conventional monopole foundation technology is limited to application in waters less than 30 meters deep. There are emerging technologies for wider application in deeper waters, such as the “jacket” structure used for the two 45 meters deep turbines in the Beatrice Wind Farm off of Scotland. However, these are still cost restrictive for application. For deeper water applications, floating platforms that are anchored by chains to the sea-bed105 are also under development. The off-shore wind resource is stronger and steadier than on-shore wind due to the absence of flow obstructions and the air-sea thermal interactions, but turbines must be larger (2.5 MW and above) to justify the investment in floating platforms106. Also, technology needs to be developed so that platforms maintain stability in rough water, and turbines resist corrosion and require less maintenance. Industry Participants Wind Turbine Manufacturers. The worldwide added capacity and market share of the top-ten turbine manufacturers in 2008 were Vestas (5,582 MW, 19.8%), GE Wind (5,243 MW,18.6%,), Gamesa (3,383 MW,12.0%), Enercon (2,819 MW, 10.0%), Suzlon (2,537 MW, 9.0%), Siemens (1,975 MW, 6.9%), Sinovel (1,410 MW, 5.0%), Acciona (1,297 MW, 4.6%), Goldwind (1,128 MW,4.0%), and Nordex (1,071 MW, 3.8%,)107. These ten companies added 93.7% of 28,190 MW in worldwide added capacity in 2008 (Table 6). Six of them are European, two are Chinese, one is Indian, and one is American. The two Chinese companies (Goldwind and Sinovel) and a Spanish company (Acciona) increased their production dramatically in 2007 (see Table 6). The top ten turbine manufacturers supplying the U.S. in 2008 were GE Wind (3,657 MW, 42.7%), Vestas (1,120 MW, 13.1%), Siemens (791 MW, 9.2%), Suzlon (736 MW, 8.6%), Gamesa (616 MW, 7.2%), Clipper (595 MW, 7.0%), Mitsubishi (516 MW, 6.0%), Acciona (410 MW, 4.8%), REpower (102 MW, 1.2%) and Fűhrlander (5 MW, 0.0%); the top eight companies accounted for over 98% of added capacity in the U.S. in 2008108. Four relatively new entrants into the U.S. wind industry are Clipper Windpower (plant in Cedar Rapids, Iowa) and CTC/DeWind, which will start to produce turbines at the TECO Westinghouse facility in Round Rock, Texas in 2009. Nordic Windpower will produce turbines in Pocatello, Idaho. Fűhrlander will produce turbine components in Butte, Montana.
105 Milborrow, D. (2003). Offshore wind rises to the challenge. Wind Power Monthly. 106 Merrill Lynch. (2007). Wind turbine manufacturers; Here comes pricing power. 107 BTM Consult (2009). World Market Update 2008 108 American Wind Energy Association. (2009). Annual Wind Industry Report Year Ending 2008.

33
Table 6. Worldwide MW Additions, Plant Locations, and U.S. Installation Sites of Top Ten Wind Turbine Manufacturers in 2008
Company MW 2008
(% Growth)
MW 2007 Plant Locations (current and planned)
U.S. Installation Sites of Completed
Wind Power Projects (2008)109
Vestas 5,582 (23.7%)
4,512 U.S. (Windsor, CO and Portland, OR); Spain; Denmark, Germany, Sweden, U.K., Italy, Norway, India; China
AK, CA, IL, IA (4), KS(3), MI, MN, ND, OR, TX, WA (2), WI(2)
GE Energy 5,243 (59.6%)
3,285 Salzbergen, Germany; Nobeljas, Spain; Shenyang, China, Canada and the U.S. (Pensacola, FL; Greenville, SC; Salem, VA; Erie, PA; Tehachapi, CA)
IL, IN, IA (9), KS, ME, MI, MN (3), MT, NM, NY (3), ND (4), OR, TX (8), WA, WI(2), WY (2)
Gamesa 3,383 (11.0%)
3,048 U.S. (Fairless Hills, PA and Ebensburg, PA); Silkeborg, Denmark; Aschaffenburg, Germany; Saint Priest, France; Rome, Italy; Various locations in Spain; Athens, Greece; Lisbon, Portugal; South Wales, UK; Beijing, China
IL, IA (2), NH, TX (2), WV (2)
Enercon 2,819 (1.7%)
2,771 Aurich, Emden and Magdenburg, Germany; Sweden; Brazil; India; Turkey; Portugal
Suzlon 2,537 (22.1%)
2,078 Various locations in India; U.S. (Pipestone, MN); Tianjin, China; Edegem, Belgium; Australia; Brazil; Canada; Denmark; Greece; Italy; Nicaragua; Portugal; Spain; Turkey
IL, MN(7), MO(3), OK, OR, PA (2), TX(5), UT, WY(3)
Siemens 1,975 (40.6%)
1,405 Aalborg, Brande and Engesvang, Denmark; U.S. (Fort Madison, IA; Elgin, IL); Germany
IA,TX(4), UT
Sinovel 1,410 (840.0%)
150 China
Acciona 1,297 (204.5%)
426 Navarre and Castellon, Spain; Nantong, China; U.S. (West Branch, IA)
MT, ND, OK, SD
Goldwind 1,128 (171.2%) 416 China
Nordex 1,071 (112.1%) 505 Rostock, Germany; China; U.S. (Jonesboro, AR
planned)
Regional Transmission Organizations(RTO)/Independent System Operators(ISO). RTOs are regional or state entities that regulate interconnected transmission systems for use by energy providers of all types. ISOs typically perform the same functions as RTOs, but cover a smaller geographic area, or are not subject to Federal Energy Regulatory Commission (FERC) jurisdiction. Seven ISOs and RTOs currently operate in the U.S. They are the California Independent System Operator (California ISO); the Electric Reliability Council of Texas (ERCOT, an ISO); ISO New England (ISO-NE, an RTO); the Midwest Independent Transmission System Operator (Midwest ISO, an RTO); the New York Independent System Operator (NYISO); PJM Interconnection (PJM, an RTO); and the Southwest Power Pool (SPP, an RTO). Traditionally, vertically integrated electric utilities owned transmission systems to serve their customers. However, as electricity was transported over increasingly greater distances, numerous 109 American Wind Energy Association. (2009). Annual Wind Industry Report Year Ending 2008.

34
interconnections between transmission systems developed. In the late 1990s, the FERC required all electricity providers to join an RTO or ISO. The purpose of these entities was to assure non-discriminatory transmission access, schedule the use of transmission lines, manage the interconnection of new generation, and monitor the markets to ensure fairness and neutrality for all participants. Wind energy providers are disadvantaged relative to other energy providers by greater distance between wind generation and end-use. This requires wind generated electricity to cross multiple transmissions systems, resulting in multiple access fees (called “rate pancaking”). They are also disadvantaged by wind’s unpredictability and intermittency, which leads to more frequent and higher penalties for schedule and output deviations110. The American Wind Energy Association (AWEA) has proposed several remedies to reduce these disadvantages111. Owners/Investors/Developers. Independent Power Producers (IPPs) owned 83% of all new capacity additions in 2007. Investor- owned utilities owned 11%, publicly-owned utilities owned 5% and communities owned 1%112. The five largest IPPs in the U.S. are Iberdrola (Spain), FPL (U.S.), Acciona (Spain), EDP (Portugal), and Babcock & Brown (Australia). Wind system owners sell energy in the open market (merchant sale) or via a long-term power purchase agreement (15-25 years). Developers usually own and operate the systems they build. FPL and Babcock & Brown have traditionally done this. Although many independent wind developers remain, a significant number of them are being acquired by IPPs. Most recently, European owners have entered the U.S. energy market or expanded their presence by acquiring U.S. developers. For example, in 2007, EDP acquired Horizon, Iberdrola acquired PPM and CPV Wind, E.ON AG acquired Airtricity North America, Acciona acquired 1300 MW worth of wind projects from EcoEnergy LLC, and Babcock & Brown acquired Bluewater Wind113. New capacity additions are most commonly financed through corporate balance sheets (debt) or tax equity partners who are interested in tax credits. Tax equity partners in wind projects have included GE Energy Financial, Goldman-Sachs, JP Morgan Capital, Lehman, and numerous investment banks. Such investors must have sufficient tax liabilities to benefit from the PTC and five-year accelerated depreciation. Within ten years (PTC limit), tax equity partners may “flip” their investment to IPPs or others who can still benefit from selling energy on the open market or from leasing land. Deteriorating financial market conditions in late 2008 have led most tax equity partners to abandon or suspend their participation in tax equity deals. They no longer have cash to invest in projects and lack the strong balance sheets that necessitate tax offsets.
110 Wind power is intermittent (i.e., unavailable 35-50% of the time) because wind speed is variable and unpredictable. Intermittency is not a major problem for grid management when total wind penetration is relatively low, but could become a problem if penetration rises to 15-20% of the total energy supply. Wind farm developers compensate for intermittency by building a turbine reserve (excess) and configuring turbine location so that all of them don’t face the same wind conditions simultaneously. Higher towers also help reduce intermittency (National Renewable Energy Laboratory, 2008b National Renewable Energy Laboratory. (2008b). Wind Deployment Systems (WinDS) Model. Retrieved from http://www.nrel.gov/analysis/winds/intermittency.html). 111 American Wind Energy Association (2000). White Paper. Fair Transmission Access for Wind: A Brief Discussion of Priority Issues. 112 Wiser, & Bolinger. (2008). Annual report on U.S. wind power installation, cost, and performance trends: 2007. U.S. Department of Energy, Energy Efficiency and Renewable Energy. 113 Wiser, & Bolinger. (2008). Annual report on U.S. wind power installation, cost, and performance trends: 2007. U.S. Department of Energy, Energy Efficiency and Renewable Energy.

35
Wind Power Purchasers. Investor-owned utilities bought 48% of wind energy from new capacity additions in 2007. Publicly-owned utilities purchased 17% of new capacity additions. Power marketers, i.e., corporate intermediaries that purchase power under contract and resell to others, have increased significantly since 2000 (20% of new capacity in 2007). All of the above entities typically buy energy under long-term power purchase agreements (15-25 years). The remaining 15% of energy is sold through short-term contracts or the spot market (i.e., merchant risk). The top-ten utilities in aggregate wind capacity on their systems at the end of 2008 were Xcel Energy (MN, 2,906 MW), MidAmerican Energy ( IA, 2,363 MW), Southern California Edison (CA, 1,137 MW), Pacific Gas & Electric (CA, 981 MW), Luminant Energy (TX, 913 MW), American Electric Power (OH, 468 MW), Alliant Energy (WI, 446 MW), Puget Sound Energy (WA, 435 MW), Excelon Energy (IL, 351 MW) and Empire District Electric Company (MO, 255 MW)114. Eight of these ten utilities are west of the Mississippi River. American Electric Power owns Appalachian Power (Charleston, WV), which sought requests for proposals for wind energy projects in April 2008. Excelon owns PECO (Philadelphia, PA), which was the first utility in Pennsylvania to offer wind to its residential and business customers and is supplied by a wind power facility in Waymart, PA, near the Poconos. Wind System Supply Chain Figure 3 shows two major components of the wind turbine supply-chain, nacelles and rotor/blades. A third major component, towers, is not shown. Each major component shows some of its major subcomponents115. Turbines above the 1 MW size range are sold out through 2009. Price is less an issue for many turbine manufacturers than is reliable delivery. Entry into the component business has been slow because margins are often low, and sales projections are difficult to make due to the notorious on-off nature of the U.S. production tax credit for wind energy. Also, the requisite skills to make components such as gearboxes and bearings are relatively scarce in the United States, and finding and training appropriate workers is challenging and costly.
114 American Wind Energy Association. (2009). Annual Wind Industry Report Year Ending 2008. 115 Renewable Energy Policy Project. (2004). Wind Turbine Development: Location of Manufacturing Activity, decomposes wind systems into 20 major subcomponents, with turbine/nacelles having eleven subcomponents and rotor/blades having four of them (as shown).

36
Turbine Nacelles. The major subcomponents of nacelles are nacelle covers and frames, gearboxes, bearings and generators. Gearboxes and bearings in particular are in short supply, and constitute a bottleneck. Many of the major turbine manufacturers own a significant portion of their supply chain or have long-term agreements with suppliers. This is especially so for those components that differentiate or enhance the capability of turbines relative to competitors. Most recently, Suzlon acquired gearbox supplier Hansen (2006), and Siemens acquired Winergy (2005). Bearings. Bearings can be found in gearboxes, generators, cooling systems, blade pitch and yaw systems, and rotor support systems. Large bearing suppliers are in a strong bargaining position with turbine manufacturers because wind is a small portion of the suppliers’ total revenue base, e.g., SKF (Sweden), Schaeffler KG (FAG) (Germany). Smaller bearing manufacturers are reluctant to get into the business because they are unsure of the extension of the PTC and don’t want to risk a downturn in business116,117. Another barrier to entry is that track record in this industry is important for credibility because reliability has been a problem. Lead-time for delivery is long (16 months). Smaller turbine manufacturers can expect longer lead-times for delivery of supplies. Generators are not a problem because the supply is adequate and lead-time for delivery is short. Table 7 shows the names of some of the major gearbox and bearing suppliers.
116 Merrill Lynch. (2007). Wind turbine manufacturers; Here comes pricing power. 117 Anonymous. (2007, January/February). Supply chain: The race to meet demand. Wind Directions , pp. 27-34.
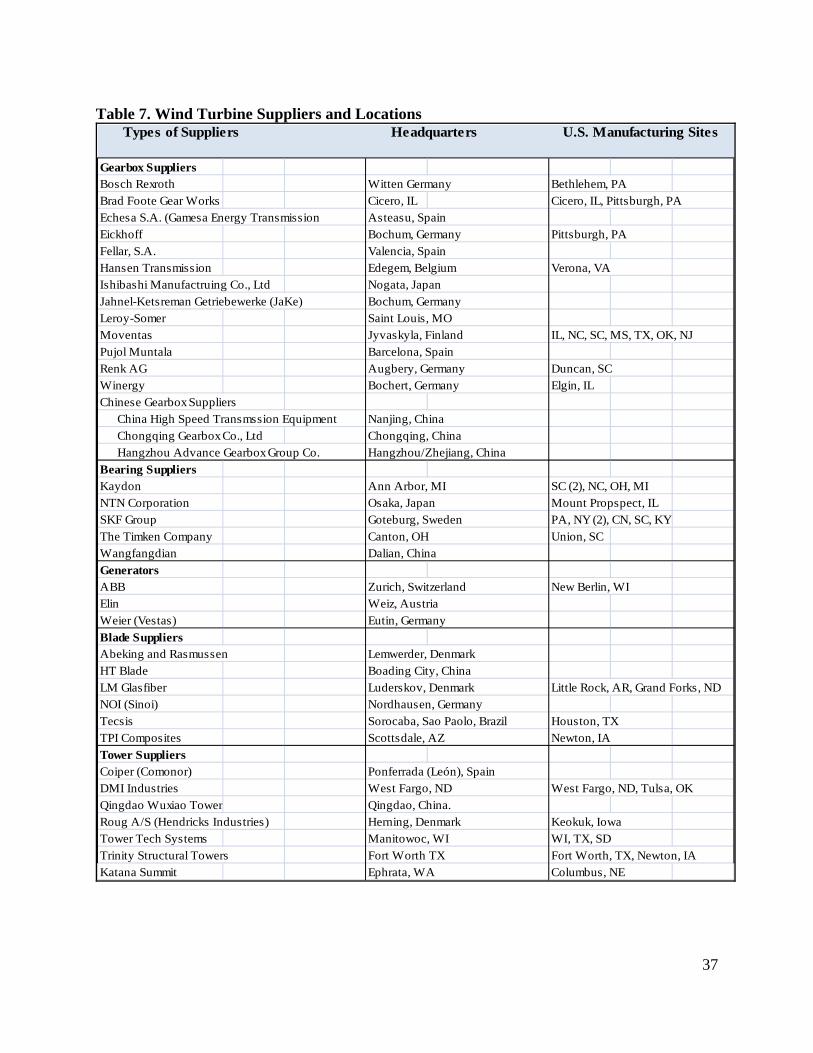
37
Table 7. Wind Turbine Suppliers and Locations Types of Suppliers Headquarters U.S. Manufacturing Sites
Gearbox SuppliersBosch Rexroth Witten Germany Bethlehem, PABrad Foote Gear Works Cicero, IL Cicero, IL, Pittsburgh, PAEchesa S.A. (Gamesa Energy Transmission Asteasu, SpainEickhoff Bochum, Germany Pittsburgh, PAFellar, S.A. Valencia, SpainHansen Transmission Edegem, Belgium Verona, VAIshibashi Manufactruing Co., Ltd Nogata, JapanJahnel-Ketsreman Getriebewerke (JaKe) Bochum, GermanyLeroy-Somer Saint Louis, MOMoventas Jyvaskyla, Finland IL, NC, SC, MS, TX, OK, NJPujol Muntala Barcelona, SpainRenk AG Augbery, Germany Duncan, SCWinergy Bochert, Germany Elgin, ILChinese Gearbox Suppliers
China High Speed Transmssion Equipment Nanjing, ChinaChongqing Gearbox Co., Ltd Chongqing, ChinaHangzhou Advance Gearbox Group Co. Hangzhou/Zhejiang, China
Bearing SuppliersKaydon Ann Arbor, MI SC (2), NC, OH, MINTN Corporation Osaka, Japan Mount Propspect, ILSKF Group Goteburg, Sweden PA, NY (2), CN, SC, KYThe Timken Company Canton, OH Union, SCWangfangdian Dalian, ChinaGeneratorsABB Zurich, Switzerland New Berlin, WIElin Weiz, AustriaWeier (Vestas) Eutin, GermanyBlade SuppliersAbeking and Rasmussen Lemwerder, DenmarkHT Blade Boading City, ChinaLM Glasfiber Luderskov, Denmark Little Rock, AR, Grand Forks, NDNOI (Sinoi) Nordhausen, GermanyTecsis Sorocaba, Sao Paolo, Brazil Houston, TXTPI Composites Scottsdale, AZ Newton, IATower SuppliersCoiper (Comonor) Ponferrada (León), SpainDMI Industries West Fargo, ND West Fargo, ND, Tulsa, OKQingdao Wuxiao Tower Qingdao, China.Roug A/S (Hendricks Industries) Herning, Denmark Keokuk, IowaTower Tech Systems Manitowoc, WI WI, TX, SDTrinity Structural Towers Fort Worth TX Fort Worth, TX, Newton, IAKatana Summit Ephrata, WA Columbus, NE

38
Rotors/Blades. LM Glasfiber (Denmark) is the largest supplier of blades with a 27% global market-share118. It has U.S. plants in Grand Forks, North Dakota, and Little Rock, Arkansas. All but two of the top-ten turbine manufacturers (GE Wind, Clipper) produce most of their own blades. Both companies buy blades from Tecsis (Brazil). GE Energy recently signed a long-term agreement with TPI Composites (U.S.). In support of the agreement, TPI has built a 316,000 square foot facility in Newton, Iowa (see Table 7). Knight & Carver (U.S.) opened a 26,000 square foot factory for manufacturing and repairing blades in Howard, SD119. Towers. Some of the major tower manufacturers include Ameron (California), Trinity Structural Towers (Texas), DMI Industries (North Dakota), Tower Tech Systems (Wisconsin), Aerisyn (Tennessee), Thomas & Betts (Tennessee), Beard Industries (Indiana). Hendricks Industries (Denmark) will produce towers in Keokuk, Iowa (see Table 7). Katana Summit of Ephrata, Washington is building a wind-tower manufacturing plant in Columbus, Nebraska. Valmont Wind Energy, which is headquartered in Omaha, makes customized towers for small wind and anemometer structures. Process Controls. Many of the large turbine manufacturers (e.g., GE Wind, Suzlon) have developed their own process control systems, often referred to as SCADA (Supervisory Control and Data Acquisition). Emerson entered this market in 2001 with the acquisition of Fisher-Rosemount and became Emerson Process Management (Pennsylvania). Other independents include Bragg Crane & Rigging (California) and Second Wind (Massachusetts). Services. There are a growing number of independent service providers, consultants and siting experts. For example, EMS (Engineering Maintenance Service) of South Dakota provides services such as construction, engineering, operations, maintenance, component remanufacturing and component repair (acquired by Tower Tech Holdings). GE Wind offers installation, operation and maintenance services for wind turbines. North American Energy Services (Washington), Global Energy Concepts (Washington), Global Energy Services (Pennsylvania), Tetra Tech (California), BHE Environmental (Ohio and Tennessee) also provide services. Sourcing Strategies of Turbine Manufacturers. A review of websites that focus on wind turbine component suppliers suggests that turbine manufacturers currently source few components from U.S. suppliers. Even GE Wind and Clipper, the two largest U.S.-based turbine manufacturers, do not source the majority of their components domestically. For example, GE Wind obtains gearboxes from German suppliers Winergy, Bosch Rexroth, and Eickhoff120. Clipper obtains blades from Tecsis (Brazil) and generators from Potenicia (Mexico). A few foreign manufacturers are beginning to assemble turbines in the United States (Acciona, Nordex, Gamesa), but are not fabricating many turbine components domestically121. Among those components that are sourced domestically, one suspects that they are not critical to differentiating the product from those of competitors, e.g., nacelle or transmission housings. Rather, components that have this impact are imported from the turbine manufacturer’s home
118 Merrill Lynch. (2007). Wind turbine manufacturers; Here comes pricing power. 119 South Dakota New Web. (2006). Knight & Carver breaks ground in Howard: Governor Rounds welcomes California wind blade manufacturer to South Dakota. South Dakota New Web. 120 GE Wind manufactures some of its own gearbox and generator components in Tehachapi, CA. 121 Fűhrlander will fabricate machine housings in Butte, Montana.

39
country122. A list of thirty-six wind industry manufacturing facilities on-line, announced or expanding through the third quarter of 2008 shows that ten are related to towers, and six related to blades123. These components are large and expensive. Although some towers and blades will continue to come through U.S. ports from Asia and Europe124, an increasing portion of them will be fabricated relatively close to where they will be installed. Table 8 shows the component and equipment suppliers for the major sub-components of nacelles, rotors/blades, and towers in Appalachian Counties.
Table 8. Component and Equipment Suppliers in Appalachian Counties
Type of Supplier
Appalachian Counties (in parentheses)
Nacelle covers and frames Hodge Foundry, Greenville, PA, (Mercer); CAB Inc., Oakwood, GA (Hall);
Blades, blade extenders, hubs
CAB Inc. Oakwood, GA (Hall); Hodge Foundry, Inc., Greenville, PA (Mercer); Gamesa, Ebensburg, PA (Cambria);
Gearboxes Peerless Winsmith, Inc., Springfield, NY (Otsego); Hodge Foundry, Inc., Greenville, PA (Mercer); Renk AG, Duncan, SC (Spartanburg), Eickhoff, Pittsburgh, PA (Allegheny)
Bearings Moventas, Winston-Salem, NC (Forsyth); Moventas, Greenville, SC (Greenville); Kaydon, Mocksville, NC (Davie); SKF Falconer, NY (Chautauqua), SKF, Jamestown, NY (Chautauqua);
Generators/Inverters/Power Electronics
Motors and Control International, Hazelton, PA (Luzerne);
Towers, including base, flanges and bolts
Aerisyn, Chattanooga, TN (Hamilton); CAB Inc., Oakwood, GA (Hall);
Construction, Consulting, and Maintenance Services, communications systems
Specialized Power Systems, Inc. Huntington, West Virginia (Cabell), Genesis Development of Kentucky, LLC (Pike); Emerson Process Management, Pittsburgh, PA (Allegheny)
Job Creation by Turbine Manufacturers and Suppliers. The U.S. Department of Energy125 estimates that 16,000 MW of wind energy must be added per year to achieve the proposed target of twenty percent wind energy (about 300,000 MW) in the U.S. by 2030. The DOE study estimates that this level of annual production will create 190,000 new jobs in the U.S. over twenty years126. However, the U.S. added 8,545 MW in new wind capacity in 2008. That is close to half of what is required annually to achieve the DOE’s target, and the job creation to date hasn’t been anywhere near proportional to what DOE would expect for this added capacity. Unless foreign manufacturers are required or encouraged to produce more critical components in the U.S., these job creation estimates for 2030 appear to be overstated. Also, three of the twenty 122 Some foreign suppliers have U.S. operations, e.g., SKF, Moventas, ABB (see Table 2). However, other foreign suppliers only have sites that specialize in sales, distribution, and service. 123 American Wind Energy Association (2008c). 3rd Quarter 2008 Market Report 124 Knee, R. (2007). West Coast ports made of steel and wind: Pacific Coast ports find growth in non-container business. Pacific Shipper. 125 U.S. Department of Energy. (2008). 20% Wind Energy by 2030: Increasing Wind Energy's Contribution to U.S. Electricity Supply, DOE/GO-102008-2567. Available on-line from http://www.osti.gov/bridge. 126 68,800 manufacturing jobs plus 120,000 indirect and induced jobs or 1.8 jobs for every manufacturing job.

40
major subcomponents of wind systems that Renewable Energy Policy Project (REPP) used in its Wind Turbine Development: Location of Manufacturing Activity study are critical components (gearboxes, bearings and generators) that are unlikely to be produced in the U.S. anytime soon (see Table 8), mainly due to a shortage of the requisite skills to produce such components locally. Assuming that foreign manufacturers are willing to build plants in the U.S. to produce their most high value-added components or share their distinctive competence with U.S. suppliers, the time and resources needed to locate (relocate if necessary) and train capable workers are formidable challenges. European and American studies vary considerably in the job/MW ratios they used to estimate future job growth in the wind industry (0.71 to 2.79)127,128,129,130. The REPP study used a ratio of 3.00/MW to estimate job growth, which is higher than used in most other studies131. Lastly, projections of job growth need to take into account productivity improvements over the next twenty-one years, which currently are between 6-9% per year132. Competitive Strategies Product Range. The top-ten companies offer turbines in varying sizes and applications (see Table 9). The smallest turbine offered is 330 kW (Nordex) and the largest is 3.6 MW (Siemens, GE Wind). Larger turbines are available in limited production or as prototypes (up to 7.5 MW).
127 Algoso, & Rusch. (2004). Renewables work: Job growth from renewable energy development in the mid Atlantic. NJPIRG: Law and Policy Center. 128 Kammen, D., Kapadia, K., & Fripp, M. (2004). Putting Renewables to Work: How many jobs can the clean energy industry generate? Renewable and Appropriate Energy Laboratory report, University of California, Berkeley. Retrieved from http://rael.berkeley.edu/old-site/renewables.jobs.2006.pdf 129 Pedden, M. (2006, January). Analysis: Economic impacts of wind applications in rural communities. NREL Technical Monitor, Subcontract Report, NREL/SR-500-39099. Retrieved from http://www.nrel.gov/docs/fy06osti/39099.pdf 130 Worldwatch Institute. (2007). Green jobs: Towards sustainable work in a low-carbon world. Preliminary Report. Green Jobs Initiative, United Nations Environment Programme (UNEP), International Labour Organization (ILO), International Trade Union Confederation (ITUC). 131 REPP’s estimates for job creation may be more realistic for wind farm installation (700 jobs/1000 MW) and operations and maintenance (600/1000 MW) than for component manufacturing (3000/1000MW). This work cannot be performed very efficiently outside the U.S. or outsourced. 132 Wiser, & Bolinger. (2008). Annual report on U.S. wind power installation, cost, and performance trends: 2007. U.S. Department of Energy, Energy Efficiency and Renewable Energy.

41
Table 9. Product Line Range of the Global Top-Ten Turbine Manufacturers (as of June 2009) Companies Product Line Range
Turbine Size (MW)
Rotor Diameter Hub or Tower Height
Vestas 0.85 MW 1.65 MW 1.8MW 2.0 MW
52m 82m 90m, 100m 80m, 90m
44m,49m,55m,65m,74m 70m ,78m, 80m 80m,95m,105m; 80m, 95m 60m, 67m, 78m, 700m; 80m, 95m, 105m
GE Wind 1.5MW 2.5 MW 3.6MW
77m, 82.5m 100m 111m
65m, 80m 80m 75, 85, 100 and site specific
Gamesa 0.85 MW 2.0 MW
52m, 58m 80m, 87m, 90m
44m, 49m, 55m, 65m; 44m, 55m, 65m, 71m 60m, 67m, 78m, 100m; 67m, 78m, 100m
Enercon 0.33 MW 0.8 MW 0.9 MW 2.0 MW 2.3 MW
33.4m 48m, 52.9m 44m 82m 71m
37m – 50m 50m, 60m, 73m, 76m 45m, 55m 78m – 138m 57m – 113m
Suzlon 0.6 MW 1.25 MW 1.5 MW 2.1 MW
52m 64m, 66m 82m 88m
73m 54m, 63m, 72m and site specific 76m 79m
Siemens 2.3 MW 3.6 MW offshore
82.4m, 93m, 101m 107m
80m or site specific 80m or site specific
Sinovel 1.5 MW 3.0 MW prototype
-- --
Acciona 1.5 MW 3.0 MW
70m, 77m, 82m 100m, 109m, 116m
60m, 80m; 60m, 71m, 80m; 80m 100m, 120m
Goldwind 0.6 MW 0.75 MW 1.2 MW 1.5 MW
43m 49m 62m 70.5m
40m, 50m 50m, 60m 70m 65m, 85m
Nordex .33 MW 1.5 MW 2.3 MW 2.5 MW 2.5 MW offshore
70m, 77m 90m 80m, 90m, 100m 90m
65m – 111.5m 70m, 80m, 100m, 105m 60m 70m, 80m; 70m, 75m, 80m, 100m, 120m; 100m --

42
Many companies also extend the range of applications of their existing and new turbines by offering them with different rotor diameters or tower heights (see Table 9). Larger rotor diameters and higher towers are for light or medium wind resources. Table 10 shows that the average turbine size has been growing in the last ten years. This is due in part to the need to locate wind farms in areas with lower average wind speed and because there are fewer large parcels of land available for wind farms133. Larger turbines capture more energy at slower blade rotation than smaller turbines134. Turbines for off-shore use are larger also in order to maximize the energy generated from the significant investment in building platforms and towers in water. Nordex (2.5 MW), Vestas (3 MW), Siemens (3.6 MW), and GE Wind (3.6 MW) offer offshore versions of their onshore turbines. None of the top-ten companies produces turbines for the small wind segment (less than 100 KW).
Table 10. Size Distribution of Turbines from 1998-2007
Turbine Size Range
1998-99 2000-01 2002-03 2004-05 2006 2007
1,018 MW 1,758 MW
2,125 MW
2,776 MW
2,454 MW
5,329 MW
1,425 turbines
1,987 turbines
1,757 turbines
1,960 turbines
1,532 turbines
3,230 turbines
0.05 -0.5 MW
1.3% 0.4% 0.5% 1.8% 0.7% 0.0%
0.51-1.0 MW
98.5% 73.9% 43.4% 18.5% 10.7% 11.0%
1.01-1.5 MW
0.0% 25.4% 43.5% 56.0% 54.2% 48.6%
1.51-2.0 MW
0.3% 0.4% 12.5% 23.6% 17.6% 24.1%
2.01-2.5 MW
0.0% 0.0% 0.0% 0.1% 16.3% 15.0%
2.51-3.0 MW
0.0% 0.0% 0.1% 0.0% 0.5% 1.3%
Source: Wiser and Bolinger (2008), p. 12
Market Scope. The primary reason that firms increase their market scope, i.e., from domestic to regional to global, is to gain economies of scale from fuller utilization of their existing domestic manufacturing capacity. As long as the price of turbines exceeds the marginal cost of producing them, this is an attractive option. The most efficient way for a firm to increase manufacturing capacity in a foreign location is to replicate its existing domestic factories that were designed to make a particular model or platform of turbine models. Thus turbine manufacturers typically enter foreign markets with a single turbine size. Siemens, Gamesa and Mitsubishi did this in
133 Merrill Lynch (2007). Wind Turbine Manufacturers; Here Comes Pricing Power. 134 The power potential of a wind turbine is determined by the square of the rotor diameter, therefore a large turbine delivers much more power than two separate turbines with diameter half the size. (Merrill Lynch. (2007). Wind turbine manufacturers; Here comes pricing power).

43
North America, as did GE Wind in Europe. This works fine as long as the models that were designed for the home market are well-suited to the foreign markets entered. This may explain why GE Wind did not do very well in Europe with its highly successful 1.5 MW turbine, but is now doing much better with its recently developed 2.5 MW turbine. Larger turbines sell better in Europe because land for wind farms is scarce. Mitsubishi will likely do better in the United States with its 2.4 MW turbine than it did with its 1.0 MW turbine135. Consequently, increased market scope will often be followed by expanded product range. Turbine manufacturers also can increase market scope by acquiring a foreign firm that already has a strong presence in another market. This occurred when Suzlon acquired REPower in 2007. Suzlon did not have a strong presence in Europe; REPower had strong markets in Europe as well as Japan. Plant Location. Table 7 shows plant locations of the top ten turbine manufacturers. As with solar, the typical configuration of plants among the largest turbine manufacturers is to produce turbines in the home country, usually at or near headquarters where R&D facilities tend to be located. Most of the investment in the U.S. has been in the upper and lower mid-west. Some European companies ship components to the U.S. plants for assembly (e.g., Acciona in West Branch, IA, Nordex in Jonesboro, AR). Foreign turbine manufacturers are building plants in the U.S, especially to produce blades. Blades are often produced close to an installation site because of the expense and complexity of transport. Gamesa manufactures wind turbine blades in Fairless Hills, PA and Ebensburg, PA. Suzlon manufactures wind turbine blades and nose cones in Pipestone, MN. Siemens Power Generation chose Fort Madison, IA for its U.S. wind turbine blade manufacturing site. Vestas is producing blades at a factory in Windsor, CO. Towers are usually produced locally by independent American manufacturers. Acquisition, Partnerships, and Long-Term Agreements. Several of the top-ten wind turbine manufacturers gained their current market share through mergers and acquisitions. For example, GE entered the wind turbine business by acquiring Enron Wind Corporation in 2002. Gamesa acquired MADE in 2003. Vestas merged with NEG Micon in 2003. Like GE, Siemens entered the wind turbine business by acquiring Bonus in 2004. Also, the need for reliable suppliers and customers has encouraged acquisitions, partnerships, and long-term agreements (see Appendix II). For example, Suzlon acquired gearbox manufacturer Hansen, and Siemens acquired Winergy. Suzlon says that it is interested in further acquisitions, but Siemens and Gamesa prefer to form collaborative relationships with suppliers rather than acquire them136. The nature of agreements has also changed. They have shifted from project-driven, national agreements to multi-year framework agreements spanning several regions137. For example, Tower Tech Systems is currently under a multi-year, preferential manufacturing contract with Vestas Wind Systems of Denmark.
135 Similarly, the majority of turbines in China are still 600kW, 750kW and 850kW capacity, accounting for 80% of installed units and 75% of installed capacity. The trend in the future will be towards 1 MW or larger models. (Junfeng, L., Hu, G., Pengfei, S., Jingli, S., Lingjuan, M., Haiyan, Q., et al. (2007). China wind power report -- 2007. Beijing: China Environmental Science Press). 136 American Wind Energy Association. (2008d, October 7). AWEA Wind Power Finance and Investment Workshop. Panel Discussion on Turbine Supply Issues. New York. 137 Wiser, & Bolinger. (2008). Annual report on U.S. wind power installation, cost, and performance trends: 2007. U.S. Department of Energy, Energy Efficiency and Renewable Energy.

44
Technological Innovation. This section will focus on innovation for turbines only, but recognize that innovation in wind forecasting, grid management, tower siting, etc. is critical for a comprehensive understanding of wind systems as an alternative energy option. Turbine manufacturers vary in research intensity as measured by R&D expenditures as a percent of net sales (see Table 11)138. They invest in R&D to develop and introduce new turbines, improve the performance of existing turbines, improve manufacturing processes, and reduce installation, operating and maintenance costs. The firms with a broad product range, especially those that have entered or plan to enter the offshore turbine market segment, would be expected to have high R&D expenditures relative to sales, e.g., Vestas, Siemens, GE Wind. Power control. The technology appears to have matured toward emergence of a dominant design, which is a three-bladed upwind rotor with variable speed and variable pitch operation. This provides higher quality power output (fewer and lower power fluctuations) to the grid than earlier fixed speed, stall control models139. The hydraulic pitch control adjusts the rotor angle to obtain optimal power output at each wind speed. It also prevents overpowering of the generator by turning the rotor away from the wind as the wind speed exceeds the nominal operating speed. This reduces mechanical stress, increases power capture, reduces noise, and increases power quality. Weight reduction. Rotors typically weigh more than half as much as nacelles do and cost more per pound to produce, so use of lighter materials in blades provides significant opportunities for weight reduction140. One of the main benefits of weight reduction is ease and lower expense of transportation and assembly on wind turbines. Vestas and Gamesa use carbon fiber rather than less expensive fiberglass (resin epoxy strengthened) for their largest blades because of its lighter weight and strength. A design challenge is that towers need to be taller because wind speed increases with height above ground. The challenge is how to place increasingly larger turbines on ever taller towers. Increasing turbine power potential relative to weight and size is a major innovation challenge. Noise reduction. There are two potential sources of noise: the turbine blades passing through the air as the hub rotates, and the gearbox and generator in the nacelle. Noise from the blades is minimized by careful attention to the design and manufacture of the blades. The noise from the gearbox and generator is contained within the nacelle by sound insulation and isolation materials. Direct drive turbines have no gearbox or drive train, and thus no high speed mechanical (or electrical) components. Direct drive turbines are therefore much quieter than gearbox machines as they do not produce mechanical or tonal noise141.
138 Comparisons between firms must be made carefully because an abrupt change in net sales in a given year can give a distorted view of change in research intensity. Also start-up firms with modest research expenditures and limited sales may show very high R&D expenditures as a percent of sales. Furthermore, research expenditure totals may include funds received from government research grants. 139 Industry Canada. (2004). Supply-Chain Capabilities in the Canadian Wind Power Industry. 140 Zayas, J. R., & Thatcher, R. (2008). Wind energy manufacturing and supply chain development proposal. NREL and Sandia National Laboratories. 141 British Wind Energy Association. (2000). Noise from wind turbines: The facts.

45
Table 11. R&D as a Percentage of Sales for Top-Ten Turbine Manufacturers
Company
R&D (millions
of Euros)
Sales (millions of Euros
or Dollars)
R&D/Net Sales Ratio
Source
Vestas 127 4,861 2.6% http://iri.jrc.ec.europa.eu/research/docs/2008/Scoreboard_2008.pdf
Gamesa 30.91 3,260 0.9% http://iri.jrc.ec.europa.eu/research/docs/2008/Scoreboard_2008.pdf
Acciona Energy 16.32 1,093 1.5%
http://www.acciona-energia.es/secciones/000109/En/ACCIONA_2007_Results.pdf
Nordex 17.24 747 2.3% http://iri.jrc.ec.europa.eu/research/docs/2008/Scoreboard_2008.pdf
Siemens Energy 510
20,000 (energy business
only)
2.5%
http://www.conama.cl/portal/1301/articles-43967_SiemensEnergyConama.pdf http://w1.siemens.com/annual/07/en/index/glance/research_development.htm
Enercon -- 2,302 -- http://www.hoovers.com/Enercon-Gmbh/--HD__yryykrkct,src__global--/free-co-dnb_factsheet.xhtml
Suzlon .29
(millions of USD)
139.9 (millions of USD)
0.21% http://www.suzlon.com/Content/Publication/AnnualReports_PDFs/Annual_Report_07-08.pdf
Goldwind -- 436.7
(millions of USD)
-- http://www.forbes.com/markets/feeds/afx/2007/11/20/afx4357617.html
GE Energy
1,000 (millions of USD)
14,000 (millions of USD) (energy
and environ-
ment products
only)
7%
http://ge.ecomagination.com/site/downloads/news/2007ecoreport.pdf
Sinovel -- 28.3
(millions of USD)
-- www.citronresearch.com/wp-content/uploads/2008/06/sinovel_dnb.pdf -

46
Vibration damping and improved mechanical design have also significantly reduced noise from mechanical sources. Turbines can be designed or retrofitted to minimize mechanical noise. This can include special finishing of gear teeth, using low speed cooling fans and mounting components in the nacelle instead of at ground level, adding baffles and acoustic insulation to the nacelle, using vibration isolators and soft mounts for major components, and designing the turbine to prevent noises from being transmitted into the overall structure. Efforts to reduce aerodynamic noise have included the use of lower tip speed ratios, lower blade angles of attack, upwind turbine designs, variable speed operation and most recently, the use of specially modified blade trailing edges142. Modifications of the rotor blade trailing edge (sharp or serrated) and the tip design (avoiding tip vortex-trailing edge interaction by “trailing edge cutting”) resulted in considerable noise reduction in the range of several decibels. As blade airfoils have become more efficient, more of the wind energy is converted into rotational energy, and less into acoustic noise. Improved gearboxes or gearless mechanisms. Despite adherence to accepted design practices, wind turbine gearboxes have yet to achieve their design life goals of twenty years, with most systems requiring significant repair or overhaul well before the intended life is reached143. Most gearbox failures do not begin as gear failures or gear-tooth design deficiencies. The observed failures appear to start at several specific bearing locations under certain applications, which may later advance into the gear teeth as bearing debris and excess clearances cause surface wear and misalignments. These failures are occurring in spite of the fact that most gearboxes have been designed and developed using the best bearing-design practices available. Thus research focus should be aimed at discovering weaknesses in wind turbine gearbox bearing applications and deficiencies in the design process. Since bearing manufacturers do not have broad or intimate knowledge of gearbox system loads and responses that may be contributing to unpredicted bearing behavior beyond the bearing mounting location such as housing deformations, they are not capable of making thorough analyses on their own. A broader collaboration of the various stakeholders, each of whom holds a piece of the answer, is clearly needed. NREL is leading such a collaboration that will engage key supply chain representatives, including turbine owners, operators, gearbox manufacturers, bearing manufacturers, lubrication companies, and wind turbine manufacturers144. Generators/converters. Since the late 1990s, most of the top-ten turbine manufacturers have used asynchronous or doubly-fed induction generators. The advantages of DFIGs include the ability to allow for some slip in the rotational speed of the turbine, which permits increased energy capture by absorbing wind gusts as momentum, as well as reducing peak torques on the gearbox and improving power quality. Additionally, only 30% of the rated power needs to be sent through
142 Rogers, A. L., & Manwell, J. F. (2002). Wind turbine noise issues. University of Massachusetts at Amherst, Department of Mechanical and Industrial Engineering. A white paper prepared by the Renewable Energy Research Laboratory, Center for Energy Efficiency and Renewable Energy. Unpublished manuscript. 143 Enercon has demonstrated that gearless mechanisms can be very successful. None was installed in the U.S. last year, however. 144 Musial, W., Butterfield, S., & McNiff, B. (2007). Improving wind turbine gearbox reliability. Preprint from National Renewable Energy Laboratory.

47
power conditioning equipment for compliant connection with the grid145. However, transient grid events can result in loading on the generator and gearbox, and therefore gearbox reliability depends on grid quality. Synchronous generators increase system cost because they require conversion of 100% of the rated power, but they provide greater grid stability (voltage and frequency). Enercon uses electrically excited synchronous generators because they are better suited for direct drive (gearless) systems. Permanent magnet (PM) synchronous generators eliminate much of the weight associated with more traditional wound motors146. The newest generation of design, such as GE Wind’s 2.5xl, uses a PM generator with full power conversion, which allows for more control and no feedback from the grid. With a 2.5% efficiency increase in power curve output at lower wind speeds, the added cost of the full power conversion is more than offset. Preventative and condition-based maintenance. Condition monitoring is not standard on many of the wind turbines on the market and it is often not cost effective to include this equipment after-market. As wind turbine installations extend to offshore areas, maintenance has to be minimized through the introduction of preventative maintenance strategies and tools that have been developed on the basis of low cost and extremely reliable condition monitoring methods147. However, cost-benefit analyses will have to dictate the nature and extent of monitoring equipment to include. Embedded diagnostics and sensors can be incorporated on thousands of pieces of equipment, but it may take just a few key readings to understand the health of the machinery. For instance, hub mounted fiber optic blade monitoring standards are now available that can provide information about rotor blade loading conditions. Experience curve/Economies of scale. The cost per kilowatt can be reduced substantially by spreading fixed costs over more units. As with the solar industry, virtually every industry incumbent has announced capacity expansion plans for 2008-2010. Also, the experience curve reduces production costs (e.g., throughput, yield) by 6-9% for every doubling of production volume148. Consequently, most of the major turbine manufacturers have been expanding capacity rapidly. Minimum efficient scale raises entry barriers for potential new entrants. Larger scale also enhances a firm’s bargaining position when purchasing raw materials from suppliers.
145 Industry Canada. (2004). Supply-Chain Capabilities in the Canadian Wind Power Industry. 146 Loi, L. L., & Chan, T. F. (2007). Distributed Generation: Induction and Permanent Magnet Generators. New York: John Wiley and Sons. 147 European Wind Energy Technology Platform. (2008). Strategic Research Agenda Market Deployment Strategy, From 2008 to 2030. SYNOPSIS. 148 Wiser, & Bolinger. (2008). Annual report on U.S. wind power installation, cost, and performance trends: 2007. U.S. Department of Energy, Energy Efficiency and Renewable Energy.

48
Industry Evolution Market Concentration. The global wind turbine industry is less concentrated now than it was four years ago149. In 2004, the top-five global manufacturers had a total market share of 85.5%150. In 2008, the top-five manufacturers had a market share of 69.4%. Two of the newcomers are Chinese (Goldwind, Sinovel), one is Indian (Suzlon) and another is Spanish (Acciona). These four companies built up sales in a fairly well-protected home market first before they expanded internationally151. Three of these companies licensed turbine technology from established European companies to manufacture turbines in their home country, e.g., Suzlon from NEG Micon (now Vestas), Goldwind from REPower (now Suzlon), and Sinovel from Fűhrlander. Although not a newcomer, Gamesa also had a licensing agreement with Vestas. International Diversification. Suzlon and Acciona are now expanding rapidly in international markets. Sinovel says that it plans to market and sell 3 MW (in 2008) and 5 MW (by 2011) turbines worldwide for on-shore and off-shore use152. The fifth newcomer to the top-ten list, Nordex, is just beginning to expand beyond Europe into the U.S. The U.S. wind turbine industry concentration has been changing also. Gamesa, Siemens, and Clipper had little or no presence in the U.S. market in 2005, but had a combined U.S. market share of 28% in 2007153. Now that the U.S. market is the fastest growing in the world, six foreign turbine manufacturers have built or are building plants here, mainly for blades and turbine assembly. Expanding Product Range and Market Scope. The product range and market scope of wind turbine manufacturers has also changed considerably since 2004154. At that time, the top-ten turbine manufacturers could be organized into three strategic groups (see Figure 4)155. Only Vestas and Enercon offered a wide range of products; for example, they offered sub-1MW, 1-3 MW (for heavy and light wind) and off-shore turbines. Siemens, GE Wind, Gamesa, (see Table 9) and Mitsubishi offered a narrow range of products. They concentrated mainly on one or two turbine sizes, but expanded early from their home base into international markets. A few companies (Nordex, Suzlon) offered somewhat broader product ranges that were tailored to their home markets, but had no ambitious plans for international expansion at that time.
149 This contrasts with increased concentration among developers, independent power producers, and public utilities that are the turbine manufacturers’ customers (Merrill Lynch. (2007). Wind turbine manufacturers; Here comes pricing power). 150 BTM Consult. (2005). Ten year review of the international wind power industry, 1995-2004 151 Lewis, J. I. (2007). A comparison of wind power industry development strategies in Spain, India and China. Studies in Comparative International Development, 43 (3-4), pp. 208-232. 152 Renewable Energy World. (2007, July 25). AMSC Receives $70M Order from China’s Sinovel Wind. Retrieved from http://www.renewableenergyworld.com/rea/news/story?id=49428 153 Wiser, & Bolinger. (2008). Annual report on U.S. wind power installation, cost, and performance trends: 2007. U.S. Department of Energy, Energy Efficiency and Renewable Energy. 154 Wied, M. (2007). Windy prospects: An Approach to Strategic Foresight in the Global Wind Turbine Industry. Unpublished master's thesis, Roskilde University, Denmark, Department of Technology and Socioeconomic Planning. 155 According to Porter, M. E. (1980). Competitive Strategy. New York: The Free Press, strategic groups are “an intermediate frame of reference between looking at the industry as a whole and considering each firm separately”. Such groups consist of companies that make similar choices regarding degree of vertical integration, what markets to enter, etc.

49
Companies generally expand their product range and market scope by creating or growing market segments that were non-existent or underserved, (e.g., new product applications or geographical regions). Accordingly, by 2008, most of the above firms chose either to expand their product line or their market scope, depending on which expansion path they had taken first. The arrows in Figure 4 suggest the direction of movement of firms in product range or market scope. Thus, Siemens, GE Wind, and Mitsubishi, which were already global companies, expanded their product range (mainly to the off-shore market segment). Suzlon and Nordex, which were domestic or regional companies, expanded globally. Economic logic suggests that it is difficult to expand product range and geography simultaneously because it is overwhelmingly costly and complex to do so. Thus, companies tend to take one path first and then the other.
Figure 4. Strategic Groups in the Wind Industry – 2004*

50
No matter the order of the paths taken, the major players are now beginning to look more similar. They look more like Vestas did in 2004, when Vestas already had a wide product range and a global scope. Vestas could do this because it had been in this industry longer than the others and focused exclusively on wind power (not being part of a larger diversified company). Interestingly, Enercon, the other early wide product-range company, expects 90% of its projects after 2010 to be in Europe and sees the greatest potential for its wind turbines in the German market156. Goldwind and Sinovel remain national companies thus far, but it will be interesting to see what path they take towards growth. As mentioned above, Sinovel has announced plans to sell larger size turbines in international markets. Foreign companies that entered the U.S. market in the last four years did so with a single turbine size; Gamesa (2 MW), Siemens (2.3 MW), Suzlon 2.1 (MW), Acciona (2.3 MW). Mitsubishi only had a 1 MW turbine until recently, and is now offering a 2.4 MW turbine. Domestic manufacturers also did the same, GE Wind (1.5 MW) and Clipper (2.5 MW). Vestas still offers the widest product range worldwide (500 kW, 1.65 MW, 1.8 MW, 3 MW), but only installed the 1.65 MW turbine in the U.S. in 2007157. This evidence suggests that the easiest path to international expansion is with a single product line. Components for any one product are inter-related and their configuration shifts with product size and perhaps application. The supply chain would increase greatly in complexity for multiple product class offerings. Supply chains tend to differ between turbine sizes. Qualifying and certifying multiple component suppliers is difficult enough for one product class, let alone for multiple offerings. This is especially the case in shifts to larger platforms, e.g., from 2 MW to 3 MW turbines. For example, there are currently very few suppliers in the world that are capable of making bearings for 3 MW turbines and larger158. Future Directions Industry Consolidation. High entry and exit barriers related to minimum efficient scale and specialized assets may encourage consolidation among incumbent turbine manufacturers. Whether the same will occur for component manufacturers and service providers is less certain. Utilities and independent power producers are acquiring developers, and as they do, they become more knowledgeable and sophisticated customers and likely will demand stronger warranties, more services, and enhanced product performance from turbine manufacturers. Turbine manufacturers may acquire developers also. However, this trend in the U.S. is apparent only among the two Spanish manufacturers, Gamesa and Acciona159.
156 Windblatt. (2008). ENERCON's future markets. 3, 6-7. 157 Three of the top-ten turbine manufacturers expanded their product range in U.S. projects in 2008. Vestas introduced 500 kW, 1.8 MW and 3.0 MW turbines, Suzlon introduced 1.25 MW turbines, and Mitsubishi introduced 2.4 MW turbines. 158 deVries, E. (2008). The challenge of growth: Supply chain and wind turbine upscaling challenges. Renewable Energy World Magazine, 11 (3). 159 Wiser, & Bolinger. (2008). Annual report on U.S. wind power installation, cost, and performance trends: 2007. U.S. Department of Energy, Energy Efficiency and Renewable Energy.

51
Product and Process Innovation. As mentioned earlier, rapid market growth has resulted in shortages of turbines and components. In order to reduce uncertainty over sourcing and delivery, buyers and sellers at all levels have increasingly entered into three to five year framework agreements. These agreements may encourage turbine manufacturers and their component suppliers to increase investments in process innovation to enhance productivity, e.g., shift from batch to serial production, at least in the 1.5 MW to 2.5 MW range. Product innovation will remain strong in the 3 MW and higher turbine sizes, especially for firms that seek to enter the off-shore market segment. Rivalry among Competitors. The current economic downturn has reduced the price of energy substitutes, especially natural gas, which competes directly with wind for sale to utilities. Whether the extension of the PTC for another year is sufficient to counter the enhanced competiveness of natural gas remains to be seen. Rivalry between competitors (developers or turbine manufacturers) is generally not intense as long as the overall market grows rapidly, but could intensify if the market stops growing or even shrinks. This would be reflected in price cuts and more likely by offering more services and enhanced product performance to customers. Projections of Growth. It is too early to tell if projections of growth in installed capacity need to be revised downward in light of current economic conditions. BTM Consult (2008) expected the three regions of the world (Europe, Asia, and the United States) currently producing renewable energy capacity to contribute about equally to the projected increase in global capacity between 2007 (19,791 MW) and 2012 (287,000 MW). There is no reason to expect the proportion to change in an economic downturn. European growth is expected to come more from Eastern than Western Europe because penetration in Western Europe is already high and sales rely heavily on replacement of older smaller turbines with newer larger ones (plus new off-shore installations). Asian growth (mainly China) will increasingly come from Chinese companies. The market share of Chinese manufacturers relative to foreign manufacturers has increased from 21.1% to 55.4% in only four years160. In the U.S., a national renewable portfolio standard or feed-in tariff would likely raise the expected capacity addition for 2012 above the current projection of 14,000 MW161 to that targeted by the DOE to reach 20% wind energy power by 2030 (16,000 MW per year).
160 BTM Consult. (2008). International Wind Energy Development, World Market Update 2007, Forecast 2008-2012 161 BTM Consult. (2008). International Wind Energy Development, World Market Update 2007, Forecast 2008-2012

52
PHASE II. SOLAR AND WIND ENERGY INDUSTRY PARTICIPATION WITHIN THE APPALACHIAN REGION Introduction Phase II contains three parts, each of which studies aspects of the solar and wind industries in Appalachian counties. Part 1 is a review of an analysis of industrial distribution and concentration of manufacturing activities that was commissioned by the ARC162. It uses County Business Patterns data on estimated employment and plants to examine the geographical dispersion within the region of potential parts suppliers in the solar and wind industries and employment prospects. Part 2 describes the creation of a database of firms in the region that were identified as potentially involved in the solar and wind industries. This database included manufacturing firms as well as service providers such as installers and distributors. We contacted all of these firms to identify which ones were actually involved in the solar or wind industry. We sent surveys to those who reported that they were involved so that we could understand the organizational, workforce and competitive challenges they faced. Part 3 reviews the policy landscape in the Appalachian region to identify where and how policies encourage the development of the solar and wind industries in the region. NAICS Codes to Identify Potential Firms and Employment in Solar and Wind Industries We identified a significant number of potential firms in the solar and wind industries by using the six-digit NAICS codes that were used by the wind and solar Renewable Energy Policy Project (REPP) studies of manufacturing activity that were completed in 2004163 and 2005164, respectively. REPP is an advocacy group responsible for some of the early research in the U.S. on the potential of renewable energy to seriously augment the nation’s supply of electricity. REPP took the key components of renewable energy products and broke them down into their constituent parts and then linked them to their corresponding NAICS codes––classifying industrial activity based on the elemental parts of a product165. The fundamental analytical basis of these reports has been utilized by both government and private sector researchers to identify potential job creation and industrial development in particular geographic areas166. While using the REPP strategy as a baseline, several important studies augmented the original approach of REPP to form tailored lists of parts and link them to firms with potential to supply renewable energy industries. According to the Office of Management and Budget (OMB), which administers the NAICS system, the NAICS system was originally designed (1) “to facilitate the collection, tabulation, 162 Glasmeier, A. K., Feingold, R., Guers, A., Hay, G., Lawler, T., Meyer, A., et al. (2007, September). Energizing Appalachia: Global challenges and the prospect of a renewable future (Research Report). Washington, D.C.: Appalachian Regional Commission. Retrieved from http://www.arc.gov/images/reports/2008/energy/ARC_EnerApp_Final_full. 163 Sterzinger, G., & Svrcek, M. (2004, September). Wind turbine development: Location of manufacturing activity (Technical Report). Renewable Energy Policy Project. 164 Sterzinger, G., & Svrcek, M. (2005, January). Solar PV development: Location of economic activity (Technical Report). Renewable Energy Policy Project. 165 See Appendix III 166 See U.S. Department of Energy. (2008). 20% Wind Energy by 2030: Increasing Wind Energy's Contribution to U.S. Electricity Supply, DOE/GO-102008-2567. Available on-line from http://www.osti.gov/bridge.

53
presentation, and analysis of data relating to establishments, and (2) to promote uniformity and comparability in the presentation and analysis of statistical data describing the North American economy.”167 NAICS codes, although useful in accounting for the elemental activities of business establishments were, for the purposes of our study, limited in their ability to reflect unique system element components of industries such as wind and solar energy. We utilized the classification system in both ways in which it was intended; however, it presented real limitations when studying an industry that had heretofore not been distinctly classified for accounting or research purposes. Although we could identify constituent elements of wind and solar systems, we could not uniquely identify establishments producing parts for these industries alone. This systemic problem plagues all researchers following the REPP classification procedure168. Throughout the locational analysis and survey administration and data collection process, issues arose concerning the level of effectiveness of NAICS codes when attempting to identify firms in the emerging industries of wind and solar energy. Two major limitations of the REPP procedure emerged as we proceeded. First, in Part 1, it was evident that the REPP listing of potential NAICS169 codes was not sufficiently comprehensive. In particular, depending on the REPP study, the definition of the product components of the industries varies by geography. For example, the breakdown of product components for the wind industry in Pennsylvania differs significantly from a similar study done in a state like Massachusetts. Thus as we built our listing of NAICS to track potential employment and establishments, we had to ensure we were able to account for differences in the presence of industry product components across the ARC states. Second, in Part 2, sole reliance on codes identified in REPP studies limited the sample size and the representation of potential product components and services in the solar and wind industries. Thus, we expanded the sample by adding companies that were identified in other studies or listed in industry databases or websites170. We found their NAICS code by consulting www.manta.com or www.hoovers.com.171 By adding these firms and their NAICS code to the list of firms that were identified through NAICS codes used in the REPP studies, we were able to compile a database of firms to contact in order to verify and learn more about their involvement in the industry.
167 Office of Management and Budget. Executive Office of the President. (2009, January 7). 2007 North American Industry Classification System (NAICS) -- Updates for 2012. Federal Register, 74 (4), pp. 764-768. 168 This problem is not unique to renewable energy industries. Back in the early 1980s, when high technology industries were beginning to emerge as sources of employment, the standard procedure for uniquely identifying constituent elements of these industries was the use of the occupational profile of them. This occupational profile of industries and product groups were identified using Standard industrial Classification codes (precursor to the NAICs). The parallels with today's attempt to identify the employment potential of renewables are striking. In the case of high tech, misclassification, especially related to the location of establishments and potential of employment similarly plagued the early researchers working on high technology industry regional development (see Markusen, A. R., Hall, P. & Glassmeier, A. (1986). High-Tech America: The What, How, Where and Why of the Sunrise Industries. London: Allen and Unwin). 169 See Appendix III for codes identified in REPP Reports. 170 See Major Survey Findings/Observations of this report, p.76-77 171 Another shortcoming of using NAICS codes is that codes are not necessarily unique and reference sources don’t always agree on the code. This is because sometimes a firm manufactures, installs and sells its product. One source may consider manufacturing to be the firms’ primary function and another source considers it to be distribution.

54
Part 1. Pattern of Manufacturing Activities and Potential Employment in Appalachia Sources and Methodology. This section of the report analyzes the capacity of the Appalachian region to supply major manufactured components for renewable energy industries, compiling information on existing manufacturing establishments, estimated employment totals, locations and sector concentrations within the region172. Six-digit NAICS codes were analyzed for all counties within the Appalachian region. Using County Business Patterns (CBP) data, which includes establishment counts and estimated employment levels, NAICS codes were used to identify product components associated with the solar and wind industries. The component NAICS codes were derived from reports produced by the Renewable Energy Policy Project173. As previously discussed, this analysis reflects industry specific manufactured components that are similar to, or substitutable for, the major manufactured components in the solar and wind energy industries. In this analysis, existing establishments that manufacture the relevant components in the Appalachian region were isolated. We aggregated the NAICs-code identified establishments into two groups, wind and solar, for ease of discussion. The results are presented for the wind and solar sectors, and for counties that meet one of four criteria: 1) estimated job totals of 500 or greater; 2) 10 or greater establishments; 3) an average estimated establishment employment size of 125 employees or greater; or 4) five or more components for the industry are produced. Several NAICS codes are relevant to more than one renewable energy industry. The analysis that follows is aimed at demonstrating the relative capacity of counties within ARC states to participate in the potential manufacture of components for the wind and solar industries. This analysis reflects not only the potential capacity to manufacture renewable components from existing establishments within the region, but also the potential distribution of increased manufacturing that might accompany continued growth in the renewable energy sector. Analysis in this section of the report reveals distribution of existing establishments within states, and potential clusters of manufacturers with the potential to produce parts for individual energy sectors. Results. The share of employment and the location of establishments are not equally distributed between all of the ARC member states or their respective counties (see Figures 5 and 6)174. Pennsylvania possesses the largest job potential in the region, followed by Tennessee, North Carolina and South Carolina, respectively. Employment totals range from 1,438 in Maryland, possessing 1% of the potential, up to 60,115 in Pennsylvania with 30% of the employment potential175. It is important to note that the number of counties encompassed within the ARC varies greatly between member states, ranging from all of West Virginia’s 55 counties to 52 of Pennsylvania’s, to only six from South Carolina and three from Maryland. 172 The analysis in this section is based on research by A. Glasmeier, et al., Ibid. 173 Sterzinger, G., & Svrcek, M. (2005). Component Manufacturing: Ohio’s Future in the Renewable Energy Industry. Renewable Energy Policy Project. 174 See Appendix IV for more detailed data aggregated by state. 175 Several NAICS codes are relevant to more than one renewable energy industry. State-based totals include potential facilities for solar, wind and biomass production.

55
Figure 5. Potential Renewable Energy Manufacturing Employment in ARC Counties (By State)
Figure 6. Total Establishments with Renewable Manufacturing Potential in ARC Counties (By State)
County-Level Solar Manufacturing Capacity. Counties with substantial presence of establishments that have the potential to produce components for the solar industry were selected for either their total number of potential jobs in the solar sector, total number of firms per county, the potential number of different types of components for the solar sector, or average establishment size176. Figures 5-10 show solar job totals, number of potential establishments and the number of different solar components for counties with job totals over 500 and wind components for counties with job totals over 1000.
176 See Glasmeier, et al., Sources & Metholodogy, pp 34-35.
Potential Renewable Energy Manufacturing Employment in ARC Counties
Alabama, 9,064, 5%Georgia, 15,293, 8%
Kentucky, 7,206, 4%Maryland, 1,436, 1%
New York, 12,526, 6%
North Carolina, 16,604, 8%
Ohio, 9,787, 5%
Pennsylvania, 60,115, 30%
South Carolina, 16,319, 8%
Tennessee, 26,244, 13%
West Virginia, 9,833, 5%
Mississippi, 6,681, 3%
Virginia, 8,690, 4%
Total Establishments with Renewable Manufacturing Potential in ARC Counties
Alabama, 135, 5%Georgia, 258, 9%
Maryland, 33, 1%
New York, 138, 5%
North Carolina, 237, 9%
Ohio, 191, 7%Pennsylvania, 866, 33%
South Carolina, 170, 6%
Tennessee, 355, 13%
West Virginia, 148, 5%
Mississippi, 72, 3%
Kentucky, 66, 2%
Virginia, 68, 2%

56
Figure 7. Counties with Potential Solar Manufacturing Jobs over 500
Figure 8. The Number of Firms and Components for Counties with Potential Solar Job Totals over 500
Counties with Potential Solar Manufacturing Jobs Over 500
0
500
1000
1500
2000
2500
3000
Wood
Allegheny
Watauga
Westmoreland
Greenvil
le
Spartanburg
Forsyth
Burke
Luze
rne
Erie
Oconee
Washin
gton
Madis
on
Haw
kin
s
Muskin
gum
Schuylkil
l
Hamil
ton
Buncombe
Beaver
Steuben
WV PA NC PA SC SC NC NC PA PA SC OH KY TN OH PA TN NC PA NY
Number of Firms and Components for Counties with Potential Solar Manufacturing Jobs Over 500
0
5
10
15
20
25
30
35
40
45
Wo
od
All
eg
hen
y
Wata
ug
a
Westm
orela
nd
Green
vil
le
Sparta
nbu
rg
Fo
rsyt
h
Bu
rke
Lu
zern
e
Erie
Oc
on
ee
Wash
ing
ton
Mad
iso
n
Haw
kin
s
Mu
skin
gu
m
Sc
hu
ylkil
l
Ham
ilto
n
Bu
nc
om
be
Beaver
Ste
uben
WVPANC PASCSCNCNCPA PA SCOHKY TNOHPATNNC PA NY
Number ofFirmsNumber ofComponents

57
Figure 9. Counties with Potential Wind Manufacturing Job Totals over 1,000
Figure 10. Number of Firms and Components in Counties with Potential Wind Manufacturing Jobs over 1,000
Counties with Potential Wind Manufacturing Jobs Over 1000
0
1000
2000
3000
4000
5000
6000E
rie
Gr
een
vil
le
Westm
or
elan
d
Gw
inn
ett
Br
oo
me
An
der
so
n
Alleg
hen
y
Lyc
om
ing
Kn
ox
Spar
tan
bu
rg
Watau
ga
Bu
nc
om
be
Hall
Ch
er
okee
Rit
ch
ie
Ch
au
tau
qu
a
Jac
kso
n
Beaver
Ru
th
er
fo
rd
PA SC PA GA NY SC PA PA TN SC NC NC GA SC WV NY KY PA NC
Number of Firms and Components in Counties iwith Potential Wind Manufacturing Jobs Over 1000
0
10
20
30
40
50
60
70
Er
ie
Gr
een
vil
le
Westm
or
elan
d
Gw
inn
ett
Br
oo
me
An
der
so
n
Alleg
hen
y
Lyc
om
ing
Kn
ox
Spar
tan
bu
rg
Watau
ga
Bu
nc
om
be
Hall
Ch
er
okee
Rit
ch
ie
Ch
au
tau
qu
a
Jac
kso
n
Beaver
Ru
th
er
fo
rd
PA SC PA GA NY SC PA PA TN SCNC NC GA SCWV NY KY PA NC
Number ofFirms
Number ofComponents

58
Part 2. Identifying and Surveying Firms Involved in the Solar and Wind Industries The first task of Part 2 was to build a database of firms that have the potential to be involved in the solar and/or wind industries in the Appalachian region. We only included firms with solar/wind facilities in Appalachian counties (as defined by Appalachian Regional Commission standards)177. This was the only way to ensure an objective and consistent basis for inclusion or exclusion in the study. Firms on this list were then contacted to document their involvement in the target industries. We then administered surveys to those firms that reported to be involved in these industries. Database Construction. In the ARC region, using NAICS codes as identifiers, the universe of all companies involved in the solar and/or wind industries is unknown and largely undefined within existing means of categorization. Given the previously noted constraints of the classification system, we recognized in this project there was no feasible way absent a much larger and more resource intensive study to develop a 100% inclusive count of firms involved in the two industries. To the best of our ability, and following the practice of other researchers in the field, we developed a list of firms for potential interviews, using several widely used and publicly available sources to construct a database of firms to contact. Typically, a research project that has as its goal the identification of firms based on industry location and activity relies on a database that yields both a high degree of specificity and geographic precision. However, few publicly available databases can provide the level of detail necessary to accomplish that goal. In light of these limitations, using multiple recognized sources, we chose a reasonable pathway to achieve our goal of finding solar and/or wind energy companies within Appalachia. We expanded our sample of potential firms by adding 85 firms that were identified in Phase I of this report178. We also utilized industry reports and databases (listed below) to supplement the Phase I listing. Finally, we searched Hoover’s online-database using the NAICS codes identified in the REPP reports. A detailed description of each source and the number of companies identified follows: Saint Francis University Renewable Energy Directory179––Fourteen firms came from this small database that is compiled by St. Francis University’s (Loretto, PA) Renewable Energy Center. The selection of this source was based on the center's role in small scale renewable energy industries. In particular, the St. Francis center is a DOE-funded program for the deployment and study of small wind systems. Its client base is national in scope. It contains over 60 firms that were pre-contacted and confirmed to serve the biofuels, geothermal, hydro, solar, or wind sectors. Mainly, the directory is focused on installers that connect equipment manufacturers with end users. The database contains 24 firms in solar and 17 in wind energy. Some firms are cross-listed and appear as installers/distributors of both types of systems. 177 See Appalachian Regional Commission. (n.d.). http://www.arc.gov/index.do?nodeID=27 for a listing of ARC-defined counties. 178 See Phase I of this report, Table 4 on p. 14 and Table 8 on p. 38. 179 Saint Francis University. (n.d.). Pennsylvania Renewable Energy Directory. Retrieved from Saint Francis University Renewable Energy Center Website: http://www.francis.edu/renewableenergy4pa.htm

59
Alternative Energy Report: Central PA Workforce Development Area180 ––We gathered the names of 113 firms from this report, which was prepared by the Central Pennsylvania Workforce Development Corporation (CPWDC) for the Central Pennsylvania Workforce Investment Board. These organizations are driven by their common mission––to support labor and job training demands in central Pennsylvania. The report identifies firms, using the standard REPP-defined NAICS codes for both solar and wind, that have the potential to be involved in either sector in a nine-county region in central Pennsylvania. Pennsylvania Wind Energy Symposium––We utilized the list of participants from the 2008 Pennsylvania Wind Energy Symposium, held in November 2008 at Penn State, to help build our database of firms. This symposium was regional in scope, with participants from states including Kentucky, Maryland, New York, Ohio, Pennsylvania, Virginia, and West Virginia. After reviewing the listing of individuals, we determined that 42 associated companies/organizations fell within the ARC borders. These individuals and firms encompassed installers, manufacturers, educators, and many other roles within the national wind market. We utilized information that was provided to conference organizers to contact these respective entities. Hoover’s Database––Hoover’s is a Dun & Bradstreet commercial database that provides information on more than 19 million firms worldwide. The interface allows users to input search criteria and generate a list of companies that fits user-defined criteria and falls within the inherent limits of the database itself. Aware of the limits of the REPP studies – the methodology used to identify renewable energy companies in various government and private sector studies181 – we focused our Hoover’s search on two major limiting factors––location within the Appalachian Region and REPP-defined NAICS codes. We utilized REPP codes in this search in order to maintain a level of comparability and standardization across geography and firms. Our search yielded 109 firms to add to the database. It is important to note that Hoover’s search criteria focus exclusively on metropolitan areas thus skewing the collection of firms toward urban locations. This, along with other previously mentioned limiting factors, makes it impossible to identify all potential firms in the target industries and prevents the compiled universe of companies from being a representative sample. As a result of this information gathering, we compiled a list of 363 firms that were in the ARC region and potentially involved in the solar and/or wind industries, but were unconfirmed participants. The next section describes the process used to refine this list and determine involvement in the solar and/or wind energy industries. See Figure 11 for more detail.
180 Central Pennsylvania Workforce Development Corporation. (2007, September). Alternative energy report: Central Pennsylvania workforce investment area (Research Report). Lewisburg, PA: Central Pennsylvania Workforce Investment Board. 181 See earlier section: “Identifying Constituent Elements of Wind and Solar Energy Industries” for further discussion.

60
Figure 11. Phase II – Construction of Firm Database
Sample Details. Of the 363 total companies identified, 132 (36%) come from Pennsylvania. The Commonwealth is oversampled in this collection of possible firms for two main reasons: (1) the need to pilot the survey and test its ability to collect quality data, and (2) more than 30% of regional renewable energy industry capacity, as identified by Energizing Appalachia182, is located in Pennsylvania. In order to capture the widest swath of sectors within the wind and solar
182Glasmeier, A. K., Feingold, R., Guers, A., Hay, G., Lawler, T., Meyer, A., et al. (2007, September). Energizing Appalachia: Global challenges and the prospect of a renewable future (Research Report). Washington, D.C.: Appalachian Regional Commission. Retrieved from http://www.arc.gov/images/reports/2008/energy/ARC_EnerApp_Final_full.

61
industries, we needed to ensure that as many companies from Pennsylvania were included as possible. Limiting the Collection of Potential Companies. Once we assembled contact information for all 363 firms, we used both Internet searches and telephone calls to determine their involvement in the target industries. First, we attempted to contact all 363 firms by telephone. If we were unable to contact a firm, we turned to information available on the Internet to determine the extent of its solar or wind activities. If no information was available online, we considered the firm ‘unable to contact.’ Of the original set of 363 firms, we found that two of the 74 currently involved firms were duplicates (in both cases the company was listed under both the owner’s name and the company name at the same address). We confirmed that the remaining 72 companies or 20% were involved in solar and/or wind energy industry activities; significant supply chain participation for an emerging industrial sector. Of the 207 with no industry involvement, 194 responded with a definitive “no” when asked about involvement and 13 firms said that they were involved, but had solar or wind production or service facilities only outside the region. We were unable to verify the product or services of 54 firms via the phone or Internet. In addition, 28 companies had phone lines that were disconnected, or when answered, responded that the company was “out of business”. We considered these firms to be defunct. See Figure 12 for a graphic representation of how the database of firms is constructed. Figure 12. Collection of Firms (361 Total)
After attempting to reach all 363 companies, we confirmed that 72 companies were involved in solar and/or wind energy industry activities. This number includes manufacturers and service providers. For the purposes of this study, we defined service providers as including installers,

62
site developers, maintenance technicians, and/or distributors. Based on linking firms with their NAICS code, we determined that 21 firms were involved in manufacturing components for the wind or solar industry and 34 firms were service providers. We were unable to determine the NAICS code for 17 of the 72 firms. A check of the websites of most of these 17 firms suggests that they are service providers. However, we will leave their designation as undetermined for purposes of this study. See Table 12 for a listing of NAICS codes and corresponding products/services for companies that we identified as involved in the solar or wind industries.
Table 12. NAICS 2007 Codes of Solar and Wind Industry Participants (n =72)
# NAICS NAICS Industry Sample Products/Services 19 221119
236115 236116 238210 238220 238290
Plumbers, electricians, HVAC contractors, commercial and residential builders, code 221119 includes developers/installers of large wind farms, solar systems
Construction of buildings, installation of solar panels, wind systems on residential or commercial buildings. Some repair and distribution of systems.
21 325211 326199 327211 331511 332312 332991 333295 333612 334413 334513 334517 335312 335313 335911 335931 335999 336412
Manufacturing: plastics material and resin, flat glass, iron foundries, fabricated structural metal, ball and roller bearings, semiconductor and related device, instruments and related products, measuring, displaying, and controlling industrial process variables, motors and generators, switchgear and switchboard apparatus, storage battery, current-carrying wiring device, all other miscellaneous electrical equipment and components, aircraft engine and engine parts
Materials used in wind/solar, wind turbine blades, glass forsolar panels; solar incorporated skylights, wind turbine hubs, bedplates, and gearbox housings for wind turbines and solar arrays, wind turbine tower, wind turbine bearings, slip rings used in electronic control of wind turbines; solar modules, SCADA manufacturing and fabrication, turbine inspection equipment, wind turbine blades, electrical systems used in wind turbines, solar energy storage battery development and distribution, production of switchgear equipment for solar PV, distributors and installers of renewable energy systems, gearboxes for wind turbines
9 423510 423610 423620 444110 444190 453998 488999
Electrical apparatus and equipment, wiring supplies, and related equipment merchant wholesalers, electrical and electronic appliance, television, and radio set merchant wholesalers home centers, other building material dealers
Wholesale and retail distribution of solar PV, small wind systems, miscellaneous renewable energy products, some installation, repair, maintenance of solar and wind systems
6 517919 541330 541611 541990 561110 561990
All other telecommunications, engineering services, all other professional, scientific, and technical services, office administrative services
Professional services, consulting, feasibility assessment, some design and installation of solar and small wind systems
17 Unable to determine NAICS code

63
Spatial Analysis of Firms. In order to identify the spatial distribution of the firms included in the database and those involved in the industries, we mapped the information. The maps that follow (See Maps 1 through 4) are choropleth in style and display the density of firms at the county scale. Map 1 displays the spatial distribution of all 363 firms identified as having the potential to be involved in the solar and/or wind energy industries in the Appalachian region. The companies are distributed across 108 unique counties and all 13 ARC states are represented. While the distribution seems haphazard at first glance, two major themes emerge. First, clusters appear around major urban areas (especially in the South) and traditional industrial hubs. This may be due to the limitations of Hoover’s database in areas in which less supplementary data were available to us. Second, the concentration of companies, in general, is consistent with earlier research presented in Energizing Appalachia183. Map 2 identifies the 72 firms that we determined to be involved in either industry. Spread across 51 unique counties, the pattern is somewhat dispersed, but with most firms coming from New York, Pennsylvania, and North Carolina. Alabama and Mississippi showed the fewest number of involved firms in either industry. Map 3 identifies the 21 firms involved, in some way in the manufacturing of goods along the solar or wind energy equipment supply chain. These companies are located within 18 regional counties. This map clearly shows the gap between potential involvement (presented in Map 1) and actual participation in the solar/wind industries in the region. Pennsylvania’s Allegheny County has the most companies involved in manufacturing. Map 4 shows service providers. They are spread rather evenly across the region and are more frequently found than their manufacturing counterparts. In fact, the map identifies 34 firms in 39 separate counties. Theoretically, the spatial distribution of these companies could be correlated with the wind and solar resource geography in the region.
183 Glasmeier, et al., Ibid

64
MAP 1

65
MAP 2

66
MAP 3

67
MAP 4

68
Identifying and Contacting Firms through Survey. Prior to administering the survey across the entire region, we pilot-tested it with Pennsylvania-based firms that were listed in the Central Pennsylvania Workforce Development Corporation (CPWDC) report. As a result, we revised some of the survey questions. We sent the survey to the 72 firms that were identified as involved in the solar and/or wind industries184. Forty surveys were returned or completed via telephone interview. We sent several reminders to the firms that did not return the survey. Firms could complete the survey and mail or email it to us, or they could answer the questions over the phone185. Per the research proposal, the survey sought to gain insight into the challenges these companies faced in entering the solar or wind industry and in obtaining and developing their workforce. The survey is one of several sources of data that we collected for this study, and should be interpreted in light of all of the sources of data collected. Instead the findings serve mainly to suggest directions for more refined future research. The responses, however, provide valuable case-by-case insight into regional firms involved in the two industries. The following section offers an in-depth, question-by-question analysis of the survey results186. Note that variation in number of survey responses between questions is a result of non-response on those items, not a decision to exclude any data provided. This additional caveat serves to reinforce our point that the survey results, while suggestive, are not necessarily indicative of industry-wide practices or trends. Analysis of Survey Results Company/Organization Information. In the first part of the survey, we asked for basic identifying information, as well as year established, location, NAICS classification, number of employees, legal structure, primary functions and markets, and position along the supply chain. Table 13 shows the firms that responded by type of firm and year of establishment.
184 Because of the small number of manufacturing firms in the initial sample that reportedly were involved in solar or wind industry, we decided to mail a second set of surveys in June 2009 that included manufacturing firms among the original 72 that did not respond our first request. We also included 12 manufacturing firms from the original 363 that were identified as “involved but outside the region” because they had engineering or sales facilities in the region. Finally, we included nine firms listed in a publication from the Tennessee Department of Labor and Workforce Development (Growing Green: The Potential for Green Job Growth in Tennessee, November 2008), two from a study by Marshall University (Energy Efficiency and Renewable Energy in Appalachia: Policy and Potential, August 28, 2006), and seven identified by an auto glass manufacturer in Pennsylvania. These 18 additional firms are included in Appendix VI in bold type. 185 A complete version of the survey instrument is available in Appendix V. 186 All 363 potential participant firms are listed in Appendix VI. No firm names or contact information are associated with their survey results in the item analysis, however. Non-disclosure is a requirement of university Human Subjects policies. Furthermore, we indicated to firms surveyed that no identifying information would be made public or discussed in the final report such that an individual firm could be identified.

69
Table 13. Founding Years of Responding Firms (n=39)
Type of Firm
Year Established 1850–1900 1901–1950 1951–2000 2001-
Installers 0 0 5 4 Manufacturers 4 5 10 4
Distributors 0 1 3 3 As expected, installers and distributors are younger firms than are manufacturers. Most installers and distributors likely entered the solar or wind industry to take advantage of perceived opportunities in the 1990s and afterwards. As the majority of manufacturers were founded before solar or wind technology was very well developed or barely existed, these manufacturing firms were able to adapt their existing technologies and capabilities to produce products for the solar and wind industries. A few manufacturing firms were created for the sole purpose of serving these industries. Manufacturers had the highest average number of employees (412), with a range from 1 to 39,000. Installers had the lowest average number of employees (12.4) and distributors had an average of 59.7 employees, but this number was elevated due to one company having 300 employees. Manufacturers conducted business from an average of 10.6 locations, but one large firm elevated the average by having 160 location (median = 1). Installers were almost exclusively single location businesses (average = 1.4). Most distributors operate from few locations (median = 2), but the average was elevated to 48.6 locations because one firm reported that its products were sold at 325 locations by licensed franchisees. Question 11. We asked each firm to describe its legal structure. Thirty-nine firms responded to this question. There is no discernable pattern between types of firms. Thirteen firms identified themselves as S-Corporations, an IRS tax election used by small businesses with fewer than 75 shareholders187. Nine firms were Limited Liability Corporations (LLCs). Twelve firms were conventional corporations. Two firms were sole proprietorships. Three firms gave answers that were not on our list of options, (e.g., dealership). We also asked firms to provide us with their NAICS 2007 code. In most cases, we knew the codes for these firms from other sources; however, the data collected allowed us to compare our designation with theirs. In almost all cases, our designation and theirs were in agreement. In a few cases, respondents didn’t know their NAICS code nor could we find it in the sources we consulted. The NAICS codes, their industry description, and the products and/or services they produce are shown in Table 14.
187 U.S. Internal Revenue Code, Title 26, Subtitle A, Chapter 1, Subchapter S, Part I, §1361(b)(1)(A). (n.d.). S corporation defined. Retrieved from www.law.cornell.edu/uscode/26/1361(b)(1)(A).html

70
Table 14. NAICS 2007 Codes of Survey Respondents (n=40)
# NAICS Industry Products/Services Provided 10 236116
236118 237130 237132 238220 238290 238390 238990
Plumbing, Heating, and Air-Conditioning Contractors
Installation, maintenance, repair, and distribution of wind and solar systems
23 325211 325510 326199 327211 331511 332312 332710 333411 333611 333612 334513 335312 335911 335931 335999 339113
Manufacturers: plastics material and resin, all other plastics products, flat glass manufacturing, iron foundries, fabricated structural metal, current-carrying wiring device, all other miscellaneous electrical equipment and components
Manufacture input materials used in wind/solar, wind turbine blades, glass used in construction of solar panels; installation of solar incorporated skylights, wind turbine hubs, bedplates, and gearbox housings for wind turbines and solar arrays, wind turbine towers, switchgear equipment for solar PV, paint and coating manufacturing
4
423490 423510 453998
Electrical apparatus and equipment, wiring supplies, and related equipment merchant wholesalers, electrical and electronic appliance, television, and radio set merchant wholesalers home centers, other building material dealers
Wholesale and retail distribution of solar PV, small wind systems, miscellaneous renewable energy products, some installation, repair, maintenance of solar and wind systems
1 517919 All other telecommunications Professional services and consulting, feasibility assessment, design, installation of wind/solar systems
2 Unable to determine NAICS code Question 12. Forty respondents answered this question. Respondents were asked to describe the primary functions of their businesses based on the products or services they provide to their customers. The answers indicate that most firms served primary, secondary or more markets, including the solar and wind energy industries. Most of the installers (7) reported that the primary function of the business was solar or wind related. Most of the manufacturers (19), however, reported that the primary function of their business was not wind or solar related. The distributors were mixed with half the firms reporting that their primary business was solar or wind, and half reporting other products or services.

71
Question 13. Forty respondents answered this question. They were asked to indicate who their customers are, (i.e., what sectors do they serve). In a few cases, their answers were unclear or did not address the question sufficiently. We were able in these cases to obtain the information that we sought from their company websites. Generally, their answers fell into four major categories: residential, commercial, industrial, or public sector. Many respondents reported that they served more than one sector. As expected, manufacturing firms serve the commercial sector almost exclusively. Installers and distributors served both residential and commercial/industrial sectors, with the former serving residential customers more heavily. The responses are shown in Table 15.
Table 15. Sectors Served by Founding Years of Responding Firms (n=40)
Type of Firm
Sectors Residential Commercial/
Industrial Public Sector
Installers 8 4 2
Manufacturers 0 21 2 Distributors 3 5 1
Question 14. This question asked respondents whether they were an OEM, first-tier, second-tier or third-tier supplier. Table 16 shows the responses. The total number of responses is greater than 40 because some respondents reported more than one position in the supply chain. This question was intended originally for manufacturers before we expanded the sample to include installers and distributors. Consequently, we believe that many installers and distributors had difficulty answering the question. Six respondents indicated that they were unsure of their supply-chain position. It seems likely also that some installers who reported themselves as first-tier suppliers interpreted OEMs as the end-user or customer. Thus answers to this question should be interpreted cautiously.
Table 16. Position in the Supply-Chain (n=40)
Type of Firm
Supply Chain Position OEM First Tier Second Tier Third Tier Unsure
Installers 1 6 2 2 3 Manufacturers 6 11 6 4 2
Distributors 0 5 2 0 1

72
Experience in Solar or Wind Industries. In the second part of the survey, we gathered information about the ways in which companies are involved in the solar and/or wind industries. Items about products provided to these markets, challenges in starting to produce renewable energy products, sales, and changes over time allowed us to deepen our understanding of the characteristics of firms in these respective markets. Question 15. Thirty respondents answered this question. We asked respondents to indicate the products or services they provide to the solar or wind industry. In most cases, manufacturing firms were limited to just one industry. Installers and service providers, however, often served both industries. Specifically, they provide services for installation of solar PV and small wind turbines. Three of the manufacturers indicated that they were not currently supplying either industry, but had done so previously or currently were bidding for contracts. Table 17 provides the details of their responses.
Table 17. Products/Services Provided by Survey Respondents, by Sector (n=30)
SOLAR WIND BOTH Covered glass Turbine bases Design services Batteries Turbine towers Installation Steel Products Blades Sales of PV and wind equip. Switchgears/Electronics Enclosed gears Pumps Hubs Controls Gearboxes Inks and polymers Main shafts for turbines Question 16. Twenty-four respondents answered this question. The question asked if their firms had been created to serve the solar or wind industry. Although a seemingly straightforward question, the large number of missing answers (16) was due to the question being omitted in the early surveys. The pattern among the 24 responses received was that installers and distributors were much more likely to have been created for the solar or wind industry than manufacturers (7 versus 2), and manufacturers more likely than installers and distributors not to have been created for this purpose (13 versus 2). Question 17. This question had two parts: (a) If your business was not originally created to provide renewable energy products, what prompted you to start doing so? (b) In what year did you begin to sell products to the wind and solar industries? Some respondents were confused by the phrasing of the question and answered even if their business was created originally for renewable energy products. Specifically, seven installers and distributors and three manufacturers reported that solar or wind was their original business. Many of the manufacturers cited recognition of opportunity as the reason for entry into this business, but most interesting is that five of these firms reported that they entered the business because their customers requested that they make parts or components for them. Part b of the question asked what year they started to work in the solar or wind industry. Nine respondents did not answer this question. Perhaps they did not see that the question had two parts. Only ten of the 31 firms that answered part b reported having entered the solar or wind industry before 2000.

73
Question 18. Thirty-seven respondents answered this question, which asked respondents about the challenges they faced in starting to sell solar or wind-related products. The most frequent answer related to customer education and awareness of the benefits of solar and wind energy as well as the extent and certainty of demand. The second most frequent response related to acquisition of technical knowledge. The third most frequent response concerned foreign competition. Manufacturing firms cited technical knowledge most frequently and installers and distributors cited customer demand, education and awareness most frequently. Question 19. This question had three parts, which may explain the high number of missing cases in the last two parts. Also, some respondents may not have answered questions because the answers required disclosure of sensitive data. First, we asked what percentage of overall yearly profit came from sales in the wind/solar sector. Twenty-four respondents answered the question. Twelve respondents indicated that five percent of sales or less came from solar or wind. All but one of these respondents were manufacturers. Eight of the remaining twelve respondents reported that 50% or more of their sales came from solar or wind. Seven of the eight respondents were installers or distributors. Second, we asked about growth of sales. The remaining four respondents reported sales between 5-49% from solar or wind. Eleven respondents answered this question. Eleven indicated that sales had increased over the past year. Third, we asked about market share. Only eleven respondents answered this question. Most of them indicated less than 1%. The large number of missing answers (26) was due to many respondents saying they did not know, could not determine, or the frame of reference for market share was unclear, e.g., state, region, national. Question 20. This question asked respondents if they provide services (e.g., product design solutions, customer support, collaboration, etc.) to their domestic customers, and how essential they were in selling their products and competing in the marketplace. Twenty-five respondents answered this question. Twenty-one said that such services were essential to selling their products. Four did not think such services were essential. Question 21. This question asked respondents if overall sales had been growing in the renewable portion of their business. This question was asked only in a revised version of the survey, essentially as a stand-alone question instead of a part of question 19. Only twenty-two respondents were asked this question. Fourteen of them said that sales were growing and eight said that sales were slowing, flat or down. When combined with the eleven answers from the second part of question 19, we have a total of 25 respondents who said that sales were growing and nine who said they were not. Question 22. We asked those companies that reported growth in their wind and/or solar energy businesses to list the factors that contributed to their growth. Reasons cited included an increase in production efficiency, overall industry growth, greater public awareness, increased ROI for consumers, greater federal solar tax incentives, new product development, commercialization of the technology, increased internal capacity, and soaring energy prices. All of these are factors generally seen as working together to help promote renewable energy in the U.S. Workforce Issues. Policy makers are concerned about the extent to which human capital is available for the growth of the solar and wind industries. There is no comprehensive study of the growing number of training programs that are designed to develop a workforce for the renewable

74
energy industries. In the absence of consensus about the required skills to work in these industries and the limited, but growing number of programs of varying quality, duration, and cost that are available to train workers for these industries, firms in these industries must address workforce issues especially as they relate to product standards and the ability of the existing workforce to meet skill requirements. The third part of the survey asked about workforce issues. We asked questions about new hires, identification of potential employees, requisite skills needed for wind/solar energy production, training programs, and overall workforce preparedness. Question 23. We asked respondents if providing products and/or services to the solar or wind industry has led them to hire any new people in the last twelve months. Thirty-four respondents answered this question. Fifteen respondents said yes and 19 said no. There was no discernable difference between manufacturers, installers and distributors. These data indicate that companies may be entering the solar and wind industries, but job creation does not necessarily follow. Two firms reported that growth in their solar and wind business did not require them to hire new workers because they could shift workers from other businesses that had slowed recently. Question 24. We asked firms that increased their workforce due to growth in the wind/solar industry last year how they identified new employees. Twenty-three companies reported that they did not grow188. Among the 17 that grew, there was no commonly cited means or source for identifying new employees. Some used traditional advertising methods, career fairs, and resume collection. Others used contacts within the industry or took employees from other parts of their business. Temporary agencies, headhunters, networking, technology schools, cooperative programs, and government organizations were also cited as ways to identify potential employees. Question 25. As a follow up, we asked if companies faced difficulty in hiring or finding a sufficient number of workers for their business. Thirty-three respondents answered this question. Twenty-one said they had no difficulty in hiring or finding or hiring workers. However, many of them reported in the previous question that their sales had not grown nor were they hiring any new workers. Twelve respondents reported they had difficulty in hiring workers. Question 26. This question asked respondents to indicate whether or not they had used state-sponsored programs to locate new employees, train them, or locate their business. Thirty-six respondents answered this question. Twenty-three respondents said they did not use such programs. Thirteen said that they used such programs. Ten of the thirteen were manufacturing firms. Question 27. Thirty respondents answered this question. The question asked respondents if solar and/or wind production required a different set of skills as compared to other products that they produce. Interestingly, 10 of the 15 firms that said yes, that different sets of skills were required, were installers or distributors, and 12 of the 15 firms that said no were manufacturers.
188 Respondents left the space for this answer blank if their workforce did not grow.

75
Question 28. This question asked respondents what types of skills they wanted their employees to obtain. There was a follow-up question that asked if their employees already obtained the skills they wanted them to have. The follow-up question was unanswered in virtually all cases. As regards the first question, nine installers and distributors focused on general ability, good math and verbal skills, and on-the-job training. Manufacturers were more specific in the skills they wanted their employees to obtain, such as welding and machining skills, blueprint reading, electrical and mechanical knowledge, and CAD drawing. As was noted in question 26, manufacturers frequently use state-sponsored training programs for the skills they want their workers to obtain. Question 29. We asked firms to grade the preparedness of their employees for participation in the solar or wind industry along an ordinal scale from 1 (not prepared) to 5 (extremely prepared). No discernable differences were apparent between manufacturers, installers and distributors. Table 18. Preparedness of Employees for Participation in the Solar or Wind Industry (n=40)
# of Firms Scale of Preparedness
9 5 – Extremely Prepared 14 4 – Well Prepared 12 3 – Somewhat Prepared 3 2 – Insufficiently Prepared 0 1 – Not Prepared
Questions 30–31. The answers to these two questions were combined. Question 30 asked if training would be required to prepare employees. Question 31 asked if skills needed to be upgraded in the future, what sources would be considered for help with training. The most common response for these combined questions was in-house training, vo-techs, community colleges, consultants, internships, seminars, and trade publications were mentioned. Two installers/distributors mentioned NABCEP certification. Question 32. This question asked if involvement in the wind/solar industries required updating, expanding, or relocating any business facilities. This question was not asked in an earlier version of the survey. Therefore, only 21 of 40 respondents answered this question. Only seven of these 21 respondents answered yes to this question. Six were manufacturers, one was an installer and one was a distributor. Question 33. This question asked companies to look to the next five years and indicate whether they thought that growth in wind and solar energy markets would require them to hire additional workers. Twenty-nine of 32 respondents indicated that more workers would be needed in the future. One answered that it depends on growth in demand. The remaining two respondents said that they would not be required to hire more workers. Foreign Markets Involvement. The fourth part of the survey asked participants about their involvement in foreign markets. Since many of the major OEMs and tier 1 suppliers in the solar and wind industries are foreign-based, it was thought important to explore how U.S. firms competed against foreign suppliers on the latter’s native turf.

76
Question 34. We asked firms if they sold their product or service in another country. Of the 36 firms that answered this question, fourteen firms reported that they sold internationally, 22 firms did not, and four firms did not answer this question. As might be expected, 12 of the 14 firms that sold internationally were manufacturers. The remaining two respondents, an installer and a distributor, sold products in international markets. The installer sold its products in this hemisphere, e.g., Canada, Caribbean. Question 35. Of the fourteen respondents indicating some international sales, the percent of foreign sales varied between 5 and 67%. One firm expected foreign sales to decrease as a percent of total sales due to an anticipated increase in domestic sales. Another firm sold a substantial percent of products to foreign companies in the U.S., but these do not qualify as exports. Questions 36–38. Firms were asked their opinion regarding what specific qualities of their products or services helped to explain their success in foreign markets. The fourteen responding companies indicated that a variety of product-specific qualities explained their success. One glass manufacturer indicated that its product was unique. Another company indicated that product quality explained its success. Another company indicated that its success was due to an ability to customize its product to specific customer needs. Other contributors to success included the low American dollar, demand and plant location matched, and new plant capacity, easy access to capital, and customers that are predominantly foreign. Firms were also asked if they provided their foreign customers with services. These fourteen firms replied that they provide on-site assistance, customer support, engineering support, maintenance, and design services. Finally, the respondents were asked about any special qualities of their products and services that helped them compete in foreign markets. The answers were high quality, reliability of quality and supply, custom-designed products offered at a competitive price and with quick turnaround, low transportation cost, and lower life cycle costs. Question 39. Firms were asked how they kept up-to-date about economic, technological and political changes in the foreign markets in which they compete. The fourteen firms indicated that they read trade journals, online news, networked with industry colleagues, attended conferences, university courses, customer visits, stayed in touch with their overseas distributors, and relied on their R&D department. Question 40. Firms were asked what they did in foreign markets to protect their intellectual property or ideas (i.e., patents, copyright protection, etc.) Of the eight firms that answered, four firms relied on patents, but five relied on non-disclosure agreements, trade secrets, and careful selection of partners. Three firms did not answer this question. Questions 41. This question asked about partnerships or alliances that domestic companies formed with foreign companies. Eight of the fourteen companies indicated some form of relationship with or partial ownership of foreign companies, including contracting for manufacturing and distribution, joint venture, and co-marketing. One company had attempted to develop a more formal relationship with a German company, but the cultures of the two firms were incompatible and the venture failed.

77
Part 3. Review of the Policy Landscape in the Appalachian Region The energy policy landscape in the United States is dynamic and ever-changing. Since renewable energy emits no greenhouse gases, has minimal social and environmental costs, and reduces dependence on foreign oil, its development is encouraged at nearly every level of government. The state of financial markets in the United States and around the world has severely restricted the availability of credit for renewable energy projects. A February 2009 New York Times article suggests that the number of large banks and financial institutions providing credit to the wind and solar industries has fallen by more than 78% since the onset of the crisis189. Given the uncertain national policy landscape and the daunting financial climate, renewable energy will need to be incentivized by states in the near term in order to become cost-competitive with conventional energy sources, until it approaches grid parity with conventional sources. The federal government offers tax credits, loans, and subsidies to both residential and commercial consumers. The recent economic stimulus package––known formally as the American Recovery and Reinvestment Act of 2009––endeavors to remedy financial constraints as well as stimulate demand and job creation, with the inclusion of billions of dollars of investment in the energy sector in the form of tax credits, grants, loans, and other incentives. State and local governments also encourage installation of renewable energy systems through various programs aimed at every level of the supply chain. Demand-stimulating policies, such as tax credits and incentive programs, eventually lead to an increase in production that spurs job creation and industry growth. Programs that conform to these assumptions will be examined within the context of the ARC-defined region. We also review supply side incentives and present information on the benefits of both supply and demand side policy strategies.
189 http://www.nytimes.com/2009/02/04/business/04windsolar.html?_r=2&ref=business

78
Demand Side Incentives Renewable Portfolio Standards. The policy situation in Appalachia varies. As Table 19 shows, 7 Appalachian states have Renewable Portfolio Standards (RPS).
Table 19. Renewable Portfolio Standards in Appalachian States190
State RPS Target Year Wind/Solar Priority Administering Organization
Maryland 9.5% 2022 2% solar, 110% wind credit
MS Public Service Commission
New York 24% 2014 None NY Public Service Commission North Carolina
12.5% 2025 0.2% solar North Carolina Utilities Commission
Ohio191 12.5% 2025 0.5% solar Public Utilities Commission of Ohio Pennsylvania 18% 2020 0.5% solar Pennsylvania Public Utility
Commission Virginia192 12% 2022 wind/solar credit VA Dept. of Mines, Minerals, &
Energy West Virginia193
25% 2025 2X credit for electricity generated or purchased from a RE facility, 3X if the facility is located at a reclaimed surface mine
West Virginia Division of Energy
Statewide Tax Incentives. In the U.S., tax programs are the most widely utilized economic development tool used to stimulate demand for renewable energy194. From federal credits to local incentives, these programs are often the cornerstones of state energy incentive policy. To reap benefits, a tax liability is essential for installers and system owners. In general, tax credits are most appealing to businesses and relatively high income households that can afford to invest in renewable energy technologies. Many states have taken to attaching a conditional energy production requirement that dictates the amount of the incentive195. The February 2009 American Recovery and Reinvestment Act (ARRA) includes provisions for cash rebates in lieu
190 RPS enacted by June 2007 available at: http://apps1.eere.energy.gov/states/maps/renewable_portfolio_states.cfm#chart 191 Ohio passed RPS legislation in April 2008 http://www.renewableenergyworld.com/rea/news/article/2008/04/ohio-senate-passes-rps-legislation-52294 192 Virginia has set a voluntary renewable portfolio goal, rather than a mandated standard. More information at: http://www.pewclimate.org/node/4683 193 West Virginia’s standard includes “alternative energy resources”, e.g., natural gas, coal liquefaction and gasification. The standard does not require a minimum contribution from renewable energy so could be met by alternative energy resources only. See http:/ /www.dsireusa.org/incentives/ 194 See Phase I Report, Wind, p. 9. 195 NREL, pp. 8–9.

79
of the solar investment tax credit. This allows investors to take advantage of the incentive, despite a lack of tax liability196. States in the ARC region, with the exception of Alabama and Mississippi, have applicable tax incentives for renewable energy installation. Most programs come in the form of rebates or assessment revisions that can apply to personal, corporate, sales, or property tax liability. Table 20 details the statewide tax incentives that apply to wind and solar energy installation. Note that incentives can also come from local taxing authorities (e.g., municipalities, counties, etc.).
Several states offer varying levels of property tax incentives for wind and solar energy. One noted example is Maryland, which offers a 100% state and local property tax exemption for installed solar PV equipment. In another case, New York offers a 15-year exemption for any increase in assessed value resulting from the installation of a renewable energy system (applicable to both wind and solar)198. In other cases, the assessed value of a system is forgone in favor of the value of a similar conventional energy installation. Kentucky has a sales tax exemption for large-scale projects, which includes a wage assessment of up to 4% for employees in companies with facilities that utilize renewables199. Grants and Loans. The major goal of renewable energy grant and loan programs is to provide subsidized funding to companies, private consumers, and local institutions to help allay the upfront costs of installing a wind or solar system. Many state governments, non-profit organizations, and utility companies offer such incentives across the Appalachian region. Table
196 Hering, G.,”Obama signs solar stimulus, PHOTON International, March 2009, pp. 26-28. 197 Adapted from data available at: http://www.dsireusa.org/summarytables/financial.cfm?&CurrentPageID=7&EE=1&RE=1 198 http://www.orps.state.ny.us/assessor/manuals/vol4/part1/section4.01/sec487.htm 199 More information at: http://www.dsireusa.org/library/includes/incentive2.cfm?Incentive_Code=KY26F&state=KY&CurrentPageID=1&RE=1&EE=0
Table 20. Tax Incentives that Apply to Solar (S) and/or Wind (W) Installation, by State197
ARC State Personal Tax Corporate Tax Sales Tax Property Tax Alabama - - - - Georgia W/S W/S - - Kentucky W/S W/S W/S - Maryland W/S W/S S W/S Mississippi - - - - New York S S S W/S North Carolina W/S W/S - S Ohio - W/S W/S W/S Pennsylvania - - - W South Carolina S S - - Tennessee - - - W Virginia - - - S West Virginia - W - W

80
21 details these programs in the region (note that this table refers to grant and loan programs offered by state governments only). In the case of loans, many are offered as little or no interest alternatives to conventional bank lending. Loan programs are considered advantageous because they have the potential to become self-sustaining through revolving funds200. Loan guarantees usually reimburse lenders from 75-100% of the loan in case of default by the borrower. Therefore lenders will extend loans to more commercial or residential users. In contrast, grants––a form of “buy down”––are usually contingent upon legislative appropriations. Grant programs can, however, help offset a wide variety of costs associated with installation and maintenance of renewable and/or energy-efficient systems without the added burden of payback. One such example of an established grant program is one administered by Pennsylvania’s Energy Development Authority (PEDA) that is annually dependent on state appropriations. During its 2008 call for applications, the program was funded at $11 million for projects, “involving the expansion or purchase of alternative energy manufacturing, production or research facilities.”203 Although PEDA does not contribute the entire cost of a project, consideration is given to redeveloped sites and projects with an aim of environmental stewardship. 200 One major example is Iowa’s Alternative Energy Revolving Loan Program (AERLP) 201 Adapted from data available at: http://www.dsireusa.org/summarytables/financial.cfm?&CurrentPageID=7&EE=1&RE=1 202 A statewide grant program for Maryland is currently pending approval. 203 PEDA, 2008 Financial Assistance Guidelines, http://www.depweb.state.pa.us/enintech/cwp/view.asp?a=1415&Q=504241&enintechNav=|37114|
Table 21. ARC State Grant and Loan Programs Applicable to Solar (S) and/or Wind (W)201
ARC State Grants Loans Alabama - W/S Georgia - S Kentucky - - Maryland Pending202 W/S Mississippi - S New York W/S W/S North Carolina W/S W/S Ohio W/S - Pennsylvania W/S W/S South Carolina - W/S Tennessee W/S W/S Virginia - - West Virginia - -

81
In an alternative example, Alabama operates the Local Government Energy Loan Program (LGELP), which offers funding to local governments and school systems throughout the state to help retrofit buildings and energy efficiency projects. In addition to the benefits gained from lower utility bills, funding up to $350,000 for governments and $500,000 for school systems is available at a 0% interest rate for a term of up to ten years. In most cases these programs do not provide direct incentives to producers of renewable energy equipment; however, they have the potential to spur demand and thus increase manufacturing activity as well as the need for installers204 205. Rebate Programs. Rebate programs are another incentive to help defray the costs of renewable energy systems. In contrast to loans and grants, these payments are typically issued subsequent to the installation of the system206. In the Appalachian region, these programs are generally administered by utility companies and apply to owners of grid-connected renewable energy systems. Many investor-owned utilities and electric cooperatives alike offer rebates to commercial and residential consumers to encourage the use of renewables and, in some cases, help them meet alternative energy targets set forth in legislation. Fixed rebate programs are often coupled with net metering and other progressive incentives to form a more cohesive package. Georgia utilizes rebates in a unique way. Rather than basing rebates on a “progressive” system, the state offers a flat payment of $450 per kW of installed DC in the form of solar PV equipment. This program is administered by Jackson Electric Membership Corporation (an electric cooperative) and all systems must be grid-connected to qualify for the Right Choice Solar Rebate Program for Homes207. Model Ordinances. Since the widespread inception of wind and solar energy systems, many local communities on the cutting edge have encountered problems relating to the installation and procedural standardization of renewable energy systems. Specifically with wind turbines, many municipalities lack regulations pertaining to permits, site selection, construction, and device monitoring. Recently, two Appalachian states––Pennsylvania and North Carolina––have, with the cooperation of regional institutions and working groups, adopted model ordinances for use by their municipalities. New York, in conjunction with NYSERDA, has also published model ordinance guidelines208. Local governments are encouraged to draw from these documents and create customized versions for their individual communities. The documents offer important insight into the process of installing turbines in a community. Additionally, the eventual adoption of an
204 Despite this, there are drawbacks to the use of both loans and grants as stand-alone tools. As a National Renewable Energy Lab evaluation suggests, these incentive programs must be included in a comprehensive portfolio that ensures installation capacity, institutional and private sector cooperation, and education about potential benefits. 205 NREL, 2002, pp. 17–.32. 206 NREL, 2002, p. 11 207 http://www.jacksonemc.com/sunpower 208 NYSERDA guidelines available online, see: http://www.powernaturally.org/Programs/Wind/toolkit/2_windenergymodel.pdf

82
ordinance by a community can streamline the development process by creating established channels of approval for installers and developers209. Supply-Side Incentives Industry Recruitment and Support Programs. Of particular interest for supply chain development in the Appalachian region are programs that help attract manufacturing firms to locate within the regional borders. Three ARC states––New York, Pennsylvania, and Virginia––have designated funding available for this task, while many other states use non-targeted economic development resources to attract firms. These programs can be a major influence for both upstart domestic and established foreign industry players in selecting a site for their business. The three states that offer targeted programs have been successful in attracting wind and solar manufacturing firms within their borders. The Pennsylvania Department of Community and Economic Development (DCED) and the Department of Environmental Protection (DEP) jointly administer a $25 million grant and loan program that includes a provision for wind energy technology. Applicable funding is granted to qualifying entities to help offset the costs associated with manufacturing wind turbines or other system components. Eligible costs include land and building acquisition, land clearing, new facility construction, equipment purchases, feasibility studies, permitting, and/or administrative fees. Maximum loans ($35,000/job created) and grants ($5,000/job created) are based on the number of jobs created within three years of approval. Additional conditions apply for various facilities, proposals, and loan guarantees210. This program does not apply to solar energy facilities. The New York State Energy Research and Development Authority (NYSERDA) maintains a budget of $10 million for the expansion of “manufacturing of renewable, clean, and energy-efficient products in New York.” Companies wishing to develop or expand a facility to manufacture products with a focus on renewable energy and/or energy-efficient technologies may be eligible for funding. This program aids in the planning, site development, and construction phases of a project, with compartmentalized funding available in subsequent corresponding units211. It is unclear whether this program has been utilized since its inception, but it has the potential to aid in regional manufacturing development in both target sectors. Virginia’s program focuses on solar photovoltaic systems and provides up to $4.5 million per year to stimulate PV manufacturing within the commonwealth. The Solar Manufacturing Incentive Grant pays up to $0.75 per watt of panel capacity, with a maximum of 6 MW in one calendar year. Incentive payments are tiered and decrease over time212. 209 Model ordinances for other ARC states can be found at the following links: Pennsylvania: www.depweb.state.pa.us/energy/cwp/view.asp?a=1370&Q=485761, North Carolina: www.ncsc.ncsu.edu/Documentation/Files/NC%20Model%20Wind%20Ordinance_June%202008_FINAL.pdf 210 http://www.newpa.com/find-and-apply-for-funding/funding-and-program-finder/funding-detail/index.aspx?progId=191 211 From NYSERDA Program Opportunity Notice No. 1176; available online: http://www.nyserda.org/funding/1176summary.pdf 212 http://www.dsireusa.org/incentives/incentive.cfm?Incentive_Code=VA08F&re=1&ee=0

83
Novel Policy Strategies While states in the Appalachian region have taken initiatives to promote renewable sources of energy, many states outside the region, non-profit organizations, and foreign countries have created policies that allow renewable energy to thrive within their borders. These locales/strategies can serve as a model for ARC states looking to touch up their policy landscapes to reflect a changing marketplace and to manage a potential infusion of capital from federal stimulus programs. It is important for regional policy makers and officials to continuously look to leading-edge renewable energy policy around the world to ensure that all options are being explored in the United States. The trial-and-error period has concluded for these technologies and the region runs the intense risk of falling into deeper economic decline without a sustainable energy supply brought about through smart policy. Non-Regional Examples. Several states that fall outside ARC borders have promoted the growth of both wind and solar energy systems and the respective manufacturing entities. While these states are not within the scope of the firm research conducted for this report, the policies endorsed by them have proved to be wholly effective and can help ARC states and communities explore policy options. As Phase I research indicates, both California and New Jersey accounted for 69% of grid-tied solar PV installations in the United States in 2008. With such geographic concentrations of development, it is important to examine the policy environments in these locations to glean insight into their success. California’s reason for widespread success in renewable energy may be associated with the sheer size and population of the state, rising costs of energy for consumers, and rolling blackouts throughout the past decade. However, these factors have helped launch the state into the status as one of the most fertile areas for the installation of wind and solar equipment. It has built one of the most comprehensive public energy policy portfolios in the nation––a major requirement in encouraging installation. One of the most unique strategies is a statewide feed-in tariff, designed to help utilities meet ambitious RPS goals. The tariff allows eligible owners of small, grid-connected systems to enter into long-term agreements with a utility in exchange for an increased cost paid per unit of energy generated. Solar energy is emphasized as a premium is paid for energy generated by solar equipment during peak hours213. In addition to the various incentive programs for solar energy put in place by California’s various major population centers and utility companies, the state sponsors a rebate program known as the California Solar Initiative. The program, which is funded at $3.2 billion over 10 years, offers producers at every level the opportunity to receive buy-downs based on the expected performance of the equipment installed, or monthly payments based on the amount of energy produced for five years. These programs are just two examples of California’s commitment to solar energy and its effectiveness in stimulating the marketplace214. New Jersey has also been a leader in solar installations in the United States. In part, this is due to its Solar Renewable Energy Certificate (SREC) program, which is regulated by the state Board
213 http://dsireusa.org/library/includes/incentive2.cfm?Incentive_Code=CA167F&state=CA&CurrentPageID= 1&RE=1&EE=1 214 Gainesville, Florida recently introduced a feed-in tariff that is more generous that California’s. It guarantees to pay .32/kWH for solar energy for twenty years. See “A first feed-in tariff hits America”, Photon International, March 2009, pp 3-34.

84
of Public Utilities (BPU) and administered by Clean Power Markets, Inc. The SREC program allows utilities to buy and sell one Megawatt “bundles” of energy generated through solar PV equipment. These credits allow companies that may not have the solar-generating capacity necessary to meet the requirements set forth in the state RPS, to purchase the SREC from another utility that may have exceeded capacity. In addition, investors looking to support renewable energy can participate in the program. This market, which essentially trades solar energy as a commodity, is the first of its kind in the nation215. In addition, New Jersey offers a comprehensive tax rebate strategy, net metering standards, and other incentives. In the case of wind energy, both Iowa and Texas have served as different but equally critical examples of policy success in terms of attracting renewable energy development. In addition to having some of the most lucrative geography in terms of wind resource potential, Iowa has taken the lead in attracting turbine manufacturers in an effort to become, as Governor Chester J. Culver says, the “Silicon Valley of the Midwest.” Under the governor’s leadership, the state has attracted at least six firms that produce wind turbines or component parts to the state. Through the Iowa Department of Economic Development, incentive programs in the form of loans, infrastructure assistance, and job creation credits have helped bring more than 1,500 green jobs to Iowa216. While its location in the center of a wind-rich region has certainly been an attractive lure for relocating and expanding firms, Iowa’s commitment to industrial development through incentives cannot be ignored. According to the American Wind Energy Association, Texas has the largest amount of installed wind capacity in the United States, with 7,118 MW after adding 2,761 MW in 2008217. In order to attract manufacturing facilities, Texas offers a complete exemption of state franchise tax––a significant incentive for both solar and wind producers. A property tax exemption, a corporate tax deduction, and a revolving loan program also offer potential consumers the enticement to install wind systems in the state218. In addition to the direct support offered by the state, the Office of Rural Community Affairs assists agricultural communities in identifying their resources and allocates Block Grant funding to help eligible communities install renewable energy systems219. This type of proactive collaboration is certainly a potential option for many rural communities in Appalachia. Additionally, Texas has received a great deal of philanthropic support for its renewable energy development. Quasi-Public and Non-Profit Incentives. While statewide government incentives are often the most widely available and publicized, non-profit organizations and private investing enterprises serve to fill gaps in funding programs. Such programs exist across the country and take varying forms––from community assistance to academic support to financial awards.
215 http://www.njcleanenergy.com/renewable-energy/programs/solar-renewable-energy-certificates-srec/new-jersey-solar-renewable-energy 216 Patullo, M. H. (2008). “The Silicon Valley of the Midwest: A Case Study of Wind Energy in Iowa” Report for the Massachusetts Technology Collaborative. 217 Lammers, D., “Texas is still wind king, but Iowa breezes past California”, USA Today, April 13, 2009. See also American Wind Energy Association Annual Wind Industry Report, Year Ending 2008, April, 2009 218 http://dsireusa.org/library/includes/map2.cfm?CurrentPageID=1&State=TX&RE=1&EE=1 219 http://www.orca.state.tx.us/index.php/Community+Development/Renewable+Energy

85
The Massachusetts Technology Collaborative (MTC)––a quasi-public organization that develops partnerships between the public and private sectors––administers the Business Expansion Initiative (BEI). The BEI offers loans to Massachusetts-based companies for capital expenses associated with the design and manufacturing of renewable energy products. The program requires an increase in the eligible firm’s workforce by at least 10% and applies to both wind and solar technologies, among others. This program is designed as a stopgap for companies unable to secure private funding sources and an incentive for those who consider relocating based on lower operating costs220. This type of program has potential in Appalachian states as many companies are looking to expand their facilities and transition into the renewable energy market, but lack the capital and knowledge to do so. Utah Clean Energy is a not-for-profit organization aimed at promoting environmental stewardship through the reduction of carbon-based emissions. Working with rural landowners and farmers, the group helps to secure funding and educate individuals on the benefits of installing renewable energy systems on their land. The organization has also developed institutional partnerships with state universities and has secured funding from the U.S. Department of Energy and NREL to help in educating and working with local stakeholders221. Feed-In Tariffs. In addition, some foreign countries have increased their wind and solar installation and manufacturing activity through novel policy strategies. Feed-in tariffs, the preferred incentives for renewable energy in Europe, have made forays into the U.S. portfolio and have the potential to be used in the near future. More information on feed-in tariff programs is included in the Phase I section of this report222. Major Findings and Observations Potential vs. Actual Industry Participation
Our study suggests that the number of firms currently involved in the solar and wind industries may be less than the number estimated in many projections, such as the REPP model223. These estimates assume a national policy for a given renewable energy goal (e.g., 20% wind energy by 2030), from which potential job creation in various states is determined. We found that many well-known databases included firms that were reported to be involved in the solar or wind industry, while our research indicated they currently are not. When firms were involved in these industries, many did not manufacture or provide services in the Appalachian region, despite listings that indicated that they did. The gap is especially evident in Pennsylvania, which has the largest number of firms identified and thus the highest potential employment in the region. In Centre County alone, we identified 18 firms as possible participants, but only two firms proved to be involved. Similar gaps were found in counties within the state and across the Appalachian region. The low number of firms in our study is not surprising, therefore, given the emergent
220 http://www.masstech.org/renewableenergy/BEI/index.html 221 http://utahcleanenergy.org/our_work/utah_wind_power_campaign 222 Phase I Report, Part 1, p. 8, Part 2, p. 28. 223 The gap is even more dramatic when we removed the distributors and installers from the potential and actual involvement samples so that, like the REPP studies, only manufacturers were considered. Two hundred sixty seven (267) manufacturers were potentially involved and only 21 were actually involved or 7.87% of the larger sample.

86
nature of these industries and the lack of a consistent national policy to support renewable energy production.
Additionally, many well-known databases varied in the NAICS codes they assigned to the same company, especially for large firms that had a presence in different industries and manufactured as well as distributed their own products. Some plants of firms that were listed as producing components for the solar or wind industries did not do so. Sales and engineering were performed at these plants, but not manufacturing. Also, firms in these emerging industries are dynamic; many of those that we attempted to contact were out of business when we tried to contact them.
Finally, as the following section makes clear, the processes used to make solar and wind components are often used to make components for other industries. Thus, until there is a classification update that clearly identifies solar and wind industries as separate classes, misidentification will continue to plague this type of research. Overall, further research is required to determine the differential between potential and actual participation in the Appalachian region and the impact of such projections on capital infusion and long-term job creation forecasts. Types of Firms Involved in the Industries The companies identified as industry participants generally fall into two major groups based on their type of firm and year of entry into the solar or wind industry. The first group consists of established manufacturing firms that already possess the capability to produce products for these industries and have transitioned to do so. They generally come from traditional industries (e.g., plastic extrusion, foundries, fabrication) and use their existing advantages to serve the solar and wind industry. By contrast, the second group consists of emergent service firms explicitly created to serve the renewable energy sector. These firms are mainly installers and distributors. The barriers to market entry are lower for them than for their manufacturing counterparts. For example, installers and distributors need relatively low capital, and in-house training often suffices to prepare their workers for entry into the solar or wind industry. Table 22 shows profiles of selected firms from the established and emergent groups. Not every firm in the sample fits exactly into one of the two profiles, but most of them do. Firms that manufacture flat glass, plastics, and electric switchgear equipment make up most of the established firms. These firms originally provided products to other industries, but decided to adapt their firms to the solar and/or wind industry for various reasons. Workers are trained in specific skills, e.g., welding, blueprint reading, electrical and mechanical knowledge, that generally are transferable to production of solar and wind products. Emergent firms require less significant investment in workforce and infrastructure to begin producing products and services. These firms tend to sell only in the domestic market, in contrast to established manufacturing firms that often sell in foreign markets.

87
The established firms were not originally created to produce or provide solar or wind products. The processes used to make solar and wind components are often readily transferable for use in making other types of components. We found that many existing plants hired few if any new workers to make and sell solar and wind components. These firms shifted workers between the manufacture of these components and traditional components with a moderate amount of training. Additionally, solar or wind components frequently made up only 1-5% of these firms’ total sales. In general, the wind industry is more challenging for established manufacturers to enter than is the solar industry because of the sheer size of some wind components. In fact, two firms in the original “potential” database indicated their desire to be involved in wind production, but were kept out because they lacked size-related capabilities. In addition, the extremely tight tolerances required in turbine manufacturing make the need for a trainable and competent workforce even more important.
Table 22. Profile of Typical Established and Emergent Firms * % of total company sales that are in the renewable energy sector ESTABLISHED Founding
Date Product/Service %* Sales Training Requirements Foreign
Sales 1905 Brakes, clutches 1%
Specific skill training, e.g., welding, blueprint readings,
electrical and mechanical knowledge
Yes
1927 Flat glass for solar panels 1%
1929 Pultrusion of fiberglass 1%
1954 Vacuum products for solar panels 1%
1983 Plastics used in PV equipment 1%
EMERGENT Founding
Date Product/Service %*
Sales Training Requirements Foreign Sales
1988 Solar electric system installer 100%
On-the-job training, general ability, good math and verbal skills
No
2003 Solar heating contractor 100%
2005 Wind towers 100%
2006 Wind tower safety and service equipment 100%
2007 Solar heating contractor 80%

88
Prospects for Development of the Domestic Wind and Solar Industry In Phase I, we presented a strategic analysis of the supply chain structures of the wind and solar energy industries. This analysis identified the competitive context for firms in these industries and discussed the challenges facing domestic firms as new competitors arise. European companies have dominated the industry in part because of national policies designed to encourage the development of the renewable energy industry. Chinese competitors are on the rise and, like the Europeans, develop scale capacity in response to national policies that encourage and incentivize industrial development. The growth trajectory of these industries suggests progressive consolidation in response to the efficiency gains realized through economies of scale and new product technologies. Globally, the renewable energy industry has developed in response to markets, and markets have been created in other countries through consistent and aggressive policies described elsewhere in this report. The highly decentralized policy environment that is characteristic of the U.S. has impeded growth of the industry. States have myriad policies that are varied and subject to change. Appalachia, more than other regions of the nation, is unlikely to emerge as a leader in the global renewable energy industry due to insufficient incentives and the general lack of a supportive policy framework that would encourage industry development. However, the presence of so many firms that could contribute to the wind and solar industry supply chain in Appalachia means that there is a great deal of potential for development of the industry, given the right mix of policies and incentives. The growth challenges facing manufacturers of wind and solar components vary considerably. Manufacturers of glass, plastics, and/or steel, won’t be challenged dramatically to adapt their manufacturing processes and workforce skills to produce solar and wind-related products, assuming they choose to target these industries for sales growth. The challenge will steepen for selling in international markets. Unless the U.S. can attract foreign and domestic cell and module manufacturers to locate in the U.S., let alone Appalachia, these component suppliers will have to learn to sell more of their products in international markets. The evidence suggests that few cell and module manufacturers are locating or will remain in the U.S. over the next decade. Economic development policies will need to be designed with this prospect in mind224. Manufacturers of wind turbine nacelles, blades, and towers have an advantage over their foreign counterparts because these components are large and expensive to transport. Manufacturers of these components won’t be greatly challenged to adapt their existing processes and workforce skills to produce them. However, the manufacturers of gearboxes, bearings, and generators will face significant challenges because tolerances for these components are very tight. Their European counterparts have made these components for decades and use proprietary processes that they protect carefully. Blade and tower manufacturers should be very supportive of policies that encourage domestic or foreign turbine manufacturers or wind farm developers to locate in the U.S, whether in Appalachia or elsewhere. This is their emerging customer base.
224 See footnote 60 regarding BP Solar’s plans to transfer module manufacturing from Frederick, MD to India and China.

89
The Need for Multiple and Mutually Reinforcing Policies Although nationwide policies that would promote wind and solar industry development have been proposed, nothing has developed thus far. States that do have rapid growth in solar or wind installations and/or manufacturing have introduced a set of mutually reinforcing policies that lower the initial capital outlay for solar or wind installations (e.g., feed-in tariffs, rebates, low interest loans, sales or property tax abatement), have a renewable portfolio standard (usually with a solar or wind set-aside), and/or have energy costs above the national average, thus shortening the payback period for these investments. In contrast, six of the fifteen states without an RPS are in the southeast (South Carolina, Tennessee, Kentucky, Alabama, Georgia, and Mississippi). These states are also below the national average retail price for electricity and have fewer policies to encourage solar and wind development. Kentucky and Tennessee have rates that are about 40% below the national average225. These observations suggest that states need an aggressive and mutually reinforcing set of policies to promote investment in alternative energy. Evidence suggests that investments to promote wind installations in a region stimulate nearby collateral manufacturing more than investments in solar installations, mainly because wind components are large and require expensive transportation. The absence of these factors in solar component manufacturing makes them more vulnerable to outsourcing. Installers and distributors of solar and small wind systems face only modest challenges in the near term. Entry into this business is relatively easy due to low capital requirements. Distributors can sell their products both domestically and internationally. Installation cannot be outsourced and tends to be a highly local business. However, sales are tied to state-based renewable portfolio standards and other incentives, and training is critical since many states with incentive programs require that installers be certified. Northeastern and mid-Atlantic states have much higher energy costs than do the Southern states, and typically have shorter payback periods for investment in solar or wind systems. In some states, wind energy is already at grid parity with conventional energy sources. In other states with lower energy costs, aggressive incentives and policies are critical to attracting and retaining manufacturers of wind and solar components. Policies that have proven to be most effective include:
• Tax Incentives. Every state in the ARC region, with the exception of Alabama and Mississippi, has applicable tax incentives for renewable energy installation (see Table 20). Most programs involve rebates or assessment revisions that can apply to personal, corporate, sales, or property tax liability.
225 Energy Information Administration. “Average Retail Price of Electricity to Ultimate Customers by End-Use Sector, by State”, Electric Power Monthly, May 2009

90
• Feed-in Tariffs with favorable treatment for local manufacturer. Offers above-market rates to businesses and households that supply renewable energy to the grid, and is widely credited to be the major factor supporting wind and solar industry development in Europe (and promises to play a similar role in the U.S. in California, Michigan, Minnesota, Indiana, and Washington).
• Grant and Loan Programs. The major goal of renewable energy grant and loan programs is to provide subsidized funding to companies, private consumers, and local institutions to help allay the upfront costs of installing a wind or solar energy system (see Table 21).
• Rebate Programs. Rebate programs are another incentive to help defray the costs of renewable energy systems. In contrast to loans and grants, these payments are typically issued subsequent to the installation of the solar or wind system. In the Appalachian region, these programs are generally administered by utility companies and apply to owners of grid-connected renewable energy systems.
• Model Ordinances. Many municipalities lack regulations pertaining to permits, site selection, construction, and device monitoring. Recently, two Appalachian states –– Pennsylvania and North Carolina––have, with the cooperation of regional institutions and working groups, adopted model ordinances for use by their municipalities. New York, in conjunction with NYSERDA, has also published model ordinance guidelines
• Industry Recruitment and Support Programs. As regards supply-side incentives, there are programs in the Appalachian region that encourage manufacturing firms to locate within its regional borders. These programs can be major influencing factors for both upstart domestic and established foreign industry players in selecting a site for their business, as evidenced by the fact that New York and Pennsylvania have encouraged wind and solar energy manufacturing firms to locate within their borders.

Industry Structure and Company Strategies of Major Domestic and Foreign Wind and Solar Energy Manufacturers: Opportunities for Supply Chain Development in Appalachia
91
Bibliography Algoso, & Rusch. (2004). Renewables work: Job growth from renewable energy development in the mid Atlantic. NJPIRG: Law and Policy Center. Alliance to Save Energy. (2009, February 25). Comparison of American Recovery and Reinvestment Act. Retrieved from ase.org: http://ase.org/content/article/detail/5347 American Wind Energy Association. (2008a). 2007 Market Report. American Wind Energy Association. (2008c). 3rd Quarter 2008 Market Report. American Wind Energy Association. (2009). Annual Wind Industry Report Year Ending 2008. American Wind Energy Association. (2008d, October 7). AWEA Wind Power Finance and Investment Workshop. Panel Discussion on Turbine Supply Issues. New York. American Wind Energy Association. (2000). Fair transmission access for wind: A brief discussion of priority issues. American Wind Energy Association. (2009). Industry Rankings Factsheet 2008. American Wind Energy Association. (2009). Small Wind Turbine Global Market Study, Year Ending 2008. Anonymous. (2007, January/February). Supply chain: The race to meet demand. Wind Directions , pp. 27-34. Appalachian Regional Commission. (n.d.). Retrieved from http://www.arc.gov/index.do?nodeID=27 Ayres, R. U., (Ed.) & Weaver, P. (Asst. Ed.) (1998). Eco-restructuring: Implications for sustainable development. New York: The United Nations University. Bradford, T., Grama, S., Wesoff, E., & Bhargava, A. (2007, August). The future of thin film solar. Greentech Media and Prometheus Institute , 1 (1). Bradsher, K., (2009a, July 13). China Builds High Wall to Guard Energy Industry. New York Times. Bradsher, K., (2009b, August 14). China Racing Ahead of U.S. in the Drive to Go Solar. New York Times. British Wind Energy Association. (2000). Noise from wind turbines: The facts. BTM Consult. (2008). International Wind Energy Development, World Market Update 2007, Forecast 2008-2012. BTM Consult. (2005). Ten year review of the international wind power industry, 1995-2004. BTM Consult. (2009). World Market Update 2008. Central Pennsylvania Workforce Development Corporation. (2007, September). Alternative energy report: Central Pennsylvania workforce investment area (Research Report). Lewisburg, PA: Central Pennsylvania Workforce Investment Board. Cheyney, T. (2009, April 1). Headline blues: BP Solar puts ‘cost reduction’ spin on job cuts as ‘third-party’ deal looms. Retreived from http://www.PV-Tech.Org.

Industry Structure and Company Strategies of Major Domestic and Foreign Wind and Solar Energy Manufacturers: Opportunities for Supply Chain Development in Appalachia
92
Commonwealth of Pennsylvania. (2007, August 30). Governor Rendell says largest solar power facility in eastern U.S. will be built in Bucks County. Retrieved from http://www.state.pa.us Commonwealth of Pennsylvania. Department of Environmental Protection (n.d.). Pennsylvania Energy Development Authority (PEDA). Retrieved from www.depweb.state.pa.us: http://www.depweb.state.pa.us/enintech/cwp/view.asp?a=1415&Q=504241&enintechNav=|37114| Commonwealth of Pennsylvania. Department of Environmental Protection, Office of Energy & Technology Deployment. (n.d.). Wind Energy: A Cost-Effective, Fuel-Free Resource, Model Wind Ordinance for Local Governments. Retrieved from http://www.depweb.state.pa.us/energy/cwp/view.asp?a=1370&Q=485761. Daniels, K. (2005, October). Wind energy model ordinance options. Albany, NY: NYS Energy Research and Development Authority. Retrieved from Datatbase of State Incentives for Renewables & Efficiency (DSIRE): http://www.powernaturally.org/Programs/Wind/toolkit/2_windenergymodel.pdf Database of State Incentives for Renewables & Efficiency (DSIRE). (n.d.). http://dsireusa.org/library/includes/incentive2.cfm?Incentive_Code=CA167F&state=CA&CurrentPageID=1&RE=1&EE=1 Database of State Incentives for Renewables & Efficiency (DSIRE). (n.d.). http://www.dsireusa.org/summarytables/financial.cfm?&CurrentPageID=7&EE=1&RE=1 Database of State Incentives for Renewables & Efficiency (DSIRE). (n.d.). http://www.dsireusa.org/library/includes/incentive2.cfm?Incentive_Code=KY26F&state=KY&CurrentPageID=1&RE=1&EE=0 Database of State Incentives for Renewables & Efficiency (DSIRE). (n.d.). http://www.dsireusa.org/incentives/incentive.cfm?Incentive_Code=VA08F&re=1&ee=0 Database of State Incentives for Renewables & Efficiency (DSIRE). (n.d) http://dsireusa.org/library/includes/map2.cfm?CurrentPageID=1&State=TX&RE=1&EE=1 Database of State Incentives for Renewables & Efficiency (DSIRE). (n.d.). Retrieved August 25, 2008, from http://www.dsireusa.org Database of State Incentives for Renewables & Efficiency (DSIRE). (n.d.). Retrieved July 24, 2009, from http://www.dsireusa.org deVries, E. (2008). The challenge of growth: Supply chain and wind turbine upscaling challenges. Renewable Energy World Magazine, 11 (3). Energy Source Guides (n.d.) www.energy.sourceguides.com Energy Information Agency. (2008). Average retail price of electricity to ultimate customers by end-use sector, by state. Electric Power Monthly, Table 5.6.A. Energy Information Administration. Average Retail Price of Electricity to Ultimate Customers by End-Use Sector, by State. Retrieved September 16, 2009, from http://www.eia.doe.gov/cneaf/electricity/epm/table5_6_a.html. Energy Information Administation. (n.d.). Annual photovoltaic module/cell manufacturers survey, Form EIA-63B. European Wind Energy Association. (2009). Sea of Change: Offshore Wind Energy Report. European Wind Energy Technology Platform. (2008). Strategic Research Agenda Market Deployment Strategy, From 2008 to 2030. SYNOPSIS.

Industry Structure and Company Strategies of Major Domestic and Foreign Wind and Solar Energy Manufacturers: Opportunities for Supply Chain Development in Appalachia
93
Farrell, J. (2008). Minnesota feed-in tariff could lower cost, boost renewables and expand local ownership. New Rules Project. Galbraith, K. (2009, February 3). Dark Days for Green Energy. The New York Times, p. B1. Retrieved from http://www.nytimes.com/2009/02/04/business/04windsolar.html?_r=2&ref=business Glasmeier, A. K., Feingold, R., Guers, A., Hay, G., Lawler, T., Meyer, A., et al. (2007, September). Energizing Appalachia: Global challenges and the prospect of a renewable future (Research Report). Washington, D.C.: Appalachian Regional Commission. Retrieved from http://www.arc.gov/images/reports/2008/energy/ARC_EnerApp_Final_full. Global Wind Energy Council. (2009). Global Wind Report 2008. Hering, G. (2009, March). Obama signs solar stimulus. PHOTON International, pp. 26-28. Hering, G. (2008, April). Whispers of a new direction: First national feed-in legislation introduced in US Congress. PHOTON International, pp. 44-46. Industry Canada. (2004). Supply-Chain Capabilities in the Canadian Wind Power Industry. Jackson Electric Membership Corporation. (n.d.) Solar rebate program for homes. Retrieved from www.jacksonemc.com/sunpower Junfeng, L., Hu, G., Pengfei, S., Jingli, S., Lingjuan, M., Haiyan, Q., et al. (2007). China wind power report -- 2007. Beijing: China Environmental Science Press. Kammen, D., Kapadia, K., & Fripp, M. (2004). Putting Renewables to Work: How many jobs can the clean energy industry generate? Renewable and Appropriate Energy Laboratory report, University of California, Berkeley. Retrieved from http://rael.berkeley.edu/old-site/renewables.jobs.2006.pdf Kho, J. (2007, November). Ausra to build 177-megawatt solar-thermal plant. Greentech Media. Knee, R. (2007). West Coast ports made of steel and wind: Pacific Coast ports find growth in non-container business. Pacific Shipper. Lammers, D. (2009, April 13). Texas is still wind king, but Iowa breezes past California. USA Today. LaPedas, M. (2009, March 24). U.S. lags in top 10 solar markets. EE Times. Lewis, J. I. (2007). A comparison of wind power industry development strategies in Spain, India and China. Studies in Comparative International Development, 43 (3-4), pp. 208-232. Li, Y. (2009, June 20). Solar Power Experiences Strongest Year of Growth Yet. Worldwatch Institute. Loi, L. L., & Chan, T. F. (2007). Distributed Generation: Induction and Permanent Magnet Generators. New York: John Wiley and Sons. Markusen, A. R., Hall, P. & Glassmeier, A. (1986). High-Tech America: The What, How, Where and Why of the Sunrise Industries. London: Allen and Unwin. Massachusetts Technology Collaborative (n.d.). Business expansion initiative. Retrieved from http://www.masstech.org/renewableenergy/BEI/index.html Maycock, P., & Bradford, T. (2007). PV Technology,Pperformance and Cost-2007 Update. PV Energy Systems and Prometheus Institute.

Industry Structure and Company Strategies of Major Domestic and Foreign Wind and Solar Energy Manufacturers: Opportunities for Supply Chain Development in Appalachia
94
Merrill Lynch. (2007). Wind turbine manufacturers; Here comes pricing power. Metaefficient: The Optimal Green Guide. (2007, December 28). North America's largest solar-electric plant switched on. Retreived from http://www.metaefficient.com. Milborrow, D. (2003). Offshore wind rises to the challenge. Wind Power Monthly. Milner, A. (2006, April). International Advanced Photovoltaic Manufacturing Technology Conference. Munich, Germany. Musial, W., Butterfield, S., & McNiff, B. (2007). Improving wind turbine gearbox reliability. Preprint from National Renewable Energy Laboratory. NASA Atmospheric Science Data Center. (2009). NASA surface meteorology and solar energy data set. Retrieved from http://eosweb.larc.nasa.gov/cgi-bin/sse/sse.cgi?+s01#s01 National Renewable Energy Laboratory. (2002), pp. 17-32 National Renewable Energy Laboratory. (2002), p. 11 National Renewable Energy Laboratory. (2008a). Wind Energy Resource Atlas of the United States. Retrieved from http://rredc.nrel.gov/wind/pubs/atlas/ National Renewable Energy Laboratory. (2008b). Wind Deployment Systems (WinDS) Model. Retrieved from http://www.nrel.gov/analysis/winds/intermittency.html New Jersey Office of Clean Energy. (n.d.). New Jersey solar renewable energy certificate program. Retrieved from http://www.njccleanenergy.com/renewable-energy/programs/solar-renewable-energy-certificates-srec/new-jersey-solar-renewable-energy New York State Energy Research and Development Authority. (n.d.). Renewable, clean energy, and energy efficiency product manufacturing incentive program (PON No. 1176). Retrieved from http://www.nyserda.org/funding/1176summary.pdf New York State. Office of Real Property Services. (n.d.). Exemption administration manual – Part 1 (RPTL Section 487). Retrieved from http://www.orps.state.ny.us/assessor/manuals/vol14/part1/section4.01/sec487.htm North Carolina State University, North Carolina Wind Working Group. (2008, July). Model Wind Ordinance for Wind Energy Facilities in North Carolina. Retrieved from http://www.ncsc.ncsu.edu/Documentation/Files/NC%20Model%20Wind%20Ordinance_June%202008_FINAL.pdf Office of Management and Budget. Executive Office of the President. (2009, January 7). 2007 North American Industry Classification System (NAICS) -- Updates for 2012. Federal Register, 74 (4), pp. 764-768. Open Energy Technology Bulletin. (2004, June). International Energy Agency, Special Issue IEA Photovoltaic Power Systems Programme, No 19-23. Patullo, M. H. (2008, October). The silicon valley of the Midwest: A case study of wind energy in Iowa. Boston, MA: Report for the Massachusetts Technology Collaborative. Pedden, M. (2006, January). Analysis: Economic impacts of wind applications in rural communities. NREL Technical Monitor, Subcontract Report, NREL/SR-500-39099. Retrieved from http://www.nrel.gov/docs/fy06osti/39099.pdf

Industry Structure and Company Strategies of Major Domestic and Foreign Wind and Solar Energy Manufacturers: Opportunities for Supply Chain Development in Appalachia
95
Pennsylvania Department of Community and Economic Development. (n.d.). Renewable energy program – Geothermal and wind projects. Retrieved from http://www.newpa.com/find-and-apply-for-funding/funding-and-program-finder/funding-detail/index.aspx?progId=191 Pew Center on Global Climate Change. (2007, April 11). Virginia RPS. Retrieved from http://www.pewclimate.org/node/4683 PHOTON International. (2006, January). China’s rapid ascent, p. 60. PHOTON International. (2007, June). China’s Rapid Ascent II: Catching Europe, p. 136. PHOTON International. (2009, March). A first feed-in tariff hits America. PHOTON International, pp. 3-34. PHOTON International. (2009, March). From pipe dream to pipeline. PHOTON International, pp. 14-21. PHOTON International. (2009, March). Little smiles on long faces. PHOTON International, p. 170. PHOTON International. (2008c, March). The Q factor, Sharp and the market. PHOTON International, p. 140. PHOTON International. (2008b, February). The United States of solar energy. PHOTON International, p. 42. PHOTON International. (2008, April). A brighter future under the sun, p. 48. Porter, M. E. (1980). Competitive Strategy. New York: The Free Press. PV News. (2007, May). Polysilicon Update -- Careening Ahead... PV News , 26 (5). PV Society. (2009, July 6). Waiting for Better Solar Alignment. Retreived from http://www.PVSociety.com PV TECH. (2007, November 27). Sanyo and Sharp boost solar cell production in 2008. PV TECH. Renewable Energy Policy Project. (2004). Wind Turbine Development: Location of Manufacturing Activity. Renewable Energy World. (2007, July 25). AMSC Receives $70M Order from China’s Sinovel Wind. Retrieved from http://www.renewableenergyworld.com/rea/news/story?id=49428 Renewable Energy World. (2008, April 25). Ohio senate passes RPS legislation. Retrieved from http://www.renewableenergyworld.com/rea/news/article/2008/04/ohio-senate-passes-rps-legislation-52294 RenewableEnergyWorld.com. (2008, September 29). Spain Makes Changes to Solar Tariff. Retrieved from RenewableEnergyWorld.com. Rickerson, W., Bennhold, F., & Bradbury, J. (2008). Feed-in Tariffs and Renewable Energy in the USA -- A Policy Update. Rives, S. (2008). Economic stimulus package allows bonus depreciation for projects completed in 2008. Portland, OR. Retrieved on August 25, 2008 from http://www.renewableenergyworld.com/rea/partner/story?id=51515&src=rss Rogers, A. L., & Manwell, J. F. (2002). Wind turbine noise issues. University of Massachusetts at Amherst, Department of Mechanical and Industrial Engineering. A white paper prepared by the Renewable Energy Research Laboratory, Center for Energy Efficiency and Renewable Energy. Unpublished manuscript.

Industry Structure and Company Strategies of Major Domestic and Foreign Wind and Solar Energy Manufacturers: Opportunities for Supply Chain Development in Appalachia
96
Saint Francis University. (n.d.). Pennsylvania Renewable Energy Directory. Retrieved from Saint Francis University Renewable Energy Center Website: http://www.francis.edu/renewableenergy4pa.htm SCHOTT North America, Inc. (2008, March 3). SCHOTT Solar Breaks Ground on Manufacturing Facility in Albuquerque, New Mexico. Solar Energy Industries Association (SEIA), (2009, March). US Solar Industry Year in Review, 2008. Solarbuzz.com. (n.d.). Retrieved from http://solarbuzz.com/solarindex.expo.htm Solarbuzz.com. (2008). Marketbuzz™ 2008: Annual world solar photovoltaic industry report. Retrieved from http://www.solarbuzz.com/Marketbuzz2008-intro.htm Solarbuzz.com. (n.d.). Solar cell manufacturing plants. Retrieved from http://www.solarbuzz.com/Plants.htm Solarbuzz.com. (n.d.). Solar cell technologies. Retrieved from http://www.solarbuzz.com/Technologies.htm Solarbuzz.com. (n.d.). United States Solar Organizations. Retrieved from http://www.solarbuzz.com/companylistings/unitedstates.htm South Dakota New Web. (2006). Knight & Carver breaks ground in Howard: Governor Rounds welcomes California wind blade manufacturer to South Dakota. South Dakota New Web. Sterzinger, G., & Svrcek, M. (2005). Component Manufacturing: Ohio’s Future in the Renewable Energy Industry. Renewable Energy Policy Project. Sterzinger, G., & Svrcek, M. (2005, January). Solar PV development: Location of economic activity (Technical Report). Renewable Energy Policy Project. Sterzinger, G., & Svrcek, M. (2004, September). Wind turbine development: Location of manufacturing activity (Technical Report). Renewable Energy Policy Project. Sun Edison News Press Release. (2007, December 17). SunEdison activates largest U.S. photovoltaic power plant for Xcel Energy. Tennessee Valley Authority. (n.d.). Green Power Switch Generation Partners. Retrieved from http://www.tva.gov/greenpowerswitch/partners/index.htm Texas Office of Rural Community Affairs. (n.d.). Renewable Energy. Retrieved from http://www.orca.state.tx.us/index.php/Community+Development/Renewable+Energy Think Energy Management. (n.d.). Electricity Costs. Retrieved from http://www.think-energy.net/electricitycosts.htm Think Energy Management. (n.d.). Electricity Costs. Retrieved from http://www.think-energy.net/electricitycosts.htm U.S. Department of Energy. (2008). 20% Wind Energy by 2030: Increasing Wind Energy's Contribution to U.S. Electricity Supply, DOE/GO-102008-2567. Available on-line from http://www.osti.gov/bridge. U.S. Department of Energy. (2007, June). Energy Efficiency and Renewable Energy. States with renewable energy portfolio standards. Retrieved from http://apps1.eere.energy.gov/states/maps/renewable_portfolio_states.cfm#chart U.S. Internal Revenue Code, Title 26, Subtitle A, Chapter 1, Subchapter S, Part I, §1361(b)(1)(A). (n.d.). S corporation defined. Retrieved from www.law.cornell.edu/uscode/26/1361(b)(1)(A).html

Industry Structure and Company Strategies of Major Domestic and Foreign Wind and Solar Energy Manufacturers: Opportunities for Supply Chain Development in Appalachia
97
Utah Clean Energy. (n.d.) Utah wind power campaign. Retrieved from http://utahcleanenergy.org/our_work/utah_wind_power_campaign Werner, T. (2006). Letter to Stockholders, SunPower Annual Report. Wied, M. (2007). Windy prospects: An Approach to Strategic Foresight in the Global Wind Turbine Industry. Unpublished master's thesis, Roskilde University, Denmark, Department of Technology and Socioeconomic Planning. Wikipedia. (2008, June 1). Solar cell. Retrieved from en.wikipedia.org/wiki/Solar-cell Windblatt. (2008). ENERCON's future markets. 3, 6-7. Winegarner, R. M. (2007). A comprehensive report on the use of silicon wafers, silicon ingot, and polysilicon in the semiconductor industry on a fab by fab basis. Healdsburg, CA: Sage Concepts. Wiser, & Bolinger. (2008). Annual report on U.S. wind power installation, cost, and performance trends: 2007. U.S. Department of Energy, Energy Efficiency and Renewable Energy. Worldwatch Institute. (2007). Green jobs: Towards sustainable work in a low-carbon world. Preliminary Report. Green Jobs Initiative, United Nations Environment Programme (UNEP), International Labour Organization (ILO), International Trade Union Confederation (ITUC). Zayas, J. R., & Thatcher, R. (2008). Wind energy manufacturing and supply chain development proposal. NREL and Sandia National Laboratories.

Industry Structure and Company Strategies of Major Domestic and Foreign Wind and Solar Energy Manufacturers: Opportunities for Supply Chain Development in Appalachia
98
APPENDICES
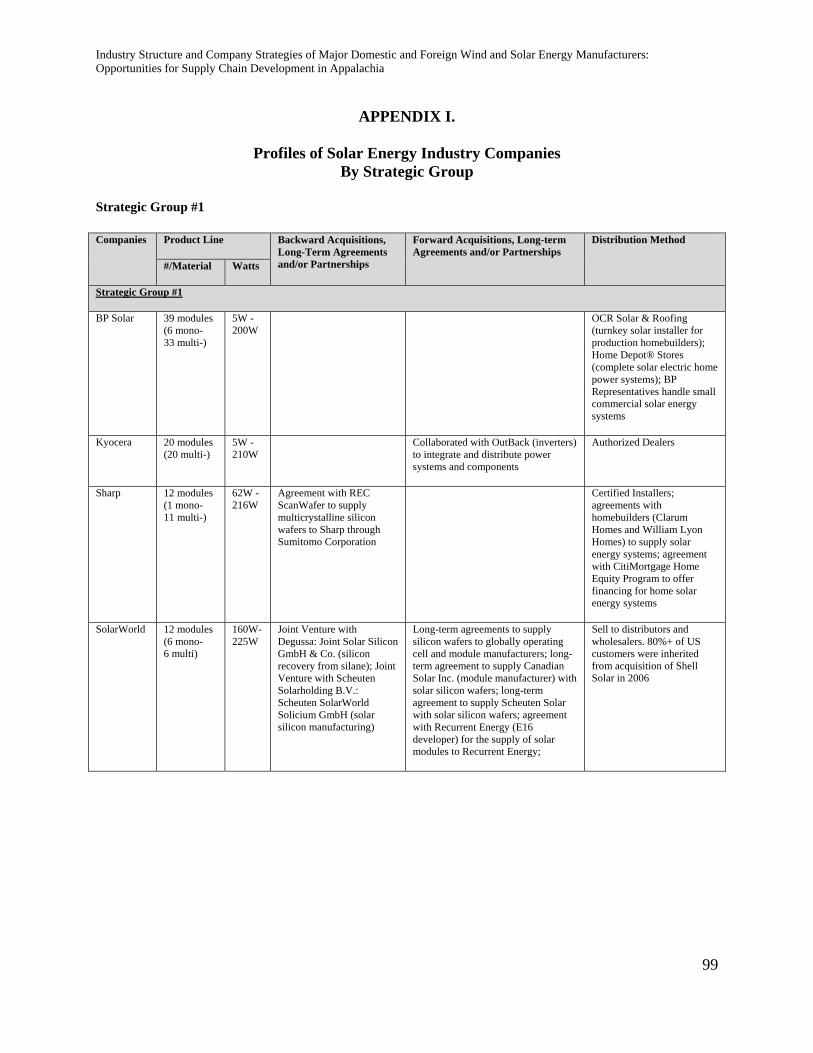
Industry Structure and Company Strategies of Major Domestic and Foreign Wind and Solar Energy Manufacturers: Opportunities for Supply Chain Development in Appalachia
99
APPENDIX I.
Profiles of Solar Energy Industry Companies By Strategic Group
Strategic Group #1
Companies
Product Line Backward Acquisitions, Long-Term Agreements and/or Partnerships
Forward Acquisitions, Long-term Agreements and/or Partnerships
Distribution Method
#/Material Watts
Strategic Group #1
BP Solar 39 modules (6 mono- 33 multi-)
5W - 200W
OCR Solar & Roofing (turnkey solar installer for production homebuilders); Home Depot® Stores (complete solar electric home power systems); BP Representatives handle small commercial solar energy systems
Kyocera 20 modules (20 multi-)
5W - 210W
Collaborated with OutBack (inverters) to integrate and distribute power systems and components
Authorized Dealers
Sharp 12 modules (1 mono- 11 multi-)
62W - 216W
Agreement with REC ScanWafer to supply multicrystalline silicon wafers to Sharp through Sumitomo Corporation
Certified Installers; agreements with homebuilders (Clarum Homes and William Lyon Homes) to supply solar energy systems; agreement with CitiMortgage Home Equity Program to offer financing for home solar energy systems
SolarWorld 12 modules (6 mono- 6 multi)
160W-225W
Joint Venture with Degussa: Joint Solar Silicon GmbH & Co. (silicon recovery from silane); Joint Venture with Scheuten Solarholding B.V.: Scheuten SolarWorld Solicium GmbH (solar silicon manufacturing)
Long-term agreements to supply silicon wafers to globally operating cell and module manufacturers; long-term agreement to supply Canadian Solar Inc. (module manufacturer) with solar silicon wafers; long-term agreement to supply Scheuten Solar with solar silicon wafers; agreement with Recurrent Energy (E16 developer) for the supply of solar modules to Recurrent Energy;
Sell to distributors and wholesalers. 80%+ of US customers were inherited from acquisition of Shell Solar in 2006

Industry Structure and Company Strategies of Major Domestic and Foreign Wind and Solar Energy Manufacturers: Opportunities for Supply Chain Development in Appalachia
100
Strategic Group #2
Companies Product Line Backward Acquisitions, Long-Term Agreements
and/or Partnerships
Forward Acquisitions, Long-term Agreements
and/or Partnerships Distribution Method
#/Material Watts
Strategic Group #2
Isofoton 12 modules (12 mono-)
75W – 200W
Isofoton agreed to purchase cells and modules from Perfectenergy Shanghai in 2008.
Agreed to supply panels for a number of specific projects with Endesa.
Sells to national and international distributors, and also installs its own systems.
Mitsubishi 23 modules (23 multi-)
110W - 190W
Website lists 14 system installers that can assist in the design and installation of a system
Sanyo 11 modules (11 mono-)
180W - 200W
Seven year agreement with Hoku Scientific to supply
polysilicon to Sanyo
Conergy (developer); SunWize (developer); Solera Sustainable Energies Company (developer)

Industry Structure and Company Strategies of Major Domestic and Foreign Wind and Solar Energy Manufacturers: Opportunities for Supply Chain Development in Appalachia
101
Strategic Group #3
Companies
Product Line Backward Acquisitions, Long-Term Agreements and/or Partnerships
Forward Acquisitions, Long-term Agreements and/or Partnerships
Distribution Method
#/Material Watts
Strategic Group #3
JA Solar 13 cells
(13 mono-)
2.32 W - 2.61W
Long-term agreement with JingLong Group for the supply of polysilicon; Long-term agreements with ReneSola for the supply of silicon wafers; Long-term agreement with M.SETEK for the supply of silicon wafers; Long-term agreement with GCL Silicon Technology for the supply of 6000MW of silicon wafers; Long-term agreement with Shunda for the supply of up to 1.2GW of silicon wafers.
Long-term sales agreement with Crown Renewable Energy for the supply of 45MW of solar cells; Agreement with Canadian Solar Inc. (CSI) for the supply of solar cells for use in CSI’s solar modules; Sales agreement with Solaria to supply up to 60MW of solar cells;
Sells PV cells to solar module manufacturers who assemble and integrate cells into modules and systems
Motech 171 cells
(119 mono- 52 multi-)
1.88W-4.22W
Long-term agreement with Swiss Wafer AG for the supply of wafers to Motech; long-term agreement with Nitol Solar to supply polysilicon to Motech; long-term agreement with Swiss Wafer AG for the provision of OEM wafer manufacturing services with raw materials consigned by Motech (via agreement with Nitol); long-term agreement with DC Chemical for the supply of polysilicon to Motech; agreement with Wacker Chemie AG for supply of silicon; agreement with Renesola for the supply of wafers to Motech; long-term agreement with REC ScanWafer for the supply of wafers; long-term agreement with AE Polysilicon for supply of polysilicon; Motech made direct equity investment in AE Polysilicon
Agreement with Solar Power Inc.(integrated developer) to provide 11 MW of multicrystalline cells; agreement with Open Energy Corp. (developer) to provide multicrystalline cells.
Signs long-term purchase agreements with customers.
Q-Cells 44 cells
(5 mono- 39 multi)
3.78W-6.97W
Joint Venture with Evergreen: EverQ (string ribbon manufacturing process); Agreement with Trina Solar for the supply of monorystalline wafers to Q-cells; long-term agreement with Elkem Solar for the supply of metallurgical silicon; Invested in REC (polysilicon and silicon wafers); long-term agreement with LDK for the supply of silicon wafers to Q-cells
Agreement with Solarsquare AG (subsidiary of Centrosolar AG - developer) for Q-cells to supply solar cells; Agreement with Solaria (research) for Q-cells to supply solar cells; long-term agreement with SOLON for Q-cells to supply solar cells; long-term agreement between CSG Solar AG (subsidiary of Q-cells) and IBC SOLAR AG (developer) for CSG Solar to supply solar modules; long-term agreement between CSG Solar AG (subsidiary of Q-cells) and Blitzstrom GmbH (developer) for CSG Solar to supply solar modules; long-term agreement with Power-Light (developer acquired by Sun-Power) for Q-cells to supply solar cells;
As an independent manufacturer of solar cells, Q-Cells builds close partnerships with module manufacturers in Germany and abroad. Export ratio is about 40%

Industry Structure and Company Strategies of Major Domestic and Foreign Wind and Solar Energy Manufacturers: Opportunities for Supply Chain Development in Appalachia
102
Strategic Group #4
Product Line Backward Acquisitions, Long-Term Agreements and/or Partnerships
Forward Acquisitions, Long-term Agreements and/or Partnerships
Distribution Method
Size/Material Watts
Strategic Group #4
First Solar 5 modules (5 CdTe)
65W - 75W
Acquired Turner Renewable Energy dba DT Solar (developer); long-term agreements for the manufacture and sale of solar modules to developers: EDF Energies Nouvelles, Schilienne-Sidec, Juwi Group, RIO Energie GmbH &Co. KG and SunEdison;
Sells modules to project developers, system integrators, and operators of projects under long term supply contracts for commercial, grid-connected solar power plant applications.
SunPower 6 modules (6 mono-)
210W- 315W
Long-term agreement with M.Setek Co, Ltd. (monocrystalline silicon supplier) for the supply of silicon to SunPower; long-term agreement with DC Chemical (chemical company dealing with silicon) for the supply of polysilicon to SunPower; Joint venture with Woongjin Conway (equipment manufacturer): Woongjin Energy Corp to manufacture monocrystalline silicon ingots (polysilicon will be supplied by DC Chemical); agreement between PowerLight (subsidiary of SunPower) and JingAo Solar (solar cell manufacturer) for the supply of silicon solar cells to PowerLight; long-term agreement with Hemlock Semiconductor (silicon supplier) for silicon to be supplied by Hemlock; long-term agreement with NorSun (supplier of monocrystalline silicon) for the supply of silicon in ingot and wafer form; long-term agreement with Jiawei SolarChina Co. for the supply of monocrystalline silicon ingots and wafers to SunPower; long-term agreement with Jupiter Corp., Ltd. (sales office of Qingdao DTK Industries Co., Ltd.) for the supply of polysilicon to SunPower;
Acquired PowerLight (a developer); Acquired Solar Solutions (a developer -- renamed SunPower Italia); long-term agreement with SOLON (developer) for the supply of SunPower solar cells; long-term agreement with NorSun (supplier of monocrystalline silicon) for the purchase of polysilicon from SunPower; long-term agreement with SMA Technologie AG (inverter manufacturer) for the incorporation of SMA inverters into SunPower solar applications;
Sells products through its own direct sales force. Also partners in a limited number of case to value-added resellers (VARS) in the U.S. and Europe
Baoding Tianwei Yingli (the operating subsidiary of Yingli Green Energy Holding Company)
44 modules (44 multi-)
5W – 240W
Long-term agreements with Wacker Chemie AG for the supply of polysilicon to Yingli; Long-term agreement with Xinguang Silicon Science and Technology Co., Ltd. for the supply of polysilicon to Yingli; Yingli signed $27 million contract for polysilicon from DC Chemical in 2008 and $188 million from 2009 to 2013.
Short-term agreement to supply 1.3MW of modules to Korea Electric Power Industrial Development Corporation (KEPID) and 2.0MW of modules to Kaycom; Project agreement to supply 11.56MW of modules to Iberdola (developer); Agreement to supply ATERSA (developer, parent company: Elecnor) with 16.5MW of modules; Agreement to supply EDF Energies Nouvelles with 7MW of modules; Agreement with Recurrent Energy (developer) for purchase of Yingli’s modules.
Installs its own systems in China. Partners with major systems integrators in Europe and the U.S. Sells Yingli brand name modules to system integrators and distributors in various markets including Germany, Spain, Italy, China and the U.S.

Industry Structure and Company Strategies of Major Domestic and Foreign Wind and Solar Energy Manufacturers: Opportunities for Supply Chain Development in Appalachia
103
Profile of Ningbo Solar
Product Line Backward Acquisitions, Long-Term Agreements and/or Partnerships
Forward Acquisitions, Long-term Agreements and/or Partnerships
Distribution Method #/Material Watts
Ningbo Solar
27 cells; 58 modules (28 mono- 30 multi-)
Cells: 1.45W – 2.58W; Modules: 150W – 240W
Long-term agreement with ReneSola for the supply of 105MW of solar wafers;
Ningbo Solar establishes NB Solar Systems as exclusive North America distributor for its UL approved panels. Still works with some independent distributors, e.g., ACA Technology (U.S.) and Calmonte (U.S.)..
Profile of Suntech Power
Product Line Backward Acquisitions, Long-Term Agreements and/or Partnerships
Forward Acquisitions, Long-term Agreements and/or Partnerships Distribution Method
#/Material Watts
Suntech 56 modules (29 mono- 27 mutli-)
110W-260W
Short and long-term agreements with a major Korean conglomerate for the supply of silicon wafers to Suntech; long-term agreement with Nitol Solar Ltd. (silicon producer) for the supply of polysilicon to Suntech; long-term agreement with Asia Silicon (silicon producer) for the supply of high purity polysilicon to Suntech; agreement with ReneSola Ltd. (wafer producer) for the supply of silicon wafers to Suntech; long-term agreement with Hoku Materials (subsidiary of Hoku Scientific) for supply of polysilicon to Suntech; long-term agreement with Sunlight Group to supply silicon wafers to Suntech; long-term agreement with a US-owned, China-based company for the supply of silicon wafers to Suntech; agreement with REC (silicon wafer supplier) to supply silicon wafers to Suntech through Sumitomo Corporation; long-term agreement with MEMC to supply silicon wafers to Suntech
Agreement with Akeena Solar (designer/integrator) for Suntech to manufacture Akeena's Andalay solar panels; licensing agreement with Akeena Solar for Suntech to distribute Andalay solar panels; Acquired MSK Corporation (module manufacturer); manufacturing alliance between Suntech America (the US division of Suntech) and Lumeta (subsidiary of DRI Companies) for Suntech to manufacture Lumeta's roof integrated cells and modules; agreement with Open Energy (designer/manufacturer) for Suntech to manufacture Open Energy's BIPV products -- the companies will market each other's broad portfolio of BIPV products in the North American market; long-term agreement with SunEdison (developer) for Suntech to supply SunEdison with solar modules; Agreement with Recurrent Energy (developer) for the supply of solar modules to Recurrent Energy;
Sales agreement with Conergy AG (developer) for Suntech to supply modules; Distribution agreement between MSK Corporation (subsidiary of Suntech) and ARISE Technologies Corporation for the distribution of MSK BIPV products in the Canadian Market. Suntech expanded into the Europe, Middle East and Africa markets through Suntech Europe Ltd.

Industry Structure and Company Strategies of Major Domestic and Foreign Wind and Solar Energy Manufacturers: Opportunities for Supply Chain Development in Appalachia
104
APPENDIX II. Acquisitions, Partnerships, and Framework Agreements between Turbine Manufacturers, Suppliers and Buyers
Company
Suppliers
Backward Acquisitions, Framework Agreements and/or
Partnerships
Buyers
Forward Acquisitions, Framework Agreements and/or Partnerships
Vestas Multi-year preferential manufacturing contract with Tower Tech Inc. (a
subsidiary of Broadwind Energy Inc.) for towers;
(07/2004) Framework agreement with Terna Energy for 58MW (29 – V80-2.0MW turbines) for delivery in 2004-
2005;
(11/2006) Framework agreement with EDF Energies Nouvelles (a developer) for 200MW of turbines (V52-850kw, V80-2.0MW, V90-2.0MW and V90-3.0MW) for delivery in 2008 and 2009 and the option for an additional 123MW was
also taken;
(04/2007) Framework agreement with We Energies for 145MW of turbines (88 V82 1.65MW turbines) for delivery
in 2007 and 2008;
(01/2008) Framework agreement with China’s Guandong Nuclear Wind Power for 197.2 MW of turbines (52 850 KW
wind turbines) for delivery beginning in mid-2008 and ending at the end of 2009;
(03/2008) Framework agreement with the North American Division of E. ON Climate & Renewables for 180 MW of
turbines (109 units of the V82-1.65 MW turbine) for delivery at the end of 2008 through the first quarter of 2009;
(05/2008) Framework agreement with IVPC (an Italian wind energy operator) to supply 46 MW of turbines (26 V90-1.8MW, five V90-3MW, and 20 V90-2MW). Separate
framework agreement with TransAlta (a Canadian energy operator) for 66 MW of turbine capacity (V90 3MW
turbines);
(06/2008) Master supply agreement with Alliant Energy Corporate Services for 500MW of turbines (V82-1.65MW);
(10/2008) Framework agreement with EDP Renováveis for 99MW of turbines (18 V90-3.0MW and 18 V90-1.8MW
turbines).
GE Wind Long term agreement with TPI Composites for turbine blades;
(10/2007) Framework agreement with EDP for 500MW of (80 - 2.5MW and 201- 1.5MW turbines) for projects in 2008
and 2009;
(05/2008) Framework agreement with Iberdrola Renewables for 300MW of turbines (200 GE 1.5MW turbines) for
delivery in 2010.

Industry Structure and Company Strategies of Major Domestic and Foreign Wind and Solar Energy Manufacturers: Opportunities for Supply Chain Development in Appalachia
105
Company
Suppliers
Backward Acquisitions, Framework Agreements and/or
Partnerships
Buyers
Forward Acquisitions, Framework Agreements and/or Partnerships
Gamesa (04/2008) Framework agreement with Tower Tech Systems Inc. (
subsidiary of Broadwind Energy Inc.) for G87 78 meter towers;
(04/2005) Framework agreement with HidroCantabrico for 340MW (9 – G52-850kw, 68 – G58-850kw and 4 – G80-
2.0MW turbines);
(09/2005) Framework agreement with Ibereloica for 214MW of turbines to be delivered in 2008;
(11/2005) Framework agreement with Horizon Wind (a developer) for 400MW and the option of another 200MW
(G80-2.0MW, G83-2.0MW, G87-2.0MW and G90-2.0MW turbines) for delivery in 2006-2007;
(10/2007) Framework agreement with Babcock & Brown for up to 490MW of wind energy projects scheduled to be
available in 2007-2009;
(06/2008) Strategic agreement with Iberdrola Renewables for 4,500 MW of turbines for delivery between 2010 and 2012;
(10/2008) Framework agreement with China Longyuan Electric Power Group Corporation for 344MW of turbines
(405 Gamesa G5X-850kW turbines) for delivery throughout 2009;
Enercon (01/2008) Turbine supply agreement with EarthFirst Canada, Inc. (a developer) for 30MW of turbines (15 E82 2MW
turbines) for delivery in 2009;
(04/2008) Purchase agreement with Shear Wind Inc. (a developer) for 60MW (30 E-82 2MW turbines) for delivery in
2008 and 2009;
(06/2008) Framework agreement with Wallenstam AB (a developer) for 29 wind turbines during 2011;

Industry Structure and Company Strategies of Major Domestic and Foreign Wind and Solar Energy Manufacturers: Opportunities for Supply Chain Development in Appalachia
106
Company
Suppliers
Backward Acquisitions, Framework Agreements and/or
Partnerships
Buyers
Forward Acquisitions, Framework Agreements and/or Partnerships
Suzlon Acquired Hansen (a gearbox manufacturer) in 2006;
(02/2006) Master supply agreement with John Deere Credit (a developer) for 238MW of turbines (S88-2.1MW and S64-
1.25MW models) for delivery in 2006;
(04/2007) Framework agreement with Tierra Energy for 88MW of turbines (42 S88-2.1MW turbines) for delivery in
2008;
(06/2007) Framework agreement with Edison Mission Group for 630MW (300 – S88-2.1MW turbines) in 2008 and 2009;
(06/2007) Framework agreement with PPM Energy (a developer) for 700MW of turbines (334 S88-2.1MW turbines)
for delivery in 2008 and 2009;
(11/2007) Framework agreements with Renewable Power Ventures and AGL Energy for 200MW of turbines (63 S88-
2.1MW turbines) for delivery in 2009;
(12/2007) Framework agreement with the Oil and Natural Gas Corporatoin (India) for 51MW of turbines (34 S82-
1.5MW turbines) for delivery in 2008;
(01/2008) Framework agreement with Eiola Renovables SRC and Inciativas for 42.5MW of turbines (22 units of S88-
2.1MW turbines) for delivery in 2008;
(01/2008) Framework agreement with the Jingneng Group for 100MW of turbines (33 S82-1.5MW turbines and 40 S64-
1.25MW turbines) for delivery in 2008;
(04/2008) Purchase agreement with Ao Lu Jia New Energy Development (a developer) and Beifang Longyuan (a
developer) for 148.5MW and 50MW in turbines (99 units of S-82 1.5MW and 40 units of S-64 1.5MW turbines) for
delivery in 2008 to 2010;
(04/2008) Framework agreement with Horizon Wind Energy (a developer) for 600MW in wind capacity (286 S88-2.1MW
turbines) for delivery in 2008 and 2009.
(11/2008) Framework agreement with ENDESA COGENERACIÓN Y RENOVABLES for 190MW of
turbines (9 G5X-850KW and 91 G87-2.0MW turbines) for delivery between 2008 and 2010.

Industry Structure and Company Strategies of Major Domestic and Foreign Wind and Solar Energy Manufacturers: Opportunities for Supply Chain Development in Appalachia
107
Company
Suppliers
Backward Acquisitions, Framework Agreements and/or
Partnerships
Buyers
Forward Acquisitions, Framework Agreements and/or Partnerships
Siemens Acquired Winergy (a gearbox manufacturer) in 2005;
(01/2007) Master supply agreement with Lakeview Light & Power
(03/2008) Framework agreement with Vattenfall (a developer) for 170MW of turbines to be delivered in 2009
and 2010;
(04/2008) Framework agreement with Cascade Wind Acquisition LLC (a developer) for 300MW of turbines (130
SWT-2.3-93 turbines) for delivery in 2008 and 2009;
(04/2008) Framework agreement with Portland General Electric (a utility) for 325MW of turbines (141 SWT-2.3-93
turbines) for delivery in 2009 and 2010;
(05/2008) Framework agreement with Greater Gabbard Offshore Winds, Ltd. (a developer) for 504MW of turbines to
be delivered in 2009 and 2010;
(09/2008) Framework agreement with E.ON for 1150MW of turbines (500 2.3MW turbines) to be delivered in 2010 and
2011;
Acciona Acquired 1300 MW worth of wind projects from EcoEnergy LLC
(01/2008) Completed 100% acquisition of Eolica Cesa for 77 million euros. In January 2006,
Acciona acquired 93.13% of Eolica Cesa for 973 million euros;
(04/2007) Construction of a wind turbine production plant in Iowa with scheduled production of 200 turbines in 2008 and
future production of 400 turbines per year;
(05/2007) Framework agreement with Naturener for 300MW of turbines for delivery in 2008;
(01/2008) Power purchase agreement with New Brunswick Power for 49.5MW of turbines (33 Acciona 1.5MW turbines);
(05/2008) Framework agreement with EDP Renovaveis (an EDP Group Company) for 382.5MW of turbines in 2009-
2011 with the option for an additional 400MW;
(05/2008) Framework agreement with Nova Scotia Power for 30MW of turbines;
(10/2008) Sole investor and owner of 223.5MW of turbines at two wind farms in Illinois and Oklahoma (67 AW-1500
turbines in Illinois and 82 AW-1500 turbines in Oklahoma). The project is scheduled for completion in 2008.

Industry Structure and Company Strategies of Major Domestic and Foreign Wind and Solar Energy Manufacturers: Opportunities for Supply Chain Development in Appalachia
108
Company
Suppliers
Backward Acquisitions, Framework Agreements and/or
Partnerships
Buyers
Forward Acquisitions, Framework Agreements and/or Partnerships
Goldwind (02/2007) Strategic Cooperation Agreement with LM Glasfiber for 6
years for the supply of blades to begin in 2007;
(06/2008) Memorandum of understanding agreement with Planet Energy Limited Pakistan for 50MW of turbines, with
an expansion capacity of 150MW.
(02/2008) Agreed to acquire a 70 percent stake in German wind-turbine maker Vensys Energy AG for 41.24 million
euros;
Nordex (10/2006) Framework agreement with the German development subsidiary of a large European wind energy group for approximately 70MW (N90-2.3MW or 2.5MW
turbines);
(04/2007) Framework agreement with Babcock & Brown for up to 640MW for delivery in 2008-2011;
(11/2007) Framework agreement with Greentech Energy Systems for 515MW (224 turbines from the S77-1.5MW,
N90-2.3MW and N100-2.5MW series);
(11/2007) Framework agreement with BP Alternative Energy North America Inc. for 150MW of turbines (N90/2.5MW
turbines) for delivery in 2009;
(01/2008) Framework agreement with Beijing Energy for 150MW (99 – S70/1500kw turbines) for delivery in 2009;
(01/2008) Framework agreement with Everpower Renewables for 62.5MW of turbines (25 N90/2.5MW turbines) for
delivery 2008;
(02/2008) Framework agreement with Eolia Renovables for up to 215MW (86 - N90 and N100 2.5MW turbines);
(11/2008) Framework agreement with Beijing Energy for 150MW of turbines (33 S70/1.5MW turbines) for delivery in
2009.
Sinovel American Superconductor’s subsidiary Windtec will develop complete electrical systems for Sinovel wind turbines, e.g., control, pitch and variable-speed power
electrical systems.

Industry Structure and Company Strategies of Major Domestic and Foreign Wind and Solar Energy Manufacturers: Opportunities for Supply Chain Development in Appalachia
109
APPENDIX III
NAICS Codes (Adapted from Renewable Energy Policy Project Location of Manufacturing Activity Studies)
Manufacturing Firms with Technical Potential to Enter Solar PV Market
Manufacturing Firms with Technical Potential to Enter Wind Turbine Market

Industry Structure and Company Strategies of Major Domestic and Foreign Wind and Solar Energy Manufacturers: Opportunities for Supply Chain Development in Appalachia
110
APPENDIX IV*
Summary State Potential Employment and Establishment Data by Renewable Resource** (**Dominant manufacturing component is in parentheses)
ALABAMA Wind Solar Employment 2,180 1,408 Establishments 29 34 County with Greatest Employment Concentration
Madison: 627 Jobs, 8 Facilities, 3 Components
Morgan: 444 Jobs, 2 Facilities, 2 Components
Employment in At-Risk Counties 424 (Ball and Roller Bearings) 73 (Current Carrying Wiring Devices)
GEORGIA Wind Solar Employment 7,113 2,587 Establishments 126 77 County with Greatest Employment Concentration
Gwinnett: 1,894 Jobs, 36 Facilities, 7 Components
Gwinnett: 336 Jobs, 18 Facilities, 7 Components
KENTUCKY Wind Solar Employment 4,499 1,545 Establishments 38 14 County with Greatest Employment Concentration
Jackson: 1,051 Jobs, 5 Facilities, 3 Components
Madison: 749 Jobs, 2 Facilities, 2 Components
Employment in At-Risk Counties
1,360 (Plastics Products) 357 (Sheetmetal)
MARYLAND Wind Solar Employment 851 465 Establishments 16 12 County with Greatest Employment Concentration
Washington: 676 Jobs, 13 Facilities, 7 Components
Washington: 391 Jobs, 10 Facilities, 4 Components
MISSISSIPPI Wind Solar Employment 3,517 1,042 Establishments 24 16 County with Greatest Employment Concentration
Lowndes: 535 Jobs, 5 Facilities, 3 Components Alcorn: 401 Jobs, 1 Facility, 1 Components
Employment in At-Risk Counties
944 (Motors and Generators)
723 (Plastics Film & Sheet, Plastics Material & Resin)
NEW YORK Wind Solar Employment 5,544 1,613 Establishments 71 31 County with Greatest Employment Concentration
Broome: 1,889 Jobs, 18 Facilities, 8 Components
Steuben: 546 Jobs, 3 Facilities, 1 Component
NORTH CAROLINA Wind Solar Employment 4,619 4,350 Establishments 74 44 County with Greatest Employment Concentration
Watauga: 1,483 Jobs, 29 Facilities, 7 Components
Watauga: 1,923 Jobs, 31 Facilities, 6 Components
Employment in At-Risk Counties 1,685 (Plastics Products) 40 (Sheetmetal)
OHIO Wind Solar Employment 5,480 2,641 Establishments 94 44 County with Greatest Employment Concentration
Columbiana: 837 Jobs, 13 Facilities, 4 Components
Washington: 803, 6 Facilities, 2 Components
Employment in At-Risk Counties
648 (Iron Foundries) 122 (Plastics Material and Resin)
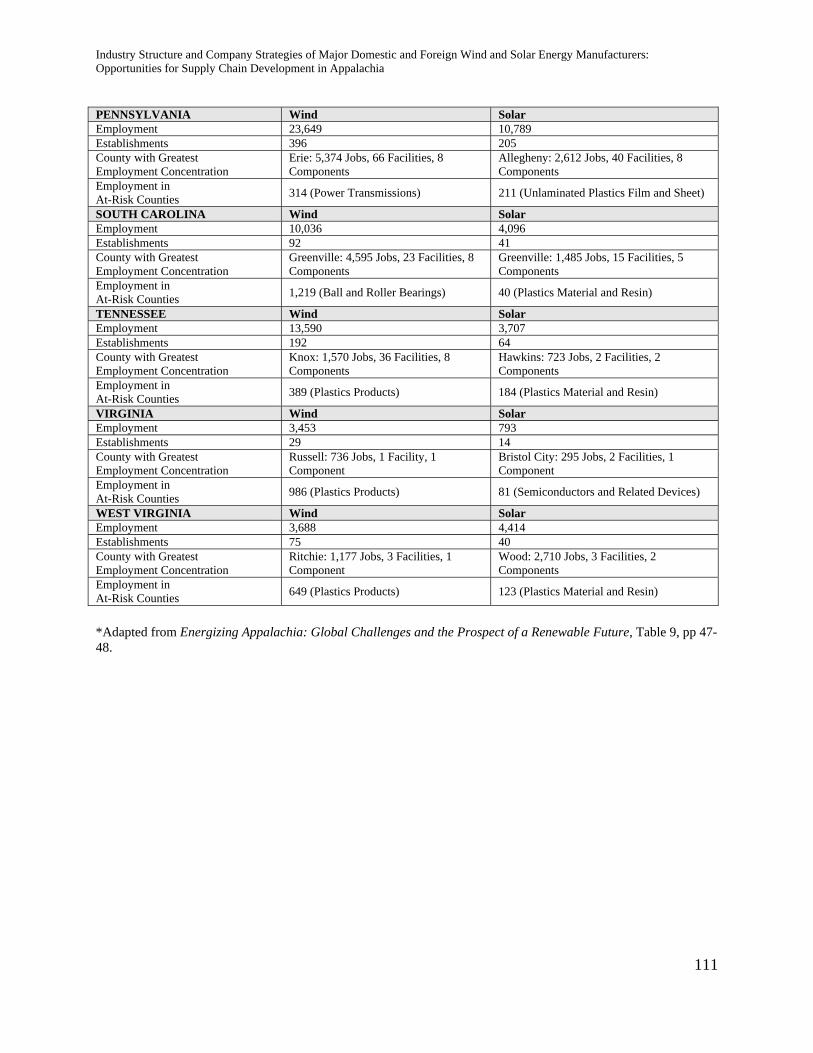
Industry Structure and Company Strategies of Major Domestic and Foreign Wind and Solar Energy Manufacturers: Opportunities for Supply Chain Development in Appalachia
111
PENNSYLVANIA Wind Solar Employment 23,649 10,789 Establishments 396 205 County with Greatest Employment Concentration
Erie: 5,374 Jobs, 66 Facilities, 8 Components
Allegheny: 2,612 Jobs, 40 Facilities, 8 Components
Employment in At-Risk Counties 314 (Power Transmissions) 211 (Unlaminated Plastics Film and Sheet)
SOUTH CAROLINA Wind Solar Employment 10,036 4,096 Establishments 92 41 County with Greatest Employment Concentration
Greenville: 4,595 Jobs, 23 Facilities, 8 Components
Greenville: 1,485 Jobs, 15 Facilities, 5 Components
Employment in At-Risk Counties 1,219 (Ball and Roller Bearings) 40 (Plastics Material and Resin)
TENNESSEE Wind Solar Employment 13,590 3,707 Establishments 192 64 County with Greatest Employment Concentration
Knox: 1,570 Jobs, 36 Facilities, 8 Components
Hawkins: 723 Jobs, 2 Facilities, 2 Components
Employment in At-Risk Counties 389 (Plastics Products) 184 (Plastics Material and Resin)
VIRGINIA Wind Solar Employment 3,453 793 Establishments 29 14 County with Greatest Employment Concentration
Russell: 736 Jobs, 1 Facility, 1 Component
Bristol City: 295 Jobs, 2 Facilities, 1 Component
Employment in At-Risk Counties 986 (Plastics Products) 81 (Semiconductors and Related Devices)
WEST VIRGINIA Wind Solar Employment 3,688 4,414 Establishments 75 40 County with Greatest Employment Concentration
Ritchie: 1,177 Jobs, 3 Facilities, 1 Component
Wood: 2,710 Jobs, 3 Facilities, 2 Components
Employment in At-Risk Counties 649 (Plastics Products) 123 (Plastics Material and Resin)
*Adapted from Energizing Appalachia: Global Challenges and the Prospect of a Renewable Future, Table 9, pp 47-48.

Industry Structure and Company Strategies of Major Domestic and Foreign Wind and Solar Energy Manufacturers: Opportunities for Supply Chain Development in Appalachia
112
APPENDIX V
Survey Instrument
Interviewee Name and Contact Information Name: Position: Email: Phone: Part I. Company/Organization Information Company Name: Company Address:
Year Established:
NAICS Code:
# of Employees:
# of Locations:
11. Legal Structure (check one): S-Corporation Partnership Sole Proprietorship Limited Liability Corporation (LLC) Corporation (Inc.) Branch Plant Other, please describe: 12. What is the primary function of your business? What types of products or services do you provide? 13. To whom do you provide your products (i.e. which sectors make up your major client base)? 14. Are you an OEM, first tier, second tier, or third tier supplier? (Check all that apply)
OEM (Original Equipment Manufacturer) - producer of the finished product, last manufacturer in the supply chain before the end-user.
First Tier - direct vendor of OEMs usually providing assembled parts or major components in the value chain of a product.
Second Tier - sub-supplier or vendor to the 1st Tier suppliers in the value chain of a product. Third Tier - sub-supplier or vendor to the 2nd Tier suppliers in the value chain of a product. Unsure - Please Describe

Industry Structure and Company Strategies of Major Domestic and Foreign Wind and Solar Energy Manufacturers: Opportunities for Supply Chain Development in Appalachia
113
Part II. Questions about your experience in the solar or wind industry 15. What products/services do you supply specifically to the wind and/or solar industries? (Please list all that apply.) 16. Was your business originally created to serve the renewable energy industry?
YES NO
17. If your business was not originally created to provide renewable energy products, what prompted you to do start doing so? In what year did you begin to sell products to the wind and solar industries? 18. What challenges, if any, did you face in starting to sell solar or wind-related products in this business (e.g. finding/training workforce; gaining technical knowledge; competing in the market; etc.)? 19. Approximately what percentage of your overall yearly profit comes from your sales in the wind/solar sector? 20. Do you provide services (i.e. product design solutions, customer support, etc.) to your domestic customers? How essential are these services in selling your products and competing in the marketplace? 21. Have the overall sales in the renewable energy portion of your business grown over time? Have you entered any new renewable energy markets lately? 22. If your domestic renewable energy business has grown over time, what factors have contributed to this growth? (e.g., new product development, improvement of existing products, increase in efficiency, etc.) Part III. Questions about your workforce 23. In the last twelve months, has providing products and/or services for the wind/solar industries required that you hire new people to work in your business? (Check one)
YES NO

Industry Structure and Company Strategies of Major Domestic and Foreign Wind and Solar Energy Manufacturers: Opportunities for Supply Chain Development in Appalachia
114
24. If your workforce increased due to growth in the wind/solar sector, how did you identify new employees? 25. Do you face difficulty in finding/hiring sufficient numbers of workers for your business? (Check one)
YES NO
26. Did you use state-sponsored programs to locate new employees, train them, or locate your business?
YES NO
27. In general, does production for the wind/solar industry require that your workers have a different set of skills as compared to other products that you produce?
YES NO
28. What types of skills are you looking for your employees to obtain, or have your employees already obtained in order to produce products for the wind/solar industries? 29. How well is your existing workforce prepared to produce products for the solar/wind industries? 5=Extremely Prepared 1=Not Prepared (Check one)
5 – Extremely Prepared 4 – Well Prepared 3 – Somewhat Prepared 2 – Insufficiently Prepared 1 – Not Prepared
30. If they are/were not prepared, is/was retraining or skill upgrading required?
YES NO
31. If new skills were required, how were workers able to obtain them? If you anticipate a need for skill upgrading in the future, what sources/organizations/institutions will you consider to help you train your staff?

Industry Structure and Company Strategies of Major Domestic and Foreign Wind and Solar Energy Manufacturers: Opportunities for Supply Chain Development in Appalachia
115
32. Has production for the wind/solar industries required you to update, expand, or relocate any of your business facilities?
YES NO
33. Looking to the next five years, if your market for solar and wind products grows, do you anticipate a need to hire more workers?
YES NO
Part IV. Questions regarding foreign markets. 34. Do you and your company work internationally and do you sell your product or services to companies in the wind or solar industries in other countries?
YES NO
IF ‘NO’ DISREGARD QUESTIONS 35-41 35. In five years, what percentage of your overall sales do you anticipate will come from foreign transactions? 36. What do you attribute your estimate of foreign sales (Question 33) to? Is it a result of the development of new products, the improvement or sale of existing products, an increase in efficiency, or some other combination of factors? (Please describe). 37. Do you provide your foreign customers with services (i.e. product design solutions, customer support, etc.) as well as products? If so, what services and how essential are these services to selling your products in foreign markets? 38. What qualities of your products and services help you compete in foreign markets? 39. How do you keep up-to-date about economic, technological, and political changes in the foreign markets in which you compete? (i.e. reading trade publications, attending conferences, university courses, etc.) 40. What do you do in foreign markets to protect your intellectual property or ideas (i.e. patents, copyright protection, etc.)?

Industry Structure and Company Strategies of Major Domestic and Foreign Wind and Solar Energy Manufacturers: Opportunities for Supply Chain Development in Appalachia
116
41. Have you formed partnerships or alliances with any foreign companies? (Please list anything longer than a single transaction.) 42. Other notes or comments:

Industry Structure and Company Strategies of Major Domestic and Foreign Wind and Solar Energy Manufacturers: Opportunities for Supply Chain Development in Appalachia
117
APPENDIX VI Database of Potential Participants in Solar or Wind Industry
Employer City State Zip Code County NAICS Involved in Solar or Wind?
ALABAMA AG Scientific Glass Co Inc Decatur AL 35603-1113 Morgan 327211 Not Involved AGI Corporation Huntsville AL 35806-3901 Madison 326199 Unable to contact Alphabet, Inc Decatur AL 35601-7911 Morgan 325211 Unable to contact Batteries of North Alabama, Inc. Huntsville AL 35806-1790 Madison 335911 Not Involved CB Fabrication, LLC Trinity AL 35673-4251 Morgan 332312 Not Involved Construction Services Inc Decatur AL 35603-1435 Morgan 332312 Not Involved D & K Technical LLC Somerville AL 35670-3410 Morgan 335313 Not Involved Daikin America, Inc Decatur AL 35601-8810 Morgan 325211 Not Involved Edwards Design & Fabrication Inc. Meridianville AL 35759-2038 Madison 332312 Not Involved Falcon Fabrication, Inc Laceys Spring AL 35754-3817 Morgan 332322 Not Involved GreenWorks Design/Build Blountsville AL 35031 Blount Currently Involved Interstate Steel Company Decatur AL 35601 Morgan 332312 Not Involved Jones Batteries Clanton AL 35045 Chilton Not Involved Panel Craft, Inc Hartselle AL 35640-6049 Morgan 326199 Not Involved R F Thermoform Products Inc. Huntsville AL 35801-5908 Madison 326199 Not Involved Siemens Energy & Automation, Inc Decatur AL 35603-5640 Morgan 335313 Involved, but outside the region Solar Enterprises Enterprise AL 36331-0480 Marshall Not Involved Solutia Inc. Decatur AL 35601 Morgan 325211 Not Involved Sue Jac, Inc Decatur AL 35603-1450 Morgan 332312 Not Involved Symmetry Resources Inc Arab AL 35016-1362 Marshall 811219 Not Involved Tara Manufacturing, Inc. Owens Cross Roads AL 35763-9359 Madison 326199 Not Involved Ultra Manufacturing (USA), Inc. Huntsville AL 35811-9658 Madison 326199 Unable to contact GEORGIA Advanced Energy Systems Inc Snellville GA 30078 Gwinnett Currently Involved CAB Inc Oakwood GA 30566-3518 Hall 423510 Involved, but outside the region Digital Communications Systems Dallas GA 30157-6554 Paulding 811211 Not Involved One World Sustainable Energy Corp. Colbert GA 30628 Madison Currently Involved PowerQwest Inc. Duluth GA 30096 Gwinnett 334413 Not Involved Solairgen Inc. Dahlonega GA 30533-4750 Lumpkin 238220 Currently Involved

Industry Structure and Company Strategies of Major Domestic and Foreign Wind and Solar Energy Manufacturers: Opportunities for Supply Chain Development in Appalachia
118
Southeast Solar Co. Duluth GA 30096 Gwinnett 238220 Currently Involved Stationary Power Services Norcross GA 30093 Gwinnett Defunct Supreme Battery Waleska GA 30183-5004 Cherokee 423840 Unable to contact SureOn Power Systems Acworth GA 30102-2590 Cherokee Unable to contact TEC Restorations Canton GA 30115 Cherokee Currently Involved KENTUCKY Ashland Fabricating and Welding Company Ashland KY 41101-2040 Boyd 332312 Unable to contact B & H Tower Service, LLC Argillite KY 41121-8613 Greenup 332312 Not Involved Ganote Enterprises Inc. Cattlesburg KY 41129-9679 Boyd 332312 Not Involved Genesis Development of Kentucky, LLC Elkhorn City KY 41522 Pike 221119 Currently Involved Global Defenses Ashland KY 41101-7555 Boyd 335312 Unable to contact Joseph M Jenkins Flatwoods KY 41139-1958 Greenup 332312 Not Involved Kentucky Solar Living, LLC Richmond KY 40475 Madison Unable to contact Prince Electronics Inc Russel KY 41169-1046 Greenup 335999 Not Involved Steel Technologies Inc Wurtland KY 41144-7681 Greenup 332312 Not Involved Superior Battery Manufacturing Company Russell Springs KY 42642-8854 Russell 335911 Not Involved Tangent Technologies Inc Ashland KY 41102-9657 Boyd 326199 Unable to contact MARYLAND A M M Corporation Cumberland MD 21502-8640 Allegany 332322 Not Involved Artmor Plastics Corporation Cumberland MD 21502 Allegany 326199 Not Involved Big D Electric Inc. Cumberland MD 21502 Allegany 238210 Currently Involved Energy Elements LLC Hagerstown MD 21740 Washington Currently Involved MISSISSIPPI Advanced Plastics Inc Tupelo MS 38804 Lee 326199 Defunct City Electric Supply Branch 537 Tupelo MS 33801-6520 Lee 335999 Not Involved Ellis Steel Company Inc West Point MS 39773-2311 Clay 332312 Not Involved Flexible Foam Products, Inc Tupelo MS 38804-5825 Lee 325211 Not Involved L & J Product & Sales Tupelo MS 38804-6907 Lee 325211 Not Involved Miscellaneous Steel Supply LLC West Point MS 39773 Clay 332312 Not Involved Precision Machine & Metal Fabrication, Inc. Tupelo MS 38801-4946 Lee 332322 Unable to contact Ultra Drying Technology West Point MS 39773-8517 Clay 333412 Not Involved

Industry Structure and Company Strategies of Major Domestic and Foreign Wind and Solar Energy Manufacturers: Opportunities for Supply Chain Development in Appalachia
119
NEW YORK Alternative Traxx New Berlin NY 13411-0063 Chenango Unable to contact AY Solar Vestal NY 13850 Broome 561990 Currently Involved Creative Energy Technologies Summit NY 12175 Schoharie Currently Involved David Austin South New Berlin NY 13843-2233 Chenango Currently Involved ETM Solar Works Endicott NY 13760 Broome 238220 Currently Involved Four Winds Renewable Energy Arkport NY 14807 Steuben 238220 Currently Involved Gay Canough Endicott NY 13760-4915 Broome Currently Involved Great Brook Renewable Energy South New Berlin NY 13843-2233 Chenango 444190 Currently Involved Marsland Renewable Energy Greene NY 13778 Chenango Currently Involved Peerless-Winsmith Inc Springfield NY 14141-1165 Otsego 333612 Involved, but outside the region Renovus Energy Inc. Ithaca NY 14850-5004 Tompkins 238290 Currently Involved Silicon Solar Sidney NY 13838-1128 Delaware 444190 Currently Involved SKF USA Inc. Falconer NY 14733-9705 Chautauqua 332991 Involved, but outside the region SKF USA Inc. Jamestown NY 14701-3802 Chautauqua 332991 Involved, but outside the region The Hilliard Corporation Elmira NY 14902-1504 Chemung 333411 Currently Involved NORTH CAROLINA Advanced Thermal Solutions Hendersonville NC 28792-6827 Henderson 238220 Currently Involved Appalachian Energy Services Brasstown NC 28902 Clay Currently Involved Appropriate Building Solutions Inc. Boone NC 28803 Watauga Currently Involved Atronic Plastic Inc. Fletcher NC 28732-8655 Henderson 326199 Not Involved Bromley Plastics Corporation Fletcher NC 28732 Henderson 325211 Not Involved Command Mobility Franklin NC 28734-9275 Forsyth 446199 Not Involved Douglas Battery Manufacturing Company Winston-Salem NC 27107 Forsyth 335911 Currently Involved Elkamet, Inc. East Flat Rock NC 28726-2116 Henderson 326199 Not Involved Friedman & Sun Access Store Dillsboro NC 28725-0657 Jackson Currently Involved Kaydon Corporation Mocksville NC 27028-9304 Davie 332991 Involved, but outside the region King Service Group Inc. Black Mountain NC 28711-6009 Buncombe 335999 Not Involved Liberty Plastics, Inc. Etowah NC 28729 Henderson 326199 Defunct Moventas Winston-Salem NC 27104 Forsyth Involved, but outside the region Nypro Asheville Inc. Arden NC 28704-9457 Buncombe 326199 Not Involved Progressive Technologies Inc Pilot Mountain NC 27041-7572 Surry 334419 Not Involved R & D Plastics, Inc. Arden NC 28704-8514 Buncombe 326199 Not Involved Rock Castle Solar Inc Asheville NC 28803 Buncombe Currently Involved

Industry Structure and Company Strategies of Major Domestic and Foreign Wind and Solar Energy Manufacturers: Opportunities for Supply Chain Development in Appalachia
120
Saft America Inc Valdese NC 28690-9635 Burke 335912 Involved, but outside the region Sun Stuff of Asheville Asheville NC 28803 Buncombe 453998 Not involved Sundance Power Systems Mars NC 28787-9346 Madison 238220 Currently Involved Surry Solar Services Mounty Airy NC 27030-9192 Surry 423830 Not Involved Susten.com Building Energy Solutions Asheville NC 28806 Yancey 541611 Currently Involved Thermacraft Energy Services Asheville NC 28804 Buncombe 541990 Currently Involved Tri-State Life Safety & Electric Systems Inc. Murphy NC 28906-4121 Cherokee 453998 Not Involved T-Square Builders Inc Banner Elk NC 28604-5500 Avery 236115 Currently Involved OHIO Alpha Welding & Fabricating Inc. South Point OH 45680-7465 Lawrence 332312 Not Involved Americas Styrenics LLC Hanging Rock OH 45638-8687 Lawrence 325211 Not Involved Dovetail Solar and Wind Athens OH 45701 Athens 238210 Currently Involved Endot Industries Inc South Point OH 45680-8881 Lawrence 325211 Not Involved J & M Maynard Enterprises Inc Ironton OH 45638-1349 Lawrence 332312 Not Involved Jetstream Power International Holmesville OH 44633 Holmes Defunct Modular Security Systems Inc Ironton OH 45638-1130 Lawrence 335999 Not Involved SHS Generators Proctorville OH 45669-8829 Lawrence 335312 Defunct Solar Creations Perrysville OH 44864 Holmes Defunct Third Sun Solar and Wind Power Athens OH 45701-1565 Athens 238220 Currently Involved PENNSYLVANIA A M Sheet Metal Inc Williamsport PA 17702-7233 Lycoming 238390 Not Involved A.C. Moore Inc Pittsburgh PA 15205-1404 Allegheny Not Involved Acurlite Structural Skylights Berwick PA 18603-0005 Columbia 327211 Currently Involved Advanced Cast Products Meadville PA 16335 Mercer 331511 Not Involved Advanced Drainage Systems Inc Muncy PA 17756-0404 Lycoming 326122 Unable to contact Advanced Metal Systems of PA Selinsgrove PA 17870-0117 Snyder 332322 Defunct Affordable Alternative Energy Wellsboro PA 16901 Tioga Currently Involved Alcan Corp Williamsport PA 17701-4171 Lycoming 331421 Not Involved Alumax Inc Bloomsburg PA 17815-2415 Columbia 331315 Not Involved American Superconductor West Mifflin PA 15122 Allegheny 335313 Currently Involved Arcos Industries LLC Mount Carmel PA 17851-2504 Northumberland 335999 Unable to contact Arris (formerly C-Cor Inc) State College PA 16801-7530 Centre 334220 Not Involved ASET Solar Bloomsburg PA 17815 Columbia Currently Involved

Industry Structure and Company Strategies of Major Domestic and Foreign Wind and Solar Energy Manufacturers: Opportunities for Supply Chain Development in Appalachia
121
ASP Services Inc Selinsgrove PA 17870-8889 Snyder 332312 Not Involved Auto Weld Chassis & Components Danville PA 17821-9300 Montour 811310 Not Involved Axion Power International New Castle PA 16105 Lawrence Unable to contact Battery Systems Inc Washington PA 15301 Washington Not Involved Benton Foundry Inc Benton PA 17814-7641 Columbia 331511 Currently Involved Berry Plastics Corp Berwick PA 18603-1127 Columbia 326160 Defunct Berwick Offray LLC Berwick PA 18603-0428 Columbia 326199 Not Involved Blatek Inc State College PA 16801-7548 Centre 334419 Not Involved Boyer Machine Northumberland PA 17857-1825 Northumberland 326199 Not Involved Buckell Plastic Co Inc Lewistown PA 17044-0272 Mifflin 326199 Not Involved C & C Welding & Fabricating Clarence PA 16829-0245 Centre 811310 Not Involved C M C Steel Fabricators Inc New Columbia PA 17856-9375 Union 332312 Not Involved Centrex Precision Plastics Inc. (Avail) Bellefonte PA 16823-8420 Centre 326199 Not Involved Charles Smith Machine Northumberland PA 17857-8748 Northumberland 326199 Not Involved Cherryridge Cabin Rentals (DBA Bergey Milesburg PA 16853 Centre 238220 Currently Involved Clinton Controls Inc Lock Haven PA 17745-1727 Clinton 335313 Defunct Coil Specialty Co Inc State College PA 16801-7543 Centre 334416 Not Involved Commercial Stainless Inc Bloomsburg PA 17815-2927 Columbia 332322 Not Involved Control Alt Energy Inc Auburn PA 17922 Schuylkill Currently Involved Cooper US Inc Shamokin PA 17872-0543 Northumberland 335931 Unable to contact Crystal Air Olyphant PA 18447 Lackawanna 238220 Currently Involved D E Associates Inc Shamokin PA 17872-0394 Northumberland 335312 Not Involved Delta Mechanical Inc Berwick PA 18603-4232 Columbia 332312 Not Involved Dg Power Systems LLC Lewistown PA 17044-7883 Mifflin 335312 Not Involved Donsco Inc Belleville PA 17004-0957 Mifflin 331511 Not Involved Dri Rod Co Inc Benton PA 17814-0518 Columbia 335999 Unable to contact Drohan Brick & Supply Inc Mount Joy PA 17552-0277 Lancaster 444190 Unable to contact Durametal Corp Muncy PA 17756-1202 Lycoming 336340 Not Involved Dynamic Surface Applications Muncy PA 17756-7869 Lycoming 332312 Not Involved Econopane Insulating Glass Co Burnham PA 17009-0248 Mifflin 327215 Not Involved Eickhoff Corporation Pittsburgh PA 15275-1002 Allegheny 423810 Involved, but outside the region EIT Corp Phoenix Sunbury PA 17801-0744 Northumberland 335999 Unable to contact Ellwood City Forge Ellwood City PA 16117 Lawrence 331511 Currently Involved Ek's Vinyl Structures Loganton PA 17747-9211 Clinton 326199 Not Involved EMA Inc. of PA/Motors & Controls Hazleton PA 18201-7365 Luzerne 333515 Not Involved

Industry Structure and Company Strategies of Major Domestic and Foreign Wind and Solar Energy Manufacturers: Opportunities for Supply Chain Development in Appalachia
122
Emerson Process Management Pittsburgh PA 15238-2918 Allegheny 334513 Currently Involved Envinity, Inc. State College PA 16801 Centre 236116 Currently Involved Fiberblade LLC (Gamesa) Ebensburg PA 15931-4122 Cambria 335312 Currently Involved Fitch Consulting Berwick PA 18603-5417 Columbia/Luzer 238220 Currently Involved Freedom Components Inc Lewistown PA 17044-7846 Mifflin 332710 Not Involved GE Inspection Technologies, LP Lewistown PA 17044-9312 Mifflin 334517 Currently Involved GE Transportation (GE Infrastructure) Erie PA 16531-0001 Erie 333612 Currently Involved George A Brockmann Berwick PA 18603-5802 Columbia 811219 Not Involved Gorilla Solar Company East Stroudsburg PA 18301 Monroe Defunct Heath F Hofmann State College PA 16801 Centre 335999 Unable to contact High Industries Inc Williamsport PA 17701-4106 Lycoming 332312 Not Involved Hodge Foundry Inc. Greenville PA 16125-9724 Mercer 331511 Currently Involved HVS Technologies Inc State College PA 16801-7555 Centre 334515 Unable to contact Hypernex Inc State College PA 16801 Centre 334413 Defunct I & Y Construction New Enterprise PA 16664 Bedford 236115 Not Involved Industrial Fabrications Inc Williamsport PA 17701-0094 Lycoming 332116 Not Involved Intuitive Control Systems LLC State College PA 16801-4756 Centre 335313 Not Involved Jarden Corp Reedsville PA 17084-8634 Mifflin 326199 Not Involved Jasper Steel Fabrication Inc Williamsport PA 17701-0605 Lycoming 332312 Not Involved Jaybird Manufacturing Inc State College PA 16801-7554 Centre 333412 Not Involved Jeff Hills Williamsport PA 17701-8846 Lycoming 332312 Unable to contact Joes Welding Repairs Milton PA 17847-8953 Northumberland 811310 Not Involved K.C. Larson Williamsport PA 17701-3807 Lycoming 238220 Currently Involved Keller Cft, Inc State College PA 16801-8600 Centre 332312 Defunct Kleerdex Co Bloomsburg PA 17815-8613 Columbia 325211 Not Involved Kurt J. Lesker Clairton PA 15025 Allegheny 333295 Currently Involved Kvaerner Willfab Inc Williamsport PA 17701-4119 Lycoming 332410 Defunct LECO Corp Bellefonte PA 16823-0390 Centre 337127 Not Involved Leep Inc Montoursville PA 17754-0365 Lycoming 326199 Not Involved Logue Industries Inc Montoursville PA 17754-2304 Lycoming 332710 Not Involved M & M Sheet Metal Inc Williamsport PA 17701-1422 Lycoming 332322 Not Involved Metimex Corp Reedsville PA 17084-8607 Mifflin 332312 Unable to contact Mr Spouting Port Matilda PA 16870-0492 Centre 326199 Not Involved New Castle Battery Manufacturing New Castle PA 16105 Lawrence Defunct Newspring Industrial Corp Mount Carmel PA 17851-1876 Northumberland 326199 Not Involved

Industry Structure and Company Strategies of Major Domestic and Foreign Wind and Solar Energy Manufacturers: Opportunities for Supply Chain Development in Appalachia
123
North Coast Energy Systems Erie PA 16504 Erie 444110 Currently Involved Ott Packagings Inc Selinsgrove PA 17870-1211 Snyder 322212 Not Involved Penn Forge & Fabricating Co State College PA 16804-0707 Centre 332312 Not Involved Penn-American Inc Muncy PA 17756-0240 Lycoming 332312 Not Involved Pennsylvania Aluminum Berwick PA 18603-4113 Columbia 332322 Not Involved Phoenix Associated Services Muncy PA 17756-1014 Lycoming 332312 Not Involved Plextronics, Inc. Pittsburgh PA 15238 Allegheny 325211 Currently Involved Polymics (Polymer Instrumentation State College PA 16803-1731 Centre 326199 Not Involved Poorman's Welding & Fabrication Aaronsburg PA 16820-9303 Centre 332312 Not Involved PPG Industries Harmarville PA 15238 Allegheny 325510 Currently Involved PPG Industries Cheswick PA 15024 Allegheny 325510 Not Involved PPG Industries Creighton PA 15030 Allegheny 325510 Not Involved PPG Industries Allison Park PA 15101 Allegheny 325510 Not Involved PPG Industries Springdale PA 15144 Allegheny 325510 Not Involved PPG Industries Meadville PA 16335 Crawford 325510 Not Involved PPG Industries Tipton PA 16684 Blair 325510 Not Involved Precise Technology Inc State College PA 16801-2751 Centre 326199 Not Involved Premier Automotive Mifflinburg PA 17844-7959 Union 335313 Not Involved Primus (formerly Abb Inc) Williamsport PA 17701-5578 Lycoming 334513 Not Involved R P's Machinery Sales Inc Jersey Shore PA 17740-0507 Lycoming 332312 Not Involved Radiant Steel Products Co Williamsport PA 17701-6017 Lycoming 332322 Not Involved Rado Enterprises Inc Bloomsburg PA 17815-8760 Columbia 238220 Currently Involved Raytheon Co. State College PA 16803-2214 Centre 334511 Not Involved RC Watt North Huntingdon PA 15642 Westmoreland Currently Involved Regency Plus Inc Mount Carmel PA 17851-1876 Northumberland 326199 Not Involved Reynolds Iron Works Inc Williamsport PA 17701-8518 Lycoming 332312 Not Involved Rick Bowmaster Construction Bellefonte PA 16823 Centre Not Involved RTD Embedded Technologies Inc. State College PA 16804-0906 Centre 334513 Not Involved Scaffs Enterprises Loganton PA 17747-0066 Clinton 114210 Not Involved Seeger & Hosband Assembly Svcs State College PA 16803-2214 Centre 334418 Unable to contact Selmax Corp Selinsgrove PA 17870-0149 Snyder 326199 Not Involved Sol TEC Innovations State College PA 16801-2612 Centre 326199 Not involved Solair Energy Ralston PA 17763 Lycoming 561110 Currently Involved Solar Power Industries Inc. Belle Vernon PA 15012-2958 Fayette 334413 Currently Involved Somerset Consolidated (Somerset and Somerset PA 15501 Somerset 331511 Not Involved

Industry Structure and Company Strategies of Major Domestic and Foreign Wind and Solar Energy Manufacturers: Opportunities for Supply Chain Development in Appalachia
124
Southern New Jersey Steel Inc. Bloomsburg PA 17815-1565 Columbia 332312 Not Involved Speerco LLC (DBA Batteries Plus) Pittsburgh PA 15234 Allegheny 453998 Currently Involved Springouse Energy Systems Inc Washington PA 15301 Washington Defunct Structure Manufacturing Work Danville PA 17821-1540 Montour 332312 Not Involved Sunspot Solar & Heating Delaware Water Gap PA 18327 Monroe 238220 Currently Involved Suntara Energy Pittsburgh PA 15229 Allegheny Defunct Tech Group Inc Montgomery PA 17752-9046 Lycoming 326199 Not Involved Tech Group Inc Williamsport PA 17701-0977 Lycoming 326199 Not Involved The Heat Shed, Inc. Revere PA 18953 Somerset 423620 Currently Involved The Right Way Solar Williamsburg PA 16693 Blair Defunct Thermal Product Solutions White Deer PA 17887-0150 Union 333994 Unable to contact U S Development Corp New Berlin PA 17855-0507 Union 326199 Not Involved Unipar Inc Reedsville PA 17084-9798 Mifflin 326199 Not Involved Valley Technologies Inc. State College PA 16801-7555 Centre 335999 Not Involved Victor Yordy Dewart PA 17730 Northumberland 332322 Not Involved Vox Energy Solutions, LLC Allison Park PA 15101 Allegheny 517919 Currently Involved W T Storey Inc Renovo PA 17764-1000 Clinton 335313 Unable to contact Walltalkers Muncy PA 17756-0182 Lycoming 326113 Not Involved West Pharmaceutical Services Jersey Shore PA 17740-1923 Lycoming 326199 Not Involved Whistler Enterprise Inc Watsontown PA 17777-9402 Northumberland 332322 Defunct William J. Koshinskie Milton PA 17847-1710 Northumberland 332322 Not Involved Williamsport Foundry Co Inc Williamsport PA 17701-5809 Lycoming 331511 Not Involved Yeager Wire Works Inc Berwick PA 18603-1418 Columbia 332322 Not Involved Wall Yodock Co Inc Bloomsburg PA 17815-2922 Columbia 332322 Defunct SOUTH CAROLINA Compact Solutions Greenville SC 29601-1914 Greenville 561499 Defunct GE Transportation-Aircraft Engines Greenville SC 39615-4614 Greenville 336412 Currently Involved Maier Design Works Westminster SC 29693-3333 Oconee 541330 Currently Involved Moventas Greenville SC 29615 Greenville 332710 Involved, but outside the region Radford Enterprises Marietta SC 29661 Greenville Unable to contact Renk AG Duncan SC 29334 Spartanburg 336350 Not Involved Solar Heating Specialists Blacksburg SC 29702-8366 Cherokee 444190 Currently Involved Sunstore Energy Solutions Greer SC 29650 Greenville Currently Involved

Industry Structure and Company Strategies of Major Domestic and Foreign Wind and Solar Energy Manufacturers: Opportunities for Supply Chain Development in Appalachia
125
TENNESSEE Accutech, LLC Clinton TN 37716-2510 Anderson 326199 Not Involved Advanced Drainage System Knoxville TN 37932-3207 Knox 326199 Not Involved Aerisyn, LLC Chattanooga TN 37408-1016 Hamilton 332312 Currently Involved AGC Flat Glass North America, inc. Kingsport TN 37662 Sullivan 327211 Currently Involved Alturdyne Bristol TN 37620-0928 Sullivan 333611 Not Involved B & B Fabricators Bristol TN 37620-9445 Sullivan 332312 Not Involved Barnhart Cranes and Rigging Oak Ridge TN 37830 Anderson Currently Involved Beverly Steel Inc. Knoxville TN 37918 Knox 332312 Not Involved Big Frog Mountain Chattanooga TN 37415-3522 Hamilton 423610 Currently Involved C & A Control Systems inc. Knoxville TN 37918-5817 Knox 335999 Not Involved Christian Metals, Inc. (DBA as Pierce Metals, Bristol TN 37620-4416 Sullivan 332322 Unable to contact DDM Plastics Knoxville TN 37917-7145 Knox 326199 Unable to contact Diversified Power International Piney Flats TN 37686-4468 Sullivan 335999 Currently Involved Earthlog Equity Group Talbott TN 37877-0685 Hamblin Defunct Eastman Chemical Kingsport TN 37660-5147 Sullivan 325211 Not Involved Edwards RW & Company Bluff City TN 37618-3267 Sullivan 326199 Not Involved Electro Motor, LLC Piney Flats TN 37686-4468 Sullivan 335312 Not Involved Energy Systems Knoxville TN 37914-6509 Knox 325211 Not Involved Enernex Corporation Knoxville TN 37922 Knox Currently Involved Fabricraft, Inc Bristol TN 37620-2365 Sullivan 332312 Not Involved Fibergrate Composite Structures Inc Piney Flats TN 37686-4416 Sullivan 326199 Defunct Fi-Shock, Inc. Knoxville TN 37914-6629 Knox 335999 Unable to contact Flash Technologies Franklin TN 37067 Franklin Currently Involved GKM Acquisitions, Inc Surgoinsville TN 37873-5130 Hawkins 327211 Not Involved Global Signal Kingsport TN 37660-3799 Sullivan 332312 Unable to contact Green Earth Services Knoxville TN 37950-0005 Knox Currently Involved Greenleaf industries Lenoir City TN 37771-3069 Loudon 326199 Not Involved Henard Metal Fabricators, Inc. Kingsport TN 37660-1183 Sullivan 332312 Not Involved Innovative Research Bristol TN 37620-4770 Sullivan 334515 Defunct Integra-Seal Industries, LLC Kingsport TN 37663-3226 Sullivan 326199 Not Involved Invenergy, LLC-Buffalo Mtn Energy Ctr Oliver Springs TN 37840 Anderson 335312 Currently Involved Jamieson Manufacturing Co Bluff City TN 37618-2637 Sullivan 326199 Not Involved Kaiser Panel Systems Piney Flats TN 37686-4422 Sullivan 326199 Not Involved Kinkead, Inc Bristol TN 37620-5431 Sullivan 332312 Not Involved

Industry Structure and Company Strategies of Major Domestic and Foreign Wind and Solar Energy Manufacturers: Opportunities for Supply Chain Development in Appalachia
126
MG Electric Kingsport TN 37660-7455 Sullivan 335999 Unable to contact National Solar Supply Tellico Plains TN 37385 Monroe Currently Involved Omega Plastics Corporation Clinton TN 37716-4129 Anderson 326199 Not Involved Pip's Iron Works Knoxville TN 37923-6201 Knox 332312 Not Involved Primester (see Eastman Chemical) Kingsport TN 37660-5555 Sullivan 325211 Not Involved Prostead Plastics, Inc. Knoxville TN 37931-3214 Knox 326199 Unable to contact Protokraft, LLC Kingsport TN 37660-1098 Sullivan 334413 Not Involved Quality Machine and Welding Co, Inc. Knoxville TN 37917-5929 Knox 332312 Unable to contact Quality Plastic Products, LLC Church Hill TN 37642-4506 Hawkins 326199 Not Involved Rotocast Plastic Products of TN, Inc. Knoxville TN 37914-6515 Knox 326199 Not Involved Signal Wind Energy Chattanooga TN 37421 Hamilton 236220 Currently Involved Superior Steel of TN, Inc. Knoxville TN 37914-6514 Knox 332312 Not Involved Techmer Pm, LLC Clinton TN 37716-4019 Anderson 325211 Currently Involved Tennessee Valley Aluminum Co Bristol TN 37620-8410 Sullivan 332322 Not Involved Tennessee Valley Infrastructure Group Chattanooga TN 37405 Hamilton 335312 Currently Involved Towe Iron Works, Inc. Knoxville TN 37921-6038 Knox 332312 Not Involved Tower Services Inc. Knoxville TN 37932-3306 Knox 332312 Unable to contact USI, Inc. Rockford TN 37853-3045 Blount 326199 Not Involved WB Service & Machine Kingsport TN 37660-4408 Sullivan 332322 Unable to contact Xtreme Tower Products Maryville TN 37801-3702 Blount 332312 Not Involved VIRGINIA Abingdon Steel, Inc Abingdon VA 24210-7609 Washington 332312 Currently Involved Adaptive I/O Technologies, Inc Blacksburg VA 24060-6702 Montgomery 334515 Unable to contact Aspen Motion Technologies Inc Radford VA 24141-3362 Independent 335312 Unable to contact Carolina Steel Corporation Bristol VA 24202-3709 Washington 332312 Not Involved De'cor Lighting & Electrical Co Pulaski VA 24301-3624 Pulaski 335999 Not Involved Electric Jet LLC Blacksburg VA 24060-6373 Montgomery 335999 Not Involved Green Brilliance Sterling VA 20165-3115 Loudoun 221119 Involved, but outside the region Hubbell Incorporated Christiansburg VA 24073-2502 Montgomery 335931 Not Involved Identification International, Inc. Blacksburg VA 24060-6644 Montgomery 335999 Not Involved Impact Plastics Incorporated Abingdon VA 24210 Washington 326199 Unable to contact Intermet New River Foundry Radford VA 24141-1684 Independent 331511 Not Involved JDS Uniphase Corporation Blacksburg VA 24060-5400 Montgomery 334313 Involved, but outside the region Kollmorgen Corporation (Danaher) Radford VA 24141-4026 Independent 335312 Unable to contact

Industry Structure and Company Strategies of Major Domestic and Foreign Wind and Solar Energy Manufacturers: Opportunities for Supply Chain Development in Appalachia
127
LMT Inc Glade Spring VA 24340-4845 Washington 332312 Unable to contact Luna Energy LLC - changed names Blacksburg VA 24060-6377 Montgomery 334413 Not Involved Lyon Roofing, Inc Radford VA 24141-8656 Independent 332322 Not Involved Mar-Bal, Inc. Dublin VA 24084-3509 Pulaski 326199 Unable to contact Mark Productions Blacksburg VA 24060-2538 Montgomery 325211 Not Involved Moog Inc. Blacksburg VA 24060-6620 Montgomery 334413 Currently Involved New River Radon Service Radford VA 24141-6940 Independent 334519 Not Involved Nippon Pulse America Radford VA 24141-5100 Independent 335312 Not Involved Nuvotronics Corporation Blacksburg VA 24060-6604 Montgomery 334413 Unable to contact Pixell Inc. Blacksburg VA 24060-9241 Montgomery 334413 Defunct Solar Connexion Blacksburg VA 24062-0095 Montgomery 221119 Currently Involved Strongwell Company Bristol VA 24201-3820 Washington 326199 Currently Involved Taylored Information Technologies, LLC Nickelsville VA 24271-3102 Scott 334413 Unable to contact Transecurity, LLC Blacksburg VA 24060-6164 Montgomery 334413 Not Involved Wolverine Advanced Materials, LLC Blacksburg VA 24060-6605 Montgomery 326199 Unable to contact WEST VIRGINIA Accurate Plastics Inc. Weirton WV 26062-5025 Hancock 325211 Not Involved Adell Polymers Inc. Petersburg WV 26847-1735 Grant 325991 Not Involved American Babbitt Bearing Inc. Huntington WV 25702 Wayne 332710 Not Involved Annette Riehle Lavalette WV 25535 Wayne 327211 Unable to contact Bayer Material Science LLC New Martinsville WV 26155 Wetzel 325188 Defunct Blenko Glass Company Inc Milton WV 25541 Cabell 327211 Not Involved Cabell Sheet Metal & Roofing, Inc Ceredo WV 25507 Wayne 332322 Not Involved CJ Products Inc Weston WV 26452-9580 Lewis 326199 Not Involved Concepts West Corporation Parkersburg WV 26104-9790 Wood 561910 Unable to contact Crouse Hinds Co Milton WV 25541-1270 Cabell 335999 Unable to contact Cytec Industries Inc Willow Island WV 26134-9732 Pleasants 325998 Unable to contact E.I. DuPont De Nemours and Co. Martinsburg WV 25404-6550 Berkeley 325211 Not Involved Engines Inc Milton WV 25541-1167 Cabell 332322 Not Involved Exide Technologies Charleston WV 25302-3531 Kanawha 335911 Not Involved Fairmont Specialty Services Inc. Fairmont WV 26554-9787 Marion 325211 Not Involved GEF Inc. Winfield WV 25213-9513 Putnam 326199 Not Involved HD Supply Waterworks Ltd Alum Creek WV 25003-9712 Kanawha 332996 Not Involved Huntington Steel Huntington WV 25714-1178 Wayne 423510 Currently Involved

Industry Structure and Company Strategies of Major Domestic and Foreign Wind and Solar Energy Manufacturers: Opportunities for Supply Chain Development in Appalachia
128
M & G Polymers USA, LLC Apple Grove WV 25502 Mason 325211 Defunct Maniar's Plastics Industry Inc Glen Dale WV 26038-1128 Marshall 325211 Not Involved Martin Steel Inc Huntington WV 25704-2342 Wayne 332312 Not Involved Occidental Chemical Corp. Belle WV 25015 Kanawha 325181 Not Involved Petrochemicals Holding US Inc Washington WV 26181 Wood 325211 Defunct Poke Inc Huntington WV 25701-9766 Wayne 332312 Unable to contact Polyplex, LLC South Charleston WV 25303 Kanawha 325211 Unable to contact Precision, LLC Sistersville WV 26175 Tyler 335999 Not Involved PWP Industries Mineral Wells WV 26150-8216 Wood 325211 Not Involved Randall Mers Huntington WV 25705-3725 Wayne 334515 Defunct Ravenswood Specialty Services, Inc. Ravenswood WV 26164 Jackson 326199 Unable to contact Sabic Innovative Plastics US LLC Washington WV 26181 Wood 325211 Not Involved Severstal Wheeling, Inc. Wheeling WV 26003 Ohio 331111 Not Involved Share Steel Inc Huntington WV 25704-9304 Wayne 332312 Not Involved SMC Electrical Products Inc Barboursville WV 25504 Cabell 335931 Currently Involved Soles Electric of Huntington Company, Inc. Huntington WV 25703-1137 Wayne 335312 Unable to contact Specialized Power Systems Inc. Huntington WV 25701 Cabell Not Involved Stockmeier Urethanes USA Inc Clarksburg WV 26301-9606 Harrison 325211 Not Involved Sun Selector Parkersburg WV 26101 Wood Defunct Sunoco Chemical Kenova WV 25530-1891 Wayne 325211 Unable to contact The Dow Chemical Company South Charleston WV 25303-1230 Kanawha 325211 Involved, but outside the region The Dow Chemical Company Hurricane WV 25526-1126 Putnam 325211 Unable to contact The Dow Chemical Company (Bayer Crop Institute WV 25112 Kanawha 325211 Not Involved Tower Logistics, LLC Huntington WV 25720-2086 Wayne 488999 Currently Involved Urethane Specialty & Supply Inc Beaver WV 25813 Raleigh 325211 Not Involved Note: Companies added to the study that were not part of the original group of 363 firms are indicated in boldface type.