Embed Size (px)
Citation preview

International Journal of Economics, Business and Finance
Vol. 2, No. 5, August 2014, pp. 1 - 19, ISSN: 2327 - 8188 (Online)
Available online at http://ijebf.com/
1
Research article
INDUSTRY SECTOR DETERMINANTS OF
DIVIDEND POLICY AND ITS EFFECT ON
SHARE PRICES IN GHANA
Boamah Kofi Baah
1,
Department of Accounting and Finance, Kwame Nkrumah University of Science and Technology.
E-mail: [email protected]
Richard Tawiah2,
Department of Mathematics, Kwame Nkrumah University of Science and Technology.
E-mail: [email protected]
Opoku Febiri Eric3,
Department of Accounting and Finance, Kwame Nkrumah University of Science and Technology.
E-mail: [email protected]
This work is licensed under a Creative Commons Attribution 4.0 International License.
____________________________________________________________________________________________________
Abstract
The Study was conducted to examine the industry sector determinants of dividend policy and its effect on share
prices of companies listed on the Ghana Stock Exchange for the period 2006-2011. Dividend policy is one of the
most debated issues in contemporary corporate finance. In Ghana, very few studies have been done on dividend
policy. The Study uses factors such as Price Volatility, Profit After-Tax, Earning Per Share, Size, Growth in
Assets, Return on Equity, and Liquidity as explanatory variables and the Dividend Payout as the dependent
variable. The study uses a sample of twelve companies (12) covering six different sectors of the economy. In
finding out the determinants of dividends policy, panel data regression is performed using the SPSS software.
The findings show that the main determinants of dividend policy for companies listed on Ghana Stock Exchange
are return on equity, profit after tax and size of the company. There are however, varying factors that influence
the dividend payout across the different sectors. Profit After-Tax happens to be a key variable that is

International Journal of Economics, Business and Finance
Vol. 2, No. 5, August 2014, pp. 1 - 19, ISSN: 2327 - 8188 (Online)
Available online at http://ijebf.com/
2
consistently considered by most sectors in paying their dividend. Most of the firms listed on the Ghana Stock
Exchange, however show statistically insignificant and weak relation between their Dividend Payout and Share
Price.
Copyright © IJEBF, all rights reserved.
Key words: Determinants, Dividend Policy, Share Price, Ghana Stock Exchange
___________________________________________________________________________
Introduction
Despite numerous years of theoretical and empirical research, issues on dividend policy still remain unresolved.
Dividend policy is one of the most debated issues in contemporary corporate finance. Dividend policy refers to
the trade- off between retaining earnings on one hand; and redistributing cash or issuing new shares to owners of
the company on the other hand. A dividend policy of a company is about deciding whether to pay or not to pay a
dividend. In paying a dividend, the board of directors mostly has to decide on whether to pay a large, small or
zero percentage of their earnings as dividends or to retain them for future investments (Amidu, 2007).
Dividends can only be paid when a company has enough cash to do so. Key factors such as profitability,
Liquidity, leverage, growth in asset, return on equity have been identified by several researchers as the
determinants of dividend policies of companies (Allen and Rachim (1996); Liu and Hu (2005), Amidu and Abor
(2006), Pani (2008), Ahmed and Javid (2009); Jecheche, (2012 )
In Ghana, very few studies have been done on dividend policy. Among them are Amidu and Abor (2006),
Enyan (2009), Marfo-Yiadom and Agyei (2011), and Adu-Boanyah, Ayentimi and Osei-Yaw (2013).
This study looks at the industry sector determinants of dividend policy and its effect on share prices of
companies listed on the Ghana Stock Exchange. The study is conducted with the aim of: Firstly to determine the
general factors considered by management in paying out dividends of companies listed on GSE. Secondly to
identify the specific factors that influence dividend policy of the different sectors of companies listed on the
GSE and finally to identify the relationships between dividend policy and Share Price of Companies Listed on
the GSE.
The study unfolds the main determinants of dividend policy in general and the varying factors that influence
dividend policy across the various sectors of the economy of Ghana. This study therefore seeks to fill the gap in
the literature.
The rest of the article is organized as follows. The next section reviews the relevant literature relating to the
subject matter of the Study. Section three discusses the methodology. Section four discusses the results. Finally,
section five focuses on the summary of findings, conclusion and recommendations of the paper.

International Journal of Economics, Business and Finance
Vol. 2, No. 5, August 2014, pp. 1 - 19, ISSN: 2327 - 8188 (Online)
Available online at http://ijebf.com/
3
2. Literature Review
Researchers on corporate dividend policy have over the years followed two divergent paths, Musa (2009)-the
behavioural and the normative approach. The behavioural approach includes works such as Baker, Farrelly and
Edelman (1985), Pruitt and Gitman (1991), and Baker and Powell (2000).
Baker, Farrelly and Edelman (1985) surveyed 318 New York Stock Exchange (NYSE) firms and established
that the major determinants of dividend payments are anticipated level of future earnings and pattern of past
dividends. Pruitt and Gitman (1991) enquired from financial managers of the 1000 largest U.S. firms and
reported that, current and past year‟ profits are important factors influencing dividend payments. They also
found that risk (year to year variability of earnings) also determine the firms‟ dividend policy. According to
Baker and Powell (2000), anticipated level of future earnings is the major determinant of dividend policy. This
is their conclusion from a survey of NYSE-listed firms. The above studies, following the behavioural approach
report that different managers at different times attach varying importance to the factors that influence a firm‟s
dividend decision. Certain factors such as level of current and past earnings and the pattern of variability of past
dividends, however, have emerged as consistently important over the years
Some researchers on the other hand followed the normative approach by developing and empirically testing
various mathematical models in order to explain the dividend policy of firms (Musa, 2009). Lintner (1956) was
the first researcher to develop and test the partial-adjustment model of dividend. His model suggests that a
change in dividends is a function of the target dividend payout less the last period‟s dividend payout multiplied
by the speed of an adjustment factor. Lintner found that the most important determinant of a company‟s
dividend policy was a major change in earnings “out of line” with existing dividend rates.
This study follows the normative approach like the works of Lintner (1956), Baskin (1989), and Amidu (2007).
The basic model of Lintner is modified to include some controllable variable. This approach has been similarly
used by Baskin (1989) and Adesola and Okwong (2009) in examining dividend policy and stock price
behaviour. This approach is far superior as the relationships among the variables are best presented and
analyzed.
Adesola and Okwong (2009) in his empirical study of dividend policy of quoted companies in Nigeria adopt the
Lintner‟s model as modified by Brittan between 1996 – 2000. The result provides strong support for the
explanatory or predictive power of Lintner‟s model. He found that the dividend policies of quoted companies in
Nigeria are significantly influenced by their earnings and previous year dividend and that because of the
reluctance to cut dividends, companies only partially adjust their dividends to changes in earnings.
Adelegan (2001) however asserts that Lintner‟s model does not perform quite creditably in explaining the
dividend behaviour of corporate firms. He pinpoints further that the factors that mainly influenced the dividend
policy of quoted firms are after tax earnings, economic policy changes, firm growth potentials and long term
debts.

International Journal of Economics, Business and Finance
Vol. 2, No. 5, August 2014, pp. 1 - 19, ISSN: 2327 - 8188 (Online)
Available online at http://ijebf.com/
4
Eriotis (2005) reports that firms distribute dividend each year according to their target payout ratio, which is
determined by distributed earnings and size of these firms.
In investigating the determinants of dividend policy of Tunisian stock Exchange, Naceur et. al (2006) found that
the high profitable firms with more stable earnings can manage the larger cash flows and because of this they
pay larger dividends
In related work in Pakistan by Ahmed and Javid (2009), they found that firms having high profitability with
stable earnings afford larger free cash flows and hence such firms pay out larger dividend. Again the firms with
larger investment opportunities can easily influence dividend policies and that investment opportunities happen
to be a key determinant of dividend payout policies.
A firm that has relatively stable earnings is therefore often able to predict approximately what its future earning
will be. Such a firm is more likely to pay a higher percentage of its earnings than the firm with fluctuating
earnings (Anil and Kapoor, 2008).
Marfo-Yiadom E. and Agyei S.K. (2011) reveals that the major determinants of dividend policy of banks are
profitability, leverage, changes in dividend, collateral capacity, growth and age.
Dividend policies may affect the share price of companies and therefore needs to be critically observed and
analyzed by all key stakeholders as it may affect the value of the firm and hence shareholders worth.
3. METHODOLOGY
This section covers the methods and materials of the study and takes into account the entire research design
which is the method adopted in the sampling technique, the nature and source of data and the method of data
collection and analysis
The study uses only secondary data obtained from the Ghana Stock Exchange (GSE) for six (6) year period
from the 2006 to 2011. This period (six years) is to enable a panel analysis of the data of the companies listed on
GSE. There are currently thirty-four (34) companies listed on the GSE. However, due to unavailability of data
for some companies the researcher used twelve (12) companies covering six different sectors as sample for the
study. This sample is approximately one- third of the population of companies listed on the Ghana Stock
Exchange (34 companies as at 4th
July 2013); hence, concrete and reliable conclusion can be made. The data
were derived from the annual reports of companies listed on GSE, and they consist of Balance sheet, Income
Statements, Financial ratios and other relevant pieces of information for all publicly quoted companies.
Dividend Payout Ratio is taken as the dependent variable which is calculated by dividing total dividends by total
earnings. Price Volatility, Earning per Share, Net Profit after Tax, Growth in Assets, Size, Return on Equity and
Liquidity are used as independent variables to study the determinants of dividends policy and its effect on share
prices.

International Journal of Economics, Business and Finance
Vol. 2, No. 5, August 2014, pp. 1 - 19, ISSN: 2327 - 8188 (Online)
Available online at http://ijebf.com/
5
Multiple panel regression is used to analyse the data in finding out the determinants of dividend policy of
companies listed on GSE and the relationship between the dividend policy and stock prices.
The following are the companies used for the study and their corresponding sectors:
Table 3.1: The companies used in the sample and their corresponding sectors
Company Sector
1. Ayrton Drug Manufacturing Ltd
2. Starwin Products Limited Pharmaceuticals
3. Cal Bank Limited
4. Ecobank Ghana Limited Banking and Finance
5. Enterprise Insurance
6. SIC Insurance Insurance
7. Mechanical Lloyd Co. Ltd
8. Ghana Oil Company Distribution
9. Guinness Ghana Breweries Ltd
10. Fanmilk Ltd Food and Beverages
11. Unilever Ghana Limited
12. Cocoa Processing Company Manufacturing
The Model
The model used in this study is the Ordinary Least Square (OLS) regression model as it is a suitable tool used in
getting useful findings. It involves regressing the dependent variable and independent variable. Fama and
French (1988); Afza and Mirza (2010) also used the Ordinary Least Square (OLS) regression in their studies to
explain the relationship between dividend policy and stock prices. The equation is
=
where
POR (Payout Ratio) = Total Dividend / Total Earnings
PV (Share Price Volatility) = √
PAT = Profit after Tax
EPS (Earning per Share) =
SZ (Size) = Natural logarithms (Ln) of Total Asset
Growth (Growth in Assets) = Company‟s equity / Total Assets.

International Journal of Economics, Business and Finance
Vol. 2, No. 5, August 2014, pp. 1 - 19, ISSN: 2327 - 8188 (Online)
Available online at http://ijebf.com/
6
ROE (Return on Equity) = Profit after Tax / shareholders‟ equity
LIQ (Liquidity) = Current Assets/ Current Liabilities
The subscript i represent the cross-sectional dimension, and the t represent the time-series dimension.
and the is the disturbance term
The dependent variable POR is Payout ratio and the independent variables PV is Price Volatility; PAT is Profit
after tax; EPS is earning per share; SZ is size of the firm; Growth as the proxy for growth opportunities, ROE is
the return on equity, and LIQ is liquidity which is represented by current asset ratio.
The table below shows the expected hypothesized sign of the variables used in these studies with the empirical
evidence.
Table 3.2: Variable, Hypothesized Sign and Empirical Evidence
Variable Hypothesized Sign Empirical Evidence
Payout Ratio Dependent Variable Amidu and Abor (2006), Anil and Kapoor (2008), and Marfo and
Agyei (2011).
Price Volatility Positive Allen and Rachim (1996), and Adesola and Okwong (2009)
Profit After Tax Positive Pani (2008), Adesola and Okwong (2009), Ahmed and Javid
(2009), Amidu and Abor (2006) .
Earnings per
Share
Positive Baskin (1989), Liu and Hu (2005), Adefila, Oladipo and Adeoti (2004),
and Adesola and Okwong (2009)
Return on
Equity
Positive Liu and Hu (2005)
Growth Negative Jecheche (2011), and Marfo-Yiadom and Agyei (2011)
Size Negative Ahmed and Javid (2009)
Liquidity Positive Amidu and Abor (2006), Enyan (2009) and Ahmed and Javid (2009)
International Journal of Economics, Business and Finance
Vol. 2, No. 5, August 2014, pp. 1 - 19, ISSN: 2327 - 8188 (Online)
Available online at http://ijebf.com/
7
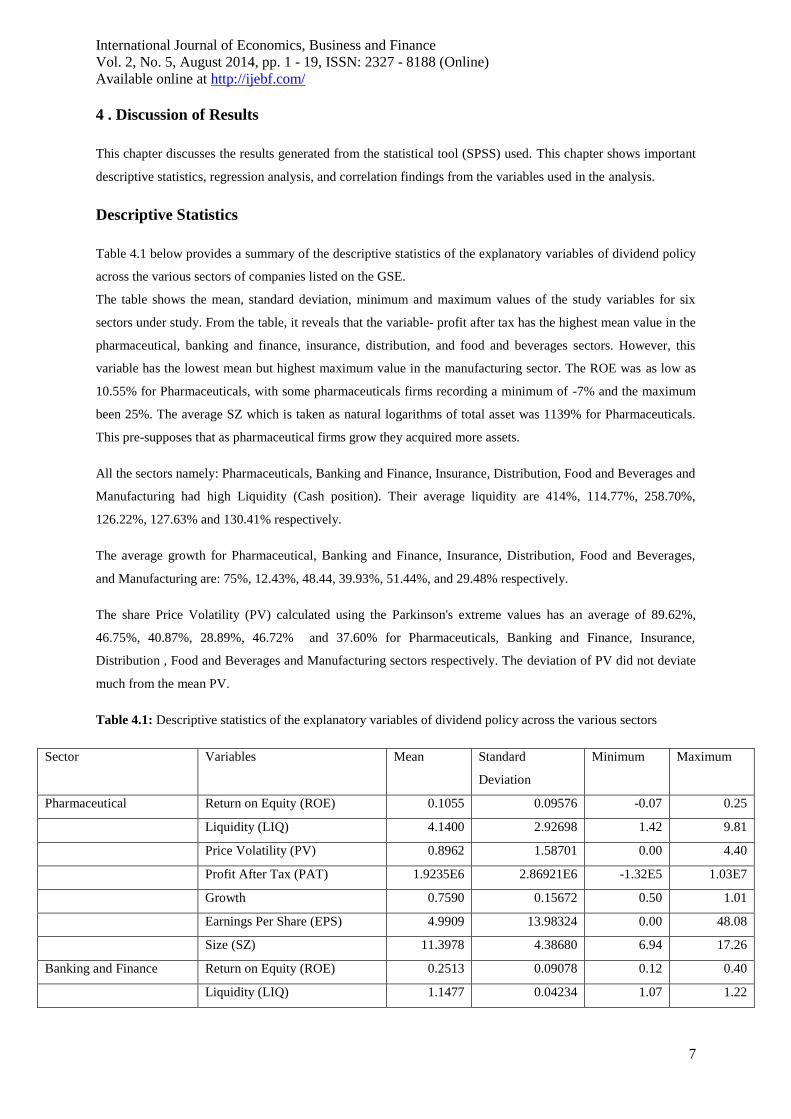
4 . Discussion of Results
This chapter discusses the results generated from the statistical tool (SPSS) used. This chapter shows important
descriptive statistics, regression analysis, and correlation findings from the variables used in the analysis.
Descriptive Statistics
Table 4.1 below provides a summary of the descriptive statistics of the explanatory variables of dividend policy
across the various sectors of companies listed on the GSE.
The table shows the mean, standard deviation, minimum and maximum values of the study variables for six
sectors under study. From the table, it reveals that the variable- profit after tax has the highest mean value in the
pharmaceutical, banking and finance, insurance, distribution, and food and beverages sectors. However, this
variable has the lowest mean but highest maximum value in the manufacturing sector. The ROE was as low as
10.55% for Pharmaceuticals, with some pharmaceuticals firms recording a minimum of -7% and the maximum
been 25%. The average SZ which is taken as natural logarithms of total asset was 1139% for Pharmaceuticals.
This pre-supposes that as pharmaceutical firms grow they acquired more assets.
All the sectors namely: Pharmaceuticals, Banking and Finance, Insurance, Distribution, Food and Beverages and
Manufacturing had high Liquidity (Cash position). Their average liquidity are 414%, 114.77%, 258.70%,
126.22%, 127.63% and 130.41% respectively.
The average growth for Pharmaceutical, Banking and Finance, Insurance, Distribution, Food and Beverages,
and Manufacturing are: 75%, 12.43%, 48.44, 39.93%, 51.44%, and 29.48% respectively.
The share Price Volatility (PV) calculated using the Parkinson's extreme values has an average of 89.62%,
46.75%, 40.87%, 28.89%, 46.72% and 37.60% for Pharmaceuticals, Banking and Finance, Insurance,
Distribution , Food and Beverages and Manufacturing sectors respectively. The deviation of PV did not deviate
much from the mean PV.
Table 4.1: Descriptive statistics of the explanatory variables of dividend policy across the various sectors
Sector Variables Mean Standard
Deviation
Minimum Maximum
Pharmaceutical Return on Equity (ROE) 0.1055 0.09576 -0.07 0.25
Liquidity (LIQ) 4.1400 2.92698 1.42 9.81
Price Volatility (PV) 0.8962 1.58701 0.00 4.40
Profit After Tax (PAT) 1.9235E6 2.86921E6 -1.32E5 1.03E7
Growth 0.7590 0.15672 0.50 1.01
Earnings Per Share (EPS) 4.9909 13.98324 0.00 48.08
Size (SZ) 11.3978 4.38680 6.94 17.26
Banking and Finance Return on Equity (ROE) 0.2513 0.09078 0.12 0.40
Liquidity (LIQ) 1.1477 0.04234 1.07 1.22
International Journal of Economics, Business and Finance
Vol. 2, No. 5, August 2014, pp. 1 - 19, ISSN: 2327 - 8188 (Online)
Available online at http://ijebf.com/
8
Price Volatility (PV) 0.4675 0.19704 0.17 0.82
Profit After Tax (PAT) 4.1962E4 45065.05268 5204.00 1.65E5
Growth 0.1243 0.02148 0.09 0.15
Earnings Per Share (EPS) 1.1047E2 300.56766 0.03 1025.00
Size (SZ) 13.7004 0.82731 12.37 15.25
Insurance Return on Equity (ROE) 0.1385 0.09754 0.04 0.37
Liquidity (LIQ) 2.5870 1.95690 1.02 6.35
Price Volatility (PV) 0.4087 0.27634 0.00 0.87
Profit After Tax (PAT) 6.8492E6 8.95764E6 2236.00 2.95E7
Growth 0.4844 0.16435 0.30 0.73
Earnings Per Share (EPS) 1.0859E2 254.77007 0.03 712.00
Size (SZ) 15.4124 4.03038 10.49 19.48
Distribution Return on Equity (ROE) 0.1546 0.05386 0.07 0.25
Leverage (LIQ) 1.2622 0.18933 1.05 1.54
Price Volatility (PV) 0.2889 0.28522 0.00 0.78
Profit After Tax (PAT) 3.6730E6 2.64557E6 34819.00 7.89E6
Growth 0.3993 0.12478 0.23 0.55
Earnings Per Share (EPS) 1.0684E2 325.69023 0.01 1131.96
Size (SZ) 17.5023 1.49970 13.28 18.87
Food and beverages Return on Equity (ROE) 0.2359 0.14996 -0.10 0.43
Liquidity (LIQ) 1.2763 0.74437 0.33 2.67
Price Volatility (PV) 0.4672 0.24217 0.13 0.90
Profit After Tax (PAT) 2.4332E4 40521.04560 533.00 1.50E5
Growth 0.5144 0.19594 0.22 0.76
Earnings Per Share (EPS) 2.1408E2 524.12774 0.00 1655.60
Size (SZ) 8.5866 4.02887 4.37 14.00
Manufacturing Return on Equity (ROE) -6.9421 23.25118 -80.69 0.46
Liquidity (LIQ) 1.3041 0.47230 0.48 2.18
Price Volatility (PV) 0.3760 0.43532 0.00 1.56
Profit After Tax (PAT) -4.4565E6 6.84149E6 -1.69E7 6.47E5
Growth 0.2948 0.17077 0.00 0.53
Earnings Per Share (EPS) 0.8882 2.63176 -0.02 9.23
Size (SZ) 15.0362 3.51597 11.47 19.13
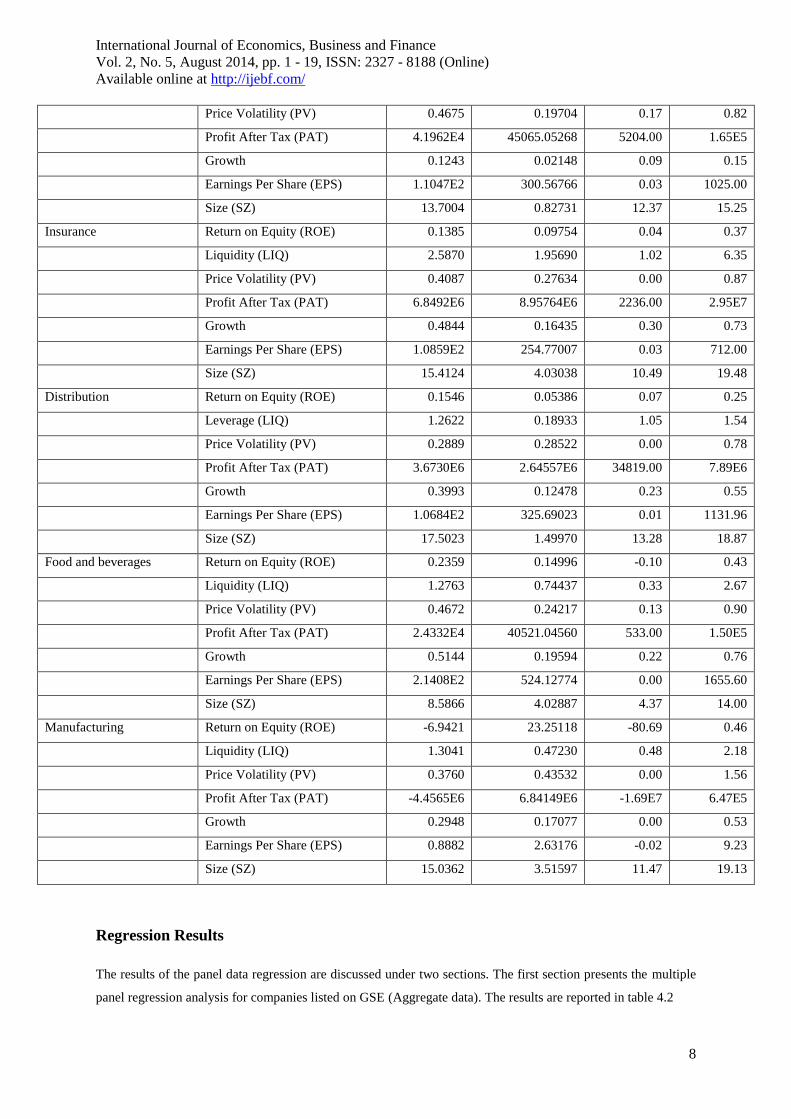
Regression Results
The results of the panel data regression are discussed under two sections. The first section presents the multiple
panel regression analysis for companies listed on GSE (Aggregate data). The results are reported in table 4.2
International Journal of Economics, Business and Finance
Vol. 2, No. 5, August 2014, pp. 1 - 19, ISSN: 2327 - 8188 (Online)
Available online at http://ijebf.com/
9
The second section shows the multiple panel regression analysis pertaining to the various sectors of companies
listed on GSE. The results are reported in Table 4.3 to 4.9
In both sections, the data shows the regression results between the dependent variable (Dividend Payout) and the
explanatory variables of the study. The multiple panel regression model has the following as independent
variables: return on equity, liquidity, price volatility, profit after-tax, growth in assets, earnings per share and
size and the dividend payout ratio as the dependent variable. The coefficients, standard errors, t-statistic and p-
values for the aforementioned independent variables as well as the multiple coefficient of determination (i.e. R-
square) are also clearly shown in the results.
Multiple panel regression analysis for companies listed on GSE
Table 4.2: Multiple panel regression result for companies listed on GSE
Model (R-Square=0.505) Coefficients Standard Error t-Statistic P-Value
Constant -3.839 2.460 -1.560 0.124
Return on Equity (ROE) -0.124 0.048 -2.548 0.013
Liquidity (LIQ) 0.428 0.365 1.171 0.246
Price Volatility (PV) 0.043 0.672 0.063 0.950
Profit After Tax (PAT) -4.300 0.000 -5.145 0.000
Growth -1.028 2.835 -0.363 0.718
Earnings Per Share (EPS) 0.001 0.002 0.708 0.482
Size (SZ) 0.406 0.126 3.209 0.002
From the table, the p-values indicate that return on equity, profit after tax and size of the company with
coefficients of -0.124, -4.300 and 0.406 respectively are statistically significant at 5% level. However,
the remaining variables are not significant. These suggest that main determinants of dividend policy for
companies listed on GSE are return on equity, profit after tax and size of the company. Therefore, the fitted
multiple panel regression model with the main determinants of dividend policy for companies listed on GSE is
given by Equation 4.2.
The above model suggests that a unit increase in return on equity and profit after tax decreases dividend payout
by 12.4% and 4.300 % respectively among companies listed on GSE. Also, every unit increase in the size
of company increases dividend ratio by 40.6%. With an R-square of 50.5%, the fitted model explained a
moderate proportion of dividend payout ratio. However, contrary to expectations and findings of Amidu and
Abor (2006), the study during the period under review shows profitability negatively affects the dividend
Payout. This could probable suggest that companies listed on GSE pays dividend even when profitability
decreases.

International Journal of Economics, Business and Finance
Vol. 2, No. 5, August 2014, pp. 1 - 19, ISSN: 2327 - 8188 (Online)
Available online at http://ijebf.com/
10
Multiple panel regression analysis of the various sectors of companies listed on GSE
Pharmaceutical Sector
Table 4.3: Multiple panel regression result for Pharmaceutical Sector
Model (R-Square=0.994) Coefficients Standard Error t-Statistic P-Value
Constant -0.419 0.154 -2.726 0.053
Return on Equity (ROE) 0.727 0.141 5.149 0.007
Liquidity (LIQ) 0.184 0.011 16.013 0.000
Price Volatility (PV) 0.112 0.009 12.885 0.000
Profit After Tax (PAT) -5.098E-7 0.000 -20.257 0.000
Growth 0.108 0.120 0.903 0.418
Earnings Per Share (EPS) 0.101 0.005 21.955 0.000
Size (SZ) 0.005 0.008 0.580 0.593
Table 4.3 above shows results of the multiple panel regression model for the pharmaceutical sector.
The constant term is -0.419; however, the p-value of 0.053 indicates that this term has no significant effect on
dividend payout ratio at 5% level of statistical significance. The variable growth in assets showed a positive
coefficient (0.108), but it is statistically not significant (p-value=0.418). Similarly, size of the company with a
positive coefficient of 0.005 is also not significant (p-value=0.593). However, return on equity, liquidity, price
volatility and earnings per share with coefficients of 0.727, 0.184, 0.112 and 0.101 and p-values of 0.007, 0.000,
0.000 and 0.000 respectively give an indication of positive significant association with dividend payout ratio at
5% level. Also, profit after tax with coefficient of -5.098 and p-value of 0.000 suggests a significant
negative association with dividend payout ratio. These suggest that the main determinants of dividend policy in
the pharmaceutical sector are return on equity, liquidity, price volatility, profit after tax and earnings per share.
Therefore, the fitted multiple panel regression model with the main determinants of dividend policy in the
pharmaceutical sector is given by Equation 4.3.
From Equation 4.3, the positive coefficient of 0.727 for return on equity suggests that a unit increase in return
on equity increases dividend payout ratio by 72.7%. Similarly, dividend payout increased by 18.4%, 11.2% and
10.1% for every unit increase in liquidity, price volatility and earnings per share respectively. However, the
negative coefficient of -5.098 for profit after tax imply that a unit increase in profit after tax decreases
dividend payout ratio slightly by 0.00005098%. Finally, with R-square of 99.4%, the fitted model explained a
sufficient proportion of dividend payout ratio.

International Journal of Economics, Business and Finance
Vol. 2, No. 5, August 2014, pp. 1 - 19, ISSN: 2327 - 8188 (Online)
Available online at http://ijebf.com/
11
Banking and Finance Sector
Table 4.4 : Multiple panel regression result for Banking and Finance Sector
Model (R-Square=0.969) Coefficients Standard Error t-Statistic P-Value
Constant -0.541 1.269 -0.426 0.692
Return on Equity (ROE) 1.731 0.839 2.062 0.108
Liquidity (LIQ) 0.818 0.867 0.943 0.399
Price Volatility (PV) 0.305 0.171 1.786 0.149
Profit After Tax (PAT) 6.883 0.000 3.063 0.038
Growth 2.897 2.542 1.140 0.318
Earnings Per Share (EPS) 0.016 0.005 3.200 0.023
Size (Sz) -0.078 0.068 -1.151 0.314
Table 4.4 above displays results of the multiple panel regression model for the banking and finance sector.
From Table 4.4, six of the independent variables, thus return on equity, liquidity, price volatility, profit after tax,
growth and earnings per share have positive coefficients whilst the constant term and the variable size have
negative coefficients. Among them only, profit after tax with coefficient of 6.883 and p-value of 0.038
and earnings per share with coefficient of 0.016 and p-value of 0.023 are statistically different from zero at 5%
level. These suggest that the key determinants of dividend policy in the banking and finance sector are profit
after tax and earnings per share. Therefore, the fitted multiple panel regression model with the key determinants
of dividend policy in the banking and finance sector is given by Equation 4.4.
From Equation 4.4, the positive coefficient of for profit after tax suggests that a unit increase in
profit after deduction of tax increases dividend payout ratio by % and dividend payout ratio
increase by 1.6% for every unit increase in earnings per share. Finally, with R-square of 96.9%, the fitted model
explained a sufficient proportion of dividend payout .
Insurance Sector
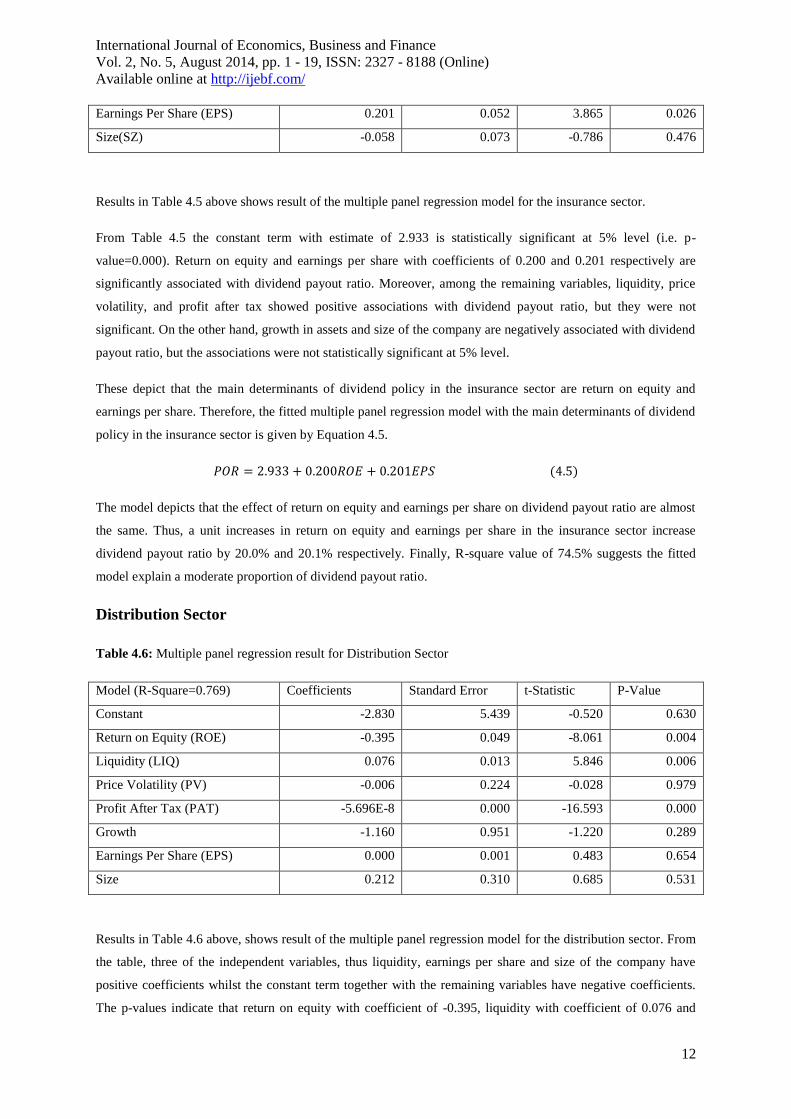
Table 4.5: Multiple panel regression result for Insurance Sector
Model (R-Square=0.745) Coefficients Standard Error t-Statistic P-Value
Constant 2.933 0.082 35.768 0.000
Return on Equity (ROE) 0.200 0.031 4.878 0.011
Liquidity (LIQ) 0.448 0.298 1.503 0.207
Price Volatility (PV) .093 0.305 0.306 0.775
Profit After Tax (PAT) 1.075 0.000 0.239 0.823
Growth -6.496 4.842 -1.342 0.251
International Journal of Economics, Business and Finance
Vol. 2, No. 5, August 2014, pp. 1 - 19, ISSN: 2327 - 8188 (Online)
Available online at http://ijebf.com/
12
Earnings Per Share (EPS) 0.201 0.052 3.865 0.026
Size(SZ) -0.058 0.073 -0.786 0.476
Results in Table 4.5 above shows result of the multiple panel regression model for the insurance sector.
From Table 4.5 the constant term with estimate of 2.933 is statistically significant at 5% level (i.e. p-
value=0.000). Return on equity and earnings per share with coefficients of 0.200 and 0.201 respectively are
significantly associated with dividend payout ratio. Moreover, among the remaining variables, liquidity, price
volatility, and profit after tax showed positive associations with dividend payout ratio, but they were not
significant. On the other hand, growth in assets and size of the company are negatively associated with dividend
payout ratio, but the associations were not statistically significant at 5% level.
These depict that the main determinants of dividend policy in the insurance sector are return on equity and
earnings per share. Therefore, the fitted multiple panel regression model with the main determinants of dividend
policy in the insurance sector is given by Equation 4.5.
The model depicts that the effect of return on equity and earnings per share on dividend payout ratio are almost
the same. Thus, a unit increases in return on equity and earnings per share in the insurance sector increase
dividend payout ratio by 20.0% and 20.1% respectively. Finally, R-square value of 74.5% suggests the fitted
model explain a moderate proportion of dividend payout ratio.
Distribution Sector
Table 4.6: Multiple panel regression result for Distribution Sector
Model (R-Square=0.769) Coefficients Standard Error t-Statistic P-Value
Constant -2.830 5.439 -0.520 0.630
Return on Equity (ROE) -0.395 0.049 -8.061 0.004
Liquidity (LIQ) 0.076 0.013 5.846 0.006
Price Volatility (PV) -0.006 0.224 -0.028 0.979
Profit After Tax (PAT) -5.696E-8 0.000 -16.593 0.000
Growth -1.160 0.951 -1.220 0.289
Earnings Per Share (EPS) 0.000 0.001 0.483 0.654
Size 0.212 0.310 0.685 0.531
Results in Table 4.6 above, shows result of the multiple panel regression model for the distribution sector. From
the table, three of the independent variables, thus liquidity, earnings per share and size of the company have
positive coefficients whilst the constant term together with the remaining variables have negative coefficients.
The p-values indicate that return on equity with coefficient of -0.395, liquidity with coefficient of 0.076 and

International Journal of Economics, Business and Finance
Vol. 2, No. 5, August 2014, pp. 1 - 19, ISSN: 2327 - 8188 (Online)
Available online at http://ijebf.com/
13
profit after tax with coefficient of -5.696 are statistically significant at 5% level. These suggest that the
key determinants of dividend policy in the distribution sector are return on equity, liquidity and profit after tax.
Therefore, the fitted multiple panel regression model with the key determinants of dividend policy in the
distribution sector is given by Equation 4.6.
The above model depicts that, every unit increase in return on equity and profit after tax decreases dividend
payout ratio by 39.5% and respectively. Also a unit increase in liquidity increases dividend
payout ratio by 7.6%. With R-square of 76.9%, the fitted model explained a moderate proportion of dividend
payout ratio.
Food and Beverages Sector
Table 4.7: Multiple panel regression result for Food and Beverages Sector
Model (R-Square=0.904) Coefficients Standard Error t-Statistic P-Value
Constant -2.028 2.544 -0.797 0.470
Return on Equity (ROE) 9.104 3.034 3.001 0.040
Liquidity (LIQ) 0.459 1.212 0.379 0.724
Price Volatility (PV) -2.128 1.715 -1.240 0.283
Profit After Tax (PAT) -1.109 0.000 -2.521 0.049
Growth -1.752 5.742 -0.305 0.776
Earnings Per Share (EPS) 0.000 0.000 -0.266 0.803
Size 0.186 0.132 1.413 0.231
Results in Table 4.7 above shows result of the multiple panel regression model for the food and beverages
sector.
The p-values indicate that return on equity with coefficient of 9.104 and profit after tax with coefficient of -
1.109 are statistically significant at 5% level. These suggest that the major determinants of dividend
policy in the food and beverages sector are return on equity and profit after tax. Therefore, the fitted multiple
panel regression model with the major determinants of dividend policy in the food and beverages sector is given
by Equation 4.7.
The results suggest that, return on equity has a strong effect. Thus, every unit increase in return on equity
increases dividend payout ratio by 910.4%. However, every unit increase in profit after tax decreases dividend
payout ratio by 1.109 %. With R-square of 90.4%, the fitted model explained an adequate proportion of
dividend payout ratio.

International Journal of Economics, Business and Finance
Vol. 2, No. 5, August 2014, pp. 1 - 19, ISSN: 2327 - 8188 (Online)
Available online at http://ijebf.com/
14
Manufacturing Sector
Table 4.8: Multiple panel regression result for Manufacturing Sector
Model (R-Square=0.904) Coefficients Standard Error t-Statistic P-Value
Constant -8.398 22.033 -0.381 0.722
Return on Equity (ROE) 0.037 0.087 0.423 0.694
Liquidity (LIQ) 4.535 0.209 21.699 0.000
Price Volatility (PV) -2.153 4.668 -0.461 0.669
Profit After Tax (PAT) 5.128E-8 0.000 3.997 0.046
Growth -29.203 35.052 -0.833 0.452
Earnings Per Share (EPS) -0.985 0.222 -4.437 0.044
Size 1.487 1.139 1.306 0.262
Results in Table 4.8 above shows result of the multiple panel regression model for the manufacturing sector.
The p-values in table indicate that, liquidity with coefficient of 4.535, profit after tax with coefficient of
5.128 and earnings per share with coefficient of -0985 are statistically significant at 5% level. These
suggest, in the manufacturing sector liquidity, profit after tax and earnings per share are the main determinants
of dividend policy. Therefore, the fitted multiple panel regression model with the main determinants of dividend
policy in the manufacturing sector is given by Equation 4.8.
From the above model, every unit increase in liquidity and profit after tax increases dividend payout ratio by
453.5% and 5.128 % respectively. However, every unit increase in earnings per share decreases dividend
payout ratio by 98.5%. With R-square of 90.4%, the fitted model explained an adequate proportion of dividend
payout ratio.
4.3 Correlation of the explanatory Variables of Dividend Policy
Table 4.9: Pearson‟s Correlation matrix of the explanatory variables of dividend policy for companies listed on
GSE
ROE LIQ PV PAT GROWTH EPS SZ
ROE 1
LIQ 0.080
(0.502) 1
PV 0.015
(0.903)
0.379**
(0.001) 1
PAT 0.299
*
0.011
0.077
(0.521)
-0.072
(0.548) 1

International Journal of Economics, Business and Finance
Vol. 2, No. 5, August 2014, pp. 1 - 19, ISSN: 2327 - 8188 (Online)
Available online at http://ijebf.com/
15
Growth 0.219
(0.064)
0.714**
(0.000)
0.240*
(0.042)
0.254*
(0.032) 1
EPS 0.041
(0.731)
-0.117
(0.327)
-0.147
(0.318)
0.191
(0.108)
-0.032
(0.792) 1
SZ -0.164
(0.170)
-0.488**
(0.000)
-0.264*
(0.025)
0.040
(0.738)
-0.544**
(0.000)
-0.081
(0.499) 1
Table 4.9 shows the Pearson‟s correlation matrix of the dividend policy variables. From the table the strongest
association which is 0.714 appears to be statistically significant (i.e. p-value=0.000). This association exists
between liquidity and growth. Also, there exist a moderate negative association between growth and size.
Besides, other associations are significant but not strong.
5. SUMMARY, FINDINGS AND RECOMMENDATION
The Chapter presents a summary of the research findings, conclusions and recommendations.
Summary of findings
The research is conducted to find the determinants of dividend policy and its effect on share prices in Ghana.
The research is therefore conducted with the following aims:
Firstly to determine the general factors considered by management in paying out dividends of companies listed
on GSE. Secondly to identify the specific factors that influence dividend policy of the different sectors of
companies listed on the GSE and finally to identify the relationships between dividend policy and Share Price
of Companies Listed on the GSE
This chapter provides a summary of the findings and recommendations and conclusions. The findings have been
derived from analysis performed using the SPSS. The data used were derived from the annual report of listed
firms for the period 2006-2011.
General factors considered by management in paying out dividends.
The independent variables used in determining the general factors management consider in paying dividend are
the Price Volatility, Profit after Tax, Earning Per Share, Return on Equity, Size , Growth and Liquidity.
The panel regression analysis reveals that main determinants of dividend policy for companies listed on GSE are
return on equity, profit after tax and size of the company. From the Regression analysis, the p-values indicate
that return on equity, profit after tax and size of the company are statistically significant at 5% level. This
confirms work by several authors which concludes return on equity, profitability and size are factors considered
in paying out dividend. Such works include Marfo-Yiadom and Agyei (2011).
International Journal of Economics, Business and Finance
Vol. 2, No. 5, August 2014, pp. 1 - 19, ISSN: 2327 - 8188 (Online)
Available online at http://ijebf.com/
16
Specific factors that influence dividend policy of the different sectors of companies listed
on the GSE
The following are findings pertaining to the specific factors that influence dividend payout across the various
sectors.
This paper reveals that the specific factors that influence dividend payout of the banking and finance sector are:
profit after tax and earnings per share. Marfo and Agyei (2011) found a statistically significant association
between profitability and dividend payout of banks in Ghana for the period 1999-2003.
In addition to the factors considered by the banking sector: profit after tax and earning per share, the
manufacturing sector further considers liquidity in the determination of its dividend policy. The main
determinants of dividend policy of manufacturing sector are profit after tax, earning per share and liquidity.
Earnings per share was found to be one of the key determinants of dividend policy of manufacturing firms in
Ghana by Enyan (2009) in the period 2000 -2005.
This paper suggests that the main determinants of dividend policy in the pharmaceutical sector are return on
equity, liquidity, price volatility, profit after- tax and earnings per share. This augment that in addition to all the
factors considered by the manufacturing sector, the pharmaceutical sector further considers return on equity, and
price volatility in the determination of its dividend policy. These are the variables that show a significant
association with dividend payout.
The main determinants of dividend policy in the food and beverages sector however are return on equity and
profit after tax.
Similarly, the findings reveal that the key determinants of dividend policy in the distribution sector are return on
equity, profit after tax and liquidity.
The findings again reveal that the major determinants of dividend policy of insurance sector are return on equity
and earning per share.
The relationships between Dividend Policy and Share Price of Companies Listed on the
GSE
The findings from the panel data regression analysis for companies listed on the GSE shows a positive
relationship between dividend payout and Share Price (Price Volatility) although it is not significant. The
findings pertaining to the specific sectors however reveal varying results. The following sectors: Banking and
Finance, and Insurance show a weak positive relationship between dividend payout and share price. This is
however not statistically significant. Sectors such as Distribution, Food and Beverages and Manufacturing on
the other hand show a negative relationship between Dividend payout and share price. This is also not
significant. It is only the pharmaceutical sector that shows a positive significant relation between dividend

International Journal of Economics, Business and Finance
Vol. 2, No. 5, August 2014, pp. 1 - 19, ISSN: 2327 - 8188 (Online)
Available online at http://ijebf.com/
17
policy and Share Price. It can therefore be said that most of the firms listed on the Ghana Stock Exchange show
statistically insignificant and weak relation between their Dividend Payout and Share Price.
Conclusion
This study is conducted to determine the industry sector determinants of dividend policy and its effect on share
price of companies listed on the GSE. Panel data is constructed from the annual reports of companies on GSE
for the period 2006-2011. Panel data regression using the statistical tool-SPSS, is used in analyzing the
aggregate data of companies listed on the GSE and the data corresponding to specific sectors of the companies
listed on the GSE.
The study reveals that the main determinants of dividend policies of companies listed on the GSE are return on
equity, profit after tax and size of the company. There are however different factors that influence the dividend
payout across the various sectors. Profit After-Tax happens to be a key variable that is considered by most
sectors in paying their dividend. Thus Profitability is a key determinant of dividend policy of companies across
the various sectors on the GSE.
Recommendations
From the findings of this study, the researcher makes the following recommendations:
Listed companies in paying dividend must not only consider the general factors that affect dividend policy of
companies in Ghana but also consider the specific sector they find themselves in order to reap the expected
effects that accompanies dividend policy (payout).
Future studies should look at the determinants of dividend policy of unlisted companies in Ghana. This would
highlight whether or not the factors considered by listed companies in paying dividends is consistent with
unlisted companies.
References
[1] Adefila, J.J., Oladipo, J.A., and Adeoti, J. O. (2004). The Effect of Dividend Policy on the Market Price of
Shares in Nigeria: Case Study of Fifteen Quoted Companies. International Journal of Accounting. University of
Ado-Ekiti, 2 (1).
[2] Adelegan, O. (2001). The Impact of Growth Prospect, leverage and firm size on dividend behaviour of
corporate firms in Nigeria. Available: http://www.csae.ox.ac.uk/conferences/2000-oia/pdfpapers/adelegan.pdf.
Accessed on February 05, 2013.
[3] Adesola, W. A., and Okwong, A. E. (2009). An Empirical Study of Dividend Policy of Quoted Companies
in Nigeria. Global Journal of Social Sciences, 8 (1), 85-101.
[4] Adu-Boanyah, E., Ayentimi, D.T., and Osei-Yaw, F. (2013). Determinants of dividend payout policy of
some selected manufacturing firms listed on the Ghana Stock Exchange, Research Journal of Finance and
Accounting, Vol. 4, No. 5.

International Journal of Economics, Business and Finance
Vol. 2, No. 5, August 2014, pp. 1 - 19, ISSN: 2327 - 8188 (Online)
Available online at http://ijebf.com/
18
[5] Afza, T., and Mirza, H. H. (2010). Ownership Structure and Cash Flows As Determinants of Corporate.
International Business Research, 3 (3), 210-221.
[6] Agyei, S.K., and Marfo-Yiadom E. (2011). “Dividend Policy and Bank Performance in Ghana, International
Journal of Economics and Finance, Vol 3, No 4
[7] Ahmed, A., and Javid, A.Y (2009). “Determinants of Dividend Policy in Pakistan”, International Journal of
Finance and Economics, 29.
[8] Allen, D. E., and Rachim, V. S. (1996). Dividend Policy and Stock Price Volatility: Australian Evidence.
Applied Financial Economics, 6 (2), 175-188.
[9] Amidu, M., and Abor, J. (2006), “Determinants of dividend payout ratios in Ghana”, The Journal of Risk
Finance, Vol. 7, 136-145
[10] Amidu, M. (2007). „How Does Dividend Policy Affect Performance of the Firm on Ghana Stock
Exchange‟ Investment Management and Financial Innovations, Vol 4, no. 2, p 103-111
[11] Anil, K., and Kapoor, S. (2008). “Determinants of Dividend Payout Ratios: A study of Indian Information
Technology Sector”, International Research Journal of Finance and Economics, 15.
[12] Annual report Ghana. Financials for companies listed on the GSE. Available: http: //www.ann
ualreportsghana.com/Services/Reports.aspx. Accessed on April 15, 2013.
[13] Baker H.K., Farelly G.E., and Edelman, R.B.(1985) “ A Survey of Management views on Dividend
Policy”, Journal of Financial Management, 14(3): 196.
[14] Baker, H. K., and Powell, G. E. (2000). Determinants of corporate dividend policy: a survey of NYSE
firms. Finance Practical Education; 9: 29-40.
[15] Banking Act, 2004 (Act 673)
[16] Baskin, J. (1989). “Dividend Policy and the Volatility of Common Stock”, Journal of Portfolio
Management, 3 (15), 19-25.
[17] Brittain, J. A.( 1964). “The Tax Structure and Corporate Dividend Policy”. Economic Review, (May), pp.
272-287.
[18] Enyan, K.E (2009), Determinants of Dividend Payout Ratio of firms Listed on the
GhanaStockExchange.Available:http://ir.ucc.edu.gh/dspace/bitstream/123456789/1071/1/ENYAN%202009.pdf
. Accessed on July 25, 2013.
[19] Eriotis N. (2005). “The effect of Distributed Earnings and Size of the firm to its Dividend Policy: Some
Greek Data, International Business and Economics Journal, Vol 4, No.1.

International Journal of Economics, Business and Finance
Vol. 2, No. 5, August 2014, pp. 1 - 19, ISSN: 2327 - 8188 (Online)
Available online at http://ijebf.com/
19
[20] Fama, E., & French, K. (1988). Dividend Yields and Expected Stock Returns. Journal of Financial
Economics (22), 3-25.
[21] Ghana Stock Exchange Fact Book (2010)
[22] Jecheche, P (2012). “Dividend Policy and Stock price Volatility: a case of the Zimbabwe Stock Exchange,
Journal of Case Research in Business and Economics. Vol 11.
[23] Lasher, W. (2000). Practical Financial Management, 2nd edition, Thomson South-Western.
[24] Lintner, J. (1956). Distribution of Incomes of Corporations Among Dividends, Retained Earnings, and
Taxes. American Economic Review (46), 97-113
[25] Liu, S., and Hu, Y. (2005). “Empirical Analysis of Cash Dividend Payment in Chinese Listed Companies”,
Nature and Science, 1 (3), 65-70.
[26] Marfo-Yiadom, E., and Agyei, S. (2011). “Determinants of Dividend Policy of Banks in Ghana,
International Research Journal of Finance and Economics, Issue No 61.
[27] Musa, I.F. (2009). The dividend Policy of firms quoted on the Nigerian Stock Exchange: An Empirical
Analysis, African Journal of Business Management, Vol 3, Issue No. 10, pp.555-566
[28] Naceur, B. S., Goaied M., and Belanies, A. (2006). “ On the Determinants and Dynamics of dividend
policy”, International Review of Finance, Vol. 6, pp. 1-23.
[29] Pani, U. (2008). Dividend Policy and Stock Price Behaviour in Indian Corporate Sector: A panel data
approach,Available:http://ssrn.com/abstract=1216171
[30] Pruitt, S.W., and Gitman, L.J. (1991). “The Interactions between the Investment, Financing and Dividend
Decisions of Major U.S. Firms,” Financial Review. 26 (3).


![What Are The Determinants Of Dividend Policy? The Case Of ......What Are The Determinants Of Dividend Policy? The Case Of The Japanese Electrical Appliances Industry ... (MM) [1] proved](https://img.dokumen.tips/doc/110x75/5e6f949305b6155c6c0fa6ae/what-are-the-determinants-of-dividend-policy-the-case-of-what-are-the-determinants.jpg)