Embed Size (px)
Citation preview

RHP Final Wealth Management Industry Research Report 2021
Page 1 of 98
Industry Research Report
On
WEALTH MANAGEMENT
By
October 2021
A Division of CARE Advisory Research and Training Limited.
A-1102/1103, 11th Floor, Kanakia Wall Street, Chakala, Andheri - Kurla Rd,
Andheri East, Mumbai- 400093
Contact No. 022 – 6837 4462/ E-mail: [email protected]

RHP Final Wealth Management Industry Research Report 2021
Page 2 of 98
DISCLAIMER
This report is prepared by CARE Advisory, division of CARE Advisory Research and Training
Limited (CART). CARE Advisory has taken utmost care to ensure accuracy and objectivity
while developing this report based on information available in public domain. However,
neither the accuracy nor completeness of information contained in this report is
guaranteed. CARE Advisory operates independently of CARE ratings Limited and this report
does not contain any confidential information obtained by ratings division, which they may
have obtained in the regular course of operations. The opinion expressed in this report
cannot be compared to the rating assigned to the company within this industry by the
ratings division. The opinion expressed is also not a recommendation to buy, sell or hold an
instrument.
CARE Advisory is not responsible for any errors or omissions in analysis/inferences/views or
for results obtained from the use of information contained in this report and especially
states that CARE (including all divisions) has no financial liability whatsoever to the user of
this product. This report is for the information of the intended recipients only and no part of
this report may be published or reproduced in any form or manner without prior written
permission of CARE Advisory.

RHP Final Wealth Management Industry Research Report 2021
Page 3 of 98
List of Abbreviation
Abbreviations Full Form
AAUM Average Assets under Management
AMCs Asset management companies
AOP Association Of Persons
APAC Asia-Pacific
ARN Amfi Registration Number
AUM Assets under Management
BCG Boston Consulting Group
Bn. Billion
BOI Body Of Individuals
CAGR Compounded Annual Growth Rate
Cr. Crore
CART CARE Advisory Research & Training Limited
CSO Central Statistics Organization
ELSS Equity Linked Savings Scheme
EMEA Europe, Middle East, and Africa
ETFs Exchange Traded Funds
EUIN Employee Unique Identity Number
FDI Foreign Direct Investment
FIIs Foreign institutional investors
FY Financial Year
G SEC Government Security
GDP Gross Domestic Product
GST Goods and Services Tax
HUF Hindu Undivided Family
IFAs Independent financial advisors
IIA India Industries Association
IMF International Monetary Fund
IT Income-Tax
LIC Life Insurance Corporation of India
Mn. Million
MOSPI Ministry Of Statistics And Programme Implementation
MT Metric Tonnes
PFCE Private Final Consumption Expenditure
PMJDY Pradhan Mantri Jan-Dhan Yojana
PMJJBY Pradhan Mantri Jeevan Jyoti Bima Yojana
PMS Portfolio Management Services
PMSBY Pradhan Mantri Suraksha Bima Yojana

RHP Final Wealth Management Industry Research Report 2021
Page 4 of 98
PP MLD Principal Protected Market Linked Debentures
PPP Public Private Partnership
PPP Purchasing Power Parity
PSU Public Sector Undertaking
QAAUM Quarterly Average Assets Under Management
QIP Qualified Institutional Placement
RBI Reserve Bank of India
RBI Reserve Bank Of India
RERA Real Estate Regulatory Authority
SEBI Securities and Exchange Board of India
SME Small And Medium-Sized Enterprises
SRO Self-regulatory organization
UHNH Ultra-High Networth Households
UHNI Ultra-High Net-Worth Individual
UTI Unit Trust of India
WEO World Economic Outlook
WMS Wealth management services
YoY Year on Year

RHP Final Wealth Management Industry Research Report 2021
Page 5 of 98
TABLE OF CONTENTS
EXECUTIVE SUMMARY ............................................................................................................................................6
ECONOMIC OUTLOOK .............................................................................................................................................8
INDIAN CAPITAL MARKET OUTLOOK .................................................................................................................... 15
INDIAN WEALTH MANAGEMENT INDUSTRY OVERVIEW ..................................................................................... 17
KEY GROWTH DRIVERS ......................................................................................................................................... 21
EVOLUTION OF DIGITAL WEALTH MANAGEMENT ............................................................................................... 38
KEY INDUSTRY PLAYER OVERVIEW ....................................................................................................................... 42
OUTLOOK FOR WEALTH MANAGEMENT INDUSTRY IN INDIA ............................................................................. 50
PRODUCT OVERVIEW ........................................................................................................................................... 65
WEALTH MANAGEMENT INDUSTRY IN INDIA ...................................................................................................... 68
CLASSIFICATION & CHARACTERISTICS OF ULTRA HNI & HNI ............................................................................... 86
GLOBAL OVERVIEW .............................................................................................................................................. 89
OUTLOOK FOR WEALTH MANAGEMENT INDUSTRY IN INDIA-OVERALL ............................................................. 94

RHP Final Wealth Management Industry Research Report 2021
Page 6 of 98
EXECUTIVE SUMMARY
CARE Ratings estimated India’s GDP growth rate at 9.2% for the FY2022. India’s growth
outlook has improved significantly and the COVID-19 vaccination drive will help the economic
rebound.
Nearly 890 million COVID-19 vaccine doses have so far been administered in the country till
30th September 2021. According to the ministry’s data, a total of 650 million first doses and
240 million second doses of the vaccine have been administered across the country
More than 50% of the Indian population is under 25 years of age and this is the largest and
fastest-growing adult segment across the globe which represents a great opportunity for the
wealth management industry. Favourable demographics, rising income levels and a
burgeoning affluent middle class provides a strong customer base for wealth management
sector.
Total number of accounts (or folios as per mutual fund parlance) as on June 30, 2021 stood at
102.6 million, while the number of folios under Equity, ELSS and Balanced schemes, wherein
the maximum investment is from retail segment stood at 92.8 million.
Number of millionaires in 2020 and 2025 (Selected countries)
Country Number (thousand) Change CAGR
2020 2025 (%) %
India 698 1,269 82% 12.70%
World 56,084 84,014 49% 8.42%
The number of Millionaires in India are expected to almost double at CAGR of 12.70% by
CY25, most of the increase will be driven by young Indians getting wealthier.
Investors in India are increasingly changing investment behavior from physical savings e.g.
real estate and gold towards financial assets such as equity, bonds and alternate investments
that has higher potential for wealth creation. Lower expected returns on physical assets have
been one of the major factors for shift in investments preference of investors towards
financial products and have increased post demonetization.
Even the reduction in bank deposit rates in the past year has led to a shift in investment to
mutual funds and the stock markets. Such financial savings will find its way into mutual funds,
owing to increased awareness of the product.
Assets managed by the Indian mutual fund industry has increased from Rs. 27.74 trillion in
September 2020 to Rs. 37.41 trillion in September 2021. That represents 34.84% increase in
assets over September 2020. (Assets are measured as average assets for the month).

RHP Final Wealth Management Industry Research Report 2021
Page 7 of 98
Even after such high growth India has the lowest mutual fund penetration globally. The total
Assets under Management (AUM) to GDP ratio of India stands at a mere 16.0%, which is
below the global average of 63.0% in CY 2020. Countries like US have AUM to GDP ratios of
over 100%.(Source – Statista.com, CARE Advisory Research & Training Limited (CART))
Changing Wealth Management Operating Models in the future – As per CART, due to
increasing use of technology, many organizations are shifting to digital platforms to provide
services to clients such as Robo-advisors which have successfully leveraged the demand for
user friendly and interconnected digital services and deployed a simple streamlined digital
experience for clients. These firms have created direct-to-consumer models to provide the
basic elements of wealth management advice, minimizing the traditional reliance on human
advisors. Digital platforms automatically invest and rebalance according to clients’ goals and
risk tolerances without human interference which will remain a strong reason for growth and
this trend will continue in the future.
Wealth held by individuals is expected to reach approx. Rs. 812 trillion by FY25 at a steady
CAGR of 11.77% per annum from Rs 465 trillion in FY20.
India is expected to be the fourth largest private wealth market globally by 2028.
The Association of Mutual Funds in India (AMFI) is targeting nearly three-fold growth in AUM
to Rs. 95 trillion (US$ 1.26 trillion) and more than three times growth in investor accounts to
130 million by 2025.
Global wealth is projected to rise by 39% over the next five years, reaching USD 583 trillion by
2025. Low- and middle-income countries are responsible for 42% of the growth, although
they account for just 33% of current wealth. Wealth per adult is projected to increase by 31%,
passing the watershed mark of USD 100,000. The number of millionaires will also grow
markedly over the next five years, reaching 84 million by CY25, while the number of UHNWIs
should reach 344,000 by CY25.
CART believes that factors such as favorable demographic profile with a young working
population rise in income levels, increasing financial literacy, and retail participation and
buoyancy in capital markets supporting equity AUM, are expected to drive the growth of the
mutual fund industry in the long term which ultimately will lead to the growth of Wealth
Management Industry. Hence, the mutual fund industry in the country provides huge scope
for growth and development.

RHP Final Wealth Management Industry Research Report 2021
Page 8 of 98
ECONOMIC OUTLOOK
1.1 Global Economy
The world economy contracted by -3.1% in CY2020 owing to the global outbreak of Covid-19.
However, it is expected to grow by 5.9% in CY2021 and moderate to a growth rate of 4.9% in
CY2022 on the back of vaccination inoculation drive and resumption of economic activities as
pandemic induced restrictions are eased across the globe. The base effect of negative growth
rate in 2020 has resulted in higher growth in 2021 across the spectrum of countries though the
impact varies.
Exhibit 1: Global Growth Outlook Projections (in %)
Country/Group 2020 2021E 2022E
World Output –3.1 5.9 4.9
Advanced Economies –4.5 5.2 4.5
United States –3.4 6.0 5.2
Euro Area –6.3 5.0 4.3
Japan –4.6 2.4 3.2
United Kingdom –9.8 6.8 5.0
Canada –5.3 5.7 4.9
Remaining Advanced Economies –1.9 4.6 3.7
Developing Economies –2.1 6.4 5.1
Emerging and Developing Asia –0.8 7.2 6.3
China 2.3 8.0 5.6
India* –7.3 9.5 8.5
ASEAN** –3.4 2.9 5.8
Emerging and Developing Europe –2.0 6.0 3.6
Latin America and the Caribbean –7.0 6.3 3.0
Middle East and Central Asia –2.8 4.1 4.1
Sub-Saharan Africa –1.7 3.7 3.8
Notes: E-Estimate *For India, data and forecasts are presented on a fiscal year basis and GDP from 2011 onward is based on GDP at market prices with fiscal year 2011/12 as a base year. **Includes Indonesia, Malaysia, Philippines, Thailand and Vietnam Source: IMF – World Economic Outlook, Oct 2021
Advanced economies are projected to grow by 5.2% in CY2021 after a negative growth of 4.5% in
CY2020. It is expected to moderate to a growth of 4.5% in CY2022. The growth forecast for the
advanced economies has been marked up by IMF from its April 2021 projections on the back of the

RHP Final Wealth Management Industry Research Report 2021
Page 9 of 98
pace of the vaccine rollouts and additional fiscal support. Amongst the advanced economies, United
States is projected to grow by 6% in CY21 and moderate to a growth of 5.2% in CY2022. Meanwhile,
the projections for Japan has been downgraded due to strict restrictions in first half of CY2021 and is
expected to see stronger recovery in the second half of CY2021.
Emerging market and developing economies are estimated to grow by 6.4% in CY2021 after
contracting by -2.1% in CY2020. It is projected to grow by 5.1% in CY2022.The projections for
emerging market and developing economies were downgraded by IMF from its April 2021 estimates
primarily due to markdowns carried out in the emerging Asian economies group. Within this group,
India was marked down on account surge in Covid-19 cases during March-May 2021. Similarly, the
ASEAN-5 group is also witnessing rise in cases which is in turn impacting the pace of economic
recovery. China’s forecast was downgraded too due to scaling back of overall government support.
Meanwhile, growth projections for other regions in general in the emerging market and developing
economies have been marked up depending on the vaccine rollouts and government policy support
which in turn has led to stronger than expected recovery in Q1CY2021.
IMF highlighted in its report that the economic recovery is highly dependent on vaccine access across
regions, hence economies will witness diverging recovery rates which may not remain steady as long
as people are exposed to the virus and its emerging variants. Close to 40% of the population is
vaccinated in the advanced economies while only around 10% of the population is vaccinated in the
emerging market and developing economies and only a tiny proportion of population is vaccinated in
low-income group. Hence, the economic growth projections are dependent on several factors such
as access to vaccine, pace of its rollout, its ability to fight emerging variants of the virus and the fiscal
and monetary support provided by the governments.
1.2 Indian Economy1
CARE Ratings Economics Research projects GDP growth to be in the range of 8.8% to 9% for FY22.
The growth rate should be viewed with caution as it is followed by a -7.3% decline in FY21.
The economic outlook for the economy for FY22 would seem to look better on almost all counts than
FY21 due to negative base effect. The pandemic induced lockdown pushed the growth down to -7.3%
1 Source: CARE Ratings Economics Research report titled ‘Economic Outlook for India FY2021-22’ dated 26th July, 2021

RHP Final Wealth Management Industry Research Report 2021
Page 10 of 98
in FY21. It was expected that subsequently growth would be rapid in FY22 with both the negative
base effect as well as the pent-up demand for consumption and investment helping to accelerate the
growth. However, the advent of the second wave of Covid-19 in the beginning of the current financial
year which led to state induced lockdowns has upended this assumption to an extent.
Business, as seen ex post, has been better equipped to face the lockdown and while activity did
reduce across the country as well as sectors, the impact was less severe. The reverse migration which
took place in large numbers last year was of a lower magnitude this time. SMEs were again under
pressure in this phase, but as they were operating at less than normal potential, they were not
pushed back that severely. Therefore, while the projections made by CARE Ratings Economics
Research have come down significantly from March as can be seen from exhibit 2 below, the drop is
less damaging this time.
Exhibit 2: Movement in CARE Ratings Economics Research forecasts for GDP growth (in %)
Date of forecast GDP growth
2020-21 (Actual) -8.0
2021-22: 24 March'21 11-11.2
2021-22: 5 April'21 10.7
2021-22: 21 April'21 10.2
2021-22: 12 May’ 21 9.2
Source: CARE Ratings Economics Research
Some of the major economic indicators are mentioned below.
1.2.1 Gross Domestic Product (GDP)
GDP is the sum of private consumption, gross investment in the economy, government investment,
government spending and net foreign trade (difference between exports and imports). In FY19,
quarter wise growth in GDP remained in the range of 5% to 8% while in FY20 it declined and was in
the range of 3% to 6%. During FY21, it contracted by -24.4% in Q1FY21 to a growth of 1.6% in
Q4FY21. However, in Q1 FY22, the jump in GDP numbers of 20.1% is mainly due to a weak base last
year and also a rebound in consumer spending during the quarter.

RHP Final Wealth Management Industry Research Report 2021
Page 11 of 98
Figure 1: Quarter wise yearly growth in GDP at constant prices (in %)
Source: MOSPI
1.2.2 Gross Value Added (GVA)
Gross value added (GVA) is the measure of the value of goods and services produced in an economy.
GVA gives a picture of supply side whereas GDP represents consumption. CARE Ratings Economics
Research expects GVA to grow by 7.8% in FY22 after declining by -6.2% in FY21. Agriculture and
Industry are expected to lead the economic recovery while a growth rate of 8.2% in services may not
suffice as the lockdown imposed during the second wave of Covid-19 severely affected sectors like
hotels, restaurants, tourism and retail malls.
Figure 2: GVA Growth in FY22 Figure 3: Sectoral GDP Projections
3.6
-7.0-8.4
-6.2
3.4
9.48.2 7.8
-10
-8
-6
-4
-2
0
2
4
6
8
10
12
Agriculture Industry Services Total GVA
in %
FY21 FY22E
13.1
7.36.4
5.6
0
2
4
6
8
10
12
14
Q1 Q2 Q3 Q4
in %

RHP Final Wealth Management Industry Research Report 2021
Page 12 of 98
Source: CARE Ratings Economics Research
1.2.3 Industrial Growth
During FY21, industrial output as measured by index of industrial production - IIP declined by -8.6%
as compared with a negative growth rate of 0.8% in FY20. This implies that industrial production
contracted for 2 consecutive years and the fall in FY21 has been the steepest in the series of 2011-12.
There has been a sustained decline in industrial production growth from FY17 and that has been
exacerbated in FY21 following the nation-wide lockdowns, state-wise restrictions to control the
spread of the COVID-19 infections. 8 out of the 12 months in FY21 have registered negative growth
with the highest growth of 4.5% observed in October 2020.
Further, in the last month of FY21, the index registered a growth of 24.2% followed by a 134.6%
growth in April-21 and 29.3% growth in May-21. For all the 3 consecutive months, the growth rate
was backed by the statistical push of low base.
Figure 3: Yearly growth in IIP (in %)
Source: CMIE
1.2.4 Per Capita GDP, Income and Final Consumption
India’s per capita gross domestic product (GDP) de-grew by -8.2% in FY21 from 3.0% growth in FY20.
Gross national income (GNI) dropped by 8.2% in FY21 from a 3.1% growth in FY20. The per capita
private final consumption expenditure (PFCE), that represents consumer spending, declined by -
10.1% in FY21 after growing by 4.4% in FY20.

RHP Final Wealth Management Industry Research Report 2021
Page 13 of 98
Figure 4: Growth in per capita GDP, Income & Final Consumption
Source: CMIE
1.3 Indian Economy outlook
CARE Ratings estimated India’s GDP growth rate at 9.2% for the FY2022. India’s growth outlook has
improved significantly and the covid-19 vaccination drive will help the economic rebound. The
Reserve Bank of India’s (RBI) Monetary Policy Committee (MPC) kept the repo rate unchanged at 4%
while maintaining an accommodative stance as long as necessary to mitigate the impact of the
COVID-19 pandemic. The Indian central bank was widely expected to keep key interest steady amid a
surge in COVID-19 cases in the country.
The recent surge in COVID-19 cases has caused lockdown and curfew in many states resulting in a dip
in consumer confidence and reignited uncertainty regarding the near-term outlook. Second wave of
COVID-19 infections and subsequent lockdowns are derailing economic momentum, RBI
interventions will help maintain adequate liquidity as well as prevent hardening of yields in bond
market. These measures will ensure economic stability.
The Government has declared that vaccine will be given to every adult citizen (above 18 years) which
may help to reduce the transmission of COVID-19 in the near future. The world’s largest vaccine
maker, Serum Institute of India (SII), has sought Rs.30 billion grant from the Government to ramp up
capacity of the Covishield COVID-19 vaccine beyond 100 million doses a month that the institute is
expected to reach by the end of May 2021.
In the 2021-22 Union Budget, for FY22 capital expenditure is likely to increase by 34.5% at US$ 76
billion over FY21 to boost the economy.
3.0 3.14.4
-8.2 -8.2-10.1
Per capita GDP Per capita GNI Per capita PFCE
FY20 FY21

RHP Final Wealth Management Industry Research Report 2021
Page 14 of 98
Increased government expenditure is expected to attract private investments, providing excellent
opportunities with production-linked incentive scheme. Consistently policy support is anticipated to
boost the Indian economy.

RHP Final Wealth Management Industry Research Report 2021
Page 15 of 98
INDIAN CAPITAL MARKET OUTLOOK
(Source-NSE,BSE )
Nifty Movement -
Date Nifty Closing Change (Y-o-Y)
March 31, 2019 11,623.90
March 31, 2020 8,597.75 -26.32%
March 31, 2021 14,690.70 70.87%
September 30, 2021 17,618.15 19.93%*
* March 2021 to Sep 2021
Primary Market Trends (Public & Rights Issues)
(₹ in Million)
Particulars 2019-20 2020-21 2021-22*
Items No. of
Issues Amount
No. of
Issues Amount
No. of
Issues Amount
I. Public Issues (Debt) 34 1,49,840 18 1,05,873 10 53,895
(a) Public Issue (Equity) 60 2,13,221 57 4,60,597 38 4,58,999
(b) FPOs - - -
(c)Rights Issues 16 5,56,420 21 6,40,588 9 7,924
II. Total Equity Issues
(a+b+c)
76 7,69,641 78 11,01,185 47 4,66,923

RHP Final Wealth Management Industry Research Report 2021
Page 16 of 98
Grand Total (I+II) 110 9,19,481 96 12,07,058 57 5,20,818
(Source - SEBI Bulletin)* Data till August 2021.
Notes:
1. Equity public issues also includes issues listed on SME platform.
2. From April, 2020 onwards the data of equity is being prepared based on the listing date.
3. The data of Debt is being prepared based on closing date.
Capital Raised by Listed Companies through QIPs
Year Total No. of issues
Amount Rs in Million
2015-16 24 145,880
2016-17 20 84,640
2017-18 53 672,570
2018-19 14 86,780
2019-20 14 5,43,890
2020-21 31 7,87,380
2021-22* 15 1,71,910 (Source - SEBI Bulletin)* Data till August 2021.
Government initiative of introducing Goods & Service Tax and the Insolvency & Bankruptcy Code
(IBC) and increasing participation of the domestic mutual fund industry as a strong counterbalance to
foreign funds has been an important factor for the shift in the country's financial space. The BSE
Sensex on 30th September 2021, closing at 59,126 witnessing 63.09% rise from its 1st January, 2019
closing at 36,255. The Nifty 50 index also rose 61.48% at 17,618 on 30th September 2021 compared
to closing on 1st January, 2019 at 10,910. Increase in global liquidity, the government's
demonstration of its serious intent for economic reforms, signs of a turnaround in corporate
earnings has boosted the Capital Market’s attractiveness for the investors during the calendar year
2021. Total amount mobilized through public issues and private placement of both debt and equity
was Rs. 520.82 billion with total issue of 57 from April 1st 2021 till August 31st 2021 as compared to
Rs. 1207.05 billion with total issue of 96 from April 1st2020 till March 31st 2021 a decrease of 56.85%
in the amount mobilized and 40.62% decrease in No. of issues.

RHP Final Wealth Management Industry Research Report 2021
Page 17 of 98
INDIAN WEALTH MANAGEMENT INDUSTRY OVERVIEW
The Indian Wealth Management market is on a sustained path of growth, given India’s long-term
economic prospects, positive demographics, rising income levels and current low penetration. While
the percentage of wealthy individuals in India is very small compared with developed markets, very
high potential of growth in wealth is estimated in future. India has the key ingredients of a high-
growth wealth management market, namely driven by a very large and young mass affluent
segment; an increase in the wealth of global Indians; the Indian government’s push to control illegal
channel of funds and push for tighter regulations of the capital markets.
Number of millionaires in 2020 and 2025 (Selected countries)
Country Number (thousand) Change CAGR
2020 2025 (%) %
United States 21,951 28,055 28 5.03%
China 5,279 10,172 93 14.02%
Japan 3,662 5,411 48 8.12%
United Kingdom 2,491 3,711 49 8.30%
Germany 2,953 4,240 44 7.50%
India 698 1,269 82% 12.70%
World 56,084 84,014 49% 8.42% (Source- Global Wealth Report 2021)
The demographic difference presents an opportunity to create new products to address the needs of
a young population and leverage new technologies, such as social and software-based investing
applications as a key differentiator. Indian wealth management industry is largely focused mainly on
the urban segment, leaving untapped majority of Indian population. One of the key factors for
Advisors is to develop trust with the potential investors where advisors constantly need to build its
brand, focus on overcoming trust barriers, invest in technology and focus on transparency and
compliance.
In 2018, top 8% of the total population in India represents 45% of the total wealth and of the above
only 20% take advice from wealth managers. With increase in start-ups, rising income levels and
friendly macro factors with ease of doing business will drive growth of young HNI population in India;
there is a big opportunity for a wealth management firm to tap into an underpenetrated market with
huge upside growth potential for wealth managers (Source – CART).
There is steady growth in number of client’s interest towards:
1) Access to Mutual Fund / Other financial Product Distribution
2) Financial Planning (specific short term and long term goals) Advice
3) Tax Planning Advice
4) Estate Planning Advice

RHP Final Wealth Management Industry Research Report 2021
Page 18 of 98
5) Wealth Management Advice
Based on the investment corpus available with the individuals, CART have grouped individuals in following four categories -
Retail – With financial assets of Rs. 1 million and lower
Mass Affluent – With financial assets between Rs 1 million to Rs. 50 million
HNI - With financial assets between Rs 50 million to Rs. 500 million
Ultra HNI – With financial assets of more than Rs. 500 million
Wealth Pyramid
Indian Mutual Fund Industry Overview
(Source -AMFI)
The Indian mutual fund industry has a long history of over 50 years, starting with the formation of
UTI, a joint initiative of the Government of India (“GOI”) and the RBI in 1963. It was regulated and
• Below Rs.1 million in Financial Assets
• Rs.1 - 50 million in Financial Assets
• Rs.50 - 500 million in Financial Assets
• Rs.500+ million in Financial Assets
Ultra HNI
HNI
Mass Affluent
Retail

RHP Final Wealth Management Industry Research Report 2021
Page 19 of 98
controlled by the RBI until 1978, after which the Industrial Development Bank of India (“IDBI”) took
over. UTI launched its first scheme, Unit Scheme 1964, in 1964 and its AUM reached ₹ 67 billion by
1988. The year 1987 witnessed the entry of other public sector banks to set up mutual fund business
in the country. Since 2003, the mutual fund industry has witnessed a healthy growth, supported by
various regulatory measures as well as investor education initiatives, where AUM of the Indian MF
Industry has grown from ₹ 3.26 trillion as on 31st March 2007 to ₹ 36.73 trillion as on 30th
September, 2021, more than 11.27 times in a span of about 14.5 years.
Digital presence by mutual fund houses and wealth management players is enhancing distribution
reach. Digital advances have ensured distribution efficiencies, and also helped to create predictable
revenue streams in the business. Digital platforms have helped distributors to focus more on
research and tracking markets rather than operational tasks such as individual client visits and
extended paperwork. Tablet and mobile apps are helping mutual funds increase reach in B30
locations. Moreover, there have been several industry-wide initiatives to help distributors build
digital capabilities in order to serve investors better. While there are all types of distributors —
robots, fee-based advisors and transaction-only distributors — will co-exist as there is low
penetration of distributors in the country, with only a small number of distributors catering to the
large population base.
Note: As per SEBI circular SEBI/HO/IMD/DF2/CIR/P/2018/16 dated 02.02.2018, the terms and definition of “15 cities”,
“T15” and “B15” are substituted with “30 cities”, “T30” and “B30” respectively, with effect from April 1, 2018.
Players in the Indian wealth management space
Products offered: Wealth managers in India mainly sell mutual funds, private equity funds, real
estate funds, non-convertible debentures, portfolio management services, structured products and
tax-free bonds to investors.

RHP Final Wealth Management Industry Research Report 2021
Page 20 of 98
Business model Market
positioning Key characteristics
Universal banks Strong ● Includes large players, mainly private banks;
recently some PSU
● Banks have also announced plans to launch wealth-
management services
● Extensive reach
● Relatively high entry barriers
● Cross-sell potential with both retail and corporate
customers
Wealth management Specialists
Medium ● Mainly foreign players with strong understanding of
advisory services
● Offerings are mainly managed/structured products
● Typically high entry barriers
● Focus on the UHNI segment
Global investment banks Weak ● Focus on the UHNI segment
● Institutional approach to serve clients with
investment banking products
Brokers/dealer discount/ online brokers
Strong ● Large number of players
● Focus on the mass affluent segment
● Mainly offer mutual fund products
National distributors
Strong ● Some firms are affiliated to a brokerage firm with a
large network of sub-brokers
● Large firms with extensive distribution network
● Multiple products
Family office Weak ● Holistic advisory services for specific client
segments such as entrepreneurs
Robo-advisors Upcoming ● Fully automated or hybrid investment managers
● Algorithm-based advice without human
intervention
● Suitable for small-ticket retail investors
● Available at a lower cost
● Consistent and transparent advice
Others (independent funds/insurance advisors, Etc.)
Medium ● Very low entry barriers
● Commission-driven model
● No dedicated wealth management offering

RHP Final Wealth Management Industry Research Report 2021
Page 21 of 98
KEY GROWTH DRIVERS
1. Increasing Penetration of Mutual Fund Market in India
Assets managed by the Indian mutual fund industry has increased from Rs. 27.74 trillion in
September 2020 to Rs. 37.41 trillion in September 2021. That represents 34.84% increase in assets
over September 2020. (Assets are measured as average assets for the month).
Despite the size and growth profile, India continues to be underpenetrated with a mutual fund
penetration rate (the ratio of period ending mutual fund AUM to GDP) of 16.0% in 2020, as
compared to 140% in the United States, 84% in Brazil and a global average of 63%. Further, India
accounts for less than 2% of the global mutual fund industry, representing a significant growth
opportunity.
Mutual Fund Penetration of various Countries CY2020 – AUM to GDP
(Source: CART, Statista.com)
There is lack of healthy participation from investors in B30 (beyond top 30) locations. Recently, the
mutual fund sector is witnessing rising activity from B30 locations, especially in the equity segment
due to improved distribution and regulatory changes in fee structure. Lack of awareness about
financial instruments and prevalence of low financial knowledge has been one of the key factors in a
lower inflow of investments as compared to that in other BRIC nations like China and Brazil.
Favorable demographics and rising income levels make it one of the most attractive sectors in the
financial services industry. Robust macroeconomic fundamentals outlook and various government
reforms have strengthened investor confidence, prompting them to participate in the equity market,
especially increased participation of investors from tier 3 and tier 4 cities. With increasing mobile
phone penetration and increasing wealth managers’ use of technology enables transparency and
systematic products in an efficient manner which in turn helps to develop informed customers and
RHP Final Wealth Management Industry Research Report 2021
Page 22 of 98
distributors to penetrate deeper across the wealth management space.
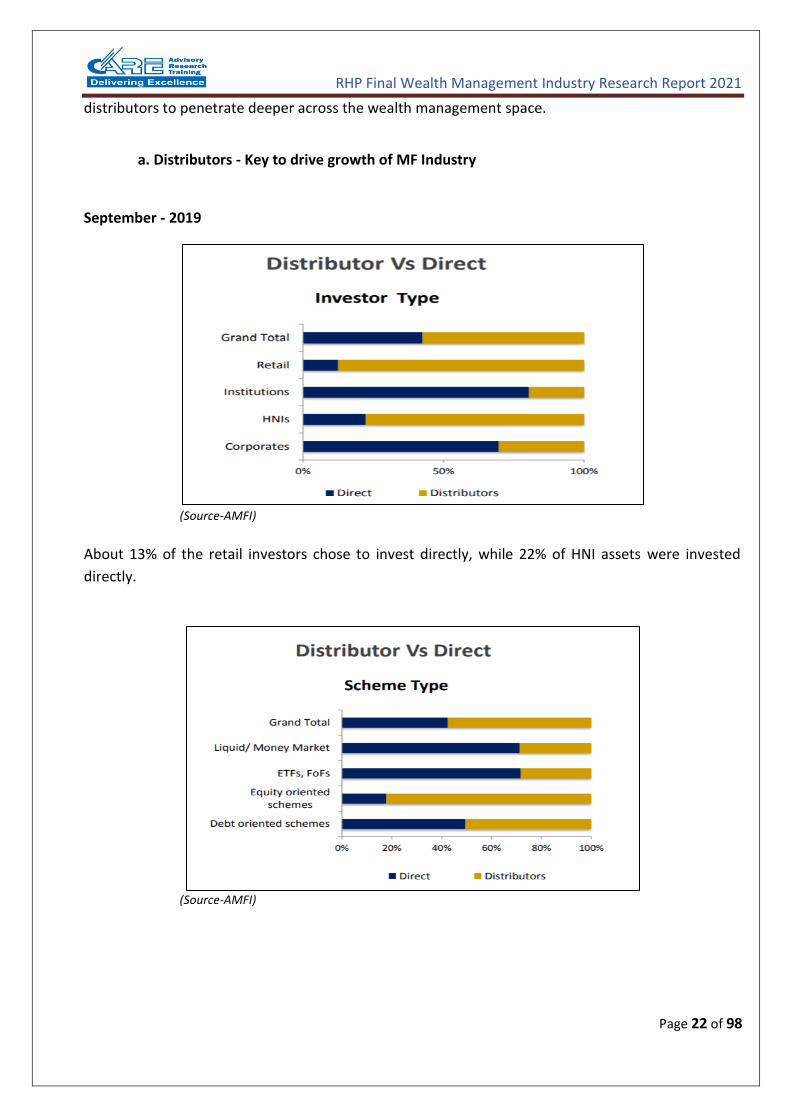
a. Distributors - Key to drive growth of MF Industry
September - 2019
(Source-AMFI)
About 13% of the retail investors chose to invest directly, while 22% of HNI assets were invested
directly.
(Source-AMFI)

RHP Final Wealth Management Industry Research Report 2021
Page 23 of 98
March - 2021
(Source-AMFI)
About 16% of the retail investors chose to invest directly, while 24% of HNI assets were invested
directly. 47% of the assets of the mutual fund industry came directly. A large proportion of direct
investments were in non-equity-oriented schemes where institutional investors dominate.
(Source-AMFI)
76% of liquid/money market scheme assets where institutional investors dominate, were direct,
whereas 57% of debt-oriented scheme assets and 21% of equity scheme assets were direct.

RHP Final Wealth Management Industry Research Report 2021
Page 24 of 98
August - 2021
(Source-AMFI)
About 17% of the retail investors chose to invest directly, while 24% of HNI assets were invested
directly. 46% of the assets of the mutual fund industry came directly. A large proportion of direct
investments were in non-equity-oriented schemes where institutional investors dominate.
(Source-AMFI)
76% of liquid/money market scheme assets where institutional investors dominate, were direct,
whereas 59% of debt-oriented scheme assets and 22% of equity scheme assets were direct.
Distributors have been a key player for strong participation from retail investors that has led to
overall growth in the industry. Commission rates for the distributors have relatively remained stable
and the increase in participations of investors through distributors has been a key driver for increase

RHP Final Wealth Management Industry Research Report 2021
Page 25 of 98
in total AUM of mutual fund industry. Retailers /HNIs have preferred to invest through distributors.
As of August 2021, about 83% of the retail investors chose to invest through distributor, while 76% of
HNI assets were invested through distributor. In the equity schemes, 78% of the assets were through
distributors who have been an important factor for growth of domestic equity market. Distributors
are becoming more and more prominent with private players dominating the distribution market
where advisors still play a critical role in providing information to potential investors. Distributors
from B30 cities are also key drivers for increasing penetration of mutual funds in the smaller cities
and attractive incentives in low per capita state.
Investors – Overall Composition
(Source-AMFI)
Distribution channel accounted for 79% of total mutual fund assets under management (AUM) as on
August 2021, of which 58% belongs to top 30 cities.

RHP Final Wealth Management Industry Research Report 2021
Page 26 of 98
State-wise new ARN registration as on March 2021
State / Union territory % of ARN/ EUIN
Maharashtra 25.29%
Gujarat 12.26%
Uttar Pradesh 8.35%
Tamil Nadu 5.99%
West Bengal 5.52%
Delhi 5.48%
Karnataka 5.22%
Rajasthan 3.81%
Madhya Pradesh 3.66%
Telangana 3.63%
Haryana 3.27%
Odisha 2.62%
Andhra Pradesh 2.36%
Jharkhand 2.14%
Kerala 2.14%
Bihar 1.92%
Punjab 1.81%
Remaining states 4.53%
Total 100.00%
(Source-AMFI)
Maharashtra continues to be the top state to add the highest number of new MFDs/EUIN in the
industry. Maharashtra accounts for 25% of the new ARN and EUIN registrations, shows the latest
AMFI data on geographical spread of the new ARN holders as on March 2021.
Meanwhile, Gujarat and Uttar Pradesh have secured second and third position in terms of bringing in
new distributors in the industry. Gujarat and Uttar Pradesh have contributed 12% and 8% new
distributors, respectively. The top three states collectively contribute over 45% of the new ARN and
EUIN registrations.
AMFI data shows that 46% of the individual distributors has come from B30 cities as of March 2021.
Of the 94,510 registered individual distributors, 43,823 has come from B30 cities while the remaining
50,687 or 54% distributors were from T30 cities.
B30 cities have added 3,405 new individual MFDs while T30 cities saw an addition of 3,475 new
MFDs under individual category in the last one year.
Overall, the mutual fund industry has over 0.243 million ARNs of which over 0.094 million are

RHP Final Wealth Management Industry Research Report 2021
Page 27 of 98
individual distributors, 0.133 million are employees & 0.016 falls Under Other Category.
b. Increase in Retail participation and mass affluent
(Source-AMFI)
c. B30 and T30 Asset Mix
(Source-AMFI)
Note: As per SEBI circular SEBI/HO/IMD/DF2/CIR/P/2018/16 dated 02.02.2018, the terms and definition of “15 cities”, “T15” and “B15” are substituted with “30 cities”, “T30” and “B30” respectively, with effect from April 1, 2018.

RHP Final Wealth Management Industry Research Report 2021
Page 28 of 98
The wealth management market (assets under advisory) in India is about ₹ 21.77 trillion in July 2021,
which is only approx. 9% of the country's GDP, as compared to 60% to 75% of GDP in established
markets. The increase in penetration of wealth management companies into Tier II and III cities will
also help to drive the growth given more than 44% of the UHNIs live in non-Metro where currently
wealth is majorly managed by IFAs and Chartered Accountants. (Source-AMFI).
The investable wealth across HNI and mass affluent segment is rising due to fast growing economy,
creating a need for wealth services across various potential investors group. More than 50% of the
Indian population is under 25 years of age and this is the largest and fastest-growing adult segment
across the globe which represents a greatest opportunity for the wealth management industry.
Favourable demographics, rising income levels and a burgeoning affluent middle class will provide a
strong customer base for wealth management sector.
As investors are getting more educated, retail investor’s style of investing is becoming more mature
and they are becoming aware of the potential that equities offer along with the associated risks.
Individual investor’s component of total number of folios in the industry has steadily increasing over
the years where mass affluent retail investors are spearheading the growth rate. Mutual funds
remain a largely under represented asset class in India where a large part of mutual fund savings
originate from the large cities. Growing popularity of mutual funds has seen increasing participation
from retail investors in B30 cities.
The top five cities, Mumbai, Delhi, Bangalore, Kolkata and Pune contributed to 57.31% of the AUM of
mutual fund for the quarter ending in June 2021. But with rising income levels and a growing affluent
middle class, Retail investors are becoming more inclined towards equities as an investment option
over traditional preference of savings towards physical assets, especially from B30 cities. As of March
2021, Mumbai and New Delhi attributed to 43% of the average AUM compared to 56% in March
2015. 16% of the assets of the mutual fund industry came from B30 locations in July 2021. Assets
from B30 increased from Rs.4.45 trillion in August 2020 to 5.86 trillion in August 2021, representing
an increase of 32%.
Investors from B30 locations are attracted towards equity as compared to T30 (T30 refers to the top
30 geographical locations in India and B30 refers to the locations beyond the top 30) where debt
portion is higher due to large participation from institutional investors. As of August 2021, 71% of the
assets from B30 locations are in equity schemes as compared to 62% from B30 locations in March
2018.
Investors in urban cities get advice from several large bank and wealth managers, but mass affluent
retail clients depends on IFAs for advice on mutual fund where there is immense potential to tap the
untapped market. Small investors are opting for mutual funds through systematic investment plans
(SIPs) in order to create long term wealth and meet their financial goals.

RHP Final Wealth Management Industry Research Report 2021
Page 29 of 98
d. Increase in folios
(Source-AMFI)
Retail investor’s preference is becoming more mature as they get more informed regarding equities
potential and risk associated in investing in it. Since March 2014, there is an increase in investor
accounts from 39.5 million to 102.6 million in June 2021. Increase in penetration of mutual funds
products driven by increase in number of folios and participation from mass affluent segment. Total
number of accounts (or folios as per mutual fund parlance) as on June 30, 2021 stood at 102.6
million, while the number of folios under Equity, ELSS and Balanced schemes, wherein the maximum
investment is from retail segment stood at 92.8 million. Individual investor’s component of total
number of folios in the industry has been steadily increasing over period of years where mass
affluent retail investors are spearheading the growth rate. The total number of retail investor folios
increased from 45.40 million as of March 31, 2016 to 92.8 million as of June 30, 2021, adding 47.45
million folios in 5.25 years growing at CAGR of 14.60%.
2. Increase in Wealth and HNI population in India
For the past decade, India has been classified as a lower-middle income country which aspires to
move a step up in the global prosperity ladder. In the past three decades, per capita incomes have
multiplied, poverty has reduced, illiteracy rates have fallen, and health conditions have improved. An
expanding economy has provided the much-needed resources to address chronic infrastructure
deficits and improve the lives of millions. India is now poised to transition to a higher and more
widely shared level of prosperity. Households in the global middle class can fulfil a range of
aspirations, such as affordable housing, health care, education, clean water, sanitation facilities,
reliable electricity, a safe environment, and discretionary income to spend on leisure pursuits.
According to World Bank draft report, unlike East Asia, there is an expanding share of young adults in
India, so there is limited risk of sustained wage increases for low-skilled workers and unlike Latin
America, India is a net importer of minerals, timber, and many other commodities, so that India’s
growth does not fade with declining commodity prices. The share of population in extreme poverty

RHP Final Wealth Management Industry Research Report 2021
Page 30 of 98
of India was reduced from 45% in 1994 to 13.4% in 2015. If this trend continues, India is on track to
eliminate extreme poverty by 2026 (to below 3%). The rapid decline in poverty between 2005 and
2015 was driven mainly by higher labour earnings (Source - Policy Research Working Paper by World Bank
Group). Non-farm jobs, supported by an unprecedented rise in wages for unskilled labor, helped
millions of Indian households to move up the poverty line.
a. Increase in GDP to drive growth of Wealth in India
Strong correlation between Wealth/GDP
(Source-Global wealth Report 2019)
The average per capita GDP of India rose from US$ 443 in CY 2000 to US$ 2,104 in CY 2019. In the
past three decades, per capita incomes have quadrupled, poverty has retreated, illiteracy rates have
declined, and health conditions have improved. An expanding economy has provided the much-
needed resources to address chronic infrastructure deficits and improve the lives of millions.
Increase in GDP/Adult ratio of selected developed nations such as United States, Japan, Australia; has
also led to increase in their wealth/GDP ratio. While India’s GDP is expected to grow at much faster
rate, it is estimated that it will mirror similar increase in its wealth/GDP ratio as growth observed by
developing nations. Wealth per adult grew by 1.2%, raising global mean wealth to a record high of
$70,850 per adult in CY2019. Most of the top performing countries were boosted by strong stock
market gains during the year. In developed regions such as North America and Europe, financial
savings represents a high proportion of overall wealth per adult as compared to other regions. Strong
underlying economic expansion along with significant growth per capita income will drive the pace of

RHP Final Wealth Management Industry Research Report 2021
Page 31 of 98
wealth creation in India where investment towards financial savings is gradually increasing with
increase in GDP.
b. Increase in HNI population and reliance on wealth managers for investment advice
Growth of Ultra HNIs in India
(Source-Kotak Wealth-Top of the Pyramid Report)
India currently has one of the youngest populations in the world, with a median age of 27.73 years
and has the world’s highest number of 10 to 24-year-olds, with 242 million, compared to China,
which has 185 million young people. By 2021, India is expected to have 34.33% share of youth in
total population. Although India is one of the world’s fastest growing UHNI’s populations both in
terms of the number of individuals and the wealth levels, percentage of wealthy Indians remains very
small compared with developed economies. With increase in start-ups, rising income levels and
friendly macro factors with ease of doing business will drive growth of young HNI population in India,
a big opportunity for wealth management firm to tap into underpenetrated market. In 2017 around
69% of total HNI population in India is below the age of 55 years where majority of them seeks a
wealth manager to advice on investment opportunity as they neither have the expertise nor the time
to monitor their investments. The number of UHNIs grew to 1,60,600 (with Rs.153 trillion worth of
assets) at the end of 2017, up 10% from that in 2016 , which roughly equalled the combined market-
capitalization of all companies listed on BSE. Ultra-HNIs in India are expected to double to 3,30,400
with Rs.352 trillion worth of assets by 2022 at a CAGR of 18.13% mostly increase driven by young
Indians getting wealthier. UHNHs in India are inclining towards ‘opportunity-driven approach’ to
equity investing and are keen on reducing exposure to real estate and debt instruments in pursuit of
bigger profits in equity market. (Source-Kotak Wealth-Top of the Pyramid Report)

RHP Final Wealth Management Industry Research Report 2021
Page 32 of 98
3. Increase in Household savings with high proportion of savings towards financial assets.
a. Increase in preference of investing in financial assets
Changes in Household savings in India
(Source-www.rbi.org.in)
Sector-Wise Domestic Saving at Current Prices
(₹ in Billion)
Particulars 2014-15 2015-16 2016-17 2017-18 2018-19 2019-20
Gross financial saving 12,572 14,962 16,147 20,564 21,341 22,846
Less-financial liabilities 3,768 3,854 4,686 7,507 7,784 6,641
Net Financial Savings 8,804 11,108 11,460 13,057 13,557 16,205
Saving in physical assets 15,131 13,176 15,946 19,442 22,481 23,272
Saving in the form of valuables 456 465 465 467 427 431
Household sector 24,391 24,749 27,871 32,966 36,465 39,908
GVA 97,121 1,04,919 1,13,283 1,20,342 1,27,442 1,32,715
Net Financial Savings as % of GVA 9.07% 10.59% 10.12% 10.85% 10.64% 12.21%
(Source-www.rbi.org.in)
As can been seen from the above graph, share of Financial Savings increased to 41% in 2019-20 from
2014-15. The Financial Savings is at Rs. 16,205 billion 2019-20.
Changes in Financial Assets / Liabilities of the Household Sector

RHP Final Wealth Management Industry Research Report 2021
Page 33 of 98
(₹ In Billion) Sr.no Particulars 2014-15 2015-16 2016-17 2017-18 2018-19 2019-20
1 Currency 1,333 2,005 (3,329) 4,847 2,779 2,826
2 Bank deposits 5,793 6,224 9,386 5,216 7,800 8,374
3 Non- banking deposits 289 181 349 -6 301 281
4 Life insurance fund 2,993 2,642 3,543 3,440 3,588 3,178
5 Provident and pension fund 1,909 2,907 3,255 3,694 3,977 4,655
6 Claims on Govern- ment 10 679 1,155 1,557 2,064 2,715
7 Shares & debent- ures 204 284 1,745 1,774 790 774
8 Units of UTI - - - - - -
9 Trade Debt (Net) 42 41 44 42 42 43
10 Changes in financial assets (2 to 9) 12,572 14,962 16,147 20,564 21,341 22,846
11 Bank advances 2,824 2,694 3,458 5,255 6,090 5511.57
12 Loans & advances from other financial institutions
942 1,156 1,229 2,250 1,688 1128.32
13 Loans & advances from Government
2 4 (0) 2 6 1.19
14 Loans & advances from co-operative non-credit societies
- - - - - -
15 Changes in financial liabilities (11 to 14)
3,768 3,854 4,686 7,507 7,784 6,641
Net Financial Savings (10-15) 8,804 11,108 11,460 13,057 13,557 16,205
(Source-www.rbi.org.in)
(Source-www.rbi.org.in)
As can be seen from the above table, across the key asset classes, there has been an increase in
proportion, primarily in financial asset class and the trend is likely to continue to grow in the coming
years.

RHP Final Wealth Management Industry Research Report 2021
Page 34 of 98
Figure: Breakup of changes in financial assets / liabilities of the household sector
(Source-www.rbi.org.in)
4. Digitalizing Wealth Management Sector
Technology is poised to change the nature and delivery of financial advice in some significant ways.
Technology is enabling platform convergence and creating opportunities for new client engagement.
There is an increasing number of online trading, brokerage, investment, direct-to- consumer (D2C)
and robo-advisors offering user friendly, low-cost, automated solutions for core functions such as
investing, asset allocation, and portfolio management and reporting. Asset managers revamp their
business models — standardize, centralize and outsource through the use of technology. Processes
are becoming paperless, efficient, easy and real-time.
Trends driving the emergence of robo advisors
Focus on mass market ● Wealth managers have traditionally focused on the HNI and ultra-HNI segments, which align better
with the economics of their advisor-based business model, providing sophisticated products and
face-to-face service. This leaves less affluent investors devoid of high-quality wealth management
advice.
● Robo-advisers have the ability to make wealth advice economically feasible to the mass market.
Their operating model differs from that of traditional players in that it is less sophisticated in terms
of products but clear and efficient in scalability. This, in turn, has enabled these players to reach
client segments that have traditionally been out of reach of wealth managers.
● The mass market offers tremendous potential for wealth managers worldwide. Although these
clients may be relatively small on an individual level, when aggregated they represent a significant

RHP Final Wealth Management Industry Research Report 2021
Page 35 of 98
asset base (for instance, in the US, the mass affluent segment offers a market potential of ~US$ 10t).
These digital firms have made it possible to bring investment advice to the masses and unlock the
large potential of underserved segments through their low-cost and potentially highly scalable
solutions in order to meet core wealth management needs.
Demographic shift
● The wealth management industry is witnessing a phase of significant demographic change as its largest investor segment — the baby boomers (born between 1946 and 1965) — retires and assets are transferred to the next generation — Gen-X (born between 1966 and 1980) and Gen-Y/millennial (born after 1980).
● Younger set of investors have largely been underserved by traditional players, with only 18% of
financial advisors in the US targeting Gen-Y clients
● Traditional wealth managers are facing challenges in maintaining relationship with clients, who are
tech-savvy and believe in a do-it-yourself approach. On average, a financial advisor is over 50 years
of age, which results in a generational gap and a slight disconnect with the younger generation.
● The simple technology platforms offered by new-age digital wealth managers resonate well with the
needs of millennials. Digital entrants have also benefited from the fact that many millennials do not
have a trusted advisor relationship and feel comfortable using technology to manage their finances.
Hence, digital firms are well positioned to capitalize on the generational shift.
Advanced digital capabilities
● Digital has changed the way people interact, creating opportunities for new engagement models
with end investors.
● These technology-backed automated investment services (robo-advisors) have been developed on
the premise that many of the activities performed by traditional investment advisors can be replicated by adopting advanced digital capabilities.
● Robo-advisors have successfully leveraged the demand for user friendly and interconnected digital
services and deployed a simple streamlined digital experience for clients. These firms have created direct-to-consumer models to provide the basic elements of wealth management advice, minimizing the traditional reliance on human advisors. Digital platforms automatically invest and rebalance according to clients’ goals and risk tolerances sans human interference.
5. Government Initiatives

RHP Final Wealth Management Industry Research Report 2021
Page 36 of 98
In order to promote investors participation, government / regulators are boosting investor’s
confidences to participate in equity / debt market by increased focus on client centricity, fiduciary
responsibility and compliance. Regulator have been more stringent in their requirements regarding
advisor qualifications, infrastructure, risk profiling and suitability criteria. To enhance the penetration
of mutual funds in the country, SEBI sought to increase the sales in the B15 location through the
commission structure. In 2011, SEBI proposed a self-regulatory organization (SRO) for the Indian
wealth management sector that would help regulate business and serve as a medium for SEBI to
implement various wealth management initiatives. In September 2012, SEBI allowed fund houses to
charge an additional 30 basis points on daily net assets in the total expense ratio, should the new
inflows from B15 cities be at least 30% of the gross new inflows in the scheme or 15% of the average
AUM, whichever is higher. As per SEBI circular SEBI/HO/IMD/DF2/CIR/P/2018/16 dated 02.02.2018,
the terms and definition of “15 cities”, “T15” and “B15” are substituted with “30 cities”, “T30” and
“B30” respectively, with effect from April 1, 2018. Later in April 2019, SEBI issued a consultation paper on
SROs for intermediaries including investment advisors. In August 2020, SEBI notification called for a wholly-
owned subsidiary of a stock exchange to administer and supervise such advisers.
COVID – 19 impact on Wealth Management firms As the COVID -19 sunsets, firms are likely to take measures to improve and rebuild customer
confidence in their investment portfolios. In FY21, with the onset of covid there was apprehension
amongst investors especially in the equity category of mutual funds. Given below is a brief table on
how the net sales for the certain classes of Mutual funds.
Category Net Inflow (+ve)/ Outflow (-ve) for the period in Rs. Billion
Q2FY22 Q1FY22 Q4FY21 Q3FY21 Q2FY21 Q1FY21
Multi Cap Fund $$ 37.16 20.06 67.44 -82.86 -33.34 12.21
Large Cap Fund 5.28 18.10 -34.10 -77.16 -24.95 30.34
Large & Mid Cap Fund 19.43 23.53 9.14 -16.47 -0.12 11.38
Mid Cap Fund 30.01 40.55 1.97 -35.08 -12.50 8.14
Small Cap Fund 13.67 19.70 -16.88 -22.12 -0.62 9.27
Dividend Yield Fund 0.40 6.97 0.19 13.62 -0.82 -0.29
Value Fund/Contra Fund -11.93 -6.98 -32.17 -41.65 -18.17 0.98
Focused Fund 41.97 20.06 6.99 -19.02 13.63 17.30
Sectoral/Thematic Funds 102.32 40.49 42.30 46.39 2.05 7.27
ELSS (Open ended) -21.62 -12.18 -1.16 -23.53 2.69 20.51
Flexi Cap Fund 182.58 24.78 -90.45 - - -
ELSS (close ended) 45.63 -3.17 -3.44 -1.36 -0.60 -0.27
Other Equity Schemes 127.94 -35.65 -66.90 -41.91 -16.09 -3.04
-
Total 572.85 156.27 -117.07 -301.16 -88.83 113.79
Source: AMFI, Year FY21

RHP Final Wealth Management Industry Research Report 2021
Page 37 of 98
It could raise the need to use data and analytics to fine-tune their customer, product and pricing
strategy to meet customer expectations.
Since the COVID-19 period has forced branch lockdowns leaving investors no option but to use
online and digital services, the firms could see possible drive and upsurge in demand for digital
channels and therefore the need to upscale and upgrade them.
COVID-19 could possibly trigger regulation changes on fees, commissions, advice, risk
assessment, margin exposures, investment strategies, portfolio valuations etc.
If the COVID -19 period stretches longer it could create workforce reduction. There could also be
probable salary restructuring from commission based to increased fixed salary component or full
time employment along with changes in benefits.
There could be push in the industry for retirement planning with investment protection, digital
estate planning.
The market could witness large scale sale of portfolio for tax harvesting and large number of
portfolio gifting to take advantage tax exemptions due to low portfolio value.

RHP Final Wealth Management Industry Research Report 2021
Page 38 of 98
EVOLUTION OF DIGITAL WEALTH MANAGEMENT
The global wealth management industry is being revolutionized by the rapid pace of digital
innovation. After the global financial crisis, while traditional asset managers focused on meeting the
enhanced regulatory requirements and resolving other crisis-driven complexities, several new age
digital players focused on developing simpler and cheaper methods of delivering financial advice in
an innovative way. This paved the way for virtual advice, and amidst the increasing evolution of
virtual advice, one of the most recent disruptions is the robo-advisor movement, i.e., the emergence
of a new group of digital wealth management firms offering automated investment advice services.
Notably, these firms are challenging one of the main paradigms of the wealth management industry:
the need for face-to-face interaction and a personalized human touch to financial advice.
Robo advisors are automated, low-cost money management providers that mirror the role of a
traditional financial advisor. They offer user-friendly digital platforms and conduct individualized risk
profiling via algorithms to determine an optimal asset allocation for investor’s portfolio vis-à-vis the
archetypal time-intensive face-to-face consultations carried out by traditional wealth managers. The
basis for this technology is that algorithms can provide sound and logical financial advice at a fraction
of a cost compared to human advisors.
How robo-advisors work Robo-advisors use a combination of simplified client experience, lower fees and increased transparency to offer automated advice direct to consumers. These digital entrants have changed the fundamental economics and scalability of servicing the underserved segments by combining the basic components of a wealth management offering with seamlessly integrated technology, lower pricing, greater transparency and client-relevant digital content. The process followed by most robo-advisors is as follows: Step 1: Investors are required to complete a comprehensive online questionnaire designed by behavioral finance experts. This comprises questions related to the investors’ specific needs, financial goals and risk appetite. Step 2: The robo-advisor platform uses proprietary algorithms to process the inputs, and select a portfolio (mainly focusing on exchange-traded funds [ETFs]) to provide a tailored investment plan to investors. The portfolio is periodically rebalanced to optimize profits and taxes. Step 3: The portfolios are monitored consistently by computers. Investors can re-adjust their goals and risk tolerance, which will trigger re-balancing of the portfolio. Robo-advisors mainly provide automated portfolio management, with limited focus on tax, retirement and estate planning, and can charge lower fees because of automation. They offer passive investment and charge lower fees. Technology has revolutionized the wealth management space, leading to the emergence of two alternatives to the traditional wealth management model: fully

RHP Final Wealth Management Industry Research Report 2021
Page 39 of 98
automated digital wealth managers and hybrids, which pair computerized services with a human touch (advisor-assisted digital wealth managers).
Traditional vs. digital wealth managers
Robo-advisors
Fully automated digital wealth managers
Advisor-assisted digital wealth managers
Traditional wealth management firms
Business model
Software-based delivery of customized and automated investment advice
Phone-based financial advisor accessible through digital channels for personal advice
Face-to-face advice mainly through the branch network for comprehensive wealth management
Client type
Millennial, tech-savvy and price sensitive customers who want to match market returns and pay low fees
Mass market and mass affluent clients who value human guidance and technology
Affluent, HNI and ultra-NHI clients who value guidance from a trusted financial advisor
Value proposition
A convenient, easy-to-use and low-cost online platform offered directly to consumers
A digital platform combined with advisor relationship; affordable pricing for a fully diversified portfolio
A dedicated FA with full range of investment choices and comprehensive wealth planning
Fee structure A 0.25%–0.50% fee on assets managed; minimums may apply
A 0.30%–0.90% fee on assets managed; monthly fees per planning program; minimums may apply
A 0.75%–1.5%+ fee on assets managed; varies by investment type; minimums may apply
Investment process
Risk profile, target asset allocation, managed
Virtual FA meetings, financial planning, risk
In-person meetings with a dedicated advisor,
Investment Banking/ Retirement
management lending services
Advisor-assisted
Traditional wealth managers
S
e
r
v
i
c
e
s
Financial planning Insurance
Estates/
trusts
Full automated

RHP Final Wealth Management Industry Research Report 2021
Page 40 of 98
investment account, automated rebalancing and easy access
profile, target asset allocation, managed investment account, automated rebalancing, easy access and periodic reviews
financial planning, investment proposal, target asset allocation, brokerage and managed accounts, automated rebalancing, in person access and reviews
Investment vehicles
ETFs and direct indexing ETFs and stocks Stocks, bonds, ETFs, mutual funds, options, alternative investments, commodities and structured products
Retail – With financial assets of Rs. 1 million and lower
Mass Affluent – With financial assets between Rs 1 million to Rs. 50 million
HNI - With financial assets between Rs 50 million to Rs. 500 million
Ultra HNI – With financial assets of more than Rs. 500 million
Developments in the robo-advisor space in India
As the prevalence of rob-advisors has increased globally, these platforms have also made their way
to India. Typically, robo-advisors across the globe channelize client’s funds into low-cost index funds
and ETFs. Robo advisors in India offer a variety of mutual funds products. The Indian wealth
management landscape has not witnessed a proliferation of robo-advisors as there is a lack of a wide
range of index funds and ETFs.
Robo-advisers in India are mainly of three kinds:
Basic Ready portfolio of pre-selected funds
Limited risk profiling and customization
Advanced Customized mutual fund portfolio construction; goal-based financial advice
Comprehensive financial counselling (telephonic)
Extensive risk profiling and customization
Evolved
Customized mutual fund portfolio construction
Goal-based financial advice; basic life and health insurance related advice
Tax optimization; expense restructuring
Extensive risk profiling and customization
Robo-advisors operate on a very low-cost model compared to traditional wealth management firms.
In India, most professional financial planners charge Rs.15,000 to Rs.40,000 a year to manage a
client’s portfolio, while wealth management firms, which mainly cater to wealthy clients, charge
0.75% to 1.5% of AUM per year. Robo-advisors are mostly free of cost and earn either from trail
commissions from fund houses or charge a very low advisory fee. The typical fee structure of robo-
advisors is either of the following:

RHP Final Wealth Management Industry Research Report 2021
Page 41 of 98
• Charge levied on investors: They generally charge between Rs.1,000 and Rs.7,500 per annum, or
~0.15% of AUM
• Compensated by fund: They only work on commissions they get from fund houses, with no charge
from investors
Wealth Management Operating Models in the future
• Pure Automated Advisory Model-Suitable for HNIs with basic investment needs with no need
for a personal touch, and primarily relies on technology for investment guidance as well as act
as a touch point.
• Hybrid Advice Model-This model lies in between the above two models and takes advantage
of both technology-driven and traditional advice, where the wealth manager takes the calls
on whether to steer clients to the digital or personal relationship services.
• Holistic Goal-Based Financial Planning and Wealth Management Model-Characterized by a
personal relationship between the client and wealth manager and frequent human
interaction, this model provides holistic and customized advice.
Wealth Management Operating Models in the future
Pure Automated Advisory Model
Hybrid Advice Model Holistic Goal-Based Financial
Planning and Wealth Management Model
RHP Final Wealth Management Industry Research Report 2021
Page 42 of 98
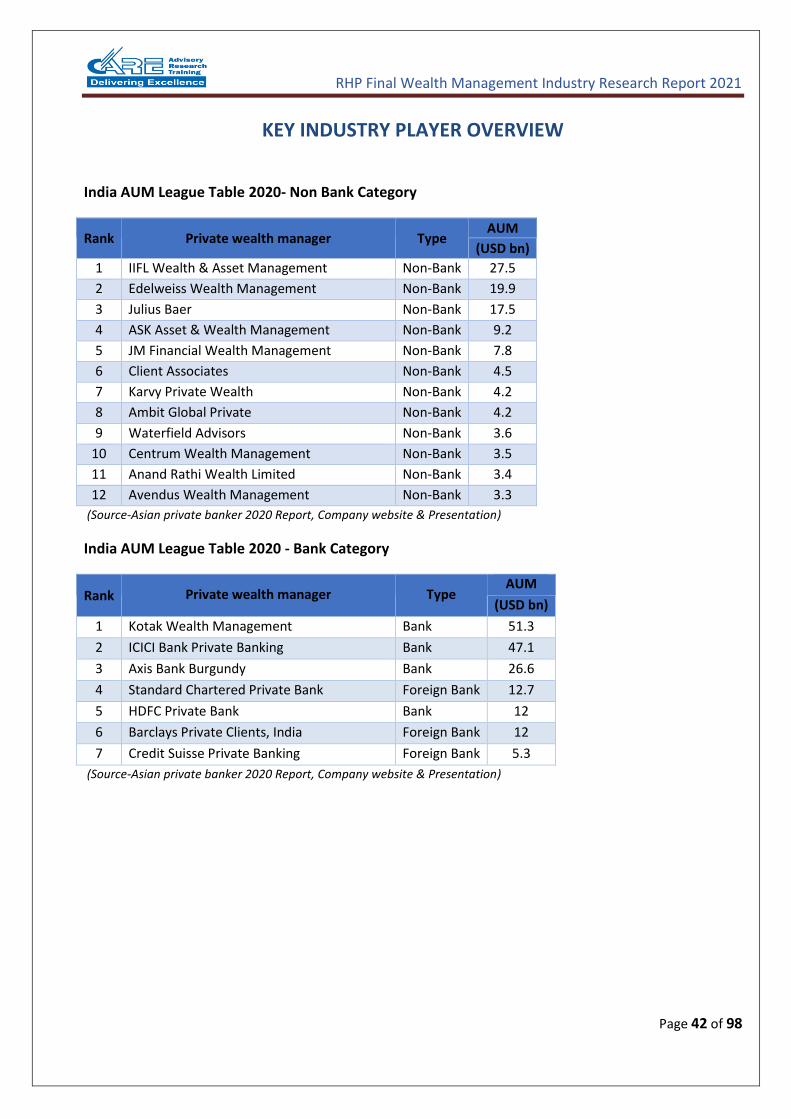
KEY INDUSTRY PLAYER OVERVIEW
India AUM League Table 2020- Non Bank Category
Rank Private wealth manager Type AUM
(USD bn)
1 IIFL Wealth & Asset Management Non-Bank 27.5
2 Edelweiss Wealth Management Non-Bank 19.9
3 Julius Baer Non-Bank 17.5
4 ASK Asset & Wealth Management Non-Bank 9.2
5 JM Financial Wealth Management Non-Bank 7.8
6 Client Associates Non-Bank 4.5
7 Karvy Private Wealth Non-Bank 4.2
8 Ambit Global Private Non-Bank 4.2
9 Waterfield Advisors Non-Bank 3.6
10 Centrum Wealth Management Non-Bank 3.5
11 Anand Rathi Wealth Limited Non-Bank 3.4
12 Avendus Wealth Management Non-Bank 3.3
(Source-Asian private banker 2020 Report, Company website & Presentation)
India AUM League Table 2020 - Bank Category
Rank Private wealth manager Type AUM
(USD bn)
1 Kotak Wealth Management Bank 51.3
2 ICICI Bank Private Banking Bank 47.1
3 Axis Bank Burgundy Bank 26.6
4 Standard Chartered Private Bank Foreign Bank 12.7
5 HDFC Private Bank Bank 12
6 Barclays Private Clients, India Foreign Bank 12
7 Credit Suisse Private Banking Foreign Bank 5.3
(Source-Asian private banker 2020 Report, Company website & Presentation)

RHP Final Wealth Management Industry Research Report 2021
Page 43 of 98
India 2020 RM Headcount League Table- Non Bank Category
Rank Type RM headcount
IIFL Wealth & Asset Management Non-Bank 269
Karvy Private Wealth Non-Bank 259
Anand Rathi Wealth Limited Non-Bank 240
Edelweiss Wealth Management Non-Bank 125
Centrum Wealth Management Non-Bank 132
Motilal Oswal Private Wealth Management Non-Bank 124
Validus Wealth Non-Bank 81
ASK Asset & Wealth Management Non-Bank 68
JM Financial Wealth Management Non-Bank 65
Julius Baer Non-Bank 49
Client Associates Non-Bank 47
Sanctum Wealth Management Non-Bank 40
Avendus Wealth Management Non-Bank 40
(Source-Asian private banker 2020 Report)
India 2020 RM Headcount League Table - Bank Category
Rank Type RM headcount
ICICI Bank Private Banking Bank 1740
Axis Bank Burgundy Bank 573
HDFC Private Bank Bank 309
Kotak Wealth Management Bank 114
IDFC FIRST Bank Wealth Management Bank 94
Credit Suisse Private Banking Foreign Bank 33
(Source-Asian private banker 2020 Report)
As can be seen from the above tables, there are various players in Banking and Non-Banking space
that are growing rapidly like Kotak Wealth Management, IIFL, Edelweiss in terms of AUM and Anand
Rathi, ASK Wealth in terms of number of wealth advisors.
RHP Final Wealth Management Industry Research Report 2021
Page 44 of 98
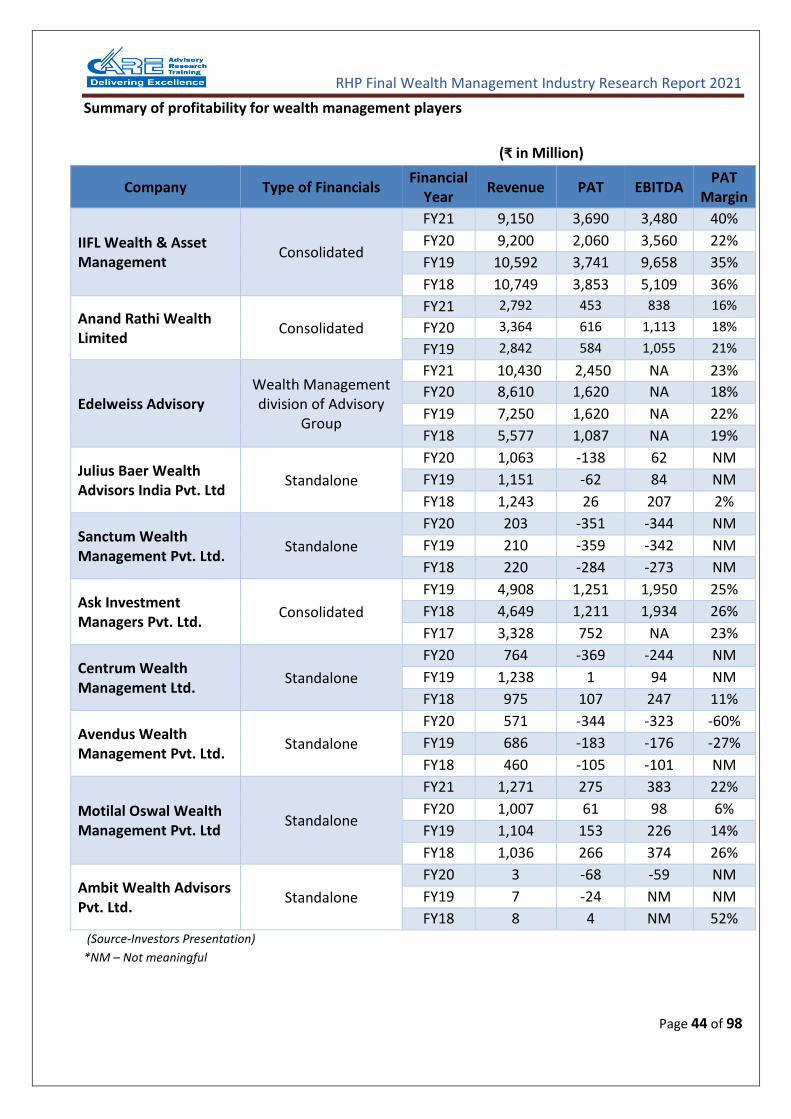
Summary of profitability for wealth management players
(₹ in Million)
Company Type of Financials Financial
Year Revenue PAT EBITDA
PAT Margin
IIFL Wealth & Asset Management
Consolidated
FY21 9,150 3,690 3,480 40%
FY20 9,200 2,060 3,560 22%
FY19 10,592 3,741 9,658 35%
FY18 10,749 3,853 5,109 36%
Anand Rathi Wealth Limited
Consolidated
FY21 2,792 453 838 16%
FY20 3,364 616 1,113 18%
FY19 2,842 584 1,055 21%
Edelweiss Advisory Wealth Management division of Advisory
Group
FY21 10,430 2,450 NA 23%
FY20 8,610 1,620 NA 18%
FY19 7,250 1,620 NA 22%
FY18 5,577 1,087 NA 19%
Julius Baer Wealth Advisors India Pvt. Ltd
Standalone
FY20 1,063 -138 62 NM
FY19 1,151 -62 84 NM
FY18 1,243 26 207 2%
Sanctum Wealth Management Pvt. Ltd.
Standalone
FY20 203 -351 -344 NM
FY19 210 -359 -342 NM
FY18 220 -284 -273 NM
Ask Investment Managers Pvt. Ltd.
Consolidated
FY19 4,908 1,251 1,950 25%
FY18 4,649 1,211 1,934 26%
FY17 3,328 752 NA 23%
Centrum Wealth Management Ltd.
Standalone
FY20 764 -369 -244 NM
FY19 1,238 1 94 NM
FY18 975 107 247 11%
Avendus Wealth Management Pvt. Ltd.
Standalone
FY20 571 -344 -323 -60%
FY19 686 -183 -176 -27%
FY18 460 -105 -101 NM
Motilal Oswal Wealth Management Pvt. Ltd
Standalone
FY21 1,271 275 383 22%
FY20 1,007 61 98 6%
FY19 1,104 153 226 14%
FY18 1,036 266 374 26%
Ambit Wealth Advisors Pvt. Ltd.
Standalone
FY20 3 -68 -59 NM
FY19 7 -24 NM NM
FY18 8 4 NM 52% (Source-Investors Presentation)
*NM – Not meaningful

RHP Final Wealth Management Industry Research Report 2021
Page 45 of 98
In recent years there has been growing concern that individual IFA’s and even small advice firms are being forced out of the market. For many, the weight and cost of complying with regulation have become too heavy to bear if they aren’t shared in a corporate environment with a large support staff that brings economies of scale. This has created some concern that independent financial advice is going to be harder and harder to find. If not because large wealth managers are absorbing smaller players, but because many individual advisors feel it is simply too risky to operate independently.
However, the growing use of technology in the industry may provide a way for IFAs to manage the costs and risks of operating on their own.
Following are the major players who provide a technology platform for IFAs to service their clients & grow their business as on March-2021.
Sr. No. Technology Platform
Providers for IFAs Subscribed IFAs
(appx)
1 OFA 5000+
2 IFA Planet 4200
3 DataComp (Wealth Magic) 3000
4 Redvision 3000
5 Investwell 2500
6 Finsys 2500
7 Vijaya 1600
8 Optimum 1450
9 IFA Now 1000
10 Ticker Wealth 1000
(Source: CART)
Distributor Commissions
As per AMFI, the commissions paid by mutual funds to distributors grew from ₹24,000 million in
fiscal 2013 to ₹66,166 million in fiscal 2021, representing a CAGR of 13.50%. Increased financial
savings, superior returns from mutual funds, greater reliance on distributors and government policies
acted as key catalysts in driving the distribution revenue growth.
Linking of expense ratios with asset size: To cut the cost of investing, SEBI linked expense ratios with
asset slabs in September 2018. This enforced schemes with higher asset size to charge lower expense
ratios. By doing so, SEBI updated accommodated schemes that had become larger over the years.
The total expense ratio (TER) includes expenses such as fund management fee and distribution
commissions. Due to this the total MF distributor commission has reduced in FY19 by 7.06% y-o-y
and 22.41% y-o-y in FY20.

RHP Final Wealth Management Industry Research Report 2021
Page 46 of 98
(Source-AMFI)
Mutual Fund Distributors Commission- Non Bank Category FY2020-21
(₹ in Million) Sr. No. Name of the ARN Holder Gross
Amount Gross
Inflows Net
Inflows Average Assets
Yield on Average Assets
1 NJ IndiaInvest Pvt Ltd 8,739 3,28,872 4,688 7,70,050 1.13%
2 Prudent Corporate Advisory Services Ltd
2,632 1,01,598 5,051 2,49,147 1.06%
3 Anand Rathi Wealth Limited 988 1,57,500 -797 1,11,268 0.89%
4 Darshan Services Private Limited 917 5,97,125 1,41,682 1,80,272 0.51%
5 IIFL Wealth Finance Limited 888 4,23,850 -48,478 2,34,796 0.38%
6 Julius Baer Wealth Advisors (India) Private Limited
709 1,16,605 9,105 1,51,804 0.47%
7 Bajaj Capital Ltd. 655 36,449 -8,442 90,946 0.72%
8 Karvy Stock Broking Limited 596 38,880 -15,484 93,022 0.64%
9 JM Financial Services Limited 591 1,32,751 -1,407 1,07,585 0.55%
10 Geojit Financial Services Ltd 480 18,397 -880 47,104 1.02%
(Source-AMFI)
Note: Non-Bank Category excludes banks and its affiliates
Mutual Fund Distributors Commission- Non Bank Category FY 2019-20
(₹ in Million)
Sr. No Name of the ARN Holder Gross
Amount
Gross
Inflows
Net
Inflows
Average
Assets
Yield on
Average
Assets
1 NJ IndiaInvest Pvt Ltd 7,772 3,02,492 51,843 7,15,608 1.09%
2 Prudent Corporate Advisory Services Ltd 2,297 1,18,460 24,422 2,26,367 1.01%
3 Anand Rathi Wealth Limited 1,149 4,06,325 23,109 1,29,225 0.89%
4 IIFL Wealth Management Limited 1,005 6,41,429 -25,721 1,89,904 0.53%
5 Julius Baer Wealth Advisors (India)
Private Limited
731 1,10,989 -14,708 1,38,850 0.53%
6 Bajaj Capital Ltd. 718 40,974 -3,274 98,267 0.73%

RHP Final Wealth Management Industry Research Report 2021
Page 47 of 98
7 Karvy Stock Broking Limited 666 57,836 -4,436 1,03,468 0.64%
8 Pioneer Client Associates Private Limited 523 48,851 -4,769 67,834 0.77%
9 JM Financial Services Limited 509 3,97,807 -21,842 1,10,779 0.46%
10 Geojit Financial Services Ltd 440 22,383 6,372 45,615 0.96%
(Source-AMFI)
Note: Non-Bank Category excludes banks and its affiliates
Mutual Fund Distributors Commission- Non-Bank Category FY 2018-19
(₹ in Million)
Sr. No Name of the ARN Holder Gross
Amount Gross
Inflows Net
Inflows Average Assets
Yield on Average Assets
1 NJ IndiaInvest Pvt Ltd 8,077 283,566 111,487 629,466 1.28%
2 Prudent Corporate Advisory Services Ltd 2,347 113,772 40,813 190,333 1.23%
3 Anand Rathi Wealth Limited 1,211 278,943 16,340 112,416 1.08%
4 IIFL Wealth Management Limited 1,761 1,446,158 -35,901 305,682 0.58%
5 Julius Baer Wealth Advisors (India) Private Limited
906 109,628 1,615 138,380 0.65%
6 Bajaj Capital Ltd. 921 60,648 -1,447 101,275 0.91%
7 Karvy Stock Broking Limited 880 71,965 10,385 101,702 0.87%
8 Pioneer Client Associates Private Limited 593 32,480 2,343 63,188 0.94%
9 JM Financial Services Limited 622 581,221 -21,257 119,263 0.52%
10 Geojit Financial Services Ltd 463 27,104 10,602 38,153 1.21%
(Source-AMFI)
Note: Non-Bank Category excludes banks and its affiliates
Mutual Fund Distributors Commission- Foreign Bank Category FY 2020-21
(₹ in Million)
Sr. No. Name of the ARN Holder Gross
Amount Gross
Inflows Net
Inflows Average Assets
Yield on Average Assets
1 Citibank N.A. 1,073 1,44,012 -11,298 2,15,368 0.50%
2 Hongkong & Shanghai Banking Corporation Ltd.
845 1,00,456 3,788 1,67,254 0.51%
3 Standard Chartered Bank 767 81,488 -6,172 1,47,125 0.52%
4 Deutsche Bank AG 361 67,126 -8,429 84,045 0.43%
5 DBS Bank India Limited 76 10,243 -3,445 19,125 0.40%
(Source-AMFI)
Mutual Fund Distributors Commission- Foreign Bank Category FY 2019-20
(₹ in Million)

RHP Final Wealth Management Industry Research Report 2021
Page 48 of 98
Sr. No Name of the ARN Holder Gross
Amount Gross
Inflows Net
Inflows Average Assets
Yield on Average Assets
1 Citibank N.A. 1,145 1,37,660 -31,567 2,58,838 0.44%
2 Hongkong & Shanghai Banking Corporation Ltd. 996 90,389 -3,460 1,88,416
0.53%
3 Standard Chartered Bank 765 96,404 -19,265 1,60,837 0.48%
4 Deutsche Bank AG 394 49,870 218 96,282 0.41%
5 DBS Bank India Limited 77 9,09,406 7,922 20,646 0.37%
(Source-AMFI)
Mutual Fund Distributors Commission- Foreign Bank Category FY 2018-19
(₹ in million)
Sr. No. Name of the ARN Holder Gross
Amount paid Gross
Inflows Net
Inflows Average Assets
Yield on Average Assets
1 Citibank N.A 1,818 1,46,246 -8,692 2,86,642 0.63%
2 Standard Chartered Bank 1,507 1,13,552 -526 1,79,049 0.84%
3 Hongkong & Shanghai Banking Corporation Ltd.
1,136 85,601 20,787 1,81,067 0.63%
4 Deutsche Bank AG 511 41,984 -5,073 97,879 0.52%
5 DBS Bank Ltd. 172 2,912 -338 8,020 2.15%
(Source-AMFI)
Mutual Fund Distributors Commission- Indian Bank Category FY 2020-21
(₹ in Million)
Sr. No. Name of the ARN Holder Gross
Amount Gross
Inflows Net
Inflows Average Assets
Yield on Average Assets
1 State Bank of India 4,886 6,72,156 91,670 9,67,115 0.51%
2 Axis Bank Limited 3,930 3,49,775 -59,426 4,39,480 0.89%
3 HDFC Bank Limited 3,440 7,59,135 -78,422 6,71,489 0.51%
4 ICICI Bank Limited 2,272 2,18,014 -39,200 3,85,263 0.59%
5 Kotak Mahindra Bank Limited 1,730 1,91,029 -28,512 3,23,986 0.53%
(Source-AMFI)
Mutual Fund Distributors Commission- Indian Bank Category FY 2019-20
(₹ in Million)
Sr. No Name of the ARN Holder Gross
Amount
Gross
Inflows
Net
Inflows
Average
Assets
Yield on
Average
Assets
1 Axis Bank Limited 4,159 6,86,613 -38,435 5,01,260 0.83%
2 State Bank of India 3,749 6,41,257 1,30,268 8,15,289 0.46%
3 HDFC Bank Limited 2,941 11,21,640 -18,054 7,14,123 0.41%

RHP Final Wealth Management Industry Research Report 2021
Page 49 of 98
3 ICICI Bank Limited 1,856 2,22,872 -19,836 4,05,851 0.46%
4 Kotak Mahindra Bank Limited 1,594 3,05,356 -98,959 3,55,670 0.45%
(Source-AMFI)
Mutual Fund Distributors Commission- Indian Bank Category FY 2018-19
(₹ in Million)
Sr. No Name of the ARN Holder Gross
Amount Gross
Inflows Net
Inflows Average Assets
Yield on Average Assets
1 Axis Bank Limited 5,556 1,345,501 7,558 529,231 1.05%
2 HDFC Bank Limited 4,967 1,367,906 24,305 729,439 0.68%
3 State Bank of India 4,876 920,813 153,682 642,800 0.76%
3 ICICI Bank Limited 3,553 231,425 7,389 418,032 0.85%
4 Kotak Mahindra Bank Limited 2,550 345,036 -36,280 375,548 0.68%
(Source-AMFI)

RHP Final Wealth Management Industry Research Report 2021
Page 50 of 98
OUTLOOK FOR WEALTH MANAGEMENT INDUSTRY IN INDIA
A. Shift in savings from physical assets to financial assets
Historically, households in India have been quite risk averse and wary of investing their savings into
volatile or uncertain return-based assets. A pursuit of safe bets has always driven India towards
making investments in physical assets like gold. However, this pattern is slowly changing over time,
especially post announcement of demonetization in November 2016. Also, the country has seen a
major shift in attitude from capital preservation to wealth creation since FY17.
With a likely growth rate of India’s GDP projected at 9.2% in 2022, the country will remain a key
growth driver of global economy. Against this backdrop, individual wealth in India is expected to
grow at a CAGR of 11.76% till FY25 and is likely to nearly double to Rs. 8,11,293 billion by FY25*. In
the next five years, financial assets will witness much faster growth rate as compared to physical
assets. As far as individual contribution is concerned, financial assets are expected to form almost
63% of the total individual assets by FY25 vs 57% in FY20, physical assets are expected to be
restricted to 37% of the total wealth vs 43% in FY20*. The reduction in bank deposit rates in the past
year has further led to a shift in investment to mutual funds and the stock markets. *(Source-Karvy India Wealth Report 2020)
The implementation of various reforms such as GST, RERA, new insolvency and bankruptcy code and
recapitalization of banks & Corporate Tax cuts among others are likely to shift informal sectors into
the formal economy and hence, boost GDP growth and individual wealth in the medium to long term.
(Rs. in Billion)
Category FY 15 FY 16 FY 17 FY18 FY19 FY20 FY25P
Financial Assets 160,560 177,880 201,289 236,347 2,62,106 2,62,912 5,12,157
Physical Assets 119,890 132,270 142,894 156,101 1,67,942 2,02,282 2,99,136
Total 280,450 310,150 344,182 392,448 4,30,048 4,65,194 8,11,293 (Source-Karvy India Wealth Report 2020)
(Source-Karvy India Wealth Report 2020)

RHP Final Wealth Management Industry Research Report 2021
Page 51 of 98
a. Projected financial wealth – Asset Class Wise distribution in FY25
Financial assets are likely to almost double by FY25 to reach a figure of Rs. 5,12,157 billion as
compared to Rs. 2,62,912 billion in FY20. Direct Equity investments is expected to be the key growth
driver for the future and expected to grow at a CAGR of more than 21.9% over the next 5 years. The
positive sentiment also helped propel Mutual Funds which grew at over 17.9% over the previous year
as individuals increasingly identify this asset class as a better way to participate in the equity
markets. It is therefore expected that by FY25, the share of financial assets in the total investment
pool will rise to 63% from 57% in FY20.
Projected Financial Wealth Asset Class Wise Distribution (Rs. in Billion)
Category FY17 FY18 FY19 FY20 FY25 Proportion
FY20 Proportion
FY25
Fixed Deposits & Bonds 39,093 42,097 45,820 48,691 78,357 18.52% 15.30%
Direct Equity 37,583 48,976 52,103 36,115 97,319 13.74% 19.00%
Insurance 30,012 33,359 36,907 38,020 68,895 14.46% 13.45%
Saving Deposits 28,837 30,968 34,223 37,455 53,762 14.25% 10.50%
Cash 12,641 17,597 20,522 23,497 33,933 8.94% 6.63%
Provident Fund 13,043 14,482 16,628 20,438 36,720 7.77% 7.17%
Mutual Funds 8,684 11,680 13,770 11,909 27,151 4.53% 5.30%
NRI Deposits 7,572 8,197 9,020 10,326 17,164 3.93% 3.35%
Unlisted Equity 6,986 9,559 10,543 13,032 60,035 4.96% 11.72%
Small Savings 6,679 7,366 8,610 9,836 15,070 3.74% 2.94%
Current Deposits 4,132 4,309 4,872 2,118 3,036 0.81% 0.59%
Pension Funds 4,752 6,039 7,249 9,017 15,289 3.43% 2.99%
Alternative Investments 930 1,241 1,491 2,000 4,247 0.76% 0.83%
International assets 207 260 341 458 1,181 0.17% 0.23%
Sukanya Samriddhi 138 216
Total 2,01,289 2,36,347 2,62,106 2,62,912 5,12,157 100.00% 100.00% (Source-Karvy India Wealth Report 2020)
India has the lowest mutual fund penetration globally. The total Assets under Management (AUM) to
GDP ratio of India stands at a mere 16% below the global average of 63% in 2020. Countries like US
have AUM to GDP ratios of over 100%. Hence, the mutual fund industry in the country presents huge
scope for growth and development.

RHP Final Wealth Management Industry Research Report 2021
Page 52 of 98
b. Projected physical wealth – Asset Class Wise distribution in FY24
Despite rise in share of financial assets, physical assets will remain resilient to an extent. Individual
wealth in physical assets is likely to grow at a CAGR of 7.56% to around Rs. 270,783 billion in FY24
from Rs. 202,282 billion in FY20. Real estate (43.67% contribution in FY24) and gold (48.69%
contribution in FY24) will remain the most favored asset classes in the overall physical assets pie.
Meanwhile, performance of physical assets will remain subdued as compared to financial assets
primarily due to factors like attitudinal shift, liquidity, faster growth of equity markets among others.
Projected Physical Wealth Asset Class wise Distribution
(Rs. in Billion)
Category FY17 FY18 FY19 FY20 FY24 Proportion
FY20 Proportion
FY24
Gold 68,450 74,513 80,941 1,09,500 1,31,848 54.13% 48.69%
Real Estate 60,250 69,568 74,529 80,145 1,18,247 39.62% 43.67%
Diamond 7,980 8,384 8,581 8,304 14,318 4.11% 5.29%
Silver 2,290 1,319 2,427 2,854 3,718 1.41% 1.37%
Platinum 70 77 85 82 129 0.04% 0.05%
Others Gems and Jewellery 1,050 2,243 1,376 1,394 2,520 0.69% 0.93%
Total 140,100 1,56,104 167,942 2,02,282 2,70,783 100.00% 100.00%
(Source-Karvy India Wealth Report 2020)
Wider Reach of Wealth Management Industry
Increasing awareness levels, attitudinal shift to grow wealth rather than preserve wealth and the
advancements in technology would define the wealth management needs of this potential clientele.
The players who would be successful in catering to this increased demand would be required to
develop cost effective methods to service this clientele in a relevant manner. Technology adoption is
likely to play an important role in deciding the winners in this sub segment.
Consolidation in Indian Wealth Management Industry
The wealth management industry is also witnessing market consolidation along its value chain. In
addition, private equity funds are increasingly looking to participate in the growth story of Indian
wealth management industry.

RHP Final Wealth Management Industry Research Report 2021
Page 53 of 98
Key transactions in Indian Wealth Management/Asset Management Industry
Date Target Investor
Jan-2021 Principal Asset Management Sundaram Asset Management Company
(Acquisition 338.53 crore (US$ 46.78 million)).
Sep-20 Groww Wealth Management YC Continuity fund & Sequoia India
Invested US$ 30 Million
Aug-20 Edelweiss Global Wealth
Management limited
PAG agreed to invest Rs. 2244 Crs for 51 % stake
Aug-20 Yes Bank MF White Oak Capital Management
Dec-19 Waterfield Advisors Zephyr Management, Vernalis Capital, Gaja
Advisors, TVS Capital Funds, Dalmia Family
Office, Individuals
Nov-19 IDBI AMC Muthoot Finance
Aug-19 L&T Capital Markets Ltd IIFL Wealth Management Ltd.
June - 19 Wadhawan Wealth Managers Pvt.
Ltd. (Subject to regulatory
approval)
LGT Impact Ventures
Oct-18 Wealth Advisors IIFL Wealth Management Ltd.
Jun-18 IIFL Wealth Management Ward Ferry, RIMCO, Amansa, GA, Steadview,
HDFC Life
Apr-18 Sanctum Wealth Management
Pvt. Ltd.
Multiples Alternate Asset Management Pvt. Ltd.
Dec-17 Fullerton Securities & Wealth
Advisors Ltd.
Blueblood Ventures Ltd.
Feb-17 Religare Wealth Management Ltd. Anand Rathi Wealth Services Ltd.
Dec-16 ASK Investment Managers Pvt.
Ltd.
Advent India PE Advisors Private Ltd.
Apr-16 The Royal Bank of Scotland NV
India
Sanctum Wealth Management Pvt. Ltd.
Oct-15 IIFL Wealth Management Ltd. General Atlantic LLC
May-13 Morgan Stanley Private Wealth
Management
Standard Chartered Bank
Other trends in India’s wealth management space
There is increasing trend of HNIs investing in unlisted equity to be part of the startup / private equity
story apart from the quest to have higher anticipated returns on account of unlocking of potential
valuations upon listing on stock exchanges. There is an increasing trend of ultra HNIs looking at
engaging with Family Office set-ups to not only help them in managing investments but also help in
ensuring a relevant structure to preserve, grow and manage their wealth for generations to come.

RHP Final Wealth Management Industry Research Report 2021
Page 54 of 98
Emergence of Robo Advisors:
1. Impact of robo-advisors on the wealth management space
The new mass affluent investors have not been well-served by traditional private wealth managers,
especially because of the absence of a viable business model. Financial advice from such traditional
wealth managers requires a higher minimum investment than what many small investors can afford.
The only available option so far for such investors was to either do it themselves, or avail the services
of distributors or IFA’s, or explore traditional investment instruments such as term deposits.
With the introduction of robo-advisors, investors have access to the same professional advice at a
lower cost and with a more affordable minimum investment amount. Robo-advisors have brought
accessibility, transparency, simplicity and unbiased opinion to the whole investment process,
especially for small investors. It is more attractive to a generation that demands speed,
customisation, accuracy and control from their financial advisers. With new use of data, analytics
span the spectrum from institutional trading and risk management to even small notional retail
wealth management.
Globally as well, Robo-advisors are swarming into the wealth management industry. They have been
able to develop a streamlined digital experience for clients, which had been largely lacking in
traditional wealth managers’ digital offerings. This combined with increased transparency and lower
fees have the ability to make wealth advice economically feasible for the mass market.
Globally, the current market share of robo-advisor firms is marginal as they have only gained a
miniscule share of (AUM) but several companies already have over US$ 1bn of AUM. Several
research studies forecast that robo-advisors are going to witness significant growth going forward as
these firms have managed to make quality financial advice available across demographics at an
affordable cost. Robo-advisors will be key to unlocking access to the mass market services, which, in
turn, would help in growing the overall wealth management market. Moreover, these firms have
received strong funding support from venture capital funds. The study predicts that the total market
size for hybrid robo-advisors (Hybrid Robo-advisory is robo-advisory with substantial component of
human interaction to the use of software for the client advisory process) will further increase to US$
16.3 trillion by 2025, which will be 10% of total investable wealth around the world by that date. In
contrast pure robo-advisors (fully automated) are likely to hold only 1.6% of the total global wealth
by the middle of the next decade.
Robo-advisors steps to streamline the client online experience, provide greater transparency and
improve the economics for the mass segments are irreversible and they are making traditional
financial advisers rethink their business models. According to research by Accenture, robo advisors
could result in possible fee reduction of as much as 70% for some services. Traditional advisors will

RHP Final Wealth Management Industry Research Report 2021
Page 55 of 98
need to ensure that their service offering is commensurate with the fees tagged to it. Moreover,
robo-advisors will also force traditional advisers to increase focus on their digital channels.
2. International trends in robo-advisory
Since the launch of Robo Advisory, it has gained significant traction. There are predominantly two
types of players in this space internationally 1) independent robo-advisors 2) Leading investment
managers with robo-advisor capabilities. Below are some of the key players operating in this space.
Leading Independent Robo-advisors
1. Betterment 4.Wealthfront
2.Hedgeable 5.WiseBanyan
3.SigFig Wealth Management 6.Personal Capital Corporation
Leading Investment Managers With Robo-advisor capabilities built in-house or acquired
through MLA
1. Fidelity Investments 10. NatWest Holdings Limited
2. UBS Group AG 11. Royal Bank of Canada
3. Legg Mason 12. The Charles Schwab Corporation
4. Morgan Stanley 13. The Vanguard Group
5. HSBC Holdings 14. John Hancock
6. Bank of America Corporation (Merrill Lynch) 15. E-Trade Financial Corporation
7. Envestment Management 16. Goldman Sachs
8. Capital One Financial Corporation 17. BlackRock
9. TIAA Holdings 18. CBOE Global Markets
Robo-advisory market is expected to grow to US$ 5tn by 2025.

RHP Final Wealth Management Industry Research Report 2021
Page 56 of 98
With over 300% growth expected in AUM managed by Robo-Advising (AUM (US$B))
(Source-Reuters, Gartner, Venture Scanner, Press search)
Partnership route has also been actively pursued as the same can deliver promptly-realized
advantages through process automation, cost reduction and the attraction of new customers. This
route also avoids the costs and risks inherent in implementing a customer solution into legacy
systems. Select transactions in this route include:
Partnerships
1. U.S. Bancorp -> Motif Investing
2. Pershing ->Marstone Limited
3. RBC Advisor Services ->Next Capital Advisers Inc.
4. Wells Fargo & Co ->SigFig Wealth Management
5. BBVA Compass ->Future Advisor (Owned by BlackRock Inc)
Other leading players including Standard Chartered, Charles Schwab, UBS, Vanguard, Deutsche Bank,
Fidelity and Merrill Lynch have tried to build robo advisory capabilities in-house. The objective has
been to enable advisors to promote it as a low-cost alternative to traditional advisory services and
provides the flexibility to offer varying functionality to help attract new investors.
Robo-advisory platforms of established players have proven successful in gaining market share:
340%
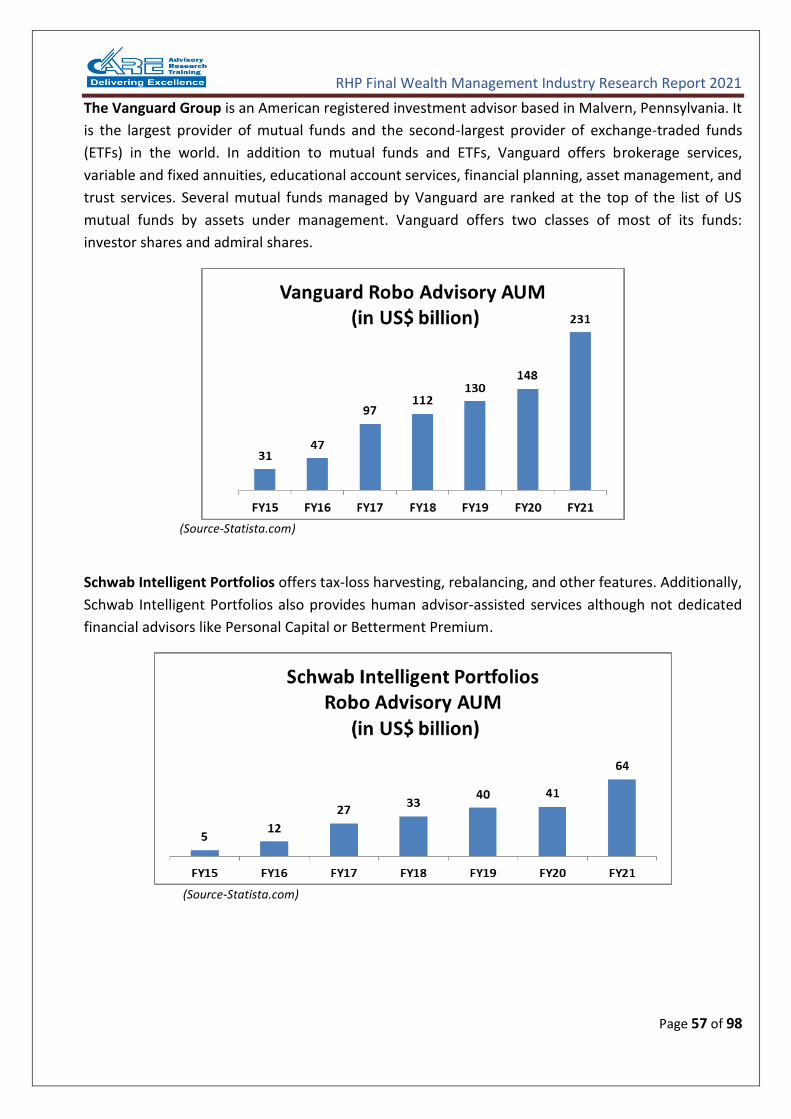
RHP Final Wealth Management Industry Research Report 2021
Page 57 of 98
The Vanguard Group is an American registered investment advisor based in Malvern, Pennsylvania. It
is the largest provider of mutual funds and the second-largest provider of exchange-traded funds
(ETFs) in the world. In addition to mutual funds and ETFs, Vanguard offers brokerage services,
variable and fixed annuities, educational account services, financial planning, asset management, and
trust services. Several mutual funds managed by Vanguard are ranked at the top of the list of US
mutual funds by assets under management. Vanguard offers two classes of most of its funds:
investor shares and admiral shares.
(Source-Statista.com)
Schwab Intelligent Portfolios offers tax-loss harvesting, rebalancing, and other features. Additionally,
Schwab Intelligent Portfolios also provides human advisor-assisted services although not dedicated
financial advisors like Personal Capital or Betterment Premium.
(Source-Statista.com)

RHP Final Wealth Management Industry Research Report 2021
Page 58 of 98
Value of AUM of selected Robo-advisors worldwide as of March 2021
(Source-Statista.com)
Risks to Wealth Management Industry
Going forward, we expect wealth managers to focus on the below areas that will impact the
industry.
Regulatory landscape: Regulators are moving their focus towards other parts of the financial system
including private wealth managers. There is an increased regulatory focus on transparency of pricing,
fees and independence of PWMs. Changes to commission and incentive structures and obligations
could change intermediaries’ product selection processes. Regulation of distribution through digital
channels and robo-advice could also change.
Privacy: Security and privacy are HNWIs’ key concerns about digital technology, and more than half
of HNWIs are concerned about exploitation generally. However, they are becoming increasingly
comfortable with the use of technology and now expect online and digital functionality in many
aspects of their lives. Wealth managers will have to continue to strengthen their existing
infrastructure to protect against potential security breaches.
Business model disruption: The rise of technology solutions could disrupt the value chain including
competition from quantitative investment technologies that have the potential to assimilate more
data and make investment decisions, and which will help to realize alpha more efficiently than active
managers. Increased investment and asset allocation through robo-advice services could displace
active management and an increased asset allocation to passive investments.
Rising costs: Rising costs within the industry driven by changing and increasing regulatory
requirements and technological advancement could impact margins. This effect is further
accentuated by downward pressure on fees charged by the wealth managers.

RHP Final Wealth Management Industry Research Report 2021
Page 59 of 98
Regulatory Guidelines on Wealth Management Services:
The regulatory environment in the Indian wealth management industry is still evolving. This presents
opportunities for established wealth managers to expand their offerings. Regulations covering
fiduciary duties and investor protection are imminent.
Some key proposals/guidelines by regulators affecting the Indian wealth management space:
SRO for wealth management
In 2011, capital markets regulator, SEBI proposed an SRO for the Indian wealth management sector
that would help regulate business and serve as a medium for SEBI to implement various wealth
management initiatives.
Investment advisor guidelines by SEBI
SEBI’s Investors Advisor Regulations, which came into force in January 2013, focuses on the
independence of investment advisors. According to the new regulations, investment advisory
services have to be separated from all other activities such as distribution. A distributor can sell
product but cannot offer advice. In addition, banks, NBFCs and various corporate bodies would have
to set up a separate subsidiary for investment advisory services.
Any entity/individual willing to engage in the business of providing investment advice to clients is
required to be registered with SEBI. Moreover, an investment advisor should be professionally
qualified, with a post-graduate degree in finance, accountancy, business management, banking, etc.
or a graduate degree with relevant experience of at least five years. The individual also needs to be
certified by NISM or FPSB. To be an investment advisor, corporate bodies need to have a minimum
net worth of Rs.2.5 million and individuals Rs.0.1 million.
Investors should ensure proper risk-profiling of clients, and the investment advice provided should be
appropriate to the client’s risk profile. Investors also need to maintain a record of KYC, risk profiling
and assessment, suitability assessment of advice provided, agreements with clients, investment
advice provided (written as well as oral), rationale for arriving at investment advice and a list of
clients with date of advice, nature of advice and fees charged.
SEBI guidelines for MF scheme classification
SEBI introduced guidelines in October 2017 on consolidation and merger of mutual fund schemes
with the aim to make it simpler for the investors to compare various mutual fund schemes.
Moreover, it will reduce the clutter and make it simple to compare performance amid a level-playing
field.

RHP Final Wealth Management Industry Research Report 2021
Page 60 of 98
In a bid to reduce the number of schemes in mutual funds, SEBI recently came out with uniform
definitions for fund categories. SEBI’s move will be applicable only on open-ended funds. The market
regulator has broadly divided mutual funds into five categories-
• Equity funds
• Debt funds
• Hybrid funds
• Solution-oriented funds
• Other funds
To ensure uniformity, the following definitions of large cap, mid cap and small cap were adopted:
Large Cap: 1st -100th company in terms of full market capitalization
Mid Cap: 101st -250th company in terms of full market capitalization
Small Cap: 251st company onwards in terms of full market capitalization
Overall, there are over 1,789 Schemes in the industry. Out of them, 696 are close-ended Schemes,
1018 are open-ended Schemes as on March 2021. (Source: www.sebi.gov.in)
The RBI’s guidelines on regulating wealth management services (WMS)
In June 2013, the Reserve Bank of India (RBI) issued draft guidelines on wealth management and
distribution services offered by banks:
In April 2016, RBI asked banks that currently offer investment advisory services through an internal
department to reorganize their operations within three years and set up a subsidiary for investment
advisory services. This is to ensure an arm’s length distance between banking activities and
investment advisory services. Banks will need specific approval from the RBI to set up the subsidiary.
The subsidiary would have to be registered with SEBI and would be subsequently regulated by SEBI.
Banks must ensure segregation of the marketing function from operational processes, such as
approval/transaction processes at branches. Banks must ensure that the sales process is transparent
and products are sold through trained employees in bank branches. Banks should strictly follow KYC
and AML rules, have a robust internal grievance redressal machinery, and prevent their staff from
receiving any incentive (cash as well as non-cash) directly from a third-party issuer.
Regulatory pressure is forcing wealth management players to rework operating models
After the announcement of the Investor Advisors Guidelines, there has been increased focus on
client centricity, fiduciary responsibility and compliance. Regulatory requirements regarding advisor
qualifications, infrastructure, risk profiling and suitability criteria have become more stringent. For

RHP Final Wealth Management Industry Research Report 2021
Page 61 of 98
the past few years, there has been a push from regulators and industry bodies to move toward a trail
commission– based model and reduce up-front commissions to reduce misselling and the chances of
churn.
One of the biggest impediments to the current wealth management model is the stipulation that
investment advisors must maintain an arm’s length from distribution activities. The income of
investment advisors must be in the form of fees from clients and not through commissions earned on
the distribution of mutual fund products. Players are skeptical about separating advisory and
distribution businesses as this may prove to be an inconvenience. Moreover, the cost of running two
separate firms is high.
Additional regulatory layer proposed by SEBI may keep foreign players away from Indian wealth
management business
With the aim to root out undeclared wealth and ensure tax compliance, SEBI wants to gain oversight
of foreign banks managing Indian wealth. The capital market regulator has reached out to large
international banks and wealth managers to register their offshore units with SEBI if they are
soliciting business in India. By registering with SEBI, private banks would have to admit to managing
funds of wealthy Indian clients and may also prompt further requests from SEBI to share information.
Many foreign banks and wealth managers have already exited the Indian wealth management
business because of the high cost of operations and regulatory burden. This might deter foreign
players from having any presence in the Indian wealth management segment and offering services to
wealthy Indians. The Royal Bank of Scotland NV India and Morgan Stanley Private Wealth
Management are Foreign Players who have recently exited the wealth management business in
India.
Government Initiatives to improve financial inclusion:
The Government has undertaken certain key initiatives to promote financial inclusion in the country.
This is expected to further increase financial savings as more people have access to financial services.
A few of the key reforms are described below:
Pradhan Mantri Jan-Dhan Yojana-Launched in August 2014, the PMJDY scheme aims to bring all the
citizens under the purview of formal banking system and ensure access to financial services at an
affordable price, including savings and deposit bank accounts, remittances, credit and insurance.
Pradhan Mantri Jeevan Jyoti Bima Yojana-Launched in 2015, the PMJJBY is a Government-backed
insurance scheme that offers life insurance coverage of Rs.200,000 in exchange for an annual
premium of Rs.330 per member, which is renewable every year.
Pradhan Mantri Suraksha Bima Yojana: The PMSBY is an accident insurance scheme that provides a
coverage of Rs.200,000 for accidental death and permanent total disability, and Rs.100,000 for
permanent partial disability, in exchange for an annual premium of Rs.12 per member. Over 100
million people have registered for the PMJJBY and PMSBY insurance schemes.

RHP Final Wealth Management Industry Research Report 2021
Page 62 of 98
(Source- PMDJY.gov.in)
No. of Accounts Opened under PMJDY (In Million)
Jan-15 Sep-2021*
Rural Urban No of Accounts
Rural Urban No Of Accounts
Public Sector Bank 53.3 45.1 98.4 214.1 129.0 343.1
Rural Regional Bank 18.5 3.3 21.8 69.1 9.8 78.9
Private Banks 3.2 2 5.2 7.0 5.7 12.7
Total 75 50.5 125.5 279.3 143.8 434.7 *Data as on 22-September-2021
Aadhaar Programme: India launched Aadhaar in 2009 with the then-improbable goal of giving every
Indian a single digital identity in the form of a biometric authenticated 12-digit number. Citizen
identity is an important aspect of effective governance. It is the world’s largest biometric ID system,
with over 1.30 billion unique identification accounts as of August 31, 2021. Aadhaar - enabled
transactions are playing a huge role in contributing to the government’s mission of making India a
less-cash economy by enabling seamless electronic KYC.
Mobile: Mobile has become an integral part of life for almost everyone in the last decade. The
evolution in communication technology provides opportunities for the government to connect to the
citizens and provide better governance. Currently India is the 2nd largest telecom market in the
world with 1.18 billion subscribers out of which 1.16 billion use wireless means to communicate.
There is an exponential rise in terms of internet users as well as smartphone users in the country.
The lack of banking infrastructure poses a serious problem mostly in rural India for getting money
from banks to the last man. Additionally, over the last few years, the Government has actively

RHP Final Wealth Management Industry Research Report 2021
Page 63 of 98
undertaken multiple initiatives to improve digitization in the Country. These include a combination of
schemes to biometrically identify all Indian citizens with the Aadhaar programme and to promote
financial inclusion through ‘Jan Dhan Yojana’, the launch of Aadhaar-enabled payments systems and
encouraging online tax filings.
Increasing Smartphone penetration:
(Source-Statista.com)E- Estimated
Direct Benefits Transfer (DBT): The Government launched the DBT scheme, with an aim to transfer
government subsidies and payments directly into the bank accounts of beneficiaries leading to higher
transparency in the system. The introduction of PMJDY accounts has enhanced the effectiveness of
the DBT scheme.
(Source- dbtbharat.gov.in)
Besides the above, the Government has also undertaken several key structural reforms for the
economy. Key initiatives include:

RHP Final Wealth Management Industry Research Report 2021
Page 64 of 98
Demonetization: On November 8 2016, the Government of India announced the demonetization of
high currency notes of Rs 500 and Rs 1000 in order to tackle black money lower the cash circulation
in the economy and to eliminate fake currency terrorism funding. Demonetization has nudged the
Indian economy toward more formal ways of operating and saving and expanded the tax base. There
has been an emphasis on digital payments. Demonetization has reduced the value of real estate
(with an expected decline in real estate prices) and gold (with the curbs on cash transactions) as
forms of savings. It led to a shift towards investment alternatives like capital market instruments
such as mutual funds both directly and indirectly.
Goods and Services Tax (GST): GST has been implemented with effect from July 1, 2017 and has
replaced the indirect taxes on goods and services such as central excise duty, service tax, central
sales tax, state VAT and surcharge collected by the central and State Governments. GST will bring
about a uniformity in process and centralized registration that will make starting a business and
expanding in different states much simpler. GST’s objective is to simplify the tax regime by reducing
the multiplicity of taxes. The gross GST revenue collected in the month of April 2021 is at a record
high of Rs 1.41 trillion, of which CGST is Rs 278.37 billion, SGST Rs 356.21 billion, IGST Rs 684.81
billion (including Rs 295.99 billion collected on import of goods) and cess Rs 94.45 billion (including
Rs 9.81 billion collected on import of goods).
Vaccination details
The vaccination exercise as a tool to protect the most vulnerable population groups in the country
from COVID-19 continues to be regularly reviewed and monitored at the highest level.
The countrywide vaccination drive was rolled out on January 16, with the healthcare workers (HCWs)
getting inoculated in the first phase. The vaccination of the frontline workers (FLWs) started from
February 2. The next phase of COVID-19 vaccination commenced from March 1 for people over 60
years of age and those aged 45 years and above with specified co-morbid conditions. The country
launched vaccination for all people aged above 45 years from April 1. The government then decided
to expand its vaccination drive by allowing everyone above 18 years of age to be vaccinated from
May 1.
Nearly 890 million COVID-19 vaccine doses have so far been administered in the country till 30th
September 2021.
According to the ministry’s data, a total of 650 million first doses and 240 million second doses of the
vaccine have been administered across the country.

RHP Final Wealth Management Industry Research Report 2021
Page 65 of 98
PRODUCT OVERVIEW
Structured Products
Structured Products / market-Linked debentures (MLD) are a blend of fixed-income and derivative
instruments. Its layer of derivatives gives it the flexibility needed to blend with a portfolio and
enhance its risk-to-return performance while matching an investor’s objectives.
Market-Linked Debentures (MLD) is a debt instrument that differs from a standard fixed-income
security in the sense that the coupon on the instrument is linked to a variable market indicator such
as an equity index, commodity price such as gold, etc. Structured Products / MLDs are generally close
ended hybrid instruments which could be either with principle protection or without principle
protection. The underlying security is generally a non-convertible debenture of the issuer linked to an
equity index (nifty 50, bank nifty etc), 10 year G-Sec, gold index etc. They are issued for the period of
13 months to 60 months. Unlike a bond that pays a fixed interest either monthly, quarterly, half
yearly or annually, MLDs do not pay any regular income, it comes only at maturity. Theoretically
these MLDs can be considered to be a zero coupon bond and an embedded customized payoff that
could be an equity option.
MLDs are primarily of two types. First type wherein MLD is a principal-protected instrument designed
to return 100% of the original investment at maturity subject to credit risk of the issuer. While a
portion of the capital may be invested by the issuer in debt instruments to bring in the feature of
capital protection, the return may be linked to an external market indicator such as equity index to
capture the market upside.
In the second type, the issuers may also issue non-principal protected instruments wherein both the
principal as well as coupon are linked to performance of external market indices.
SEBI had released guidelines for issue and listing of structured products/market linked debentures on
September 28, 2011. These guidelines specify that for Principal Protected Market Linked Debentures,
credit rating agency shall prefix ‘PP-MLD’ followed by standardised rating symbols for long
term/short term as per SEBI circular dated June 15, 2011.
Advantages of MLDs -
These products come with predefined payoffs and tend to provide good risk adjusted returns on
the overall portfolio
These products can be historically back-tested from the time Futures and options were
introduced in India (Jan-2001) to ensure that they have high probability of generating the
desired returns
These products are all weather products – can be structured depends on the expected market
movement.
RHP Final Wealth Management Industry Research Report 2021
Page 66 of 98
As on June 20, 2019, the total rated volume for PP-MLD increased to Rs.450 billion from ~Rs.370
billion at the end of FY19. During Q1FY20 some NBFCs/HFCs/MFIs rated AA- and below raised fund
via MLDs which accounted for around 11% of total MLD issuances in Q1FY20. This indicates
increasing interest of investors for lower rated MLDs for higher yields/returns.
However, Indian MLD market issuance is minuscule as compared to EU, USA and other Asian
countries. At the end of FY19, EU’s structure product market was ~US$ 300 billion, while India’s
structured product market (known as MLD) was merely ~US$ 2 billion. In India, MLD issuances in
FY19 accounted for merely 1% of AUM of private wealth industry (Top 25 companies AUM as per
Asian Private Banker/Wealth Manager report), lead arrangers/distributors of MLDs.
This is primarily due to both demand and supply side expansion. The demand of MLDs grew on
account of
- Higher participation from corporates in addition to existing HNIs,
- Increase in ticket size
- Acceptance of MLDs with underlying other than Nifty (i.e. G-sec, corporate bonds etc.)
- Investors’ emphasis on downside protection in volatile market conditions.
The supply side of market grew on the back of
- Rise in number of issuers and
- Increase in number of distributors.
The tenure of these MLDs ranges between 13 to 60 months depending upon issuers funding
requirement. The average maturity of MLDs issued has been 2.89 years in FY19 as against average
maturity of 2.92 years in FY18.
MLDs are of two types i.e. principal protected (PP) and non-principal protected (NPP). Investor’s
inclination towards downside protection continued supporting PP-MLDs share which accounted for
95% of the total issuances in Q1FY20. The average monthly borrowing via PP-MLDs is expected to
increase to Rs. 13 billion from ~Rs.10 billion in FY19.

RHP Final Wealth Management Industry Research Report 2021
Page 67 of 98
Proportion of MLDs with different underlying index
(Source – CARE Ratings report on Market Linked Debentures: issuance at 5-year high)
Portfolio management services
AMCs in India have started offering strategies with higher flexibility to investors through PMS. As of
September 29, 2021, there were 360 portfolio managers registered under the SEBI. This avenue has
seen a sharp rise in the asset size, which increased more than thrice to Rs.5,727 billion as of July 2021
from Rs.1,430 billion as of March 2013.
This AUM can be classified under three sections – non-discretionary, discretionary and advisory.
Discretionary assets dominated the PMS space with a 84.6% share, followed by advisory (8.8%) and
non-discretionary (6.6%).

RHP Final Wealth Management Industry Research Report 2021
Page 68 of 98
WEALTH MANAGEMENT INDUSTRY IN INDIA
Wealth Management, in contextually has been in existence for quarter of a century in India. From
serving the Ultra-Rich individuals and families way back in the 1970s to what it is today, Wealth
Management has evolved to become a multi-disciplinary approach with multiple solutions. However,
from single product advisory to a multi-product, goal-oriented wealth management approach has
been a gradual progression.
This line of business function can credit its emergence from the banking system. The banks in the
1970s have functioned merely on deposits and providing credit to investors. With the emergence and
expansion of the banking system in the 1970s, India’s savings rate rose from 16% of the GDP (Gross
Domestic Product) from early 1970s to 35% of the GDP by 1980. While financial deepening through
banks played its vital role, rising per capita income and diminishing share of agriculture in the GDP
also helped. This period was aptly called the Golden Era, as far as Indian Savings were concerned.
Banking till 1970s has been mostly about, accumulating and preserving wealth within the boundaries
of bank deposits. Early 1970s also saw the rise of Insurance Advisory, specifically life insurance. Life
Insurance Corporation of India (LIC) since its formation in 1956 has played a vital role in insuring lives
till then. Apart from mere risk cover, LIC encouraged investors to consider investments through its
conventional plans. An Indian Investor till 1980s, considered a bank account and an LIC policy as his
means to accumulate wealth. Though the UTI started in 1963, it took UTI 25 years to reach AUM of
Rs.67,000 million. With the emergence of the Bombay Stock Exchange (BSE) in 1980s, there emerged
a new avenue to make investments, shares or stocks as it is popularly known. However, this was
essentially for the risk friendly investors and neither could many comprehend nor have access to.
However, it was during the second phase of the Mutual Fund Industry (1987-1993), did High Net
worth Investors take cognizance of the Mutual Funds and Capital markets in total. By 1993, the
Mutual Funds AUM touched Rs.470,000 million, with the emergence of non-UTI, PSU mutual funds.
By then Life Insurance business was open to Non LIC, private participants as well. Banks and financial
institutions, found a new revenue model with a combination of Mutual Funds, Insurance and
Deposits.
Wealth Management today, has evolved to an end to end Money Management Solutions for every
investor ranging from an Individual Investor / family, Corporate Investor, HUF (Hindu Undivided
Family) to a Trust. Private Wealth Management involves providing prudent investment solutions,
Corporate and Treasury Advisory, Off Shore Advisory and Family Office.

RHP Final Wealth Management Industry Research Report 2021
Page 69 of 98
Average Returns by various benchmarks
Benchmarks 10 year Average
(1 year rolling returns)
G-sec Yield 7.50%
Crisil Short Term Bond 8.36%
Nifty 50 (Ex dividend) 12.21%
Nifty Midcap (Ex Dividend) 15.29%
Nifty Small Cap (Ex Dividend) 14.32%
*Data till September 2021
Importance of Wealth Management in India:
The Hurun Research Institute published its annual report in March 2021, where it mentioned that
from its survey it found that the average age of an India Millionaire (With net-worth above USD1mn)
was 38 years, one year older than last year. This population seeks a wealth manager as they neither
have the expertise nor the time to monitor their investments.
Trends within the wealth management space
The wealth management industry is also witnessing market consolidation along its value chain. In
addition, private equity funds are increasingly looking to participate in the growth story of Indian
wealth management industry.
Other trends in India’s wealth management space
I. There is an increasing trend of ultra HNIs looking at engaging with Family Office set-ups to not
only help them in managing investments but also help in ensuring a relevant structure to
preserve, grow and manage their wealth for generations to come
II. There is increasing trend of HNIs investing in unlisted equity to be part of the startup / private
equity story apart from the quest to have higher anticipated returns on account of unlocking of
potential valuations upon listing on stock exchanges.
IFA
With rising inflows in mutual funds, of Rs 36,095 billion AAUM as on August 2021 is seeing a steady
increase in new distributors joining. The IFA category has contributed majorly to this growth. If we
take into account employees holding Employee Unique Identification Number (EUIN), the total
distributors (excluding non-individual distributors) have gone up. This suggests that banks and

RHP Final Wealth Management Industry Research Report 2021
Page 70 of 98
national distributors are ramping up their sales force to cater to the increased demand for mutual
funds. The increased demand for mutual funds could be leading to more players taking up MF
distribution. B30 distributors are entitled to earn higher commissions as compared to T30
distributors. Many brokers are offering mutual funds to clients, realizing the long-term revenue
potential in the form of trail commissions. The distribution space is attracting talent from asset
management firms, wealth management/banks and new age robo advisers that are backed by
investors.
Direct Equity
In FY20, due to tax cut reforms taken by the government in September 2019, equity as an asset class
has outshined all other financial assets in terms of performance this year. As the impact of
demonetization started waning and slew of economic reforms were rolled out, bulls took complete
control of equity markets.
In FY20 at the end, individual wealth in direct equity decreased by 30.69% to a massive Rs.36,115
billion due to surge in Covid -19 cases and global lockdown and temporary shutoff of all activities
which led to steep fall in Stock market.
Table: Composition of Direct Equity holding based on Investor class
(₹ In Billion) Category FY20 Amount FY19 Amount % of Market Capitalization Y-O-Y (%) Change
Promoters 57,615 73,847 51% -21.98%
Institution 44,133 61,563 39% -28.31%
Retail 11,739 15,676 10% -25.11%
Total 1,13,488 1,51,086 100% -24.89%
(Source-SEBI)
Table: Break-up of Individual Investments in Direct Equity
(₹ In Billion)
Category FY20 Amount FY19 Amount Y-O-Y (%) Change
Promoter individual 24,375 36,427 -33%
Retail individual 11,739 15,676 -25%
Total 36,115 52,103 -31%
(Source-SEBI)
Indian Mutual Fund Industry
SBI Mutual Fund was set up in June 1987, followed by the launch of Canbank Mutual Fund in
December 1987. Subsequently, other entities such as Life Insurance Corporation of India (“LIC”),
Punjab National Bank (“PNB”), Indian Bank, Bank of India, General Insurance Corporation of India

RHP Final Wealth Management Industry Research Report 2021
Page 71 of 98
(“GIC”) and Bank of Baroda (“BoB”) opened their mutual fund houses, taking the industry assets to
₹470 billion by the end of 1993.
Figure: The chart sets forth a summary of the evolution of the Indian Mutual Fund Industry:
Structure of mutual funds in India
The structure of mutual funds in India is a three-tier one. There are three distinct entities involved in
the process – the sponsor, trustees and the asset management company (which oversees the fund
management). The structure of Mutual Funds has come into existence due to SEBI (Securities and
Exchange Board of India) Mutual Fund Regulations, 1996. Under these regulations, a Mutual Fund is
created as a Public Trust.
Asset Management Companies:
Asset management companies are the third layer in the structure of Mutual Funds. The asset
management company acts as the fund manager or as an investment manager for the trust. A small

RHP Final Wealth Management Industry Research Report 2021
Page 72 of 98
fee is paid to the AMC for managing the fund. The AMC is responsible for all the fund-related
activities. It initiates various schemes and launches the same. The AMC is bound to manage funds
and provide services to the investor. It solicits these services with other elements like brokers,
auditors, bankers, registrars, lawyers, etc. and works with them. To ensure that there is no conflict
between the AMCs, there are certain restrictions imposed on the business activities of the
companies.
Types of Mutual Funds
A mutual fund is a professionally-managed investment scheme that raises capital or investment from
a group of people and uses that pooled capital to invest in different types of securities like equities,
bonds, money market instruments and/or other securities. Mutual funds can be classified under
various categories, based on their structure, investment style and the investment objective.
Types of Mutual Funds Based on Structure
▪ Open-end Fund: An open-end fund is a mutual fund scheme that is available for subscription and
redemption on every business day throughout the year. These schemes are perpetual and do not
have any maturity date.
▪ Closed-end Fund: A closed-end fund is a scheme which has a specified tenor and a fixed maturity
date and is open for subscription only during the initial offer period. Units of Closed-end funds can
be redeemed only on maturity. Hence, the units of a closed-end fund are compulsorily listed on a
stock exchange after the new fund offer, and traded on the stock exchange just like other stocks.
This provides the investors an option to exit from the scheme before the maturity by selling the
units on the exchange.
Type of Mutual Funds Based on Investment Objectives and Underlying Securities
▪ Equity Funds / Growth Funds invest a predominant share of the corpus in equity securities, with
the main objective of providing capital appreciation over the medium to long term investment
horizon. They are high-risk funds and the returns are linked to the performance of the capital
markets. There are different types of equity funds such as diversified funds, sector specific funds
and index based funds.
o Diversified Funds have a portfolio comprising of investments in companies spread across
sectors and market capitalization.
o Sector Funds invest primarily in equity shares of companies in a certain identified business
sector or industry. While these funds may give higher returns during certain periods, they are
riskier as compared to diversified funds given the dependence of their performance on a
particular sector or industry.

RHP Final Wealth Management Industry Research Report 2021
Page 73 of 98
o Index Funds invest in the same pattern, that is same securities and in the same proportion, as
popular stock market indices like CNX Nifty Index and S&P BSE Sensex. The value of the index
fund varies in proportion to the benchmark index.
o Tax Saving Funds are diversified equity funds with the added feature of tax benefits to
investors under section 80C of the Income Tax Act, 1961. Investors in these funds have a lock-
in period of three years.
▪ Debt Fund / Fixed Income Funds invest predominantly in rated debt or fixed income securities like
corporate bonds, debentures, government securities, commercial paper and other money market
instruments. These are less risky when compared with equity funds.
o Liquid Funds / Money Market Funds invest in highly liquid money market instruments and
provide easy liquidity. Liquid funds are short duration funds and typically used by corporate,
institutional investors and business houses for deploying surplus liquidity for a short period.
o Gilt Funds invest in central and state Government securities. Gilt funds have the lowest credit
risk.
▪ Balanced / Hybrid Funds invest both in equity shares and debt (fixed income) instruments and
strive to provide both growth and regular income.
▪ Exchange Traded Funds (“ETFs”): track an index, a commodity or a basket of assets as closely as
possible, but trade like shares on the stock exchanges. They are backed by physical holdings of the
commodity, and invest in stocks of companies, precious metals or currencies.
▪ Gold Funds are schemes that mainly invest in gold ETFs and other related assets. Unlike for gold
ETFs, investing in gold funds does not require a demat account. Further, gold funds do not directly
invest in physical gold but take the same position indirectly by investing in gold ETFs.
Types of Mutual Funds Based on Investment Style
▪ Actively Managed Fund: These funds are actively managed by a fund manager who is responsible
for curating and monitoring the portfolio. The fund manager is responsible for buying, holding and
selling stocks, backed by analytical and technical research and expertise, based on the
performance of the stock and the portfolio as well as the investment thesis of the fund or scheme.
The fund manager would take the decisions to buy or sell or hold securities based on his
assessment and analysis of the markets and the portfolio performance along with the core
investment philosophy of the fund.

RHP Final Wealth Management Industry Research Report 2021
Page 74 of 98
▪ Passively Managed Funds: Passive investment strategy refers to the strategy of optimizing returns
over a long term by mimicking the benchmark index. This strategy is based on an efficient market
hypothesis which states ‘beating the market’ is virtually impossible since security prices at all
times reflect all relevant information, owing to stock market efficiency. Thus, with beating the
market not an option, matching the market returns emerges as the best option. A passively
managed fund, though managed by a fund manager, follows a market index in its composition.
The scheme’s portfolio mirrors the selected benchmark index and thus comprises of the same
securities as in the benchmark index and in exactly the same proportion. The fund manager thus is
a passive investor as the security transaction decisions (buy/hold/sell) are based on the
benchmark index.
Penetration, Current Structure and Trend in Mutual Fund Industry
(Source-AMFI)
Average Assets managed by the Indian mutual fund industry have grown from Rs. 23,250 billion in
January 2018 to Rs. 37,408 billion in September 2021. That represents a 60.89% growth in assets
over January 2018.
Growth in Assets (Rs. in Billion)
(Source-AMFI)

RHP Final Wealth Management Industry Research Report 2021
Page 75 of 98
The value of assets held by individual investors in mutual funds increased from Rs.14,320 billion in
August 2020 to Rs.19,401 billion in August 2021, an absolute increase of 35.48%.
The value of Institutional assets increased to Rs.16,694 billion in August 2021 from Rs. 13,461 billion
in August 2020.
Scheme wise Composition of Assets
The proportionate share of equity-oriented schemes is now 46.0% of the industry assets in August
2021, up from 40.1% in August 2020.
The proportionate share of debt-oriented schemes is 27.7% of industry assets in August 2021, down
from 30.3% in August 2020.
Investor Categories across Scheme Types
Individual investors now hold a marginally higher share of industry assets, i.e. 53.7% in August 2021,
compared with 51.5% in August 2020.
Institutional investors account for 46.3% of the assets, of which corporates are 95%. The rest are
Indian and foreign institutions and banks.
Composition of Investors’ Holdings
Individual investors primarily hold equity-oriented schemes while institutions hold liquid and debt-
oriented schemes.
75% of individual investor assets are held in equity-oriented schemes.
68% of institutions assets are held in liquid/money markets schemes and debt-oriented schemes.
Growth in B30 Assets

RHP Final Wealth Management Industry Research Report 2021
Page 76 of 98
(Source-AMFI)
*T30 refers to the top 30 geographical locations in India and B30 refers to the locations beyond the
top 30.
16% of the assets of the mutual fund industry came from B30 locations in July 2021.
Assets from B30 locations increased from Rs.5,664 billion in July 2021 to Rs.5,860 billion in August
2021, representing an increase of 3%.
Top 5 States in Each Scheme Category as on August 2021
(Source-AMFI)
(Source-AMFI)

RHP Final Wealth Management Industry Research Report 2021
Page 77 of 98
(Source-AMFI)
(Source-AMFI)
Maharashtra leads in the entire scheme category followed by New Delhi except in Equity oriented
Scheme. In Debt oriented schemes Gujarat ranks fourth while it ranks second in Equity oriented
schemes. Karnataka ranks third in Liquid, Debt oriented schemes, ETF’s and Equity oriented schemes
it ranks fourth. West Bengal ranks fifth in Equity oriented schemes and Fourth in ETF’s.
State-Wise AUM Data
(Source-AMFI)

RHP Final Wealth Management Industry Research Report 2021
Page 78 of 98
(Source-AMFI)
As can been seen from above graph Maharashtra contributes highest AUM as % of GDP which is
59.8% as compared to North Eastern regions like Manipur which contributes 2.3% the least as on
August 2021.
(Source-AMFI)
(Source-AMFI)

RHP Final Wealth Management Industry Research Report 2021
Page 79 of 98
When it comes to per capita AUM, New Delhi ranks 1st with assets of Rs. 1,52,425 per person. New
Delhi tops the list of per capita AUM followed by Goa, Maharashtra, Chandigarh and Haryana. While
Manipur has the lowest per capita AUM of Rs.2,106 as on August 2021. The variation happens
because of population in each state. States with lower populations have higher per capita AUMs.
Top 20 States –AUM Composition August 2021
(Source-AMFI)
% share of the top 20 states in the total industry AUM is indicated in brackets next to each state
respectively.
The AUM composition gives us an idea of various schemes that contribute to the AUM. Haryana has
its largest assets under debt oriented schemes while Jharkhand and Bihar have the same in equity
oriented schemes.
Investor Type-wise Composition of Mutual Fund Assets

RHP Final Wealth Management Industry Research Report 2021
Page 80 of 98
Individual investors now hold a higher share of industry’s assets, i.e. 53.7% in August 2021,
compared with 46.2% in March 2015.
(Source-AMFI)
*Institutions include domestic and foreign institutions and banks.
B30 has a more balanced mix than T30
(Source-AMFI)
In August 2021, 71% of assets from B30 locations were in equity schemes. T30 location, equity –
oriented schemes accounted for 41%.
Increasing Share of Equity based Fund in Asset class over the years

RHP Final Wealth Management Industry Research Report 2021
Page 81 of 98
Equity funds have increased their share by approx. 14.1% points from Mar-15 to Aug-21, driven by
strong growth in equity markets and steady inflows.
(Source-AMFI)
Equities contributed about 46.0% of the total mutual fund AMC asset size as on August 2021 up from
31.9% 6.4 years ago.
Investors – Overall Composition
An individual or an entity facilitating buying and selling of units of mutual fund by investors. A
distributor earns upfront/trail commission for bringing in investors into the mutual fund schemes.
A Direct plan in which investor buy directly from the mutual fund company (usually from their own
website) whereas a Regular plan investor buy through an advisor, broker or distributor
(intermediary). In a regular plan, the mutual fund company pays commission to the intermediary.
This is then recovered as an expense from the plan. In mutual fund, the expense ratio is higher for a
regular plan. Mutual fund industry saw its assets base increase from Rs.21,360 billion in March 2018
to Rs. 36,594 billion in August 2021 adding more than Rs. 15,234 billion in 3.4 years.
Key Drivers of growth for Wealth Management Industry
❖ Increasing population of affluent clients with rising income levels- With expanding economy,
income of the middle class and the investable assets of the UHNI in the country have increased
dramatically over the last few years. This, along with higher financial literacy and growing customer

RHP Final Wealth Management Industry Research Report 2021
Page 82 of 98
awareness, has led to an increase in demand for wealth products. India is one of the world’s fastest
growing UHNI populations both in terms of the number of individuals and the wealth levels. The rise
in UHNI population has been partly driven by e-commerce start-ups and rising income levels.
With increase in GDP/Adult of developed nations such as United States, Switzerland, Australia,
wealth/GDP of respective country also increased. While India’s GDP is expected to grow at much
faster rate, it is estimated that is will witness similar increase in its wealth/GDP as was observed in
developed nations.
❖ Increase in wealth allocated towards financial products- Individuals and investors are increasingly
moving away from traditional physical investments such as real estate and gold and making higher
allocations into financial assets such as equity, bonds and alternate investments, thereby creating
higher potential for wealth products. This coupled with ease in accessibility of different investment
products on one platform will also help drive growth.
A large fraction of the wealth of Indian households is in the form of physical assets (in particular, gold
and real estate). The average Indian household holds 84% of its wealth in real estate and other
physical goods, 11% in gold and the residual 5% in financial assets (Source-www.rbi.org.in). Financial
savings has higher proportion to household’s savings in advanced economies as they are more likely
to finance home purchasing with a mortgage, and allocate a sizeable fraction of their wealth to
retirement savings over the course of their lifetime. Individuals and investors in India are increasingly
moving away from traditional physical investments such as real estate and gold and allocating higher
proportion of their investment into financial assets such as equity, bonds and alternate investments,
thereby creating higher potential for wealth products. Lower expected returns on physical assets
have been one of the major factors for shift in investments preference of investors towards financial
products. With stable gold price and falling real estate price, investment in physical savings has
declined. Investment attractiveness towards fixed deposit has also declined as fixed deposit returns
have fallen over the past three years. Whereas, Nifty index rose, driving the shift of household
savings preference from physical assets towards financial products.
❖ Financial savings shifting to mutual funds- Gradual pick-up in economic growth, benign inflation, and
diminishing attractiveness of gold and real estate as investment options to lead to a surge in
household financial savings in India. This financial savings will find its way into mutual funds, owing to
increased awareness of the product.
● Low penetration and strong fundamentals to aid industry growth- Despite growth in assets,
India accounts for less than 1.5% share of the global mutual fund industry. Furthermore,
mutual fund penetration, as measured by AUM-to-GDP ratio, was a mere 16% in 2020 as
compared with the global average of 63%.
● Increased reach of mutual funds beyond top 30 cities- Mutual funds are expanding their
distribution reach and focusing on securing customers from smaller markets. Beyond top 15
(B15) cities have seen faster growth in assets in past three Fiscals ended March 2017, at 30%

RHP Final Wealth Management Industry Research Report 2021
Page 83 of 98
CAGR, compared with top 15 (T15) cities (27% CAGR). Further, individual investors’ (retail and
HNIs) assets grew even faster in B15 cities at 35% CAGR compared with 28% CAGR in T15
cities. This growth can be attributed to increasing digitization along with government policies
like allocation of expenses for investor education. Furthermore, SEBI has incentivized fund
houses to garner assets from tier II and III cities by allowing them to charge an additional
expense ratio of up to 30 bps on inflows above the defined limits (30% of gross new inflows or
15% of average AUM for a scheme, whichever is higher) from beyond T15 cities. As per SEBI
circular SEBI/HO/IMD/DF2/CIR/P/2018/16 dated 02.02.2018, the terms and definition of “15
cities”, “T15” and “B15” are substituted with “30 cities”, “T30” and “B30” respectively, with
effect from April 1, 2018.
● Retail participation increasing with rise in SIP investments- Retail investor folios, which were
on a decline post the financial crisis of 2008, reversed course in the past few Fiscals. Due to
political stability, low inflation, central bank rate cuts, higher than expected monsoons, and
tax cut by government for corporates led retail investors to increase their allocation to equity
mutual funds. Mutual Fund SIPs accounts stood at 43.2 million and the total amount collected
through SIP during August 2021 was ₹99.23 billion & Total amount contributed in FY22 was
₹461.03 billion.
(Source-AMFI) * Data till August 2021.
❖ Supportive policies
● The government and SEBI have over the years come out with a number of regulations to
educate investors, simplify products and lower costs, with the eventual aim of enhancing the
acceptance of mutual funds as an investment avenue and protecting the interest of investors.
While some of these policies, such as banning entry load (2009), mandating exit loads to be
credited back to the scheme (2012), and mandating AMCs to offer a direct plan option with
lower expense ratio for investors who do not wish to invest through distributors (2013), have
led to short-term gyrations. But these have contributed in making the sector more attractive.
● In April 2016, the RBI asked banks that currently offer investment advisory services through
an internal department to reorganize their operations within three years and set up a

RHP Final Wealth Management Industry Research Report 2021
Page 84 of 98
subsidiary for investment advisory services. This is to ensure an arm’s length distance
between banking activities and investment advisory services. Banks will need specific
approval from the RBI to set up the subsidiary. The subsidiary would have to be registered
with SEBI and would be subsequently regulated by SEBI. In order to promote investors
participation, government / regulators are boosting investor’s confidences to participate in
equity / debt market by increased focus on client centricity, fiduciary responsibility and
compliance. Regulatory have been more stringent in their requirements regarding advisor
qualifications, infrastructure, risk profiling and suitability criteria.
● In 2011, SEBI proposed a self-regulatory organization (SRO) for the Indian wealth
management sector that would help regulate business and serve as a medium for SEBI to
implement various wealth management initiatives. To enhance the penetration of mutual
funds in the country, SEBI sought to increase the sales in the B15 location through the
commission structure. In September 2012, SEBI allowed fund houses to charge an additional
30 basis points on daily net assets in the total expense ratio, should the new inflows from B15
cities be at least 30% of the gross new inflows in the scheme or 15% of the average assets
under management, whichever is higher. Note: As per SEBI circular
SEBI/HO/IMD/DF2/CIR/P/2018/16 dated 02.02.2018, the terms and definition of “15 cities”,
“T15” and “B15” are substituted with “30 cities”, “T30” and “B30” respectively, with effect
from April 1, 2018.
● SEBI's recent guidelines on consolidation and merger of mutual fund schemes will make it
simple for the investors to compare various mutual fund schemes being offered by the fund
houses. Moreover, it will reduce the confusion and make it simple to compare performance
among a level-playing field.
● The implementation of various reforms such as GST, RERA, new insolvency and bankruptcy
code and recapitalization of banks among others are likely to shift informal sectors into the
formal economy and hence, boost GDP growth and individual wealth in the medium to long
term.
● The Indian government’s financial inclusion drive and the growth of small rural banks are
bringing large number of unbanked people into the formal banking system. This is reflected in
the growth in Jan Dhan accounts and bank deposits.
❖ Equity mutual funds perceived as long-term wealth creators- Equity mutual funds have created
wealth in multiples for investors over the long term. For e.g., ₹ 1,000 invested in equity funds in
1999, would have grown 46 times, compared with 29.4 times and 22.0 times of the Nifty 500, Nifty
50 and S&P BSE Sensex indices, respectively till September 2021.
❖ SEBI drive to push mutual fund products in B30 cities and beyond in the last five years has begun to
show results. Asset management companies (AMCs) have increased their focus on rural markets,
which is reflecting in the numbers – both in terms of investors and assets under management.

RHP Final Wealth Management Industry Research Report 2021
Page 85 of 98
Campaigns like the Mutual Fund Sahi Hai drive have been immensely successful in creating
awareness about the benefits of investing in MFs across India.
Rural recovery brings a lot of good news for the Indian economy as rural demand constitutes a major
portion of overall consumption demand in the country. If consumption from vicinity retains its
momentum, it can be a force multiplier for India’s GDP growth in the coming years.

RHP Final Wealth Management Industry Research Report 2021
Page 86 of 98
CLASSIFICATION & CHARACTERISTICS OF ULTRA HNI & HNI
Global wealth is projected to rise by 39% over the next five years, reaching USD 583 trillion by 2025.
Low- and middle-income countries are responsible for 42% of the growth, although they account for
just 33% of current wealth. Wealth per adult is projected to increase by 31%, passing the watershed
mark of USD 100,000. The number of millionaires will also grow markedly over the next five years,
reaching 84 million by CY25, while the number of UHNWIs should reach 344,000 by CY25.
Wealth Management to benefit the most due to equity component in wealth to GDP.
In order to analyze the distribution of wealth, the data have been segregated into four wealth
ranges: 1) below 10,000 dollars; 2) 10,000−100,000 dollars; 3) 100,000−1,000,000 dollars; 4) above 1
million dollars. Since the first issue of the Global Wealth Report in 2010, the composition of the
pyramid has remained largely stable. The only wealth segment with an unbroken spell of expansion
and wealth accumulation is the top tier, representing dollar millionaires.
World wealth map 2020
(Source- Global Wealth Report 2021)
The Global Wealth Pyramid end-2020
(Source- Global Wealth Report 2021)

RHP Final Wealth Management Industry Research Report 2021
Page 87 of 98
UHNWIs by region: 2020 and 2025
(Source- Global Wealth Report 2021)
Percentage Wealth Share Of Top 1%, Selected Countries and Years

RHP Final Wealth Management Industry Research Report 2021
Page 88 of 98
HNWI financial wealth by region (USD trillions), 2012–2019
(Source-World Wealth Report 2020)
Individual taxpayers declaring Gross Total Income more than Rs 10 Million
Assessment Year Financial Year Number of returns
2018-19 2017-18 97,689
2017-18 2016-17 81,344
2016-17 2015-16 67,783
2015-16 2014-15 59,830
2014-15 2013-14 48,417
2013-14 2012-13 44,078
2012-13 2011-12 36,690
(Source: Income Tax India)
Individual taxpayers declaring Gross Total Income more than Rs 10 Million have increased from
36,690 in AY 2012 - 13 to 97,689 in AY 2018-19 with an increase of over 17.73% CAGR, considering
the same growth rate Individual taxpayers declaring Gross Total Income more than Rs 10 Million will
reach to approx. 3,00,000 by AY 2025-26.

RHP Final Wealth Management Industry Research Report 2021
Page 89 of 98
GLOBAL OVERVIEW
Global wealth is projected to rise by 39% over the next five years, reaching USD 583 trillion by 2025.
Low- and middle-income countries are responsible for 42% of the growth, although they account for
just 33% of current wealth. Wealth per adult is projected to increase by 31%, passing the watershed
mark of USD 100,000. The number of millionaires will also grow markedly over the next five years,
reaching 84 million, while the number of UHNWIs should reach 344,000.
Wealth Management to benefit the most due to equity component in wealth to GDP.
Regional composition of global wealth distribution in 2020
(Source- Global Wealth Report 2021)
Global Wealth Distribution
(Source- Global Wealth Report 2021)

RHP Final Wealth Management Industry Research Report 2021
Page 90 of 98
Number of millionaires in 2020 and 2025 (regions and selected countries)
Country Number (thousand) Change
2020 2025 (%)
United States 21,951 28,055 28
China 5,279 10,172 93
Japan 3,662 5,411 48
France 2,469 4,201 70
Canada 1,682 2,981 77
Germany 2,953 4,240 44
Australia 1,805 3,071 70
United Kingdom 2,491 3,711 49
Korea 1,051 1,772 69
Spain 1,147 1,804 57
Netherlands 1,039 1,666 60
Italy 1,480 2,060 39
India 698 1,269 82
Switzerland 1,035 1,596 54
Taiwan (Chinese Taipei) 609 1,031 69
Hong Kong SAR 520 831 60
Belgium 515 786 53
Denmark 307 560 82
Sweden 570 809 42
Austria 346 577 67
Russia 269 455 69
Mexico 264 434 64
Singapore 270 437 62
Brazil 207 361 74
Poland 149 295 98
Africa 276 483 75
Asia-Pacific 9,656 15,291 58
China 5,279 10,172 93
Europe 15,784 24,491 55
India 698 1,269 82
Latin America 752 1,262 68
North America 23,638 31,045 31
World 56,084 84,014 50
(Source- Global Wealth Report 2021)

RHP Final Wealth Management Industry Research Report 2021
Page 91 of 98
Emerging Trends in the global wealth management industry
➢ Regulation and compliance
Increasing regulatory complexity-The global financial crisis paved the way for increased regulatory
scrutiny and tighter oversight of the wealth management industry. It is not just the sheer volume of
new regulations, but also uncertainties regarding the interpretation of regulations, delayed timelines
and inconsistencies between regulators that are materially increasing the risk of non-compliance as
well as challenging existing business models. One of the biggest challenges that wealth managers will
continue to face is keeping up with the dynamic regulatory environment in their home jurisdictions
and in international markets.
Focus on international tax transparency-The overall stance on tax transparency is becoming more
intense, with supranational organizations driving regulatory initiatives. Going forward, international
efforts to reduce tax arbitrage and improve transparency will accelerate and it will become harder to
avoid taxation. Going forward, there will be more regulatory requirements that wealth managers will
need to meet. The stream of new and revised regulations will continue, triggered by efforts to
harmonize national regulations globally to ensure a level playing field.
➢ Changing client needs
New generation of client- The wealth management industry is witnessing a phase of change as its
largest investor segment, the baby boomers (born between 1946 and 1965), is in the retirement
phase and assets are being transferred to the next generation of investors: Gen-X (born between
1966 and 1980) and Gen-Y/millennials (born after 1980). Currently, millennials are the largest and
fastest-growing adult segment across the globe and represent the greatest opportunity for the
wealth management industry. Millennials are not only growing in number, but also accumulating
assets at an impressive rate. In fact, millennials are entering their prime earnings years and also have
the prospect of large inheritances. They have the potential to become the wealthiest generation in
history. Notably, this group of investors is different from their predecessors in terms of attitudes
toward managing their finances and expectations in relation to client experience. While baby
boomers were more keen on investing in stocks and particularly interested in diversifying their
assets, millennials tend to hold more cash (40% of assets are in cash) and are distrustful of the stock
market (90% of millennials are intimidated by the stock market) mainly on account of their
experience with the global financial crisis. Moreover, millennials’ investment objectives are diverse
and vary across asset classes as well as regions.
Empowered clients- Client needs and expectations are changing dramatically with regards to client
experience, quality of service and delivery channels. The industry is witnessing a change in demand

RHP Final Wealth Management Industry Research Report 2021
Page 92 of 98
for products and services as well as preferred channels for customer engagement. Digital capabilities
are at the top of the list of wealth management clients’ must-haves. Clients are increasingly
demanding that wealth management firms offer more interactions — from account opening to the
provision of advice — through digital channels. The new wave of empowered clients is challenging
the status quo in wealth management.
Customer loyalty is declining - Customer loyalty is declining as clients have become wary of their
financial service providers following the financial crisis and barriers in switching between financial
firms have reduced. According to industry data, 73% of wealth management clients have
relationships with multiple wealth managers and 4 out of 10 clients are open to switching wealth
managers. This represents incremental revenue opportunity of US$ 175b–US$ 200b (based on the
fact that global wealth managers manage client assets worth ~US$ 120t) for firms willing to make
strategic investments to improve their client experience. Moreover, trust and price sensitivity issues
have led some new generation investors to explore do-it-yourself investing. This trend is supported
by the rise of automated invested platforms (robo-advisors).
Clients are eager for a new level of public transparency- Investors have overwhelmingly identified
transparency of portfolio performance and fees as one of the key requisites in the rapidly
transforming wealth management space. However, the traditional views of transparency are no
longer enough and investors are demanding a new level of public transparency. Clients are eager to
rate their advisors and connect with like-minded clients in public forums to exchange ideas and share
positive and negative experiences. For instance, social media can be used as a platform to review or
rate advisors.
Changing fee-structure preferences- Currently, the global wealth management industry follows a
transaction-based (i.e., commissions) or an asset-based compensation model. However, client
preference for fixed fees is rising, while preference toward both asset-based fees and commissions is
on the decline. Furthermore, clients are becoming less sure about how they want to be charged in
every single region.
➢ Competitive environment
The competitive landscape for wealth managers is multidimensional, involving traditional and non-
traditional players. In a study as per research, more than half of the respondent wealth managers
(52%) agreed that the industry is facing significant competitive pressures.
Traditional players rebalancing structures- Several players are rebalancing their international wealth
management operations. While some wealth management players are focusing on high-growth

RHP Final Wealth Management Industry Research Report 2021
Page 93 of 98
markets, such as Asia-Pacific, others are exiting the international wealth management industry
entirely.
List of Top Global Players
Following are the Top 10 asset and wealth managers in the world ranked by total AUM. Blackrock
established in 1988, is the world’s largest asset manager with assets under management of more
than US $9.0 trillion. Headquartered in New York, it has more than 70 offices in 30 countries and
employs approximately 12,000 people. Vanguard Group, Headquartered in Valley Forge,
Pennsylvania, is the second largest investment company with more than US$ 7 trillion in global assets
under management. It is the largest mutual fund provider and second largest ETFs provider in the
world.
Rank Company Country Asset under Management
(US$ Trillion)
1 BlackRock US 9.00
2 The Vanguard Group US 7.20
3 Charles Schwab Corporation US 7.07
4 Fidelity Investments US 3.80
5 State Street Global Advisors US 3.50
6 Allianz Germany 2.89
7 J.P. Morgan Asset Management US 2.80
8 Capital Group US 2.30
9 BNY Mellon Investment management US 2.20
10 Amundi Asset Management France 1.90
(Source- mutualfunddirectory.org)

RHP Final Wealth Management Industry Research Report 2021
Page 94 of 98
OUTLOOK FOR WEALTH MANAGEMENT INDUSTRY IN INDIA-OVERALL
Indian household savings have been witnessing some considerable structural shifts of late.
Households in India have historically been quite risk averse and wary of investing their savings into
volatile or uncertain return-based assets. A pursuit of safe bets has always driven India towards
making investments in unproductive assets like gold. This pattern is slowly changing over time,
especially since demonetization in November 2016. Also, the country has seen a major shift in
attitude from Capital preservation to wealth creation from FY17.
With a likely growth rate of India’s GDP projected at 9.2% in 2022 the country will remain a key
growth driver of global economy. Against this backdrop, individual wealth in India is expected to
grow at a CAGR of 11.77% till FY25 and is likely to nearly double to Rs. 811,293 billion by FY25. The
GDP of India is estimated to be around US$ 4.2 Trillion by 2025 as projected by IMF.
GDP Forecast in Absolute terms (USD Trillion)
Particulars 2018 2019 2020 2021F 2022F 2023F 2024F 2025F
GDP, current prices
2,701 2,871 2,709 3,050 3,310 3,590 3,880 4,199
(Source: IMF) *F-Forecasted
In the next five years, financial assets will witness much faster growth rate as compared to physical
assets. As far as individual contribution is concerned, financial asset will form almost 63% of the total
individual assets by FY25. Physical assets will be restricted to 37% of the total wealth.
Table: Individual Wealth Estimation
(₹ In Billion)
Category FY20 Amount FY25
Amount CAGR (%)
Proportion FY20
Proportion FY25
Financial Assets 2,62,912 5,12,157 14.27 56.5% 63.1%
Physical Assets 2,02,282 2,99,136 8.14 43.5% 36.9%
Total 4,65,194 8,11,293 11.77 100.0% 100.0%

RHP Final Wealth Management Industry Research Report 2021
Page 95 of 98
(Source-Karvy India Wealth Report 2020)
The share of financial assets is increasing in total assets gradually from 56.5% to 63.1%.
Projected financial wealth – asset class wise distribution in FY25
Financial assets are likely to almost double by FY25 to reach a figure of Rs. 5,12,157 billion in FY25 as
compared to Rs. 2,62,912 billion in FY20. Faster growth in Direct Equity will be the major driver of
such growth. Rising wave of mutual funds will also supplement this uptrend. We therefore expect
that by FY25, the share of financial assets in the investment will rise to 63.1% from 56.5% in FY20.
Table: Projected financial wealth – asset class wise distribution in FY25
(₹ In Billion)
Category FY20 FY25 CAGR % Proportion FY20 Proportion FY25
Fixed Deposits & Bonds 48,691 78,357 9.98% 18.52% 15.30%
Direct Equity 36,115 97,319 21.93% 13.74% 19.00%
Insurance 38,020 68,895 12.63% 14.46% 13.45%
Saving Deposits 37,455 53,762 7.50% 14.25% 10.50%
Cash 23,497 33,933 7.63% 8.94% 6.63%
Provident Fund 20,438 36,720 12.43% 7.77% 7.17%
Mutual Funds 11,909 27,151 17.92% 4.53% 5.30%
NRI Deposits 10,326 17,164 10.70% 3.93% 3.35%
Unlisted Equity 13,032 60,035 35.73% 4.96% 11.72%
Small Savings 9,836 15,070 8.91% 3.74% 2.94%
Current Deposits 2,118 3,036 7.47% 0.81% 0.59%
Pension Funds 9,017 15,289 11.14% 3.43% 2.99%
Alternative Investments 2,000 4,247 16.25% 0.76% 0.83%
International assets 458 1,181 20.86% 0.17% 0.23%
Total 2,62,912 5,12,157 14.27% 100.00% 100.00%
(Source-Karvy India Wealth Report 2020)

RHP Final Wealth Management Industry Research Report 2021
Page 96 of 98
Projected physical wealth – asset class wise distribution in FY24
Despite rise in share of financial assets, physical assets will remain resilient to an extent. Individual
wealth in physical assets is likely to grow by 33.86% to around Rs. 270,783 billion in FY24 from Rs.
2,02,282 billion in FY20. Despite low growth, real estate and gold will remain the most favored asset
classes in the overall physical assets pie.
Meanwhile, performance of physical assets will remain subdued as compared to financial assets
primarily due to factors like attitudinal shift, liquidity, faster growth of equity markets among others.
Table: Projected Physical Wealth – Asset Class wise distribution in FY24
(₹ In Billion)
Category FY20 FY24 CAGR % Proportion
FY20 Proportion
FY24
Gold 1,09,500 1,31,848 4.75% 54.13% 48.69%
Real Estate 80,145 1,18,247 10.21% 39.62% 43.67%
Diamond 8,304 14,318 14.59% 4.11% 5.29%
Silver 2,854 3,718 6.84% 1.41% 1.37%
Platinum 82 129 11.99% 0.04% 0.05%
Others Gems and Jewellery 1,394 2,520 15.95% 0.69% 0.93%
Total 2,02,282 2,70,783 7.56% 100.00% 100.00% (Source-Karvy India Wealth Report 2020)
● Wealth held by individuals is expected to reach approx. Rs. 8,11,293 billion by FY25 at a steady
CAGR of 11.77% per annum.
● The implementation of various reforms such as GST, RERA, new insolvency and bankruptcy code
and recapitalization of banks among others are likely to shift informal sectors into the formal
economy and hence, boost GDP growth and individual wealth in the medium to long term.
● There is increasing trend of HNIs investing in unlisted equity to be part of the startup / private
equity story apart from the quest to have higher anticipated returns on account of unlocking of
potential valuations upon listing on stock exchanges.
● There is an increasing trend of ultra HNIs looking at engaging with Family Office set-ups to not only
help them in managing investments but also help in ensuring a relevant structure to preserve,
grow and manage their wealth for generations to come.
● Direct Equity Investments are expected to be the main growth drivers for the future and are
expected to grow at a CAGR of more than 28.1% over the next 5 years.

RHP Final Wealth Management Industry Research Report 2021
Page 97 of 98
Potential impact of robo-advisors on the wealth management space
Some traditional players have been downplaying the impact of robo-advisors. However these new
digital entrants have been able to develop a streamlined digital experience for clients, which had
been largely lacking in traditional wealth managers’ digital offerings. This combined with increased
transparency and lower fees have the ability to make wealth advice economically feasible for the
mass market.
Robo-advisors are swarming into the wealth management industry. The current market share of
robo-advisor firms is marginal as they have only gained a miniscule share of (AUM) globally but
several companies already have over US$ 1b of assets under management. Several research studies
forecast that robo-advisors are going to witness significant growth going forward as these firms have
managed to do in a couple of years what the incumbent wealth management industry has failed to
accomplish since its inception, i.e., make quality financial advice available across demographics at an
affordable cost. Robo-advisors will be key to unlocking access to the mass market services, which, in
turn, would help in growing the overall wealth management market. Moreover, these firms have
received strong funding support from venture capital funds. According to a study by
MyPrivateBanking Research hybrid robo-advisors are expected to grow by size to US$ 3.7 trillion of
assets globally by 2020. The study predicts that the total market size for hybrid robo-advisors will
further increase to US$ 16.3 trillion by 2025, which will be 10% of total investable wealth around the
world by that date. In contrast pure robo-advisors (fully automated) are likely to hold only 1.6% of
the total global wealth by the middle of the next decade.
Robo-advisors steps to streamline the client online experience, provide greater transparency and
improve the economics for the mass segments are irreversible and they are making traditional
financial advisers rethink their business models. According to a research by Accenture, robo advisors
could result in possible fee reduction of as much as 70% for some services. Traditional advisors will
need to ensure that their service offering is commensurate with the fees tagged to it. Moreover,
robo-advisors will also force traditional advisers to increase focus on their digital channels.
Conclusion
India has the lowest mutual fund penetration globally. The total AUM to GDP ratio of India stands at
a mere 16%, way below the global average of 63%. Countries like the US have AUM to GDP ratios of
over 100%. So, the mutual fund industry in the country provides huge scope for growth and
development. Real estate and gold have become less attractive forms of investments post
demonetisation. Even the reduction in bank deposit rates in the past year has led to a shift in
investment to mutual funds and the stock markets.
Financial Assets are expected to reach Rs.512 trillion by FY25 at a CAGR of 14.27% and Physical
Assets would grow at 7.56% CAGR to reach Rs.270 Trillion by FY24.

RHP Final Wealth Management Industry Research Report 2021
Page 98 of 98
India is expected to be the fourth largest private wealth market globally by 2028.
Also, the government's efforts to increase banking penetration through Jan Dhan Yojana and higher
digitization are also expected to boost financial savings. Factors such as favourable demographic
profile with a young working population, rise in income levels, increasing financial literacy and retail
participation and buoyancy in capital markets supporting equity AUM, are expected to drive the
growth of the mutual fund industry in the long term.