Embed Size (px)
DESCRIPTION
f
Citation preview

Industry Perpective on Aquaculture
Engineering
National Consultative Workshop on Aquaculture Engineering and Agriculture-Fisheries RDE Agenda for
AFMechRDENUPLB, College, Laguna
July 21-22, 2015
WILFREDO G. YAPPhil. Chamber of Agriculture and Food, Inc (PCAFI)

Volume of Production, 2013-2014
2013 2014 % GrowthCommercial 1,067,610 1,107,221 3.71%Municipal 1,264,416 1,244,259 -1.59%Aquaculture 2,373,386 2,337,605 -1.51%

Value (₱1,000) of Aquaculture Production by Species, Jan-Mar 2014-2015
Species 2014 2015 % ChangeMilkfish 4,373,189.00 4,339,563.31 -0.77%Tilapia 4,571,261.71 4,418,042.14 -3.35%Sugpo 2,742,194.15 2,793,483.17 1.87%Seaweed 1,453,432.51 1,450,523.91 -0.20%Mudcrab 666,829.54 653,084.40 -2.06%Catfish 61,369.90 55,748.82 -9.16%Grouper 40,743.76 44,633.38 9.55%Oyster 37,993.58 37,415.15 -1.52%Suahe 35,253.03 38,715.81 9.82%Carp 21,640.25 19,619.34 -9.34%Mussel 15,453.78 13,059.84 -15.49%

2014 Production Volume by Species,
Volume ( mt)
Seaweeds 1,549,576
Milkfish 390,233
Tilapia 259,198
Sugpo 47,843
Oysters 22,355
Mussels 18,762
Carps 16,756
Mudcrab 16,160
P, vannamei 7,626 Catfish 3,625
Suahe 1,150
Grouper 271
All Others 4,050PSA-BAS

2014 Production Value by Species
PSA-BAS

MilkfishTilapiaShrimpsSeaweedMusselOysters
Species With Immediate Need for Aquaculture Engineering Intervention

Value of Aquaculture Production by Region. 2014
PSA-BAS

Milkfish Production by Culture System in Region 1, 2010 to 2014
PSA-BAS

Region IV-A Production by Culture System, 2010-2014
PSA-BAS

Milkfish Production by Culture System, Philippines, 2003-2014
2003
2004
2005
2006
2007
2008
2009
2010
2011
2012
2013
2014
-
50,000
100,000
150,000
200,000
250,000
300,000
350,000
400,000
450,000
FishpensFish CagesFishpond
Cosme, Jun ‘08
Pepeng, Sep ‘09
Yolanda, Nov ‘13
Juan, Oct ‘10
PSA-BAS

Hai Yan aka Yolanda Took its Toll in Region VIII
1999
2000
2001
2002
2003
2004
2005
2006
2007
2008
2009
2010
2011
2012
2013
2014
0
2,000
4,000
6,000
8,000
10,000
12,000
14,000
BW Pond Marine Cage
PSA-BAS

Tilapia Production by Culture System
PSA-BAS

BW vs FW Fishponds: Point to Ponder
Per BFAR and BAS figures:BW Fishponds= 239,232 haFW Fishponds= 14,531 ha
2014 Production per BAS:BW Fishponds = 320,833 mt All Species (227,477 mt Milkfish)FW Fishponds = 148,741 mt All Species (143,336 mt Tilapia)
Yield: BW Fishponds =1.341 mt/ha/year?
FW Fishponds =9.892 mt/ha/year?

Philippine Shrimp Production by Species 1995 to 2014
PSA-BAS

Penaeus vannamei Production, 2008 to 2014
2008 2009 2010 2011 2012 2013 2014 -
1,000
2,000
3,000
4,000
5,000
6,000
7,000
8,000
9,000
Volu
me (m
t)
PSA-BAS

Penaeid Shrimp Production, Selected ASEAN Countries
Thailand
IndonesiaMalaysia
1990 to 2012 FAO FishtatJ; 2013 TH, INA, VN,, Infofish, PHL,PSA-BAS
Vietnam
Philippines

Shrimp Production Per Km Coastline (Post-EMS* for China and Thailand)
Country
2013 Production
(mt)
Length Coastline
(km)MT per Km Coastline
China 1,200,000 14,500 82.76Indonesia 600,000 54,718 10.97Vietnam 500,000 3,444 145.18Thailand 250,000 3,219 77.66Philippines 55,000 36,289 1.52*EMS- Early Mortality Syndrome

Seaweed Production: Philippines vs Indonesia (data up to 2012 only)
2000
2001
2002
2003
2004
2005
2006
2007
2008
2009
2010
2011
2012
2013
2014
-
1,000,000
2,000,000
3,000,000
4,000,000
5,000,000
6,000,000
7,000,000
Philippines Indonesia
An
nu
al P
rod
ucti
on
(1
,00
0
mt)
PSA-BAS, FAO Fish Stat

Seaweed Situation
After steady growth up to 2011 Philippine production started to decline by 2011
Philippine seaweed industry suffers from three major problems:◦ recurring “ice-ice” disease◦ lack of nurseries for quality planting stock◦ Extreme weather
Local processors now import raw dried seaweeds from Indonesia

Oysters and Mussels
Annual Mussel production averaged 17,762 mt and Oyster 16,109 for the past 3 decades fluctuating between >10,000 mt and highs of >20,000 mt
Both species have not elicited investment interest from private sector and remains traditional
Institutional support beyond Red Tide Alert, like certification of both products and culture sites as well as financing needed since technology already well developed and only needs to be adopted.

Mussel Production Per km Coastline
Country2011
Production (mt)
Length Coastline
(km)
MT per km Coastline
China 707,401 14,500 48.79
Thailand 84,665 3,219 26.30
Philippines 22,243 36,289 0.61
FAO FishStatJ
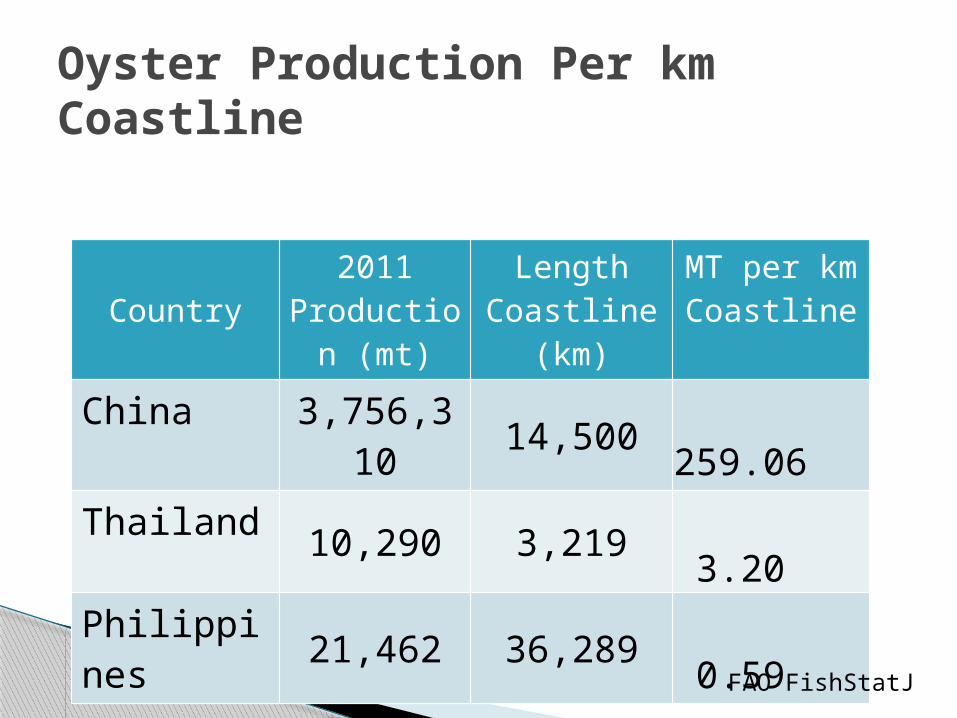
Oyster Production Per km Coastline
Country2011
Production (mt)
Length Coastline
(km)
MT per km Coastline
China 3,756,310 14,500 259.06
Thailand 10,290 3,219 3.20
Philippines 21,462 36,289 0.59
FAO FishStatJ

Use of PumpsUse of Aeration DevicesLimited Use of FeedersUnder Development Stage: ◦Fry and Fingerling Counter◦Bottom release feeder for floating pellets
Present Extent of Mechanization in Aquaculture in the Philippines

Marine Fish Hatchery Design Weatherproof Seawater Intake for Hatcheries
Appropriate Filtration Systems Cost benefit Studies on Centralized vs Point of Use Aeration
Aquaculture Engineering Needs for Hatcheries

Pond Design Standards Design of Biofloc System Live Fish Handling System for Nursery to Grow-out and Harvest from Grow-out
Design for Pumping and Aeration Using Nonconventional Energy Sources
Aquaculture Engineering Needs for Land Based Aquaculture

IMTA Capable Mariculture Park Design
Typhoon Resistant Fish Cages Typhoon Resistant Floating Mussel and Oyster Growing Systems
Mechanized Harvesting Systems for Different Species
Improved Seaweed Dryers
Aquaculture Engineering Needs for Open Water Aquaculture

Maraming Salamat Po!