Embed Size (px)
Citation preview

Citi Investment Research & Analysis is a division of Citigroup Global Markets Inc. (the "Firm"), which does and seeks to do business with companies covered in its research reports. As a result, investors should be aware that the Firm may have a conflict of interest that could affect the objectivity of this report. Investors should consider this report as only a single factor in making their investment decision. Non-US research analysts who have prepared this report are not registered/qualified as research analysts with the NYSE and/or NASD. Such research analysts may not be associated persons of the member organization and therefore may not be subject to the NYSE Rule 472 and NASD Rule 2711 restrictions on communications with a subject company, public appearances and trading securities held by a research analyst account. Customers of the Firm in the United States can receive independent third-party research on the company or companies covered in this report, at no cost to them, where such research is available. Customers can access this independent research at http://www.citigroupgeo.com or http://www.smithbarney.com or can call (866) 836-9542 to request a copy of this research.
Citigroup Global Markets
North America | United States Equity Strategy (Citi)
Industry Focus
1 July 2009 68 pages
TEN+ 2009-2010 16th Annual TEN+ List
TEN+ 2009-2010 List
CME Group Inc (CME) Ingersoll Rand Co Ltd (IR) DaVita Inc (DVA) Merck (MRK) Estee Lauder Inc (EL) MetLife Inc (MET) Google Inc (GOOG) Owens Illinois Inc (OI) Halliburton Company (HAL) State Street Corp (STT) Hershey Foods Corp (HSY) Vale (VALE) Hewlett-Packard Co (HPQ) VF Corp (VFC) Home Depot Inc (HD)
TEN+ 2009-2010 Aggressive Growth List
Bank of America Corp (BAC) Halliburton Company (HAL) Cliffs Natural Resources Inc. (CLF) Hewlett-Packard Co (HPQ) CME Group Inc (CME) Newfield Exploration Co (NFX) DaVita Inc (DVA) NVIDIA Corp (NVDA) Equinix Inc (EQIX) Owens Illinois Inc (OI) Estee Lauder Inc (EL) Research In Motion Ltd (RIMM) Gilead Sciences Inc (GILD) State Street Corp (STT) Google Inc (GOOG)
TEN+ 2009-2010 Growth & Income List
Automatic Data Processing Inc (ADP) Microsoft Corp (MSFT) British American Tobacco (BTI) Norfolk Southern (NSC) Hershey Foods Corp (HSY) NV Energy (NVE) Home Depot Inc (HD) Tyco Electronics Ltd (TEL) Ingersoll Rand Co Ltd (IR) Vale (VALE) Merck (MRK) Ventas Inc (VTR) MetLife Inc. (MET) VF Corp (VFC)
US Research Unassigned
See Appendix A-1 for Analyst Certification and important disclosures.

TEN+ 2009-2010 1 July 2009
Citigroup Global Markets 2
Introducing the TEN+ 2009-2010 List
We are introducing Citi Investment Research's TEN+ (Ten Exceptional Names Plus) List for 2009–10. Each year, Citi Investment Research analysts are asked to select their best idea for performance over the next 12 months. In the TEN+ process, the analysts' recommendations are refined by the TEN+ Stock Selection Committee through a rigorous review that incorporates several disciplines, such as fundamental, technical, and quantitative analysis. We believe the cumulative experience and different resources available to the committee enable us to identify a group of stocks that has the potential to outperform the market over the next 12 months.
Figure 1. TEN+ 2009-2010 List
Price
Company Name Ticker Rating 6/30/09 Hi Low FY Ends 2009E 2010E 2011E Cur-E Next-E Div-E Yld
CME Group Inc. CME 1M 311.11 440.00 155.06 JAN $13.05 $15.30 $17.75 23.8 20.3 4.54 1.46%DaVita Inc. DVA 1M 49.46 60.18 40.96 DEC $3.92 $4.45 $5.24 12.6 11.1 0.00 0.00%Estee Lauder Inc. EL 1M 32.67 54.35 19.82 JUNE $1.35 $1.71 $2.02 24.2 19.1 0.67 2.05%Google Inc. GOOG 1H 421.59 555.68 247.30 DEC $21.19 $25.51 $29.16 19.9 16.5 0.00 0.00%Halliburton Co. HAL 1H 20.70 55.38 12.80 DEC $1.37 $1.50 $1.85 15.1 13.8 0.30 1.45%Hershey Foods Corp. HSY 1M 36.00 44.23 30.28 DEC $2.00 $2.20 $2.50 18.0 16.4 1.19 3.31%Hewlett-Packard Co. HPQ 1M 38.65 49.00 25.39 OCT $3.77 $4.28 $4.68 10.3 9.0 0.32 0.83%Home Depot Inc. HD 1M 23.63 30.74 17.05 JAN 1.76A $1.61 $1.82 13.4 14.7 0.88 3.72%Ingersoll Rand Co. Ltd. IR 1M 20.90 41.14 11.46 DEC $1.80 $2.05 $2.55 11.6 10.2 0.50 2.39%Merck MRK 1M 27.96 38.90 20.10 DEC $3.25 $3.40 $3.70 8.6 8.2 1.52 5.44%MetLife Inc. MET 1M $30.01 $65.45 $11.37 DEC $3.00 $4.10 $4.75 10.0 7.3 $0.74 2.47%Owens Illinois Inc. OI 1M 28.01 48.60 9.60 DEC $2.90 $3.20 $3.60 9.7 8.8 0.00 0.00%State Street Corp. STT 1H 47.20 74.85 14.44 DEC $4.30 $4.75 $5.40 11.0 9.9 0.28 0.59%Vale VALE 1M 17.63 36.29 8.80 DEC $0.88 $0.85 $0.85 20.0 20.7 0.50 2.84%VF Corp. VFC 1M 55.35 84.54 38.85 DEC $4.96 $5.60 $6.30 11.2 9.9 2.42 4.37%
52-Week Earnings Per Share P/E Ratio
Source: Citi Investment Research and Analysis

TEN+ 2009-2010 1 July 2009
Citigroup Global Markets 3
Introducing the TEN+ 2009-2010 Aggressive
Growth List
In conjunction with Citi Investment Research’s TEN+ List, we are introducing the TEN+ Aggressive Growth List for 2009–10. After each analysts’ TEN+ candidate has been thoroughly reviewed and the stock selection committee has refined those recommendations down to the top 10-15 stocks for inclusion in the TEN+ List, that list is then further sorted to identify those stocks that are deemed to posses above average growth and capital appreciation potential. Those stocks are then supplemented with other TEN+ finalists that the committee believes also offer compelling, above average appreciation potential to complete the TEN+ Aggressive Growth List.
Figure 2. TEN+ 2009-2010 Aggressive Growth List
Price
Company Name Ticker Rating 6/30/09 Hi Low FY Ends 2009E 2010E 2011E Cur-E Next-E Div-E Yld
Bank of America Corp. BAC 1H 13.20 38.85 2.53 DEC $0.30 $0.40 $2.50 44.0 33.0 0.04 0.30%Cliffs Natural Resources Inc. CLF 1S 24.47 121.88 11.81 DEC $0.20 $3.05 $3.75 122.4 8.0 0.16 0.65%CME Group Inc. CME 1M 311.11 440.00 155.06 DEC $13.05 $15.30 $17.75 23.8 20.3 4.54 1.46%DaVita Inc. DVA 1M 49.46 60.18 40.96 DEC $3.92 $4.45 $5.24 12.6 11.1 0.00 0.00%Equinix Inc. EQIX 1S 72.74 95.23 32.72 DEC $1.30 $1.94 $3.55 56.0 37.5 0.00 0.00%Estee Lauder Inc. EL 1M 32.67 54.35 19.82 JUNE $1.35 $1.71 $2.02 24.2 19.1 0.67 2.05%Gilead Sciences Inc. GILD 1M 46.84 57.63 35.60 DEC $2.65 $3.05 $3.57 17.7 15.4 0.00 0.00%Google Inc. GOOG 1H 421.59 555.68 247.30 DEC $21.19 $25.51 $29.16 19.9 16.5 0.00 0.00%Halliburton Co. HAL 1H 20.70 55.38 12.80 DEC $1.37 $1.50 $1.85 15.1 13.8 0.30 1.45%Hewlett-Packard Co. HPQ 1M 38.65 49.00 25.39 OCT $3.77 $4.28 $4.68 10.3 9.0 0.32 0.83%Newfield Exploration Co. NFX 1H 32.67 68.31 15.46 DEC $4.02 $2.90 $3.20 8.1 11.3 0.00 0.00%NVIDIA Corp. NVDA 1S 11.29 19.23 5.75 JAN ($0.08)A ($0.33). $0.42 Neg. 26.9 0.00 0.00%Owens Illinois Inc. OI 1M 28.01 48.60 9.60 DEC $2.90 $3.20 $3.60 9.7 8.8 0.00 0.00%Research In Motion Ltd. RIMM 1H 71.05 135.00 35.05 FEB 3.44A $4.10 $4.86 17.3 14.6 0.00 0.00%State Street Corp. STT 1H 47.20 74.85 14.44 DEC $4.30 $4.75 $5.40 11.0 9.9 0.28 0.59%
52-Week Earnings Per Share P/E Ratio
Source: Citi Investment Research and Analysis

TEN+ 2009-2010 1 July 2009
Citigroup Global Markets 4
Introducing the TEN+ 2009-2010 Growth &
Income List
In conjunction with Citi Investment Research’s TEN+ List, we are introducing the TEN+ Growth & Income List for 2009–10. After each analysts’ TEN+ candidate has been thoroughly reviewed and the stock selection committee has refined those recommendations down to the top 10-15 stocks for inclusion in the TEN+ List, that list is then further sorted to identify those stocks that are deemed to have both solid capital appreciation potential and dividend income. Those stocks are then supplemented with other TEN+ finalists that the committee believes also offer a compelling total return profile (appreciation + dividend yield) to complete the TEN+ Growth & Income List.
Figure 3. TEN+ 2009-2010 Growth & Income List
Price
Company Name Ticker Rating 6/30/09 Hi Low FY Ends 2009E 2010E 2011E Cur-E Next-E Div-E Yld
Automatic Data Processing Inc. ADP 1L $35.44 $45.97 $30.83 JUNE $2.38 $2.41 $2.60 14.9 14.7 $1.34 3.78%* British American Tobacco BTI 1L $55.80 $76.35 $43.74 DEC $4.71 $5.14 $5.80 11.8 10.9 $3.06 5.48%Hershey Foods Corp. HSY 1M $36.00 $44.23 $30.28 DEC $2.00 $2.20 $2.50 18.0 16.4 $1.19 3.31%Home Depot Inc. HD 1M $23.63 $30.74 $17.05 JAN $1.76A $1.61 $1.82 14.7 13.0 $0.88 3.72%Ingersoll Rand Co. Ltd. IR 1M $20.90 $41.14 $11.46 DEC $1.80 $2.05 $2.55 11.6 10.2 $0.50 2.39%Merck MRK 1M $27.96 $38.90 $20.10 DEC $3.25 $3.40 $3.70 8.6 8.2 $1.52 5.44%MetLife Inc. MET 1M $30.01 $65.45 $11.37 DEC $3.00 $4.10 $4.75 10.0 7.3 $0.74 2.47%Microsoft Corp. MSFT 1M $23.77 $28.50 $14.87 JUNE $1.64 $1.89 $2.09 14.5 12.6 $0.52 2.19%Norfolk Southern NSC 1M $37.67 $75.53 $26.69 DEC $3.40 $3.95 $4.60 11.1 9.5 $1.42 3.77%NV Energy NVE 1H $10.79 $12.88 $6.90 DEC $0.89 $1.01 $1.16 12.1 10.7 $0.40 3.71%Tyco Electronics Ltd. TEL 1H $18.59 $37.56 $7.40 SEP $0.67 $1.00 $1.68 27.7 18.6 $0.64 3.44%Vale VALE 1M $17.63 $36.29 $8.80 DEC $0.88 $0.85 $0.85 20.0 20.7 $0.50 2.84%Ventas Inc. VTR 1H $29.86 $52.00 $17.34 DEC $2.55 $2.63 $2.71 11.7 11.4 $2.05 6.87%VF Corp. VFC 1M $55.35 $84.54 $38.85 DEC $4.96 $5.60 $6.30 11.2 9.9 $2.42 4.37%* EPADR Exchange Rate Assumption: (USD/GBP) $1.63
52-Week Earnings Per Share P/E Ratio
Source: Citi Investment Research and Analysis

TEN+ 2009-2010 1 July 2009
Citigroup Global Markets 5
Automatic Data Processing Inc (ADP)............................................................................7 Bank of America Corp (BAC)..........................................................................................9 British American Tobacco PLC (BTI) ............................................................................11 Cliffs Natural Resources Inc. (CLF) .............................................................................13 CME Group Inc (CME) ..................................................................................................15 DaVita Inc (DVA) .........................................................................................................17 Equinix Inc (EQIX)........................................................................................................19 Estee Lauder Inc (EL) ..................................................................................................21 Gilead Sciences Inc (GILD) ..........................................................................................23 Google Inc (GOOG).......................................................................................................25 Halliburton Co (HAL)....................................................................................................27 Hershey Foods Corp (HSY) ...........................................................................................29 Hewlett-Packard Co (HPQ)...........................................................................................31 Home Depot Inc (HD) ...................................................................................................33 Ingersoll Rand Co LTD (IR) ..........................................................................................35 Merck (MRK)................................................................................................................37 MetLife (MET) ..............................................................................................................39 Microsoft Corp (MSFT) .................................................................................................41 Newfield Exploration Co (NFX) .....................................................................................43 Norfolk Southern (NSC)................................................................................................45 NV Energy (NVE) ..........................................................................................................47 NVIDIA Corp (NVDA).....................................................................................................49 Owens Illinois Inc (OI) .................................................................................................51 Research In Motion Ltd (RIMM) ...................................................................................53 State Street Corp (STT)................................................................................................55 Tyco Electronics Ltd (TEL)............................................................................................57 Vale (VALE) .................................................................................................................59 Ventas Inc (VTR) .........................................................................................................61 VF Corp (VFC) ..............................................................................................................63 Appendix A-1...............................................................................................................65
Company Index

TEN+ 2009-2010 1 July 2009
Citigroup Global Markets 6
This page intentionally left blank.
TEN+ 2009-2010 1 July 2009
Citigroup Global Markets 7
Automatic Data Processing Inc (ADP)
Ashwin Shirvaikar, CFA +1-212-816-0822
Investment Thesis — ADP's financial performance is largely tied to employment levels and interest rates; both have been headwinds for some time in our view. Despite this, we believe ADP's impressive cost management efforts, laddered investment strategy and share buybacks have helped support respectable EPS growth. With expectations for FY10 already quite low (and rightfully so), we believe ADP's depressed valuation vs. history and its peers/market could recover as some of the key factors (employment and interest rates) show more tangible signs of recovery for FY11.
Valuation is Compelling — ADP currently trades at ~15x our FY10 EPS estimate. This compares with ~19x for closest peer PAYX and ADP's 10-year historical average of ~23x. ADP's multiple has not expanded as rapidly as that of the overall market in recent months and, as a result, its forward P/E premium vs. the S&P 500 is currently just 5%-10% vs. its historical average premium of 35%-40%. We also believe ADP's FY10 FCF yield of ~7% is attractive given its high degree of earnings stability – much of this is returned to shareholders via its ~3.5% dividend yield and ongoing share repurchases.
Potential Catalysts — The most important near-term catalyst for ADP is likely its upcoming 4Q09 results and FY10 guidance issuance in late July. Over the course of FY10, the most important external factors will be US employment data (released monthly), interest rate levels (0-5 year durations) and the performance of ADP's investment portfolio, notably its corporate bond and asset-backed holdings. Also, greater clarity regarding the magnitude and impact of auto dealer consolidation in the US could serve as a catalyst.
Company description
Automatic Data Processing (ADP), with annual revenues of $8.8 billion in FY08, is the global leader in providing outsourced payroll processing services and other transaction processing services. The core of ADP's franchise is its Employer Services unit (72% of revenues), which provides payroll processing, tax administration and other outsourced HR services to a wide range of business in the US and abroad. ADP generates a significant portion of its income by investing approximately $15 billion of its clients' payroll and tax funds before remittance to the appropriate third parties. The company's Professional Employer Organization (PEO) unit (12%), provides a similar suite of services as Employer through a co-employment relationship. Lastly, ADP's Dealer Services unit (16%) provides integrated dealer management systems and other business management solutions to auto and truck dealers in the US and abroad.
Investment strategy
We have a Buy/Low Risk (1L) rating on ADP. We like ADP's attractive business model - a high degree of recurring revenues, a solid margin profile and strong cash flow, which it returns to shareholders via dividends and buybacks. Additionally, we believe ADP's valuation is attractive from both cash- and multiple-based perspectives relative to its peers and on an absolute basis.
Computer Services and IT
Consulting
Buy/Low Risk 1LPrice (30 Jun 09) US$35.44Target price US$44.00Expected share price return 24.2%Expected dividend yield 3.8%Expected total return 27.9%Market Cap US$17,778M
Company Metrics
52-Week Range $45.97–$30.83 Div (E) $1.34 P/E (6/09E) 14.9x P/E (6/10E) 14.7x 6/08A EPS US$2.18 6/09E Cur EPS US$2.38 6/10E Cur EPS US$2.41
Price Performance (RIC: ADP.O, BB: ADP US)

TEN+ 2009-2010 1 July 2009
Citigroup Global Markets 8
Although ADP's businesses faces several headwinds - namely reduced employment levels in the U.S. and abroad, a low interest rate environment that drives reinvestment risk and the prospect for accelerated auto dealership closings in its Dealer unit - these are well-known issues and the company's geographical and client diversification, "laddering" investment strategy and its ongoing share repurchases help it counteract these near-term risks.
Our Low Risk rating on ADP reflects its impressive earnings stability, strong credit rating (AAA), consistent dividend history and large market capitalization.
Valuation
Our 12-month target price of $44 for ADP is based on the average of our P/E and DCF analyses.
P/E Analysis: We use the low end of our targeted 10%-30% premium range vs. the S&P P/E multiple (which stands at 14.3x currently per StockVal) to derive our targeted 16x forward multiple for ADP. The 10%-30% premium range is below the 35% average premium over the past three years (per StockVal) to reflect the recent declines in this metric as ADP's growth has slowed. We apply the 16x forward multiple to our CY10 EPS estimate of $2.48 to derive our $40 P/E-based target for ADP.
Discounted Cash Flow (DCF) Analysis: Based on our ten-year DCF analysis, we derive a $48 price target for ADP. Our analysis incorporates the following assumptions: Weighted Average Cost of Capital (WACC) of 8.2%, based on a Beta of 0.86 (Bloomberg adj. 5-yr weekly), a Risk-Free Rate of 2.70% (CIR Estimate) and a Market Risk Premium of 6.40% (CIR Estimate); Terminal growth rate of 1.0%-1.5%.
Risks
We assign ADP a Low Risk rating, primarily due to its impressive earnings stability, strong credit ratings (AAA), consistent dividend history and large market capitalization. The primary risks to our Buy/Low Risk rating and or the stock achieving our target price are:
Declining Employment – ADP's revenues are primarily dependent upon the number of employees for which it processes payroll and benefits information. If employment continues to decline in the US beyond our expectations, there could be risk to our earnings expectations.
Low Interest Rates – ADP generates a substantial portion of its income from interest earned on its float portfolios. If the ongoing low interest rate environment persists, there could be continued degradation in ADP's interest income.
US Auto Exposure – ADP's Dealer unit is exposed to the ongoing dealer consolidation in the US auto market. If dealer closings or spending levels are worse than we anticipate, there could be additional downside to our estimates.
Foreign Operations – ADP generates nearly 20% of its revenues from outside the US, primarily in Europe and Canada. If the US dollar strengthens vs. the European and Canadian currencies, ADP's foreign income could be weaker than expected.

TEN+ 2009-2010 1 July 2009
Citigroup Global Markets 9
Bank of America Corp (BAC)
Keith Horowitz, CFA +1-212-816-3033
Solid Platform with Opportunities from Recent Acquisitions — Bank of America is a leading diversified financial institution with a powerful distribution platform and we believe the firm stands to benefit long-term from market share gains across a variety of businesses, including traditional banking, mortgage origination, retail brokerage, and investment banking. Bank of America has a proven record of executing on acquisitions and Countrywide and Merrill Lynch offer great opportunities which we have seen in CFC as the mortgage market begins to rebound.
Capital Overhang Subsiding — Bank of America has raised nearly $33 bil of the $33.9 bil required from the government stress test, not including the potential for up to another ~300 mil common shares. We believe as BAC concludes its preferred conversions and capital plan, a major overhang on the stock will be lifted and investor focus will shift towards its solid long-term normalized earnings potential, which we expect will be achievable beginning in 2012.
Good Value Based on Normalized Earnings Potential — We see normalized earnings for Bank of America of $3.00 per share which means the stock is trading at about 4x diluted normalized earnings vs the group at about 6x and is trading at about 1x tangible book value of $11.15 per share vs its long-term average of 3.3x. We believe any uncertainty created as Bank of America completes its capital raising efforts will provide a good buying opportunity to own a quality franchise with significant long-term earnings power.
Company description
Bank of America (BAC) is a bank holding company based in Charlotte, North Carolina. As of December 31, 2008, the company had almost $2.5 trillion in assets and $240 billion in shareholders' equity pro forma for the Merrill Lynch acquisition and preferred stock issuance, with 6,139 banking centers in 30 states servicing approximately 54 million consumer and small business relationships. Global Consumer & Small Business (including Card Services) comprises about 50% of earnings, Global Corporate & Investment Banking comprises about 30% of earnings (including 10% from Capital Markets & Advisory Services, 8% from Business Lending, and 12% from Treasury Services), and Global Wealth Management comprises about 15% of earnings.
Investment strategy
We rate the shares of Bank of America Buy/High Risk (1H). We believe BAC represents the best value in the group trading at a 30-40% discount to the group on normalized earnings, adjusted for dilution related to capital plan. BAC is highly levered to an improved economy, which we believe will take a while to materialize. However, we believe the valuation discrepancy is too wide, and continues to offer investors the best way to invest in the banking sector.
Valuation
Our $18 target price for Bank of America is derived from our discounted residual income model, which is an extension of a dividend discount model and values an enterprise based on its discounted excess returns over its cost of equity. We also consider a relative P/E analysis, which compares BAC's forward
Banks
Buy/High Risk 1HPrice (30 Jun 09) US$13.20Target price US$18.00Expected share price return 36.4%Expected dividend yield 0.3%Expected total return 36.7%Market Cap US$84,519M
Company Metrics
52-Week Range $38.85–$2.53 Div (E) $0.04 P/E (12/09E) 44.0x P/E (12/10E) 33.0x 12/08A EPS US$0.30 12/09E Cur EPS US$0.40 12/10E Cur EPS US$2.50
Price Performance (RIC: BAC.N, BB: BAC US)

TEN+ 2009-2010 1 July 2009
Citigroup Global Markets 10
P/E multiple to that of a comparable bank group of large and mid-size bank stocks.
Our residual income model incorporates our three-year forward earnings projection, a seven-year fade period, and a steady state terminal value at year ten. The key inputs to the model assume a 12% cost of equity which we believe has come down due to less uncertainty surrounding capital needs. We also incorporated a modified long-term ROE estimate of 12%, which reflects Bank of America's unique business mix. We assume a perpetual growth rate of about 3%.
We see normalized EPS of $3 – Our $18 target price and normalized earnings of about $3 per share imply a multiple of about 6x normalized earnings.
Risks
We rate Bank of America High Risk, largely because of near term headwinds as the economy remains weak. Additionally, BAC has relatively large capital markets exposure, which may lead to further mark to market losses as well as large consumer exposure via home equity and credit card where losses may be greater than anticipated. Other risks include general execution risk and a prolonged, sharp decline in U.S. capital markets activity and asset valuations.
Other Negative Risk:
Consumer credit downturn - Bank of America has relatively high consumer credit exposure. Post-MBNA acquisition, a significant portion of the combined Bank of America loan portfolio is credit cards, leaving the company susceptible to a downturn in industry receivables growth and/or rapid deterioration in consumer credit, as in a downturn, consumers first tend to default on credit cards. In addition, the sizeable home equity portfolio is also susceptible to a real estate led downturn.
Merrill Lynch/Countrywide integration and litigation risk
The Countrywide acquisition closed in 3Q08. This transaction presents integration risk given the volatile state of the mortgage market. In addition, there is litigation risk attached to Countrywide relating to mortgage lending practices. Merrill Lynch closed at the end of 2008. Like any large scale transaction, this deal presents execution risk.
Positive Risk:
Abbreviated and/or muted consumer credit cycle - If consumer credit does not deteriorate as much as expected or improves faster than expected Bank of America would be in a position to benefit due to strong consumer oriented businesses.

TEN+ 2009-2010 1 July 2009
Citigroup Global Markets 11
British American Tobacco (BTI)
Adam Spielman1 +44-20-7986-4211
Why Now? – While there are no specific catalysts on the horizon for BATS/BTI, the stock is our best idea in the sector due to its current valuation/yield, its overall exposure to emerging markets and its aggressive pricing. BATS’ business is the least exposed to "problem" markets such as the EU and Japan, where volumes and profits continue to suffer. Rather, the company’s profits are more weighted to emerging markets when compared to PM or Imperial, and these markets have proven to be more resilient. Additionally, BATS is the price leader in markets representing roughly 60% of its EBIT, which is crucial for tobacco companies given the necessity to increase prices to offset what are inevitable volume declines in most markets.
Cost Saves And Innovation Are Also Driving Results – The company continues to benefit from a cost savings program that affords the company a good degree of flexibility. The company is also the industry leader in innovation, which is important for tobacco companies as packaging design is often the only means of advertising available. Additionally, new products at attractive price points can help take significant share points from competitors.
Modest Valuation and Attractive Yield – BATS’ stock price significantly underperformed other consumer goods companies during the recent rebound in stocks from March 9 to June 1, and therefore we believe there is good opportunity for material upside in the name. BATS currently trades at 10.9x 2010E earnings vs PM that trades at 12x. We believe this gap should close. Additionally, the company has a very attractive yield of 5.7% thanks to the impressive cash flow generated by the business.
Company description
BAT is a truly global tobacco company, with more than half its profit coming from emerging markets. Its most valuable asset is its 42% stake in Reynolds American. In many markets (e.g. Canada, Brazil, South Africa, Australia) it is the dominant company. It owns many brands, with its top four accounting for one-fifth of volume. It is centralising management, marketing and production, thereby cutting costs.
Investment strategy
We have a Buy/Low Risk (1L) rating on BAT for four reasons: excellent marketing, attractive geographic exposure, cost cutting and a strong balance sheet allowing dividend growth. So far, there is little sign the global recession is having any material effect on demand for its products. However, exchange rate volatility is making EPS more unpredictable. The weakness of the pound boosted earnings in 2008 and is likely to do so again in 2009.
Marketing: BAT has the most aggressive innovation program of any European tobacco company. In addition, it is investing more in distribution (where it is already strong). These two disciplines are critical, as advertising is banned in most markets. As a consequence, it is gaining share in most of its key "brand-market units".
1 1Citigroup Global Markets Ltd
Tobacco
Buy/Low Risk 1LPrice (30 Jun 09) $55.80ADR Target price $65.00Expected share price return 16.5%Expected dividend yield 5.5%Expected total return 22.0%Market Cap US$55,512M
Company Metrics
52-Week Range $76.35-$43.74 Div (E) $3.06 P/E (12/09E) 11.8x P/E (12/10E) 10.9x 12/08A EPS $3.70 12/09E Cur EPS $4.71 12/10E Cur EPS $5.14
Absolute Performance Relative to S&P 500

TEN+ 2009-2010 1 July 2009
Citigroup Global Markets 12
Geographic exposure: In general at the moment, BAT is growing EBIT rapidly in almost all its geographies outside the difficult Western European and Canadian markets. In Europe, trends are less bad than before. We expect Canada to stabilize soon.
Cost cutting: BAT is still relatively inefficient. As it restructures to become a more globally managed company, large cost savings are coming through. Partly these are being used to bolster EPS growth, but partly they are being reinvested in marketing: mostly in brand and packaging innovations.
Valuation
Our price target is 1950p, roughly the average of our estimates for fair value based on: (1) P/Es (c1880p); and (2) FCF yields (c2,040p).
P/E-based valuation - For our 12-month P/E fair value, we are assuming that in 12 months it will trade slightly above its current multiple because there will be less uncertainty about future earnings (and in 12 months, the multiple will be applied to calendar 2010E earnings). If we are correct, then BAT could well be trading at 12.0x forward P/E. Applied to our EPS estimate for 2010E, this implies fair value of 1880p.
Dividend yield-based valuation - We believe most tobacco companies are cheap on the most tangible form of valuation, which is dividend yield. We believe that given its growth, BAT could easily be trading on a 5% forward dividend yield. If this is right, then in 12 months, given our estimate for the FY10 dividend per share, BAT would be trading at about 2040p.
Risks
We rate BAT as Low Risk. Tobacco is a fairly steady and predictable industry. Furthermore, BAT has by far the greatest geographical diversification of any tobacco company. We would highlight in particular the following risks that may affect the achievement of our target price:
Of all the European tobacco companies, BAT has the biggest risk from litigation, via its exposure to Canada and Brazil as well as the US. Several Canadian provinces have passed legislation that is designed to help the provinces sue BAT for billions of dollars using reduced levels of proof.
Foreign-exchange risk is significant for BAT. If some of its emerging market currencies fall, it may be subject to a worse-than-expected transactional squeeze.
The competition that is squeezing profit in Europe and Canada could begin to move into BAT's other markets, hurting profits globally.
The contribution from Reynolds American may decline as a consequence of an increase in Federal Excise Tax in the US.
The integrations of the recently acquired businesses in Turkey and Scandinavia may be problematic.

TEN+ 2009-2010 1 July 2009
Citigroup Global Markets 13
Cliffs Natural Resources Inc. (CLF)
Brian Yu, CFA +1-415-951-1830
Beneficiary of Steel Recovery – As the largest supplier of iron ore to US steel mills, CLF’s business is tied to steel consumption and production trends. Destocking has amplified the apparent demand decline for steel to -50% while end market consumption trends suggest a fall closer to -25%. As one-time destocking concludes, industry utilization rates improve, blast furnaces restart, and iron ore consumption begins to rebound, CLF's average unit costs and margins should also recover. We estimate that CLF's North American cash costs will improve to $56/l. ton in 2010 compared to $70/l. ton in 2009 and each $1/l. ton improvement in North American iron ore margin is worth roughly $0.13 to EPS.
Why Now? – Following the recent equity raise, CLF possesses cash of $444 mln vs total debt of $525 mln and debt/capital stands at a manageable 23%. Based on our above consensus 2010 estimate of $3.05, CLF is trading at 9.6x P/E and 4.7x EV/EBITDA. Despite poor 2009 earnings of $0.20, we expect CLF to generate positive free cash due to reductions in capex to maintenance levels.
Catalysts – The ISM PMI has historically served as a 3-month leading indicator for steel utilization rates and recent improvements with new orders pointing to an expansion for the first time in 17 months suggests current steel utilizations are too low. Although 1H09 steel utilization is averaging 43% (vs norm of 80-90%), we expect utilization to improve in 2H09 to an average of ~70%. Steel prices are likely to increase as scrap input costs rise due to limited supply, benefiting CLF’s iron ore sales contracts that are indexed to steel prices.
Company description
Cliffs Natural Resources is an international mining company focused on providing iron ore and metallurgical coal to the steel industry. CLF is North America's largest iron ore producer with six mines in the Great Lakes region and Eastern Canada. The company also produces iron ore in Australia for the Asian market via Portman Limited and is a significant producer of metallurgical coal with three mines in West Virginia and Alabama.
Investment strategy
We rate Cliffs Natural Resources (CLF) Buy/Speculative Risk (1S). Key elements of the investment thesis are:
Contracted Sales – For 2009, CLF has 75% or 18 mln equity long-tons of iron ore sold on a volume basis while pricing will be determined based on seaborne trade pellet prices, producer price indices (cost-plus pricing), and US hot rolled prices. We expect this multi-tier pricing structure to result in less volatile realized prices and we expect 2009 North American realized prices to decline by 13% YoY compared to the 30% expected drop in seaborne pellet prices.
Improving Mill Utilization and Iron Ore Shipments – With the steep drop in North American steel mill utilization rates, CLF recently curtailed some of its mine supply down to a run-rate of 15 mln equity long tons compared to 2008E shipments of 24 mln and 2009 contracted tons of 18 mln. Should the North American mills restart some of their operations over the next couple of quarters as we forecast, CLF’s shipments are also likely to improve.
Metals & Mining
Buy/Speculative 1SPrice (30 Jun 09) US$24.47Target price US$34.00Expected share price return 38.9%Expected dividend yield 0.7%Expected total return 39.6%Market Cap US$3,150M
Company Metrics
52-Week Range $121.88–$11.81 Div (E) $0.16 P/E (12/09E) 8.0x P/E (12/10E) 0.16x 12/08A EPS US$6.59 12/09E Cur EPS US$0.20 12/10E Cur EPS US$3.05
Price Performance (RIC: CLF.N, BB: CLF US)

TEN+ 2009-2010 1 July 2009
Citigroup Global Markets 14
Benefiting from Global Consolidation – While the company is a small producer of iron ore globally, it benefits from the positive supply dynamics where the major Australian and Brazilian producers dominate 77% of seaborne trade. Citi’s commodity team sees seaborne contract prices falling by 30% YoY in 2009 after an 80-97% YoY increase in 2008, but the implied margins are likely to remain historically high over the foreseeable future.
Valuation
Our target price of $34 is based on a combination of forward P/E (40% weight), trailing EV/EBITDA (40%), and DCF modeling (20%). We place less emphasis on DCF modeling because of share price volatility and business cyclicality that is difficult to capture with DCF.
P/E (Forward): Between 1993 and 2003, CLF's valuation fell to as low as 5x P/E with a median multiple of 9x. Since 2003, P/E has fallen to as low as 2x with a median multiple of 8x. Due to multiples expansion across the basic materials sector we apply an 12.0x multiple on our ‘10 estimate to arrive at a target price of $37.
EV/EBITDA (Trailing): Between 1993 and 2003, CLF's valuation has fallen to as low as 3x EBITDA with a median multiple of 5x. Since 2003, EV/EBITDA has fallen to as low as 2x with a median multiple of 6x. Due to our expectation of EBITDA reaching a trough in '09, we apply an 11.0x multiple on our '09 EBITDA estimate to arrive at a target price of $28.
DCF: DCF modeling yields a target price of $39. Our DCF model incorporates our EBIT estimates through 2011, 10% growth in 2012-2013 followed by a 2.5% long-term growth rate. Our WACC of 13.5% is based on a beta of 1.9, and from the CIR strategy group an equity risk premium of 6.4% and a risk-free rate of 2.7%. Terminal value accounts for 65% of the overall DCF valuation.
Risks
We rate CLF Speculative Risk because of its concentrated customer base, history of acquisitions and earnings volatility.
If the impact from the following factors proves to be greater than we anticipate, the stock will likely have difficulty achieving our target price. However, should it be less than anticipated, the stock could trade above our target price.
Leverage to the Steel Industry: CLF depends upon customers in the steelmaking industry for the majority of the company's iron ore and metallurgical coal revenues. A downturn in the steel industry would have a significant impact on CLF's revenues.
Customer Concentration: Five customers accounted for 83% of the North American Iron Ore segment's '07 revenues. The cancellation or renegotiation of a long-term agreement or other disruption of business with one of the segment's major customers could have a material impact on CLF.
Acquisition Integration: CLF has pursued a number of strategic acquisitions recently including Portman, PinnOak, Sonoma, Amapa and the attempted ANR transaction. Difficulty integrating these companies or other future acquisitions could increase costs or prevent CLF from realizing anticipated synergies.
Mining Operations: The company's mining operations are subject to variability in ore quality and structural issues which could potentially decrease production volumes and increase unit costs.

TEN+ 2009-2010 1 July 2009
Citigroup Global Markets 15
CME Group Inc (CME)
Donald Fandetti, CFA +1-212-816-2971
Leveraged To A Capital Market Recovery — We believe CME has the strongest business model in the global exchange sector and is the most leveraged to a credit market / capital markets recovery. Lackluster volumes in its key interest rate complex have been a drag on the shares. However, we believe the rates business will ultimately recover, but will take time before: 1) financial markets stabilize, 2) yield curve prices in inflationary pressures, and 3) credit markets rebound supporting strong debt/mortgage issuance. Also importantly, CME stands to benefit from the recent U.S. Treasury proposal to overhaul the OTC derivatives market which includes a mandate that all standardized OTC contracts are to be centrally cleared and electronically executed.
Valuation — We value CME based on 24.5x our '10 EPS estimate. Our 24.5x P/E multiple is below the 32.2x median it has traded over the last 3 years. The 24.5x is higher than the peer group avg of 17.4x (range of 8.2x to 33.4x) due to 1) OTC potential, and 2) potential uplift in interest rate volumes.
Potential Catalysts — Catalysts include a rebound in interest rate volumes and in-roads in OTC derivatives. Current interest rate volumes are trending 60% below peak and while we don't necessarily expect volumes to return to those levels, the ultimate recovery could provide a powerful earnings tailwind. We are seeing positive signs including Libor stabilization, increased corp debt issuance and large planned Treasury issuance. We view OTC derivatives as a promising longer-term opportunity. CME is well positioned to take advantage of interest rate swap clearing opportunities due to their rates business, yet in our view it will take time to materialize and will require dealer support.
Company description
CME Group (CME) was formed through the July 2007 merger of the Chicago Mercantile Exchange and CBOT Holdings. In 2008, CME acquired NYMEX extending their product breadth into energy and precious metals. CME operates as a futures exchange for the trading of futures and options on futures. CME is the world s largest and most diverse financial exchange. The company offers futures and options on futures in the following five areas: interest rates, equity indexes, foreign exchange, commodities and energy/metals.
Investment strategy
We rate CME shares with a Buy/Medium Risk rating (1M) and a target price of $375. We are positive on CME's recent NYMEX (NMX) acquisition as well as its overall strategy, franchise, and growth prospects. We view the risk / reward as compelling and see several positive catalysts for the stock including: 1) improving volumes from trough levels particularly interest rate futures, which have been an area of weakness and 2) potential in-roads into the OTC markets.
Specialty Finance
Buy/Medium Risk 1MPrice (26 Jun 09) US$317.45Target price US$375.00Expected share price return 18.1%Expected dividend yield 1.4%Expected total return 19.6%Market Cap US$21,065M
Company Metrics
52-Week Range $440.00–$155.06 Div (E) $4.54 P/E (12/09E) 23.8x P/E (12/10E) 20.3x 12/08A EPS US$16.31 12/09E Cur EPS US$13.05 12/10E Cur EPS US$15.30
Price Performance (RIC: CME.O, BB: CME US)
TEN+ 2009-2010 1 July 2009
Citigroup Global Markets 16
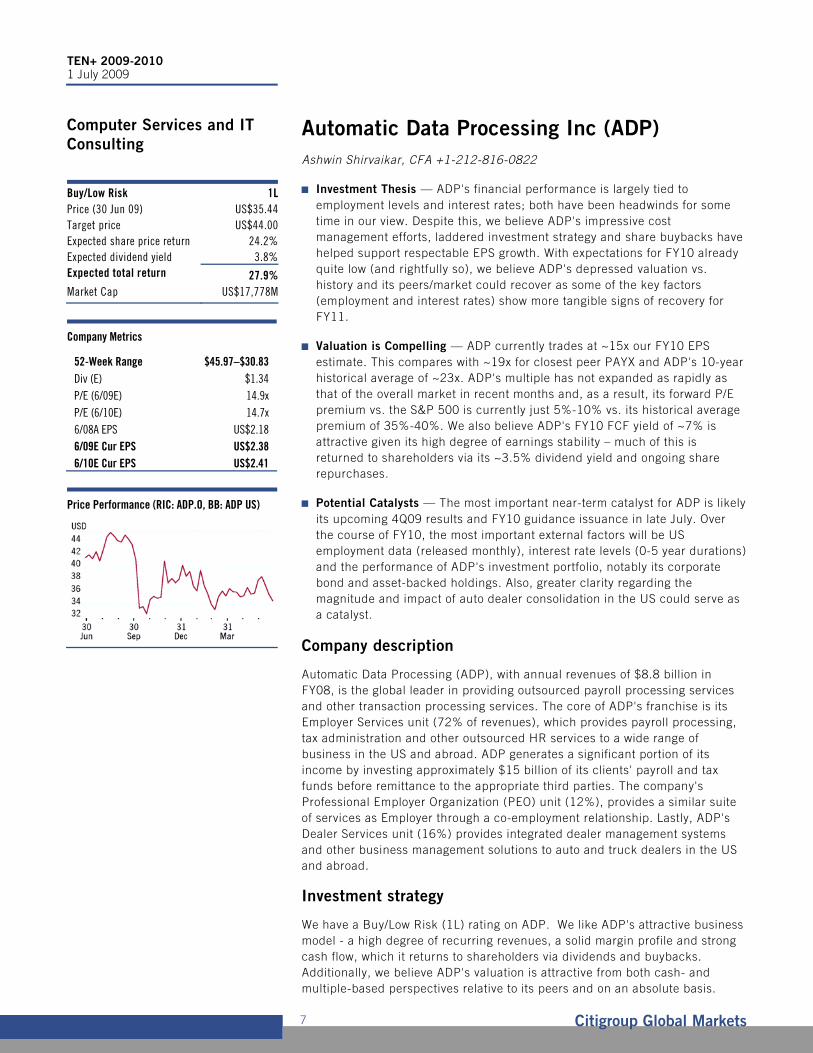
Valuation
In our valuation analysis, we consider a broad universe of public exchanges (both domestic and foreign) and U.S. market intermediaries.
Our 12-month target price is $375. We base our valuation on a price-to-earnings multiple of approximately 24.5x applied to our 2010 EPS estimate of $15.30 to derive a target price of $375. We are using a higher multiple of 24.5x versus 17.5x previously due to 1) significant OTC clearing potential, 2) potential uplift in interest rate volumes from trough levels and 3) increased comp valuations.
Our 24.5x P/E multiple is higher than the 17.3x median of CME’s historical forward P/E ratio over the past 12 months. However, it is well lower than the median of 32.5x over the last three years and below peak of 39.3x.
CME is currently trading at 25.1x our '09 EPS estimate and 21.4x '10. Close competitor ICE is trading at 25.5x '09 and 22.5x '10.
Risks
We rate CME’s shares Medium Risk. Our medium risk rating is due to: 1) long operating history in their core business (established in 1898), 2) five year operating history as a public company and 3) positive free cash flow generation. Changes in CME’s operating environment such as regulatory, economic, political and market conditions are generally beyond the company’s control.
The risks delineated below may, if their impact is less/more severe than we anticipate, cause the stock to exceed our target price or prevent the shares from attaining it.
Individual company specific positive risks include: 1) increase in contract volumes and 2) increase in margins / pricing. Individual company specific negative risks include: 1) revenues are closely tied to market volatility 3) revenues are dependent on trading volumes, 3) RPC could fluctuate significantly, and 4) clearing business could expose CME to credit risk of 3rd parties in a period of significant financial disruption (though this has never been an issue for CME through its long history).

TEN+ 2009-2010 1 July 2009
Citigroup Global Markets 17
DaVita Inc (DVA)
Gary Taylor +1-212-816-0975
Conclusion(s) — DVA is our top 12-month Buy. We believe the stock is currently over-discounting Federal healthcare reform risk and expect improved clarity in 2H09. In 2010, we expect investors to begin to value the 2011 acceleration in earnings that will be driven by the new Medicare bundled-payment scheme.
Bundling is a Game-Changer — In 2011, Medicare will begin paying dialysis providers a single payment amount per treatment, replacing the current itemized markup billing scheme. We believe the change gives DVA the opportunity to benefit from managing its current $1.2b annual drug spend. We believe EPO utilization could decline by 20-40%, with approximately the same impact on EPS.
Government Risk More than Discounted — DVA shares have suffered from concern that Federal healthcare reform could include the creation of “public plan” that would cannibalize commercial insured lives (driving adverse payor mix shift for DVA). Not only do we expect that such an outcome is unlikely, but we note one obvious legislative change (a 12-month MSP extension) would offset up to 20% commercial cannibalization (30-40m lives). We believe DVA’s economic resilience and earnings trajectory under bundling supports a forward P/E ratio more comparable to current mid-cap average of 13.5x than DVA’s current 10.4x P/E.
Company description
DaVita Inc. is the largest provider of dialysis services in the United States for patients suffering from chronic kidney failure, also known as end stage renal disease, or ESRD.
Investment strategy
We rate DaVita Inc Buy / Medium Risk (1M), with a 12-month price target of $62. We expect DVA shares to outperform over the next 12 months primarily because we believe the 2007 deterioration in EPO utilization will continue to stabilize, leading revenue/tx to stabilize and grow modestly in 2009. Both these factors are likely to increase investor confidence (i.e. valuation multiple) in projected consensus estimates for 2009.
Valuation
Our 12-month price target of $62 on DVA is constructed using a risk adjusted target P/E multiple 13.9x our $4.45 2010 estimate.
Given DVA’s market cap, we utilize the current year S&P400 P/E, roll the multiple forward onto our DVA earnings after risk-adjusting for relative growth, earnings quality, reimbursement risk, FCF ROAIC and balance sheet leverage. Each of these factors are calculated to drive a premium or discount vs. the S&P400 multiple. For example, we assign a higher target P/E for a company expected to grow earnings faster than the relative index (in this case the S&P400) during 2009 and 2010.
Health Care Facilities
Buy/Medium Risk 1MPrice (30 Jun 09) US$49.46Target price US$62.00Expected share price return 25.4%Expected dividend yield 0.0%Expected total return 25.4%Market Cap US$5,114M
Company Metrics
52-Week Range $60.18–$40.96 Div (E) $0.00 P/E (12/09E) 12.6x P/E (12/10E) 11.1x 12/08A EPS US$3.54 12/09E Cur EPS US$3.92 12/10E Cur EPS US$4.45
Price Performance (RIC: DVA.N, BB: DVA US)
TEN+ 2009-2010 1 July 2009
Citigroup Global Markets 18
Risks
We rate DVA as Medium risk because of the stability of its business model, revenues, cashflow and profitability. We also consider the stock’s historic volatility in our rating.
Risks to the stock achieving our target price include:
1. DVA’s commercial payment rates are approximately 4x higher than its Medicare payment rates. This alarming differential is largely explain by Congressional failure to annually update MDCR payments for inflation (i.e. MDCR payments are too low vs commercial payments being too high). The dialysis industry has been forced to drive materially all its profits from commercial payors. Payor pushback on payment rates is a constant for all providers (including DVA) during a slower commercial underwriting cycle. If we have not modeled these slower rate increases appropriately (we are modeling approximately 4% annual commercial payment rate increases from 2008-2010), our estimates could be too high.
2. DVA has several outstanding civil inquiries primarily related to drug administration (NY, MO, NV, TX). While we believe these inquiries have more potential to impact investor sentiment than company fundamentals, we cannot predict the ultimate outcome of these inquiries.
3. DVA relies on a competitor for the purchase of dialysis machines (primarily) and supplies. If this competitor were to change the current economic arrangement with DVA, DVA could be impacted (we note that such purchases are less than 2% of operating expenses on the income statement and the equipment purchases are capitalized).

TEN+ 2009-2010 1 July 2009
Citigroup Global Markets 19
Equinix Inc (EQIX)
Michael Rollins, CFA +1-212-816-1116
Investment Thesis — Our investment thesis for Equinix reflects demand trends that should remain durable with the prospects for better booking activity in 2H/09, as EQIX should benefit by opening centers in some of its constrained markets. We also believe the company’s discretionary cash flow from its existing center portfolio supports further upside in the share price.
Pricing Remains Stable — We believe the pricing environment is stable with management's expectations, as EQIX maintains it is unwilling to trade pricing for volume given its disciplined approach and goal to protect the profitability of the customers that reside in full or near-full centers.
Opportunity for Shareholder Returns — EQIX previously indicated that its 2Q/09 net debt to adj. OIBDA ratio should be roughly 2.5-2.6x, whereas EQIX retains its long-term target for net leverage to be in the 3-4x range, leaving significant financial flexibility to improve shareholder returns by using its balance sheet to opportunistically reinvest in assets or repurchase shares over time. Our recently revised revenue forecast for 2Q/09 at $209.5 mil includes roughly half of the potential FX benefits we forecast in 2Q/09.
Bottom Line — We remain a buyer of EQIX as the company continues to generate solid revenue & strong OIBDA growth in a tough economic climate, while we believe our discretionary cash flow per share forecasts of $6.64 for '09 and over $10 for '10 should provide valuation support.
Company description
Equinix is a leading provider of collocation, interconnection, and managed services to a variety of enterprises, content companies, system integrators, and telecom network service providers. The company operates Internet Business Exchange (IBX) data centers in the United States, Europe, and Asia-Pacific.
Investment strategy
We recommend Equinix shares with a Buy/Speculative (1S) rating, as we believe the company has entered into a favorable revenue cycle with new centers now on-line, a solid pricing environment that is likely to find support for at least the next 12-months, and significant upside potential for the stock based on our valuation analysis. In the near-term, we think the newly-launched data centers and its European acquisitions will contribute a greater amount of revenue with favorable data points on bookings. We also believe there is potential to use financial leverage to improve shareholder returns through either expansion and/or cash repatriation to shareholders.
Valuation
We have a $95 target price based on the simple average of the following methodologies. Our DCF analysis assumes that revenues scale from over $860 mm in 2009 to $1.29 bil. by 2015 and that OIBDA margin expands to about 51.6%. Based on these assumptions and a WACC of 9.5% (using a target debt-to-total-capital ratio of 50%), we arrive at an operating EV of $5.09 bil. From this amount, we subtract year-end 2009 net debt of $962 mil. and add $172 mil. of options and warrants proceeds, to derive equity value of $4.20 bil. or approx. $96 per fully diluted share. Our DCF assumes a cost of equity of 13.6%
Telecommunications -
Infrastructure Services
Buy/Speculative 1SPrice (30 Jun 09) US$72.74Target price US$95.00Expected share price return 30.6%Expected dividend yield 0.0%Expected total return 30.6%Market Cap US$2,761M
Company Metrics
52-Week Range $95.23–$32.72 Div (E) $0.00 P/E (12/09E) 56.0x P/E (12/10E) 37.5x 12/08A EPS US$0.79 12/09E Cur EPS US$1.30 12/10E Cur EPS US$1.94
Price Performance (RIC: EQIX.O, BB: EQIX US)

TEN+ 2009-2010 1 July 2009
Citigroup Global Markets 20
(including a risk-free rate of 2.7%, a 6.4% equity risk premium, and a 1.7 equity beta), an after-tax cost of debt of 5.4% (assuming a pretax cost of debt of 5.4% and an effective tax rate of 40%), and terminal unlevered FCF growth rate of 3%, and terminal FCF multiple of roughly 15.4x.
On an OIBDA basis, we apply a 10x forward multiple on our 2010 OIBDA estimate of $11.51 per share and adjust our OIBDA estimate for net debt and options and warrants to arrive at an equity value of $95 per share. Our multiple of 10x reflects an estimated 3-year OIBDA CAGR (2010-2013) of 10.8%. This multiple is below the range of around 13-15x ‘10E OIBDA multiple on tower stocks, as EQIX's OIBDA margins are lower than those of towers. On a FCF basis, we believe Equinix should trade at 10x our 2010 estimate of $9.41 per share based on expected favorable FCF growth with less financial leverage than the tower companies, yielding a discounted value of around $94 per share. We base our 10x target multiple as a result of our compounded annual growth rate of 30.1% between 2010-13E for Equinix, which is higher than our estimates for the tower stocks under 20% between 2010-13E.
Risks
We rate shares of Equinix Speculative, given the negative earnings in 2004 and 2005, despite strong revenue and operating cash flow growth. Equinix is in the early stages of growth, and we expect significant stock price volatility ahead.
Investment risks include: 1) product category growth is difficult to estimate; 2) pricing & demand for Equinix's collocation space and interconnection services may not increase as we have anticipated and forecast; 3) incremental revenue is heavily skewed to the success of selected markets; 4) capital spending could pick up with a reinvestment cycle; and 5) execution and integration risk associated with its recently closed acquisition of IXEurope.
If the impact from these risks turns out to be greater than we anticipate, the shares could fail to achieve our target price.

TEN+ 2009-2010 1 July 2009
Citigroup Global Markets 21
Estee Lauder Inc (EL)
Wendy Nicholson +1-212-816-8216
New Leadership Should Continue to Drive Change — On July 1, current President and COO Fabrizio Freda will assume the role of CEO at EL. Having joined the company in March 2008, with the understanding that he would move into the CEO role over time, we have already started to see the positive impacts that Freda is having on the organization in terms of both the financial discipline and reliance on analytics that he offers as a PG alum, but also in terms of better aligning the culture of the organization with the demands of a publicly-traded (as opposed to family-run) company.
Restructuring Savings to Drive Margin Expansion and Earnings Growth — With EL in the early innings of a ~$500 million restructuring program targeted to generate 500-600 bps of operating margin expansion between fiscal 2009 and 2013, we believe there is ample room for EL to better leverage its best in class gross margin through cost discipline and organizational realignment, which operating savings should fuel earnings growth and drive multiple expansion as investors become more confident in EL's ability to allow cost savings to flow through to the bottom line (as opposed to being reinvested, which had historically been the case).
We Take the Long-Term View When it Comes to Valuation — While in the short term, the strong move in EL's share price has caused some investors to argue that EL's valuation is full, we are taking a longer-term view of the EL story. Since the company's IPO, EL's share price has traded at 25x forward earnings, and with the shares currently trading at discount to historical levels (at 18x our CY10 EPS estimate), we believe that there is ample opportunity for the stock to move higher.
Company description
Founded in 1946 by Joseph and Estee Lauder, Estee Lauder Companies Inc. (EL) is a premium-end global cosmetics powerhouse. The company sells products in the skin care, makeup, fragrance, and hair care categories, at more than 20,000 points of sale in more than 140 countries, including the following brands: Estee Lauder, Clinique, Aramis, Origins, Prescriptives, M.A.C., Bobbi Brown, Tommy Hilfiger, La Mer, Aveda, Donna Karan, Jo Malone, and Bumble & Bumble. In addition, the company has expanded its chain of freestanding retail stores (primarily for its M.A.C., Origins, and Aveda brands), and also sells products online.
Investment strategy
We rate the shares of Estee Lauder Companies Inc. Buy/Medium Risk (1M). We continue to believe in Estee Lauder as a longer-term growth story. Indeed, we are encouraged by: 1) the growth opportunities that the company has in emerging markets; 2) the plans it has in place to improve its profit margins, through reducing both its costs of goods and overhead expenses and 3) the company's strong cash generation, which should enable it to not only fund acquisitions but also repurchase shares, thereby boosting EPS. With the stock trading at a discount relative to many of its peers, we rate Estee Lauder a Buy.
Home and Personal Care
Buy/Medium Risk 1MPrice (30 Jun 09) US$32.67Target price US$40.00Expected share price return 22.4%Expected dividend yield 2.1%Expected total return 24.5%Market Cap US$6,426M
Company Metrics
52-Week Range $54.35–$19.82 Div (E) $0.67 P/E (6/09E) 24.2x P/E (6/10E) 19.1x 6/08A EPS US$2.40 6/09E Cur EPS US$1.35 6/10E Cur EPS US$1.71
Price Performance (RIC: EL.N, BB: EL US)

TEN+ 2009-2010 1 July 2009
Citigroup Global Markets 22
Valuation
Over the past decade, EL has traded between a 7% discount and a 92% premium to the S&P 500, averaging a 34% premium to the market. We expect EL's sales and earnings growth from quarter to quarter will continue to be lumpy (owing to the timing of new product launches and the realization of cost savings), while also being pressured by the challenging global macro environment and the strong U.S. dollar. Nevertheless, we believe EL is well positioned to deliver operating margin expansion in 2010, as we expect that under the leadership of Fabrizio Freda cost-cutting improvements will accelerate in the years to come, such that over the longer term, EL should be able to close the gap between its very high gross margins and its weak operating margins. Therefore, we assert that the stock should trade at a 25% premium to the market. Based on our CY10 earnings estimate of $1.87 and our targeted 25% premium to the S&P 500's roughly 17x multiple, we derive a $40 target price on EL's shares.
Risks
We rate Estee Lauder Medium Risk, due to the following factors, which could also prevent the stock from reaching our target price. We are concerned about the company's reliance on prestige department stores as a distribution channel, given what we view as the volatility and economic sensitivity of the channel. In order to grow its top line, Estee Lauder has relied on heavy investment spending, which we believe has pressured the company's profit margins. Given that EL is taking steps to reduce its cost structure, we are watchful of the company's operating margins, which we note are at the low end of its U.S. HPC peer group. In addition, we are watchful of EL's increasing dependence on growth from emerging markets (as we expect that expansion into these markets will be a primary growth driver going forward), given EL's limited experience with these volatile and competitive markets (relative to many of its HPC peers). Finally, while Fabrizio Freda is set to be EL's new CEO, succeeding William Lauder, the grandson of the company's founder, the Lauder family is still the dominant shareholder in the company and remains very involved in the day-to-day operations of the company. And, while we are encouraged that new management has joined the organization, we also note the risk associated with the impending transition of company management. If the negative impact on the company from any of these factors proves to be greater than we anticipate, the stock will likely have difficulty achieving our target price.

TEN+ 2009-2010 1 July 2009
Citigroup Global Markets 23
Gilead Sciences Inc (GILD)
Yaron Werber, MD +1-212-816-8836
Our View —Gilead is a market leader in HIV with best in class drugs, underappreciated pipeline and proven management. We like both long-term and short-term growth prospects of Gilead and feel conformable with our higher-than-consensus HIV estimates, driven by ongoing expansion of its HIV franchise. We believe the company is also relatively insulated from the ongoing healthcare reform efforts and macro economic weakness.
New HIV Patient Growth — We believe that the HIV market will expand dramatically over the next 12-24 months, driven by potential publication of new HIV treatment guideline in H2:09. These may call for earlier onset of therapy in patients before the disease kills too many white blood cells in the body which fight off infections. Our recent HIV survey and analysis suggests that these guidelines may add 63K-142K (18%-40%) patients to the market. More so, our analysis suggests that continuing switching from GSK's abacavir to Gilead's tenofovir could add another 20K patients. Our sensitivity analysis suggests that every 10K new patients in U.S./ex-US on Atripla/Truvada could boost '10 EPS by $0.05-$0.09.
Above Consensus Sales Estimates — We expect continuing sales growth in U.S., driven by an increase in newly diagnosed patients and treatable naïve patients due to HIV guideline changes, and significant upside in EU due to: 1) Atripla launch in France in 1H09 (+68K target population), and 2) further market penetration. Thus, we are comfortable with our above consensus HIV sales forecasts in '09 (CIR $5,444M vs con. $5,368M) and '12 (CIR$8,671M vs con. $7,722M). Our sensitivity analysis suggests that every 10% market share gain for Atripla/Truvada in U.S./ex-U.S. could enhance '10 EPS by $0.04-$0.07.
Limited Exposure to Healthcare Reform — We expect President Obama's proposed healthcare reform to have minimal impact on Gilead's earnings. Given that Gilead has little and no exposures to Medicare part D and part B respectively, it appears well insulated from potential reimbursement cuts. Under a draconian measure (that we think is not likely), Gilead's '12E EPS may decrease by only ~3.5%.
Quad Pill Could Drive Long-Term Growth— We believe that the "quad pill", which combines Gilead's Truvada with elvitegravir and GS9350, could potentially be the key driver of Gilead's long-term growth. Given the quad's pill's favorable profile to offer strong efficacy, better durability/ tolerability and low pill burden, this drug could be a significantly boost to Gilead's HIV franchise. We expect data from the Phase 2 study in early '10.
Company description
Gilead Sciences (GILD) is dedicated to the discovery and commercialization of therapies for infectious diseases. Gilead's best-in-class HIV franchise is comprised of Viread, Emtriva, Truvada, and Atripla. Viread was approved in the U.S. in 2001 and is the leader in its class of nucleoside reverse transcriptase inhibitors for HIV.
Investment strategy
We rate the shares of Gilead Sciences Buy/Medium Risk (1M). In our view, Gilead is slated to post an 16% EPS CAGR from 2009-'12 due to its premier HIV franchise. We continue to model above-guidance sales and above-consensus earnings and expect Gilead to benefit from recent HIV guideline changes that support more aggressive HIV therapy Based on our analysis, HIV guidelines will be changed again in H2:09 to recommend starting therapy in
Biotechnology
Buy/Medium Risk 1MPrice (30 Jun 09) US$46.84Target price US$56.00Expected share price return 19.6%Expected dividend yield 0.0%Expected total return 19.6%Market Cap US$42,456M
Company Metrics
52-Week Range $57.63–$35.60 Div (E) $0.00 P/E (12/09E) 17.7x P/E (12/10E) 15.4x 12/08A EPS US$2.20 12/09E Cur EPS US$2.65 12/10E Cur EPS US$3.05
Price Performance (RIC: GILD.O, BB: GILD US)

TEN+ 2009-2010 1 July 2009
Citigroup Global Markets 24
patients with CD4 levels of 350-500 cells/mm3. This can add another ~63k patients in the U.S. (+18% market expansion).
If the HIV treatment guideline change to also include starting therapy in CD4 levels of >500 cells/mm3, that could add additional 79k patients based on our HIV survey.
We also anticipate that Gilead will capture another 20k patients from GSK’s abacavir based on the DAD study data and results from our survey.
Furthermore, we believe Gilead possesses one of the more promising pipelines in the biotech industry with elvitegrevir (GS9137), HIV booster (GS9350), and quad pill for HIV. This franchise could sustain growth into the out-years. While we are not fans of the proposed-acquisition of CV Therapeutics, we believe that Ranexa can provide sufficient sales to justify a modestly profitable CV franchise.
We expect that the upcoming ph 3 data for darusentan from the DAR-311 study (full results at the American Society of Hypertension meeting on May 8th in an oral presentation) will be positive (solid efficacy with good safety profile), thereby adding another highly complimentary asset to the CV franchise.
Valuation
Our $56 target price is based on 18.5 x our 12-month forward P/E multiple applied to our 2010 non GAAP EPS (excluding impact of employee stock options) estimate of $2.97. In our P/E multiple analysis, a forward multiple of 18.5 x our fully taxed, non GAAP 2010 EPS estimate of $2.97 represents a premium to the estimated 13x 2010 EPS multiple for the peer group, which our work shows has traded in a range from the mid-teens to low-40s excluding historical bubble years within the sector. We believe a premium multiple is appropriate for Gilead because of its best-in-class HIV franchise and significant operating leverage.
Risks
We rate Gilead Sciences Medium Risk (M) owing to the company's market leading HIV franchise that faces little to no competition. Visibility into revenues for this franchise is solid. Gilead also has a maturing pipeline that should grow and diversify the company’s revenue base.
Risks we see to the stock achieving our valuation target include the following:
While Gilead has the premier HIV franchise today, future growth depends on the ability of Truvada and Atripla to capture market share from GSK’s abacavir and is dependent upon ongoing expansion of the HIV patient pool.
We also see clinical development risks to GS9137 because it will be tested head to head against Merck’s Isentress (MK-0518) in phase 3 studies.
The proposed acquisition of CVT will incur modest dilution initially and opens Gilead to execution risk since Ranexa has been a disappointing seller.
Darusentan is currently in ph 3 studies. The DAR-311 data will be announced in a press release likely in April and full data is expected at the American Society of Hypertension (ASH) meeting on May 6-9. Given the proposed CVT’s deal, investors now assume that the data will be positive.
If the data disappoints, the stock may trade down 10%.
If the negative impact of these risk factors is greater than we anticipate, shares may have difficulty achieving our target price.

TEN+ 2009-2010 1 July 2009
Citigroup Global Markets 25
Google Inc (GOOG)
Mark S. Mahaney +1-415-951-1744
Why Now? — We are reiterating our Buy on GOOG, our top Large Cap Internet stock, based on our extensive channel checks and sensitivity analysis that supports Q2 estimates. Based on Search Engine Marketer checks (representing $1B+ in search spend), our participation in the Seattle SMX Advanced search conference, and our model sensitivity work, we believe the June quarter Street estimates are reasonable. This may not sound like a bullish read, but after two quarters of negative intra-quarter Street revisions, we view this as a stable positive.
Our Edge: Cyclical And Other Factors Point To 2010 GOOG EPS Upside — The Street is looking for 14% ’10 EPS growth to $24.00 vs. our 20% assumption to $25.51. Our review of GOOG’s three basic EPS drivers (Paid Clicks, Cost Per Click & Margin Expansion) suggests that Street estimates assume little-to-no cyclical recovery in Google’s business model. We respectfully disagree. Quick math: 10%+ Paid Click Growth X 5%+ CPC Growth X Modest Margin Expansion = 20%+ EPS Growth.
Catalysts: "Smartphone Summer" & Other Datapoints Highlight New Mobile
Secular Driver — A) In the Founders’ Letter, GOOG discloses that almost 1/3rd of its Searches in Japan are coming from Mobile devices. Our checks suggest these are largely incremental Searches. B) New comScore survey data shows that 35% of all U.S. Mobile users and 48% of users with newer phones are using Mobile Internet services, with Search the #1 Mobile Browsing activity. And C) Major Smartphone launches this Summer (e.g. Palm Pre, Apple iPhone, Android versions) should further boost Mobile Internet. The So-What here is that Mobile Internet is beginning to emerge as a material Secular Growth driver for GOOG.
There Are Risks Here... — 1) Several recent key executive departures; 2) Increased regulatory scrutiny; 3) Unknown long-term commitment to cost controls; 4) Competitor offerings...
...But We Find The Reward Greater — GOOG presents as a) an Internet advertising secular growth story; b) a consistent market share gainer; c) a cyclical recovery story, with accelerating revenue, EPS, and FCF growth going into ’10 that is underestimated by Street; and d) a beneficiary of new mobile Internet secular driver. We believe these translate into stock outperformance.
Company description
Google Inc (GOOG) is a global technology company focused on improving the way people connect with information. It is a leading global Internet brand and one of the most trafficked Internet destinations worldwide. Google maintains the world's largest online index of Websites and other content, and makes this information freely available to anyone with an Internet connection. Google generates revenue by delivering relevant, cost-effective online advertising. Businesses use Google's AdWords program to promote their products and services with targeted advertising. In addition, thousands of third-party Websites that comprise the Google Network use the Google AdSense program to deliver relevant ads that generate revenue and enhance the user experience.
Internet
Buy/High Risk 1HPrice (30 Jun 09) US$421.59Target price US$580.00Expected share price return 37.6%Expected dividend yield 0.0%Expected total return 37.6%Market Cap US$133,197M
Company Metrics
52-Week Range $554.53–$257.44 Div (E) $0.00 P/E (12/09E) 19.9x P/E (12/10E) 16.5x 12/08A EPS US$19.50 12/09E Cur EPS US$21.19 12/10E Cur EPS US$25.51
Price Performance (RIC: GOOG.O, BB: GOOG US)

TEN+ 2009-2010 1 July 2009
Citigroup Global Markets 26
Investment strategy
We rate the shares of Google Inc Buy/ High Risk (1H). Our long-term thesis includes 1) strong secular growth in online advertising; 2) direct exposure to search, the most robust online ad segment; 3) clear market leadership; 4) underappreciated potential for expansion beyond traditional search; and 5) the strongest outlook fundamentals in the sector. In addition, we refocused on long-term risks such as 1) competition from Microsoft, Yahoo, and others; 2) a limited execution record; and 3) headline risk around aggressive industry online ad practices.
Valuation
We derive our $580 target price for Google based on GAAP P/E and Proforma P/E analysis.
We apply a 26x multiple to our 2010 GAAP EPS estimate of $22.13 to reach $576. Our target multiple is largely driven off of growth assumptions, but we also usually consider historical multiple ranges, relative sector multiples, and intangibles, such as management's execution track record. Since the beginning of 2007, Google has traded at a forward GAAP P/E multiple between 14x and 40x, with an average of approximately 29x. For context, GOOG currently trades at 23X our '09 GAAP EPS of $18.27.
We apply a 23x multiple to our 2010 Proforma EPS (excl. stock based comp) estimate of $25.51 to reach $587. Since the beginning of 2007, Google has traded at a forward Proforma P/E multiple of between 12x and 36x, with an average of approximately 25x. For context, GOOG currently trades at 18X our '09 Proforma EPS of $21.19.
Our $580 PT is the rounded average of the above two approaches. Also for context, our $580 PT is supported by a 7 Year DCF applying a WACC of 10% and a Terminal Growth Rate of approximately 5%.
Risks
We rate Google High Risk, reflective of the highly competitive landscape the company faces, and the intrinsically-high valuation multiples of growth stocks, especially in the Internet sector. These risks are somewhat offset by the company's strong balance sheet ($8 billion-plus in cash) and by the liquidity of its shares. Note that the investment risks laid out below may impede the stock from reaching our target price. Specific risks include 1) very significant competition from Internet-related companies like Yahoo! and Microsoft; 2) a limited track record and limited visibility; 3) exeuction risk with YouTube and DoubleClick (after pending approval) and 4) potential exposure to concerns over aggressive industry online advertising practices; and 4) potential slowdown in online advertising due to macro economic conditions.
If the impact on the company from any of these factors proves to be greater/less than we anticipate, it may prevent the stock from achieving our target price or could cause our target price to be materially outperformed.

TEN+ 2009-2010 1 July 2009
Citigroup Global Markets 27
Halliburton Co (HAL)
Robin Shoemaker +1-212-816-3258
Investor Perceptions Lag Reality — We view Halliburton as an international growth story more than a play on the U.S. drilling recovery. While 50%-60% of EBIT has come from North America in recent years, we believe the company’s success in winning major international oil service contracts has not received the attention it deserves. We believe investor perceptions lag the reality of what HAL is today — a strong “high-tech” global competitor. International EBIT is expected to reach 65%-70% of total EBIT by 2011, even as a recovery in North America unfolds. The shift in sales mix to high growth/high margin international markets could help to close the valuation gap between HAL and its peers.
A Tailwind From Oil Prices — Weak and unstable oil prices in early 2009 caused several of Halliburton’s large international drilling projects to be slowed down or scaled back at the customer’s request, but the recent surge in oil prices towards $70 per barrel should help to reaccelerate the timetables of these projects. A stepped-up pace of international activity could boost revenues in the high growth/high margin international regions. Average revenue per drilling rig in the international arena is 2.5 times the North American average.
Acquisitions Could Enhance Returns — With $3 billion in cash and a debt to total capitalization ratio of 36%, Halliburton is strongly positioned to seek accretive acquisitions as the oilfield services market bottoms and begins to recover. The company seeks to boost its international footprint and its production enhancement technologies through acquisitions. A substantial acquisition or a series of smaller acquisitions in the early stages of a drilling cycle could boost returns through the next cycle.
Valuation Discount Unwarranted — In 2008, Halliburton generated the highest ROCE among the multi-service providers: 32% for HAL versus a peer group average of 23%. Nonetheless, HAL shares trade at a 24% discount to the 2010E group P/E multiple and at a 14% discount to the group EV/EBITDA multiple. Versus some of its peers, HAL’s multiples are severely depressed at a 26% and 35% discount, respectively. Halliburton is expected to generate the second best EBIT margins among its peers in 2009 and 2010. We believe that HAL’s multiples will expand as its operating results continue to stand out.
Company description
Halliburton provides a comprehensive scope of products and services in well construction, production infrastructure, and energy-related capital equipment. The company provides discrete services and products and integrated solutions to customers in the exploration, development, and production of oil and gas. Halliburton has three segments: Drilling and Formation Evaluation, Fluids, Production Optimization, and Digital Solutions.
Investment strategy
We rate Halliburton shares Buy/High Risk (1H) with a $27 target price. Halliburton looks attractive to us in spite of the worldwide retrenchment in demand for oilfield services because of its geographic and product line
Oilfield Equipment &
Services
Buy/High Risk 1HPrice (29 Jun 09) US$20.94Target price US$27.00Expected share price return 28.9%Expected dividend yield 1.4%Expected total return 30.4%Market Cap US$18,786M
Company Metrics
52-Week Range $55.38–$12.80 Div (E) $0.30 P/E (12/09E) 15.1x P/E (12/10E) 13.8x 12/08A EPS US$2.87 12/09E Cur EPS US$1.37 12/10E Cur EPS US$1.50
Price Performance (RIC: HAL.N, BB: HAL US)
TEN+ 2009-2010 1 July 2009
Citigroup Global Markets 28
diversity and its strong balance sheet. Halliburton is focused on four key technology areas related to finding, producing, and enhancing production of oil and natural gas: Drilling and Formation Evaluation, Fluids, Production Optimization, and Digital Solutions. Among its core businesses, pressure pumping services is the largest, providing significant earnings leverage to worldwide E&P activity.
Valuation
We derive our $27 HAL target price by averaging P/E and EV/EBITDA methodologies. Our target is based on historical analysis of HAL and group multiples, which exhibit very high correlations to both the level and direction of forward earnings expectations. In general, as earnings rise multiples compress in a relatively consistent and predictable pattern with peak multiples occurring near the earnings trough and multiple lows occurring near the peak of earnings. With the level of base earnings significantly higher than in prior cycles and a visible path to recovery likely to emerge over the next 12-months, we believe discounted multiples to historical peaks are warranted.
Our P/E derivation generates a target price of $26 by applying a 17.5x multiple to our forward 12-month EPS estimate of $1.46. The multiple is below the 23.3x peak HAL multiple reached in the most recent downturn and is well above the 6.3X trough reached at the peak of the last upturn. The multiple is based on historical analysis of HAL and relative market multiples and is within the 9.6x–49.8x historical range where the average of large cap services stocks traded over the past ten years. The median group P/E multiple was 19.8x in the most recent cycle.
Our $27 EV/EBITDA derivation applies an 8.5x EV/EBITDA multiple to our forward-12-month EBITDA of $3.0 billion. The multiple is below the 10.9x peak HAL multiple reached in the most recent downturn and is well above the 3.7X trough reached at the peak of the last upturn. The multiple is based on historical analysis of HAL and relative market multiples and is within the 5.2x–17.7x historical range where the average of large cap services stocks traded over the past ten years. The median group EV/EBITDA multiple was 9.9x in the most recent cycle.
Our forward 12-month estimate reflects the four quarters earnings stream beginning 12 months from the most recently reported quarter.
Risks
Our risk rating on Halliburton is High based on a combination of quantitative and qualitative assessments compared with those faced by other stocks covered by Citigroup Investment Research (CIR). The principal elements of risk we see for Halliburton, relative to the CIR coverage universe, are high earnings and stock price volatility. In addition, the SEC and the US Department of Justice are conducting investigations into possible violations under the Foreign Corruption Practices Act and antitrust violations, both related to historical KBR activity in the LNG sector. If violations are uncovered, the company could incur material monetary penalties; however, it is impossible to assess the magnitude of such a scenario. Derivation of our target price and ETR is based on projected financial performance, which is highly dependent on the level of oil and gas exploration and production (E&P) activity. E&P activity can be significantly affected by changes in oil and gas prices. HAL's performance is particularly sensitive to the NAM natural gas and pressure-pumping markets. If the negative impact from any of these factors proves to be greater than we anticipate, the stock could materially underperform our target price.
TEN+ 2009-2010 1 July 2009
Citigroup Global Markets 29
Hershey Foods Corp (HSY)
David Driscoll, CFA +1-212-816-0440
Why Now? — In response to rising input costs, Hershey has raised list prices across its entire domestic portfolio by +10% in 2009 and is also increasing its promoted prices. We believe these pricing actions will unlock Hershey's margin potential and drive 10% compounded EPS growth over the next three years.
The Edge — We believe that the improving operating margin story unfolding at Hershey is not reflected in consensus estimates which only project +6% compounded growth. Our 2009-2011 EPS estimates exceed consensus by +1c, +9c, and +22c, respectively.
Key Catalysts — We see Hershey's earnings potential being uncovered in upcoming earnings reports and believe the stock is set up for significant upside.
Restructuring Program is Largest in Hershey History — Hershey's restructuring is expected to generate $175-$195 mm in annual savings upon completion in 2010 and is seen fully funding increased advertising spending.
Weak Economy Favors Value Oriented Chocolate — Consumers continue to trade down from high priced premium chocolate to value orientated chocolate offerings. This trend has played to Hershey strength as the firm's portfolio is heavily weighted towards value products.
Company description
Hershey Foods Corporation (HSY) is primarily involved with the manufacture, distribution, and sale of its confection and grocery products, mostly in the U.S., Canada, and Mexico. It also exports, markets, sells, and distributes to more than 90 countries worldwide. Confection products are sold in the form of bar goods, as well as bagged and boxed items, while the grocery products are sold in the form of baking ingredients, chocolate drink mixes, peanut butter, dessert toppings, and beverages. Some of the company's most popular products include Hershey's chocolate and chocolate with almonds bars, Hershey's Kisses brand chocolates, Reese's peanut butter cups, Jolly Rancher and Twizzlers candies, Hershey's cocoa, and Hershey's syrup. The company also carries leading gum and mint brands such as Ice Breakers, Breath Savers, and Bubble Yum.
Investment strategy
We rate the shares of Hershey Foods Buy/Medium Risk (1M) as the stock appears undervalued at current pricing levels. Our target price reflects our analysis that despite the current headwinds created by an onerous input cost environment, Hershey should continue to generate solid cash flows and EPS growth in the high-single-digit range over the long term given its leading position in the steady U.S. chocolate market. We believe near-term company sales growth will come from increased advertising spending and resurgence in the firm's core chocolate business.
Food Manufacturers
Buy/Medium Risk 1MPrice (30 Jun 09) US$36.00Target price US$43.00Expected share price return 19.4%Expected dividend yield 3.3%Expected total return 22.8%Market Cap US$8,173M
Company Metrics
52-Week Range $44.23–$30.28 Div (E) $1.19 P/E (12/09E) 18.0x P/E (12/10E) 16.4x 12/08A EPS US$1.88 12/09E Cur EPS US$2.00 12/10E Cur EPS US$2.20
Price Performance (RIC: HSY.N, BB: HSY US)

TEN+ 2009-2010 1 July 2009
Citigroup Global Markets 30
Valuation
We value Hershey shares at $43 using a 19.5x-20.0x multiple range on our 2010 EPS estimate of $2.20.
Our target multiple compares to Hershey's historical 10-year forward P/E multiple range of 15.7x-27.4x, with a median multiple of 20.5x. We believe our multiple choice is appropriate given the current momentum we see building in Hershey's portfolio with sales growth and market share beginning to strengthen. Overall the firm remains the leader in U.S. chocolate and should benefit over time from its price increases and the firm's three-year plant rationalization program which is expected to generate $185MM in savings through 2010. This culminates in our beliefs that Hershey's should be able to grow earnings at a high-single-digit rate over the long term.
Risks
We apply a Medium Risk rating to HSY based on the steady nature of the company’s cash flows and its solid financial metrics as strengths, tempered somewhat by the overhang of the Hershey Trust’s level of control. We believe that Hershey has been able to produce solid cash flow numbers due to the non-cyclical nature of the food manufacturing industry, as total food expenditures in the U.S. have historically exhibited a linear trend.
In general, we think the risks that could make it difficult for the stock to reach our target price, are as follows:
HSY could suffer material cost increases if cocoa supplies were disrupted: HSY’s reliance on cocoa from developing nations with a recent history of unrest such as the Ivory Coast, exposes it to the risk of significantly increased costs of cocoa should further strife disrupt production.
HSY’s growth could be limited by its reliance on its domestic market: Given that the company’s International segment makes up less than approximately 10% of its total revenues, the company must rely on one single market to achieve its growth.
Obesity Concerns: Obesity concerns may start to negatively affect snacking categories if consumers begin to shift away from those types of categories.
Domestic share gains: If the company faces a more severe competitive environment than we anticipate, and if competitors materially increase their levels of new product innovation, the company could have more difficulty achieving share gains than we anticipate and under-perform our target.

TEN+ 2009-2010 1 July 2009
Citigroup Global Markets 31
Hewlett-Packard Co (HPQ)
Richard Gardner +1-415-951-1669
Why Now? — HPQ shares have experienced a “fall from grace” after reducing FY09 EPS guidance in February. The guidance reduction was primarily the result of a channel inventory correction in printer supplies, which has caused an unprecedented 15% yoy decline in ink and toner revenue. We see significant operating leverage during the coming year on a rebound in ink/toner and server sales, both products with significant fixed cost/expense.
Cyclical vs. Secular Confusion — Imaging stocks have been the worst performers in hardware YTD due to a larger than expected decline in ink and toner sales (15-21% declines for HPQ, LXK & XRX). Bears cite secular arguments (i.e., the rise of the wirelessly-connected portable device) to explain the unprecedented decline. Our checks suggest that channel inventory reductions (incl “supply closet de-stocking”) explain at least half of the ink/toner declines. We believe that most of the remainder represents a cyclical decline in printed page volume. During the early stages of a recovery, ink and toner sales should rebound before lower-margin hardware upgrades, placing upward pressure on IPG (Imaging & Printing segment) margins through 1HCY10. IPG represents 1/3 of HPQ’s total operating income.
Significant Leverage in Servers as Well — Server sales declined 29% year-over-year during the April quarter as companies postponed upgrades. Broad implementation of virtualization software (VMWare) should prompt a sharp rebound in upgrades in 2010 because new servers consume a fraction of the electricity of older servers and occupy less space. Because of heavy fixed costs associated with R&D and field sales/support, this business should enjoy significant operating leverage during a rebound.
EDS Cost Savings Still Ahead — Management has promised $2.5B in annual cost savings associated with the EDS acquisition by FY11 ($0.20-0.25 in annual EPS). Half of the headcount reductions and most of the real estate savings associated with this transaction lie ahead.
Compelling Valuation — HPQ is among the cheapest large cap hardware stocks at 9X F12 non-GAAP EPS and 11X F12 GAAP EPS (CIR ests). We currently forecast 14% EPS growth in FY10 (vs. consensus 9%), but see upside potential. If HPQ can deliver this growth, the multiple should also expand.
Primary Risk — Dilutive acquisition, although HPQ has been disciplined with acquisition pricing in the past.
Company description
Hewlett-Packard is a leading provider of computing and imaging solutions and services worldwide. In 2008, HP was the #1 maker of PCs worldwide with 19% share. HP has three major business segments: 1) Imaging & Printing Group (IPG; approx 25% of total revs; 15% op margin) provides laser and inkjet printers, supplies, multifunction and photo printers, wide/large-format printers, digital cameras and accessories, online photo services (through Snapfish), and imaging & software solutions and related professional & consulting services. 2)
PC & Enterprise Hardware
Buy/Medium Risk 1MPrice (30 Jun 09) US$38.65Target price US$54.00Expected share price return 39.7%Expected dividend yield 0.8%Expected total return 40.5%Market Cap US$92,229M
Company Metrics
52-Week Range $49.00–$25.39 Div (E) $0.32 P/E (10/09E) 10.3x P/E (10/10E) 9.0x 10/08A EPS US$3.63 10/09E Cur EPS US$3.77 10/10E Cur EPS US$4.28
Price Performance (RIC: HPQ.N, BB: HPQ US)

TEN+ 2009-2010 1 July 2009
Citigroup Global Markets 32
Personal Systems Group (PSG; approx 36% of total revs; 5-6% op margin) provides computing systems for the enterprise, SMB and consumers, including PCs & workstations, handhelds, digital entertainment systems, calculators, and software & related services. 3) Technology Solutions Group includes enterprise servers & storage; technology services, consulting, integration, and managed services; and management software solutions and support.
Investment strategy
We rate shares of HPQ Buy/Medium Risk (1M) with a 12-month price target of $54. We consider HPQ the enterprise hardware company most likely to grow EPS during a tough 2009 thanks to 1) the razor blade/razor nature of the inkjet business, 2) recent price increases on highly profitable ink and toner, 3) cost synergies associated with the EDS acquisition, 4) other cost reductions, and 5) share repurchase. Moreover, at just 8-9X F12 non-GAAP EPS, we view valuation as compelling.
Valuation
HPQ shares have traded in a core historical range of 11-20X F12 GAAP EPS (with a five-year median of 16.9X). Our target multiple of 12X (toward the low-end of the historical range) reflects higher required rates of return for risky assets in the current market environment, as well as the modestly lower earnings growth in our revised estimates. Applying a 12X multiple to F12 non-GAAP EPS of $4.48 for the four quarters beginning 3FQ10 yields a price target of $54.
Our discounted cash flow analysis, assuming 2% growth in revenue during the coming decade, 1% terminal growth in free cash flow, a beta of 1.1, and a 9.69% WACC suggests a fair 12-month value of $56. Based on these analyses, our target price is $54.
Risks
We rate HPQ shares Medium risk due to the company's large market cap, it's relatively low debt-to-capital ratio, solid cash generation and >50% recurring profit.
Risks to our target price include the following. HPQ faces a continuing cost disadvantage versus Dell in portions of the PC market. HP has meaningful exposure to several legacy RISC-UNIX server platforms which are likely to decline due to a market shift toward X86 platforms with superior price performance. One quarter of HP's total operating income comes from maintenance services where contract renegotiations and a mix shift away from proprietary servers within its installed base could lead to significant margin pressure. Inkjet supplies represent roughly one half of total operating income; if consumers increasingly opt for remanufactured/refilled cartridges or simply chose not to print documents or photos, operating income may be significantly negatively impacted. Dell has entered the retail-PC market; if Dell takes significant shelf-space and share away from HP in this segment, the profitability and growth of HP's PC division could be significantly impacted. HP's acquisition of EDS could result in margin dilution and significant integration risk. Should these factors have a greater impact on the company than we are anticipating, the shares could fail to reach our target price.
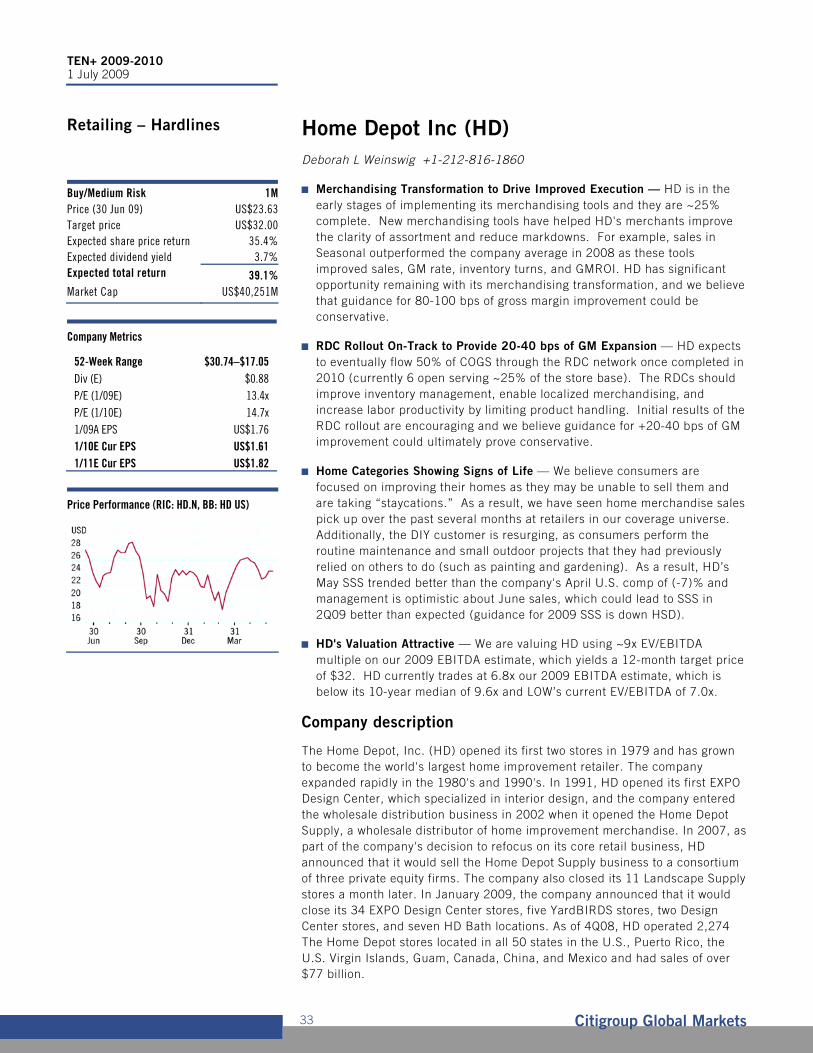
TEN+ 2009-2010 1 July 2009
Citigroup Global Markets 33
Home Depot Inc (HD)
Deborah L Weinswig +1-212-816-1860
Merchandising Transformation to Drive Improved Execution — HD is in the early stages of implementing its merchandising tools and they are ~25% complete. New merchandising tools have helped HD's merchants improve the clarity of assortment and reduce markdowns. For example, sales in Seasonal outperformed the company average in 2008 as these tools improved sales, GM rate, inventory turns, and GMROI. HD has significant opportunity remaining with its merchandising transformation, and we believe that guidance for 80-100 bps of gross margin improvement could be conservative.
RDC Rollout On-Track to Provide 20-40 bps of GM Expansion — HD expects to eventually flow 50% of COGS through the RDC network once completed in 2010 (currently 6 open serving ~25% of the store base). The RDCs should improve inventory management, enable localized merchandising, and increase labor productivity by limiting product handling. Initial results of the RDC rollout are encouraging and we believe guidance for +20-40 bps of GM improvement could ultimately prove conservative.
Home Categories Showing Signs of Life — We believe consumers are focused on improving their homes as they may be unable to sell them and are taking “staycations.” As a result, we have seen home merchandise sales pick up over the past several months at retailers in our coverage universe. Additionally, the DIY customer is resurging, as consumers perform the routine maintenance and small outdoor projects that they had previously relied on others to do (such as painting and gardening). As a result, HD’s May SSS trended better than the company's April U.S. comp of (-7)% and management is optimistic about June sales, which could lead to SSS in 2Q09 better than expected (guidance for 2009 SSS is down HSD).
HD's Valuation Attractive — We are valuing HD using ~9x EV/EBITDA multiple on our 2009 EBITDA estimate, which yields a 12-month target price of $32. HD currently trades at 6.8x our 2009 EBITDA estimate, which is below its 10-year median of 9.6x and LOW’s current EV/EBITDA of 7.0x.
Company description
The Home Depot, Inc. (HD) opened its first two stores in 1979 and has grown to become the world's largest home improvement retailer. The company expanded rapidly in the 1980's and 1990's. In 1991, HD opened its first EXPO Design Center, which specialized in interior design, and the company entered the wholesale distribution business in 2002 when it opened the Home Depot Supply, a wholesale distributor of home improvement merchandise. In 2007, as part of the company's decision to refocus on its core retail business, HD announced that it would sell the Home Depot Supply business to a consortium of three private equity firms. The company also closed its 11 Landscape Supply stores a month later. In January 2009, the company announced that it would close its 34 EXPO Design Center stores, five YardBIRDS stores, two Design Center stores, and seven HD Bath locations. As of 4Q08, HD operated 2,274 The Home Depot stores located in all 50 states in the U.S., Puerto Rico, the U.S. Virgin Islands, Guam, Canada, China, and Mexico and had sales of over $77 billion.
Retailing – Hardlines
Buy/Medium Risk 1MPrice (30 Jun 09) US$23.63Target price US$32.00Expected share price return 35.4%Expected dividend yield 3.7%Expected total return 39.1%Market Cap US$40,251M
Company Metrics
52-Week Range $30.74–$17.05 Div (E) $0.88 P/E (1/09E) 13.4x P/E (1/10E) 14.7x 1/09A EPS US$1.76 1/10E Cur EPS US$1.61 1/11E Cur EPS US$1.82
Price Performance (RIC: HD.N, BB: HD US)
TEN+ 2009-2010 1 July 2009
Citigroup Global Markets 34
Investment strategy
We rate the shares of HD Buy/Medium Risk (1M). We believe that the long-term outlook of the home improvement industry is favorable despite near-term weakness given rising home ownership and the aging of the U.S. housing stock. We believe that comparable store sales growth are beginning to show signs of life as home sales have been improving at many retailers and consumers are focused on improving their homes. However, they will likely continue to be somewhat pressured until housing turnover turns positive and housing prices stabilize. Also, slowing square footage growth could limit upside to long-term sales growth. We expect sales and margin improvement to be driven by HD's merchandising transformation project, supply chain improvements, and technology initiatives. We expect earnings to be driven by improved sales and margin initiatives over the next several years and would recommend that investors buy the stock as a result.
Valuation
We have assigned Home Depot a 1M (Buy, Medium Risk) rating. We are valuing Home Depot using an approximately 9x target EV/EBITDA multiple on our 2009 EBITDA estimate, which yields a 12-month target price of $32.
In our EV/EBITDA analysis, our target multiple of approximately 9x times our 2009 EBITDA estimate is in-line with HD’s ten-year median of 9.6x. We believe that an in-line EV/EBITDA multiple is justified given the potential for earnings upside in 2009 and improving home merchandise sales. In addition, the housing market is showing early signs of recovery in markets that fell first, and earnings could be improving given that the performance of home improvement retailers is strongly tied to the housing market. Our target multiple reflects our observation that same-store sales performance tends to lag housing turnover (currently negative) by approximately two quarters. Finally, we believe that improved execution on HD's merchandising and supply chain initiatives could drive gross margin expansion.
Risks
We rate HD Medium Risk based on stock liquidity, earnings stability, price volatility, credit ratings, and financial strength. Our rating also reflects industry and company specific risks.
Downside risks to the achievement of our valuation target include: 1) a greater-than-expected or prolonged slowdown in the housing market and/or declining consumer spending could negatively impact the sales and performance reflected in our estimates; 2) HD’s management may be unsuccessful in their efforts to improve the company’s core retail business; 3) the inability of HD to execute its merchandising and supply chain initiatives could prevent the company from achieving our EPS growth targets; 4) the company may decide not to complete its recapitalization program; and 5) stabilization and improvement in the housing market may be prolonged longer than expected and could lead to worse-than-expected sales and earnings.
If the impact on the company from any of these factors proves to be greater than we anticipate, it may prevent the stock from achieving our target price.

TEN+ 2009-2010 1 July 2009
Citigroup Global Markets 35
Ingersoll Rand Co LTD (IR)
Jeffrey T Sprague, CFA c+1-203-975-5051
Early Cycle Business Offer EPS Leverage — Initial signs of stabilization in IR’s early cycle businesses suggest an operational recovery on the horizon. The Trane residential, ThermoKing and residential Security businesses are all considered early cycle. These three businesses combined make up ~23% of total IR revenues in 2009 (9.3%, 9.7 and 3.7%, respectively).
Increased Confidence in Cost Savings — IR’s visibility on cost cutting actions continues to improve. Management expects to save an incremental $650mm in 2009 through Trane synergies, restructuring actions and productivity improvements. Incremental synergies in 2009 should reach $180mm. We believe cumulative synergy targets of $300mm by the end of 2009 and $400mm by the end of 2010 have upside. Aside from synergies, combined ‘08/’09 restructuring actions ($120mm projected spend) are expected to generate ~$160mm in cost savings. Productivity initiatives (i.e. alternative raw material sourcing options, improved labor costs, etc) are expected to save the company $310mm in 2009. Additionally, IR expects to save ~$150mm in commodity costs this year, driven by deflation and lower volumes.
Focus on Deleveraging the Balance Sheet — With liquidity concerns removed following the recent refinancing (3/30/09), IR can focus on deleveraging the balance sheet. We estimate IR now has a $1.7 billion liquidity cushion through the end of 2010 and no additional maturities beyond those accounted for above until 2012. Deleveraging over the next 2-3 years provides additional EPS upside and should drive a higher equity valuation. In fact, if we assume IR’s TEV/EBITDA multiple remains constant and value accretes to equity as debt is reduced, it implies a two-year 25% CAGR in share price appreciation.
Company description
Ingersoll Rand is a 100+ year old global diversified industrial firm providing products, services and solutions to enhance the quality and comfort of air in homes and buildings, transport and protect food and perishables, secure homes and commercial properties, and enhance industrial productivity and efficiency.
Investment strategy
We rate the shares of Ingersoll Rand Buy/ Medium Risk (1M). Ingersoll Rand has undergone a portfolio transformation this decade from a deep cyclical machinery co. to a more globally diversified multi-industry company. The company aims to continually increase its recurring revenue sales to help mitigate cyclical risk within the businesses. In the wake of its recent Trane acquisition the company will likely halt any further significant portfolio moves as it works to integrate the acquisition and reach its targeted synergies. Ingersoll considers navigating through the downturn its top priority. Focal points include delivering the acquisition synergies and restructuring savings, driving productivity & capturing savings from falling commodities and generating cash. Management appears to be doing a good job of waking up the sleepy 100 yr-old manufacturing company, but it was a “show-me” story that will be challenged in the near-term by the economic downturn. To help mitigate the effects of lower volumes and higher financing costs, management has implemented large restructuring initiatives which should support solid profitability in 2009. There are clearly risks to executing in such a tough fundamental environment, but IR has been executing
Multi-Industry
Buy/Medium Risk 1MPrice (30 Jun 09) US$20.90Target price US$26.00Expected share price return 24.4%Expected dividend yield 2.4%Expected total return 26.8%Market Cap US$6,669M
Company Metrics
52-Week Range $41.14–$11.46 Div (E) $0.50 P/E (12/09E) 11.6x P/E (12/10E) 10.2x 12/08A EPS US$3.34 12/09E Cur EPS US$1.80 12/10E Cur EPS US$2.05
Price Performance (RIC: IR.N, BB: IR US)

TEN+ 2009-2010 1 July 2009
Citigroup Global Markets 36
above plan for several quarters. Further, most of the fundamental actions required to achieve these benefits are already underway. IR successfully issued $1 billion of new financing on 3/30/09 and expanded its securitization program to access additional capital. Proceeds were used to pay down its looming $756mm bridge loan related to Trane, which is set to come due in June 2009. With liquidity now more secure, actual debt reduction should become a greater priority over the next 2 years. Deleveraging should result in more enterprise value accreting to equity and eventually drive multiple expansion higher. All considered, we believe modest risk remains to our full year estimates, but with signs of stabilization materializing and a compelling deleveraging story unfolding, we rate Ingersoll Rand a Buy rated stock.
Valuation
Our target is based on a relative group valuation framework. Our group has historically traded at about 16.5-17.0X forward earnings estimates. We believe earnings for most of our group may bottom in 2009. This should allow valuations on 2010 earnings to begin to expand. However, we are targeting a below average multiple of 16X to acknowledge still substantial global macro economic risks. This framework could prove conservative given that forward multiples moved into the low 20s in the recovery phase following the 2001-2003 downturn. We then set our targets for individual companies at a premium or discount to our group target of 16X based on historical relationships, portfolio changes and other factors. IR has averaged a 25% discount to our group over the last 10 years. However, this discount reflects the fact that IR was more of a machinery company until recently. Its business mix has changed substantially with the divestiture of Bobcat and acquisition of Trane as well as many other divestitures. We are targeting the stock at a 20% discount to reflect changes in its mix, deleveraging opportunities and increased confidence that IR can execute on internal savings plans. A 20% discount to our group target multiple of 16X results in a target multiple for IR of 12.8X. Applying this multiple to our 2010 estimate of $2.05 drives our price target of $26.
Risks
We rate Ingersoll Rand Medium Risk. IR's liquidity profile has improved materially since the Trane deal closed, especially with its April 2009 refinancing. However, we continue to look for progress in debt reduction in the midst of high earnings volatility. As IR delevers its balance sheet this could create significant value for equity holders. While financial theory argues that the value of a company is independent of how it is financed, from a practical standpoint we have observed that deleveraging companies enjoy an increase in TEV valuations. We believe this reflects a reduction in the real and perceived risk profile of the company. Significant periods of deleveraging have occurred at several Multi-Industry companies in our universe in recent years including ASD, ITT & TYC. In all cases, the reduction in debt was accompanied by multiple expansion and increased valuation.
Legacy costs have been a lingering concern for the company and while progress was made in Q407 to make an estimate of the total liability rather than the next 7 years, there is no certainty that the current allowance will prove sufficient. Finally, if Congress decides to retroactively reverse tax inversion legislation, Ingersoll Rand's tax rate would be higher than we are currently modeling, which results in a significant reduction to our earnings estimates. If the impact on the company from any of theses factors proves to be greater/less than we anticipate, it may prevent the stock from achieving our target price or could cause our target price to be materially underperformed.

TEN+ 2009-2010 1 July 2009
Citigroup Global Markets 37
Merck (MRK)
John Boris +1-212-816-1635
MRK Trades at a Trough Valuation – MRK trades at a trough multiple of ~7.8x our 2010E EPS, reflecting -37%/-19% discount to the S&P/peer group, reflecting the second lowest valuation amongst its U.S. large-cap pharma peer group. We believe the discount isn’t justified given the MRK + SGP NEWCO growth target, attractive 6% dividend yield, & pipeline opportunities.
NEWCO Growth Underappreciated – MRK announced the acquisition of SGP on 3/9/09. Their complementary portfolios, increased late stage pipeline opportunities, expanded global reach & substantial synergies enhance the NEWCO’s growth prospects. Our 2009-2013E NEWCO EPS CAGR is 9.5% (vs. 3.1% for MRK stand alone). If the NEWCO realize $4.5B in synergies (vs. $3.5B target) in ‘12E our cash EPS rises by ~$0.25; our 3-year NEWCO CAGR increases by 130bps to 10.8%. MRK is expected to maintain its dividend on strong FCF ($15B NEWCO target in ‘13). MRK assumes it retains the rights to SGP’s ex-US biologics franchise (Remicade/Simponi), which account for ~$0.30 of our proforma 2012E cash EPS of $4.43 (ex-amortization).
$3.5B in Synergies Appears Conservative – NEWCO is targeting ~90K employees after MRK eliminates 16K. MRK guided to $3.5B in synergies by 2012. MRK could extract an additional $1B in synergies benefiting the bottom-line by ~$0.25 (each $100M increment represents ~$0.025 in EPS to NEWCO).
NEWCO Has 17 Late Stage Pipeline Candidates – The deal diversifies a more US-centric MRK with greater exposure to ex-US markets. The NEWCO has complimentary businesses & pipelines, with 17 compounds in Phase III. MRK’s odanacatib (osteoporosis, bone metastasis), mTOR (oncology), MK-524a/b (cholesterol), the MEDX-licensed products (CDA-1/CDB-1 for hospital infections), & MRK’s early stage oncology products (MK-2206,MK-1775) are promising. MRK’s anacetrapib (HDL/LDL) is a very high-risk, high-reward pipeline asset. The SGP side has its thrombin receptor antagonist (TRA, for acute coronary syndrome); Saphris (asenapine) & Simponi (golimumab; EU recommended approval on 6/26/09; & boceprevir (oral PI for hepatitis C).
Key Catalysts – Include 4Q09 closing of the MRK + SGP deal; successful resolution of the biologic franchise (Remicade/Simponi) arbitration with JNJ; announcement of a higher synergy target; resolution of vaccine manufacturing supply issues; FDA action on Isentress in naive patients &Gardasil in males; & NDA filings for Lipitor+Zetia combo in ’09 & MK-8669 (mTOR) for cancer in ‘10.
Company description
Merck is a global leader in the pharmaceutical industry with an impressive scientific reputation. In 2008, Merck generated total pharmaceutical sales of $23.0 billion. Worldwide pharmaceutical sales were split about 56%:44% between the U.S. and overseas. Merck is a leader in cardiovascular drugs and also has franchises in vaccines, asthma, diabetes, antiinfectives, antivirals and oncology. In 2009, we expect Merck's top-selling drugs to include Singulair for asthma ($4.5 billion), Cozaar/Hyzaar for hypertension ($3.4 billion), Januvia/Janumet for type II diabetes ($2.4 billion), and Gardasil for HPV ($1.2 billion).
Drugs
Buy/Medium Risk 1MPrice (30 Jun 09) US$27.96Target price US$32.00Expected share price return 14.4%Expected dividend yield 5.4%Expected total return 19.9%Market Cap US$58,962M
Company Metrics
52-Week Range $38.90–$20.10 Div (E) $1.52 P/E (12/09E) 8.6x P/E (12/10E) 8.2x 12/08A EPS US$3.42 12/09E Cur EPS US$3.25 12/10E Cur EPS US$3.40
Price Performance (RIC: MRK.N, BB: MRK US)

TEN+ 2009-2010 1 July 2009
Citigroup Global Markets 38
Investment strategy
We rate the shares of Merck Buy/Medium Risk (1M) with a $32 price target. From a valuation standpoint, downside appears to be limited as Merck trades at a trough valuation to its historical forward looking multiple, while generating above average growth and ~6% dividend yield. Merck is entering a new product cycle and has an attractive pipeline of assets which should help it navigate through its 2010-12 period of generic risk. We see an upward bias to earnings driven by strong performance of recently launched drugs, including Januvia/Janumet and Isentress. We expect the company to use cost containment efforts to provide its business model with leverage that is underappreciated by the Street.
Valuation
Our $32 target price assumes Merck will trade in line with the 2009E average Drug P/E of ~10x. Our valuation of Merck is based on the company’s 1) top tier management, which is focused on long term growth; 2) proven track record in executing on the pipeline; 3) strong cash position which enhances its financial flexibility, and 4) in-line product portfolio with solid growth prospects. Over the past decade, Merck has traded at a mean of ~10% discount to its peers (range of a 25% discount to a 15% premium).
Risks
We rate Merck shares Medium Risk because of the company's strong balance sheet and cash-generating ability along with a strong pipeline and in-line product portfolio to offset weakness in any single product. However, risks to our rating and target price include: 1) patent expirations over the next few years exposing approximately 40% of its WW 2008 sales to exclusivity losses; 2) greater than expected decline in Vytorin/Zetia volume in light of the negative ENHANCE study results are pressuring its earnings; 3) a decrease in Singulair Rx trends due to the addition of spontaneous events to the label, a weak allergy season, and the launch of OTC Zyrtec; and 4) a longer than expected delay or no US launch of MK-0524a and b. On the other hand, stronger than expected uptake for Gardasil (HPV vaccine) and Januvia (Type II diabetes) along with a strong recovery of the cholesterol JV may cause our target price to be exceeded.
Investment risks related to the pharmaceutical industry include continuing political risk, product development risk, regulatory risk, and pricing pressures from payors. If the impact on the company from any of these factors proves to be greater/less than we anticipate, it may cause the stock to fall below our target price or could cause our target price to be materially outperformed.

TEN+ 2009-2010 1 July 2009
Citigroup Global Markets 39
MetLife (MET)
Colin W Devine +1-212-816-1682
MET Remains Our No.1 Idea — Life insurer valuations appear to have stabilized showing a 4% average rebound YTD, following an approximately 50% drop in 2008. MetLife’s shares are off 43% and 15%, respectively, over the same time period. Within a market where high quality and earnings stability command a premium, we believe the company will emerge as the benchmark global insurance stock. The dominant group and individual domestic insurance businesses coupled with its rapidly growing international operations have it well-positioned to leverage opportunities created by the aging baby boomer generation, into an accelerating growth rate.
Solid Capital Position — MetLife is among the best capitalized insurers within our coverage universe. We do not envisage any scenario other than to finance potential M&A activity, where it would need to raise external capital. At YE08, its statutory risk based capital ratio was 394%, a level solidly in the “AA” range for rating agency purposes. As a result of the general trend of rating agency downgrades in 1Q09 MetLife saw similar to peers, its level of below investment grade bonds rise to $14.9 billion from $12.4 billion. This caused some downward pressure on RBC, which we estimate declined to about 370%.
International M&A Could Be a Catalyst — We believe here is good potential for EPS and ROE to be meaningfully accelerated by MET’s ability to take advantage of M&A both domestically and internationally to transformationally accelerate its strategy.
Company description
MetLife is the leading provider in the U.S. of individual and group life insurance, retirement savings products, dental, disability, and group auto & home insurance. The company’s strong market positions and brand awareness have it very favorably positioned to leverage opportunities created by the aging baby boomer generation with respect to post-retirement income products into an accelerating growth rate. Augmenting this, current market disruption has created a unique opportunity to pursue large scale M&A of weakened competitors. Though not directly in the 401(k) market, deeply entrenched long-term relationships amongst the Fortune 500 should allow it to capture premier shelf-space within their 401(k) plans for its annuity products. In 3Q08 it held the #1 sales ranking in variable annuities. MetLife also has rapidly growing international insurance operations in 12 countries, most notably Mexico, Korea and Japan.
Investment strategy
We rate the shares of MetLife Buy / Medium Risk (1M). The company possesses the strongest long-term growth potential of any U.S. life insurer owing to its commanding market positions, household brand-name awareness status, and demonstrable financial strength. We regard risk management practices as being “best in class” and balance sheet integrity to be very sound. We look for potential upside earnings surprises to be driven by the combination of good sales and expense synergies augmented by targeted M&A activity. While ROE in 2009 will be depressed by equity market pressures and fall to a projected 6.8%, we expect it to recover to 9.5% in 2010 and 11% in 2011. Our industry surveys suggest the company is taking market share as a result of a “flight to quality” away from weakened competitors. On a normalized basis, we
Insurance – Life
Buy/Medium Risk 1MPrice (30 Jun 09) US$30.01Target price US$35.00Expected share price return 16.6%Expected dividend yield 2.5%Expected total return 19.1%Market Cap US$24,563M
Company Metrics
52-Week Range $65.45–$11.37 Div (E) $0.74 P/E (12/09E) 10.0x P/E (12/10E) 7.3x 12/08A EPS US$3.67 12/09E Cur EPS US$3.00 12/10E Cur EPS US$4.10
Price Performance (RIC: MET.N, BB: MET US)

TEN+ 2009-2010 1 July 2009
Citigroup Global Markets 40
look for ROE to stabilize in the 13%-15% range and EPS growth to be 12%-14%. Positively, EPS and ROE progress may be meaningfully accelerated given MetLife’s ability to take advantage of potential large scale M&A opportunities both domestically and internationally. We would speculate management will aggressively pursue AIG’s Japanese operations which would provide a very desirable compliment to MetLife’s existing variable annuity business in Japan.
Valuation
When establishing valuations for companies within the life insurance sector, we primarily utilize a peer comparison of P/B regressed against ROE. In support of this we also use a relative P/E assessment, sum-of-the-parts analysis, and the present value of excess returns. For MetLife our target price was based an average of these methodologies. We utilized more normalized 2010 results as we project EPS and ROE for 2009 will be meaningfully depressed by non-cash items such as DAC adjustments and goodwill impairments.
Regression analysis of P/B vs. ROE – Our target was derived using a forecasted 2010 ROE of 9.5% and equates to 0.79x projected year-end 2009 book value of $44.43. It is above the peer group average of 0.62x but well within the peer range of 0.2x – 1.2x. We view the premium has merited by the good upside potential to ROE from organic growth, M&A, and conservatism in our forecasts. Adding additional comfort to our target valuation is it is only 1.25x statutory book value at year-end 2008 of about $27.85.
Relative P/E – Our target P/E multiple of 8.5x our revised 2010E of $4.10 is well above the peer group, whose P/E’s range from 2.0x – 6.1x. We view this premium has warranted given the much greater stability of MetLife’s “cash” earnings stream relative to the peers and superior growth outlook. It is also well within the company’s historical P/E over the past three years of 3.2x – 12.9x, with a median of 10.3x.
PV of Excess Returns – Infers a share value of $40.71.
Risks
We rate MetLife shares Medium Risk (M) because of the company’s moderate earnings volatility and strong financial position. As a large writer of general account insurance products, MetLife's earnings are susceptible to movements in interest rates and the ability to maintain pricing spreads on an investment portfolio that totaled $306.6 billion at Dec. 31, 2008. However, disciplined asset liability management practices should limit the impact of this to no more than $100 million in any given year. Another risk is the impact of equity market movements to fees earned and related reserves tied to the $120.8 billion of separate account assets at the end of YE08. Also, the size of the general account investment portfolio means MetLife's investment portfolio is sensitive to the general credit environment. Finally, operating earnings in recent years have benefited by unusually strong levels of investment partnership income, even though as a category they represent only about 3% of total investments. If the impact from any of these issues proves to be greater than we anticipate, the stock may have difficulty achieving our price target.

TEN+ 2009-2010 1 July 2009
Citigroup Global Markets 41
Microsoft Corp (MSFT)
Brent Thill +1-415-951-1770
Why Now? — 1) Sentiment is poor — margin concerns, cynicism around MSFT’s broad business strategy, and too much near-term concern over long-term challenges has led to a discounted trading multiple of 13x FY10 consensus EPS of $1.81 vs. an 18x 5-yr avg, 2) however our analysis of MSFT’s historical trading patterns suggests sentiment improves leading into product cycles and MSFT has a major product cycle that kicks off October 22nd, 3) in addition, with Windows its highest margin business MSFT’s stock has shown a proclivity to track PC unit growth and PCs may be bottoming out, 4) finally FY10 OPEX guidance is likely conservative, margins are likely bottoming.
Catalysts — 1) FY10 expense guidance on FQ4 earnings in late July should be the next catalyst as we expect MSFT will unveil a more focused expense plan than the Street is modeling. Notably, MSFT rallied 11% the day after FQ3 results in April in which it lowered its FY09 expense guidance by $1B. Our FY10 EPS est. is $0.07 ahead of the Street and we expect positive Street FY10 EPS revisions over the next year. 2) October 22nd kicks off a very strong product cycle that refreshes MSFT’s 3 main profit drivers. Our industry checks continue to come back positive on the quality of the product cycle which boosts our confidence in the financial opportunity.
$28 TP — Our $28 TP suggests an ETR of 20% inclusive of a 2.2% dividend yield. We consider MSFT’s dividend safe considering its $27B cash cushion and $1.5B/mo in FCF generation. $28 = 14x our $1.99 CY10 EPS estimate and represents a PEG of 1.0 vs. our FY10 (June 2010) 14% y/y EPS growth estimate.
Company description
Microsoft is the largest software company and one of the largest companies, regardless of industry, in the world. Founded in 1975, the company sells to the consumer, small & medium businesses (SMB), and enterprise markets and has built the dominant franchise in desktop software through its ubiquitous Windows operating system and Office productivity suite. The company also leverages its strength to extend its core offerings and expand into other markets including server-based software segment, Internet products and services, home entertainment software and hardware, business applications, and embedded and mobile software.
Investment strategy
We rate the shares of Microsoft Buy/Medium Risk (1M). The economic environment is expected to remain tough in 2009. Companies most negatively exposed to this economic climate include those that rely on large transactions, have non-diversified product sets and have high ASPs. MSFT by contrast is not reliant on big deals, has a very diversified portfolio of products, and tends to be the low-cost provider. MSFT has ~40% of its revenue already on its balance sheet from enterprise agreements and generates $1.5B/mo in FCF which funds its $40B buyback supporting EPS, and its dividend. We expect that the core businesses, Client, Server & Tools, and Office, will continue to contribute the bulk of the operating profit and offset the overhead costs of the emerging online business.
Software
Buy/Medium Risk 1MPrice (30 Jun 09) US$23.77Target price US$28.00Expected share price return 17.8%Expected dividend yield 2.2%Expected total return 20.0%Market Cap US$211,546M
Company Metrics
52-Week Range $28.50–$14.87 Div (E) $0.52 P/E (6/09E) 14.5x P/E (6/10E) 12.6x 6/08A EPS US$1.87 6/09E Cur EPS US$1.64 6/10E Cur EPS US$1.89
Price Performance (RIC: MSFT.O, BB: MSFT US)

TEN+ 2009-2010 1 July 2009
Citigroup Global Markets 42
Valuation
Our price target on MSFT is $28 which is based on a 14x P/E multiple of our CY10 EPS estimate of $2.00. The 14x PE is ~1.0 PEG on our FY10 y/y EPS growth estimate and below the 5-year median P/E of 18X. The discount to historical median P/E reflects compressed valuation levels across the software sector and limited near-term visibility on revenues. The 14x multiple is consistent with the 12-15x range used for many large software companies in our coverage universe.
Risks
We rate Microsoft Medium Risk. While the company’s top-5 market capitalization, earnings stability, and neutral debt rating point to a Low Risk rating, the company shows medium risk in stock price volatility. Additionally, we believe the execution risks around its product releases and ongoing regulatory and legal risks put it in the Medium Risk category.
Our target price could prove to be conservative if some of the following events occur: 1) We may have overestimated the slowdown in the PC growth rates, or underestimated the growth in the U.S. and other markets where Microsoft holds the dominant share of the PC market. 2) We could be underestimating the growth impact from Vista, Xbox 360, Windows Live and Office. 3) The product lines that negatively affect operating income currently turn around and begin to contribute to profitability.
Microsoft shares may not reach our target price due to the following risks: 1) the global macroeconomic slowdown could persist longer than expected; 2) potential litigation in the US and EU, which could deplete some of the company’s cash balance, or alter the company’s fundamental business model; 3) an accelerated emergence of open source solutions such as Linux, which could limit the company’s opportunity for growth in the O/S market, and 4) MSFT may choose to invest more aggressively than expected in its online initiatives which may stunt margin expansion and EPS growth.

TEN+ 2009-2010 1 July 2009
Citigroup Global Markets 43
Newfield Exploration Co (NFX)
Gil Yang +1-212-816-5803
Why Now? — We believe that Newfield has significant upside potential as it currently trades toward the bottom end of its historical level suggesting that it is inexpensive relative to its peers. We believe current valuations discount $6.50Mcf natural gas and $65/bbl oil.
The Edge — We expect accelerating Debt Adjusted production growth to drive NFX to outperform its peers over the next year. Long-term share price appreciation is tied to DA production per share growth with 95% correlation.
Key Catalyst — We believe the recent promotion of Lee Boothby to CEO in May 2009 could reinvigorate Newfield’s management team and allow the Company to efficiently harness its resources, enhancing value for shareholders.
Operations Performing Well — NFX continues to improve its operational performance. In the Bakken oil field, well performance continues to improve with IP rates of 10 wells drilled increasing from ~330 bbls/d on the first well to ~1250 bbls/d on the most recent well. In the Woodford Shale, NFX has reduced drilling costs by ~40% as the company continues to implement technological advances to improve results and reduce costs.
Company description
Newfield Exploration is a mid-cap E&P company with operations concentrated in the US onshore. The Gulf of Mexico, China and Malaysia are smaller components of the company's asset base. Over the last several years, Newfield moved away from its original core of operations in the Gulf of Mexico through a series of acquisitions and divestitures. This transformation moved the asset profile of the company toward low-risk, long lived assets that now form the core of the E&P industry today. Newfield had year-end 2007 proved reserves of roughly 2.5 Tcfe, 73% of which were natural gas.
The company is a leader in natural gas production in the Woodford Shale play in Oklahoma. Newfield also has a strong position for oil production the Monument Butte region of Utah's Uinta Basin. Most recently Newfield has stepped up exploration activity in the Bakken Oil Shale play in Montana and North Dakota.
Investment strategy
We rate the shares of Newfield Exploration Buy/High Risk (1H). Newfield has successfully built up a core of low-risk, long lived oil and gas assets in the onshore US market. However, the company has had a somewhat spotty record of execution over the past several years. Valuation looks attractive, and we believe that investors realize this as a buying opportunity.
Valuation
Our price target for NFX is $42. We estimate that NFX has proved NAV of $27/share after debt and hedges valued at $6/share at current commodity strip prices. We also estimate that the company has another $28/share of NAV from its unproved resource potential. Our target price anticipates that NFX shares
Exploration & Production
Buy/High Risk 1HPrice (30 Jun 09) US$32.67Target price US$42.00Expected share price return 28.6%Expected dividend yield 0.0%Expected total return 28.6%Market Cap US$4,333M
Company Metrics
52-Week Range $68.31–$15.46 Div (E) $0.00 P/E (12/09E) 8.1x P/E (12/10E) 11.3x 12/08A EPS US$3.19 12/09E Cur EPS US$4.02 12/10E Cur EPS US$2.90
Price Performance (RIC: NFX.N, BB: NFX US)
TEN+ 2009-2010 1 July 2009
Citigroup Global Markets 44
will trade at a 28% premium to current proved NAV plus hedge value when calculated at what could be trough cycle strip price we see today.
Risks
We rate Newfield High Risk. Our risk rating on Newfield is High based on a combination of risk assessments compared to other stocks covered by Citigroup Investment Research.
Hydrocarbon prices are volatile. Both natural gas and oil prices have shown increasing volatility in recent years. This volatility tends to significantly impact sector stock performance (both up and down), as well as cash flow and earnings.
Gulf of Mexico presence remains a concern. Newfield continues to bring new development projects from the Gulf to production. Future storm activity or generally unfavorable weather conditions could delay the timing of these projects.
Several challenges exist at Monument Butte. The produced oil must be heated for transport to specific refineries able to handle it. Also, considerable water injection is required to maximize oil recovery. Finally, regional service costs, due to tight supply conditions, have climbed more than 50% in recent years cutting into project margins. Newfield has made arrangements to help resolve, or at least diminish the aforementioned risks.
If the impact on the company from any of these factors proves to be greater/less than we anticipate, it may prevent the stock from achieving our target price or could cause our target price to be materially outperformed.

TEN+ 2009-2010 1 July 2009
Citigroup Global Markets 45
Norfolk Southern (NSC)
Matthew Troy +1-212-816-9051
Rail Industry View — After years of consolidation and network rationalization, pricing power emerged within the rail industry in 2002, driving earnings growth that enabled this capital intensive industry to earn its cost of capital for the first time since deregulation in 1980. Yet despite secular momentum, the rails now face one of the worst volume environments since the 1960s, which should drive negative operating leverage, EPS contraction and, potentially, returns below the cost of capital. While rail stocks also exhibit early cycle characteristics (largely fixed cost networks benefit from positive earnings leverage in the initial upward inflection following an economic slump), we still think it is too early to go “all-in” with a basket approach. Potential for an “L” shaped recovery, narrowing pricing gains and regulatory concerns temper our early cycle enthusiasm.
Company View — For our longer-term view, we see an opportunity to pick-up best in class at structurally depressed valuation. We believe NSC is the best run U.S. based Class I railroad, consistently generating returns on capital above the industry average over the last 3 years (11.5% vs. 10.8% for the industry) while maintaining the best capital discipline in the industry (average capex/ revenue of 13.8% vs. 18.1% for the industry). As a result, NSC generates a cash flow yield per revenue dollar above the industry average (3-year average at NSC of 11.3% vs. industry at 9.0%). We believe NSC’s proven track record of earning above-average returns, while exercising restraint in investment, positions NSC defensively with strong upside potential into recovery.
Valuation — NSC shares currently trade at 11.3x consensus '09E, a discount of 19% to its 10-year median and 14% to the group, but a 6% premium to its Eastern rail competitor CSX.
Company description
Norfolk Southern (NSC) operates the fourth largest rail network in North America. The company operates approximately 21,000 route miles of track across a network in the Eastern United States that spans from the mid-Atlantic to the Gulf Coast and Midwest with access to Western and Canadian gateways. With a fleet of over 3,900 locomotives and over 30,000 employees, NSC’s top commodity segments by revenue share are coal (29%), intermodal (19%), agricultural/consumer/government (12%), metals and construction (12%), and chemicals (12%). Norfolk Southern is headquartered in Norfolk, Virginia.
Investment strategy
We rate NSC shares Buy, Medium Risk (1M). In times of unprecedented economic challenge, we strongly believe culture is king and execution is everything. Norfolk Southern offers investors both in the form of a conservative management team that consistently drove industry-leading operating and financial improvement over the last cycle, all while showing tremendous discipline with shareholders' capital. In today's environment we value this discretion, and as a result believe that NSC is one of the railroads best positioned to maintain balance sheet strength and whether the storm.
Railroads
Buy/Medium Risk 1MPrice (30 Jun 09) US$37.67Target price US$43.00Expected share price return 14.1%Expected dividend yield 3.8%Expected total return 17.9%Market Cap US$13,826M
Company Metrics
52-Week Range $75.53–$26.69 Div (E) $1.42 P/E (12/09E) 11.1x P/E (12/10E) 9.5x 12/08A EPS US$4.54 12/09E Cur EPS US$3.40 12/10E Cur EPS US$3.95
Price Performance (RIC: NSC.N, BB: NSC US)

TEN+ 2009-2010 1 July 2009
Citigroup Global Markets 46
Today's NSC stands in stark contrast to the late 1990's incarnation – an operator that posted its worst post-Staggers results while dealing with indigestion from the 1998 Conrail acquisition. Since 2000, Norfolk Southern has clearly demonstrated the strongest improvement in several key metrics, with the company beating all other Class I's in operating ratio improvement, free cash flow growth relative to revenue, and expansion in return on capital. NSC’s management team, led by 38 year company veteran Wick Moorman, has engineered the company's turnaround while proving they know how to get more done with less. Over the last three years, the company has consistently generated returns on capital above the industry average, while simultaneously maintaining the best capital discipline in the industry, as measured by capital expenditures to revenue. We consider NSC the best-in-class US railroad operator.
While our broader industry thesis incorporates discounted valuation across all rails, with earnings results captive to broader economic headwinds, we think NSC's leadership and operational execution will offer defensive characteristics through the current market downturn and solid returns into the earlier stages of a recovery.
Valuation
We drive our target price of $43 by applying a 12.6x multiple, roughly a 9% discount to the 10 year median valuation, to our 2009 EPS estimate of $3.40. Given market perception of trough earnings power through the current credit crisis driven-dislocation, we think the stock can sustain higher valuations closer to median levels over time as investors look across the valley and price in more normalized earnings growth into the back half of 2009 and beyond.
Risks
We rate Norfolk Southern's shares at Medium risk because of the company's 1) strong market position within its territory and generally high barriers to entry in the railroad industry, 2) recent track record as a top-tier railroad operator among Class I's, second only to Canadian National, 3) relatively large market cap and adequate liquidity.
Risks to Norfolk Southern's financial outlook and, therefore, to the shares achieving our price target, include: 1) recent success in improving operating efficiency may push investor expectations for continued improvements to unreasonably high levels, 2) structural declines in coal traffic due to depletion of eastern coal fields and the absence of significant export volumes, 3) the asset intensive and cyclical nature of railroading, which has high fixed costs and exhibits negative operating leverage when freight volumes decline, 4) the potential for increased government regulation to constrain rate increases and therefore rail profit growth if current proposed legislation gains traction in Congress.

TEN+ 2009-2010 1 July 2009
Citigroup Global Markets 47
NV Energy (NVE)
Brian Chin +1-212-816-2861
What Is NVE? – NV Energy is the primary Nevada electric utility, serving Las Vegas and Reno. The company is a fully regulated, defensive utility.
Why Now? – In our view, regulated utilities are: 1) significantly cheap to their long-term historical average valuation multiples, 2) inexpensive relative to corporate and Treasury bonds, 3) have underperformed the broader S&P 500 in the ~100 days since market bottom by more than at any 100 days post-bottom of any recession since the late 1970s, 4) recent valuation premiums of bellwethers SO and ED suggest defensive rotation is finally complete, making now a good time to target defensive utility “catch up.” In addition, the company is in the process of finalizing its most recent rate case. The latest Draft decision, which comes from the most conservative member on the Nevada utility commission, was actually better than the market expected, suggesting subsequent drafts in the near future from other Commissioners will continue to provide upside surprise to investors.
What’s Our Unique Assessment of NVE? — NV Energy’s share performance reflects its status as the sole “pro-cyclical” defensive utility in our coverage universe. Our proprietary valuation premium/discount analysis shows that the shares’ valuation receives an extra boost in a recovering economy, making NVE the only “offensive-defensive” utility in our coverage universe.
What Is NVE Worth? – Our target is $14.30, based on 13.0x our 2011 EPS estimate of $1.16. NVE has a dividend yield of ~4%. We rate NVE shares High Risk.
Company description
NV Energy (NVE) is a holding company with two wholly owned utility subsidiaries, Nevada Power Company and Sierra Pacific Power Company. Nevada Power Company (NPC) serves 725,000 electric customers in the greater Las Vegas metropolitan area. NPC has been the fastest growing utilities in the country. Sierra Pacific Power Company (SPPC) serves 335,000 electric and 130,000 gas customers in the Reno-Sparks and Lake Tahoe region of Nevada.
Investment strategy
We rate the shares of NV Energy Buy/High Risk (1H). We believe the earnings growth potential for NVE is high because the utilities serve some of the fastest growing regions of the country. This population growth will require the continuation of significant investments in generation, transmission, and distribution assets over the next five to seven years that should lead to robust rate base growth upon which the utilities should be able to earn a rate of return. We expect the regulatory environment in Nevada to continue being constructive, as evidenced by the recent favorable treatment the company received on the Lenzie, Silverhawk, and Tracy power plants. The company still faces significant risks associated with the Nevada regulatory environment and a sizeable short power position in a region with the potential for power price volatility. The company has recently announced a reinstatement of a common dividend and we forecast above average earnings growth as the company deploys capital into its regulatory rate base.
Electric Utilities
Buy/High Risk 1HPrice (30 Jun 09) US$10.79Target price US$14.30Expected share price return 32.5%Expected dividend yield 3.7%Expected total return 36.2%Market Cap US$2,529M
Company Metrics
52-Week Range $12.88–$6.90 Div (E) $0.40 P/E (12/09E) 12.1x P/E (12/10E) 10.7x 12/08A EPS US$0.89 12/09E Cur EPS US$0.89 12/10E Cur EPS US$1.01
Price Performance (RIC: NVE.N, BB: NVE US)

TEN+ 2009-2010 1 July 2009
Citigroup Global Markets 48
Valuation
Our target price is $14.30/share and represents a one year forward horizon. Our target is based on our 2011 EPS of $1.16, multiplied against a 13.0x multiple, discounted back 6 months to reflect a one year forward investment horizon. Our target multiple is equal to our group average target Defensive multiple, plus a NV Energy specific premium.
Our group average Defensive target multiple of 12.0x corresponds to our long term regression of corporate bond yields and P/E multiples for regulated utilities. We assume a corporate bond yield environment in twelve months in which a typical BBB rated bond carries a yield of 7.0%; our assumption is an explicit out of market view and is consistent with our bond strategy research and outlook.
At this time, we believe a slight premium to the Defensive group average multiple is merited for NV Energy. We believe in one year’s time, the economic growth outlook will be better than at present, and sufficient in Nevada to merit a relative Defensive premium. NV Energy’s service territory of Nevada tends to experience larger swings in GDP growth than most other utilities’, and NVE’s historical valuation premiums and discounts reflect this. We ascribe a 1.0x multiple premium to our NVE target multiple.
Risks
We rate NVE High Risk. At present, we view NVE as a late stage transitional story as the company moves from a distressed utility to a more stable vertically integrated utility without any significant non-utility businesses. We realize that the growth potential of NVE is largely dependant a healthy Nevada economy, constructive regulatory treatment, and adequate financing of growth.
Regulatory Environment in Nevada — If the Nevada Commission reverts to a less supportive position in dealing with the utilities, the earnings power of NVE could be negatively affected and ultimately prevent the stock from achieving our target price. Alternatively, if the Nevada Commission rules in a more constructive manner than we have modeled, the company’s earnings trajectory and cash flow profile could be higher, which could support a higher stock price.
Rate Base Growth Trajectory — Our current rate base profile implies ~9% rate base growth from 2007 to 2015. If our rate base growth projections are too aggressive and NVE is unable to meet our expectations, the earnings and stock price could be materially impacted and fail to achieve our target. Conversely, if rate base growth for NVE exceeds our estimates, the stock may materially outperform and exceed our projections and target. We believe this will largely be a function of the economic health of Nevada and Las Vegas in particular. The recent economic downturn has given rise to a riskier profile for NVE, warranting a High risk rating.

TEN+ 2009-2010 1 July 2009
Citigroup Global Markets 49
NVIDIA Corp (NVDA)
Glen Yeung +1-415-951-1885
Rationale — Nvidia is a leveraged play on cyclical recovery in the PC supply chain. Near-term, we expect upside to consensus estimates (FY2Q10/FY3Q10) given signs of PC market stabilization against conservative company guidance. Medium-term, inevitable recovery in the PC supply chain bodes well for Nvidia, particularly given the GM benefit of improved workstation mix and new product traction (esp. handsets). Longer-term the advent of GPU computing, sparked by the launch of Windows 7 and Snow Leopard, is apt to increase GPU attach rates, leading to above industry growth for the market leader.
Catalysts — We see upward bias to Nvidia consensus estimates, manifesting in earnings beats for 2Q10/3Q10 (we are above consensus for both quarters). This makes August/November earnings positive catalysts, particularly as GM recovers from cyclically low levels). Meanwhile, our field work suggests positive commentary from the PC supply chain is likely in 2H09, providing positive headline potential. Additionally, the 2H09 launches of 2 new operating systems (Win7, Snow Leopard), both of which employ the GPU as a co-processor to the CPU, will bring GPU functionality into the spotlight, providing yet another 2H09 catalyst.
Conclusion — We recognize that our positive stance on Nvidia is controversial. Nvidia has missed GM consensus 2 quarters in a row, robbing management of credibility. Their competitor, ATI has developed an improved product and is apt to be first to market with a DX11 solution. And Intel will likely enter the discrete GPU market in 2010 (albeit with a weaker product offering in our opinion). While all headwinds, we remain confident that GM's can recover (mix, cost reduction) in the context of a cyclical recovery. We see share opportunity in both notebook and chipset, offsetting risk in desktop, and we remain focused on GPU compute as a longer-term positive opportunity.
Company description
Nvidia Corp (NVDA) is a fabless semiconductor company and a leading vendor of graphics processors predominantly used in PCs (desktop/notebook/servers), but also increasingly deployed in handsets and game consoles. Nvidia's strength is in stand-alone (or discrete) graphics processors, although it also has graphics processors that are integrated into chipsets; market share is greatest in desktop stand-alone graphics processors. Revenues are segmented into graphics processors (GPU), chipsets (MCP), professional solutions (PSB), and its consumer products business (CPB) which includes handsets, game consoles, and mobile embedded products. Nvidia is headquartered in Santa Clara, California.
Investment strategy
We rate the shares of Nvidia Buy/ Speculative (1S). Nvidia's results underscore the struggles of the company in a volatile demand environment coincident with an aggressive shift in manufacturing node/architecture. We suspect these struggles will keep the shares range-bound in the near-term until greater clarity on gross margin trends become evident. Longer-term, we are encouraged by 1) Nvidia's demonstrated share gain in desktop GPU and chipsets; 2) the
Semiconductors
Buy/Speculative 1SPrice (30 Jun 09) US$11.29Target price US$14.50Expected share price return 28.4%Expected dividend yield 0.0%Expected total return 28.4%Market Cap US$6,167M
Company Metrics
52-Week Range $19.23–$5.75 Div (E) $0.00 P/E (1/10E) NM P/E (1/11E) 26.9x 1/09A EPS US$(0.08) 1/10E Cur EPS US$(0.33) 1/11E Cur EPS US$0.42
Price Performance (RIC: NVDA.O, BB: NVDA US)

TEN+ 2009-2010 1 July 2009
Citigroup Global Markets 50
potential for greater GPU attach rates on the Apple platform as Open CL derived Snow Leopard is launched; and 3) the emerging opportunity from Windows 7's DirectX compute API.
Valuation
Our target price for Nvidia is $14.50. Our target price is based on the implied multiple derived from a growth and value screen of the top 100 market cap stocks in the S&P 500, excluding energy and financials. We believe our methodology reflects the P/E multiple investors pay for growth and the P/BV multiple investors pay for return on equity. We have found the market is paying an FY2 earnings multiple of 0.630x (Sales Growth) + 9.800 with a 60% correlation and a price-to-book multiple of 0.196x (ROE) + 0.332 with a correlation of 84%.
For Nvidia, our C2009-2011 sales growth estimate of 12.5% yields an implied P/FY2 earnings multiple of 17.7x. We multiply our C2011 GAAP EPS estimate of $0.83 by 17.7x for an implied share price of $14.62. Our C2009 exit ROE estimate of10.6% yields an implied P/BV 2.4x. We multiply our C2009 exit BV/share estimate of $4.43 by 2.4x for an implied share price of $10.65.
We equally weigh our $14.62 and $10.65 implied targets to derive an initial target of $12.64. We adjust our initial target price for CIRA’s S&P multiple and get an adjusted target of $14.46. We round to our final target price of $14.50.
Risks
We rate Nvidia Corp Speculative risk primarily due to the stock's volatility (2-year weekly Beta of 3.21 versus the S&P 500) and the volatility in the semiconductor industry. In addition, we incorporate other factors into our risk rating such as need for external financing and market capitalization:
With ~ 85% of revenues derived from the PC market, high end-market concentration represents a risk to the stock as reduction in sales or the growth rate of PCs, impact earnings.
Graphics is a consumer-oriented product. The current uncertainty regarding the credit markets and those markets' impact on the global consumer poses a risk to the attach rate of graphics to PCs.
Nvidia relies on external foundry suppliers for its front-end supplies and on independent contractors for backend activities. Any change in the company's ability to procure supply from these partners can impact Nvidia's results.
Nvidia's royalty and license revenues are dependent on pricing of PS3, as well as the long-term success of PS3 which could affect NVDA's license/royalty revenue stream and gross margins.
Nvidia's success is dependent upon its ability to achieve design wins for hardware components designed by PC OEMs, ODMs and motherboard manufacturers. Inability to achieve design wins could result in a loss of market share. However, if royalties and license revenues exceed our estimates, this could drive upside to our target price.
The company's success is dependent on the widespread adoption of its processors for 3D graphics in consumer applications which can impact revenues.
If the impact on the company from any of these factors proves to be greater/less than we anticipate, the stock may have difficulty achieving our target price or could exceed it.
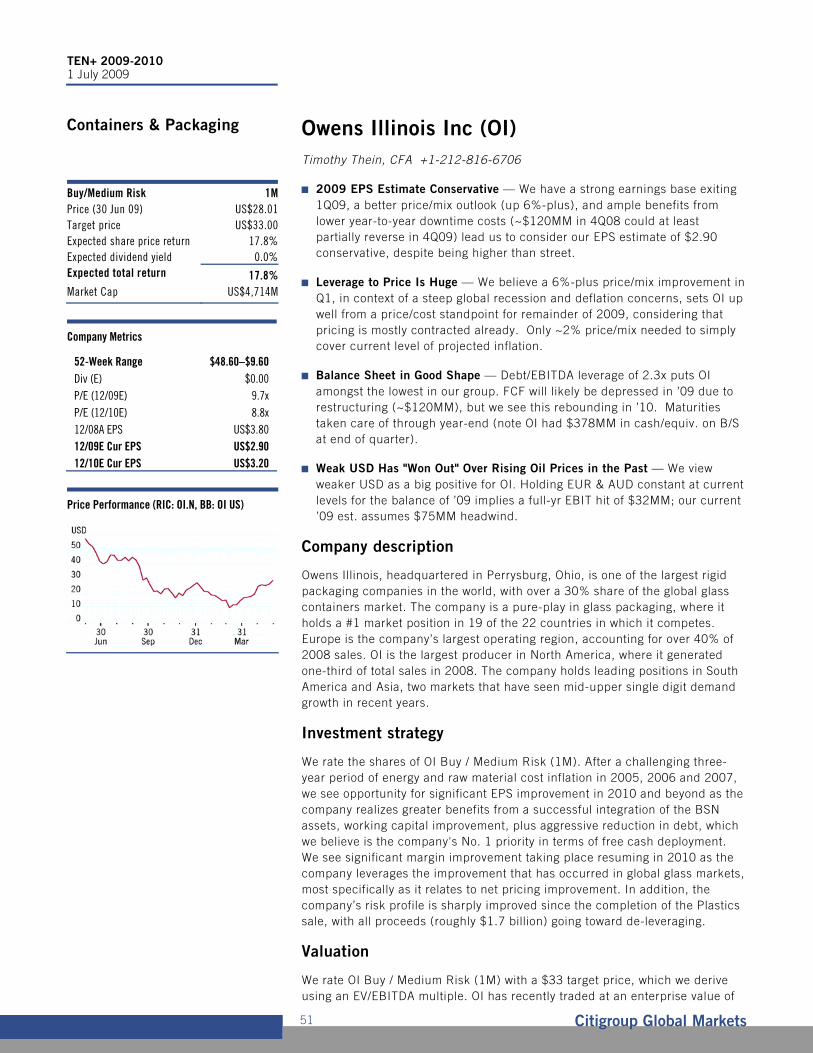
TEN+ 2009-2010 1 July 2009
Citigroup Global Markets 51
Owens Illinois Inc (OI)
Timothy Thein, CFA +1-212-816-6706
2009 EPS Estimate Conservative — We have a strong earnings base exiting 1Q09, a better price/mix outlook (up 6%-plus), and ample benefits from lower year-to-year downtime costs (~$120MM in 4Q08 could at least partially reverse in 4Q09) lead us to consider our EPS estimate of $2.90 conservative, despite being higher than street.
Leverage to Price Is Huge — We believe a 6%-plus price/mix improvement in Q1, in context of a steep global recession and deflation concerns, sets OI up well from a price/cost standpoint for remainder of 2009, considering that pricing is mostly contracted already. Only ~2% price/mix needed to simply cover current level of projected inflation.
Balance Sheet in Good Shape — Debt/EBITDA leverage of 2.3x puts OI amongst the lowest in our group. FCF will likely be depressed in ’09 due to restructuring (~$120MM), but we see this rebounding in ’10. Maturities taken care of through year-end (note OI had $378MM in cash/equiv. on B/S at end of quarter).
Weak USD Has "Won Out" Over Rising Oil Prices in the Past — We view weaker USD as a big positive for OI. Holding EUR & AUD constant at current levels for the balance of ’09 implies a full-yr EBIT hit of $32MM; our current ’09 est. assumes $75MM headwind.
Company description
Owens Illinois, headquartered in Perrysburg, Ohio, is one of the largest rigid packaging companies in the world, with over a 30% share of the global glass containers market. The company is a pure-play in glass packaging, where it holds a #1 market position in 19 of the 22 countries in which it competes. Europe is the company’s largest operating region, accounting for over 40% of 2008 sales. OI is the largest producer in North America, where it generated one-third of total sales in 2008. The company holds leading positions in South America and Asia, two markets that have seen mid-upper single digit demand growth in recent years.
Investment strategy
We rate the shares of OI Buy / Medium Risk (1M). After a challenging three-year period of energy and raw material cost inflation in 2005, 2006 and 2007, we see opportunity for significant EPS improvement in 2010 and beyond as the company realizes greater benefits from a successful integration of the BSN assets, working capital improvement, plus aggressive reduction in debt, which we believe is the company's No. 1 priority in terms of free cash deployment. We see significant margin improvement taking place resuming in 2010 as the company leverages the improvement that has occurred in global glass markets, most specifically as it relates to net pricing improvement. In addition, the company’s risk profile is sharply improved since the completion of the Plastics sale, with all proceeds (roughly $1.7 billion) going toward de-leveraging.
Valuation
We rate OI Buy / Medium Risk (1M) with a $33 target price, which we derive using an EV/EBITDA multiple. OI has recently traded at an enterprise value of
Containers & Packaging
Buy/Medium Risk 1MPrice (30 Jun 09) US$28.01Target price US$33.00Expected share price return 17.8%Expected dividend yield 0.0%Expected total return 17.8%Market Cap US$4,714M
Company Metrics
52-Week Range $48.60–$9.60 Div (E) $0.00 P/E (12/09E) 9.7x P/E (12/10E) 8.8x 12/08A EPS US$3.80 12/09E Cur EPS US$2.90 12/10E Cur EPS US$3.20
Price Performance (RIC: OI.N, BB: OI US)

TEN+ 2009-2010 1 July 2009
Citigroup Global Markets 52
roughly 6.8x our 2009 EBITDA estimate of $1.3 billion. This is above the midpoint of the company's historical multiple (6.3x, by our analysis) seen since 1994. Over this period, valuation has varied from a high of 10x in mid-1998, to a low of 4.7x in 2001. Given the structural operating and financial improvements seen in recent years, an enhanced risk profile resulting from the significant de-leveraging from the sale of Plastics, and recent closures of high-cost glassmaking capacity, we believe an above average multiple is appropriate. Applying a 7.0x multiple to our 2010 EBITDA estimate, we derive an equity value of roughly $33 per share.
Risks
We assign a Medium Risk rating to OI due to its commodity cost risk (namely energy) and asbestos exposure. Although the company's products are sold primarily into stable end markets (beer, wine, food, etc), largely, insulated from macroeconomic conditions, and it operates in a leading market position in many of the regions in which it competes, we see the following factors as offsetting some of these positive points; these are risks to the stock achieving our target price:
Substitution Risk – Further conversion out of glass into other packaging materials such as plastics and metal cans represents a risk to OI.
Foreign Exchange Risk – Foreign currency translation risk exists, particularly against the euro and Australian Dollar, with US dollar appreciation versus these currencies negatively impacting earnings, and vice versa.

TEN+ 2009-2010 1 July 2009
Citigroup Global Markets 53
Research In Motion Ltd (RIMM)
Jim Suva, CPA +1-415-951-1703
Edge — 1) Consensus remains overly fixated on RIMM's gross margins but we expect the focus to shift over next few quarters back to RIMM's robust growth story. Our supply chain sources indicate RIMM’s margins have stabilized as the problems the company’s had in 2H08 launching several new phones on new platforms have now been resolved. Importantly, the company’s new phone launches will be based on these platforms vs. completely new platforms thereby limiting yield ramping risks. 2) We expect RIMM will overtake Motorola in the North American market by end of CY09 as RIMM's share gains continue. We expect RIMM’s sales to grow 34% in the next 12 months, very impressive given the economy. 3) Carrier promotions are increasingly geared toward RIMM and away from Motorola & Sony Ericsson feature phones as carriers benefit from additional data/email revenue streams. These aggressive promotions (buy one get one free) open new consumer adoption & accelerate our "Smart Becomes Average" view of mainstream adoption vs. former high-end/niche. Enterprise demand is stabilizing as large financial employee layoffs have abated and regulatory changes (Mass state encryption) are also a help to enterprise units.
Growth in A Recession and Beyond – RIMM is growing sales and EPS during the recession and we see no reason this growth won’t accelerate after the recession. Looking ahead for the next 12 months, we estimate sales growth of 34% and EPS growth of 15% during the recession. Despite being well known in the financial community the company’s global market share is only 1.8%.
Company description
Research In Motion (RIMM) is one of the leading designers, manufacturers and marketers of innovative wireless solutions with a specialized focus on the Smart Phone segment. Solutions in accessing information include email, phone, text-messaging (SMS and MMS), and Internet/intranet-based applications are provided through integration of hardware, software and services that support wireless networks. RIM technologies are used by thousands of organizations, including the award-winning BlackBerry platform, launched in 1999.
In CY08 RIMM sold 22.5 million handsets (an increased of 97% Y/Y). The company's subscriber base increased to 22m in CY08 or 83% Y/Y. The combination of these and other items resulted in CY08 sales of $9.5 billion or a 88% Y/Y increase.
Based in Waterloo, Ontario Research In Motion has offices in North America, Europe, and Asia-Pacific and it is traded on NASDAQ (Nasdaq: RIMM) and Toronto Stock Exchanges (TSX:RIM). In FY08 (Feb) 58% of the company's total sales were in the United States, 7% in Canada, and the remaining 34% various other countries.
Investment strategy
We rate Research in Motion shares Buy/High (1H) with a price target of $100 (rounded) based on a ~20x P/E multiple applied to our $5.02 EPS estimate (Aug 10 – May 11, i.e., our twelve month forward EPS estimate twelve months from now). We believe that RIMM shares have justifiably been re-rated higher
Handheld Devices
Buy/High Risk 1HPrice (30 Jun 09) US$71.05Target price US$100.00Expected share price return 40.7%Expected dividend yield 0.0%Expected total return 40.7%Market Cap US$40,287M
Company Metrics
52-Week Range $135.00–$35.05 Div (E) $0.00 P/E (2/10E) 17.3x P/E (2/11E) 14.6x 2/09A EPS US$3.44 2/10E Cur EPS US$4.10 2/11E Cur EPS US$4.86
Price Performance (RIC: RIMM.O, BB: RIMM US)

TEN+ 2009-2010 1 July 2009
Citigroup Global Markets 54
following the apparent stabilization in gross margins, but that consensus does not fully appreciate RIMM's continued strong top-line growth, which we have renewed confidence in as our checks are not revealing any indications of a slowdown in consumer adoption of the Blackberry solution; our checks also indicate that conditions in RIMM's enterprise customers stabilizing. We think these factors along with continued strong carrier subsidy support pave the way for strong unit and revenue growth. With gross margins stabilizing, we expect investors will re-value RIMM shares higher as EPS growth gains better traction and EPS momentum becomes positive.
Valuation
Our price target for RIM shares is $100 (rounded). We apply a target multiple of ~20x to our $5.02 EPS estimate (Aug 10 – May 11, i.e., our twelve month forward EPS estimate twelve months from now). Our target multiple is based on an approximate 50% premium to the S&P 500 forward P/E multiple, in keeping with the multiple expansion seen during previous periods of positive EPS revision momentum. Our analysis of RIMM's historic valuation shows a significant positive correlation (r-squared of .82) between EPS revision momentum and RIMM's P/E multiple relative to the S&P 500 P/E multiple. Our target multiple of 20x is approximately a 50% premium to the current S&P 500 earnings multiple. While this may seem rich, we note that it is actually at a discount to the level implied by historic data, the stock is currently trading at approximately ~17.5x the consensus forward EPS estimate, and our target absolute and relative multiples are well below the 2007 to present averages of 27x and 1.9x, respectively. Since RIMM is unlikely to repeat the hyper-growth of nearly 90% in revenues and 100% in units during that time period, a lower multiple is warranted. However, we think the 17% FY2009 – FY2010 EPS CAGR embedded in our model deserve a significant premium to the market, and we would emphasize again that our target multiple is based on the market's expected response to the positive EPS revision cycle we envision taking hold.
Risks
We rate RIM High Risk due to the company's shift in focus to the highly competitive and inherently lower margin consumer segment. Although RIMM's potential for success seems high, a consumer effort is still not without risk and RIM is entering unfamiliar territory as the company has previously focused primarily on the enterprise and high-end "pro-sumer". RIM is introducing a slew of new products, which may or may not be successful. We believe that handset industry dynamics are rapidly changing, with significantly increased competition in the smart-phone segment from both established vendors and new entrants. If this increased competition leads to more rapid ASP or gross margin compression than we currently anticipate, the company would likely not meet our financial estimates and the stock would likely not achieve our price target.
Additional risks to the stock achieving our valuation target include the following: Carrier & Regulatory Reliance; Managing Growth; Economic Slowdown; Mergers and Acquisitions; Foreign Operations; and Patents. If the impact on the company from any of these factors proves to be greater than we anticipate, the stock may likely have difficulty achieving our target price.

TEN+ 2009-2010 1 July 2009
Citigroup Global Markets 55
State Street Corp (STT)
Greg Ketron +1-212-816-0502
Positioned for Growth — As a focused global financial services provider to institutional asset owners/managers and with a leading institutional asset manager subsidiary, we believe STT is well positioned to leverage improving markets. STT’s longer-term growth outlook benefits from the increased focus of asset managers in cutting costs and improving efficiencies through the outsourcing of increasingly sophisticated operations, the strong demands a global aging population is placing on the world’s retirement systems, the continued consolidation of the asset servicing business in Europe and the ongoing modernization of financial systems across the world.
Stock Overhangs Removed — Following favorable results in the government “stress test”, STT completed a $2.3 billion capital offering and applied for TARP repayment. In addition, STT consolidated its $22.5 billion of conduit assets resulting in a $3.7 billion one-time charge reflecting the cumulative effect of MTM unrealized losses in the conduits. The losses will be accreted back into EPS over the next eight years at a rate of $760 mln/yr pre-tax (adds $0.75 to 2009 EPS). We expect EPS growth to resume in 3Q09 and see 10% EPS growth in 2010 and 14% in 2011.
Undervalued in Both Absolute and Relative Terms — STT is trading at 10.8x our 2010 EPS est. vs. 17x-19x historically, and our estimates imply upside in the Street consensus. In the twelve months following the Sep. 21, 2001 market bottom, STT outperformed the S&P 500 by 9% and in the 12 months following the Oct. 11, 1990 bottom the stock outperformed the S&P 500 by 81%. The stock has additional upside in our view based on its attractive valuation relatively to history and peers.
Company description
State Street was founded as a bank in 1792 in Boston, Massachusetts. Today the company has $11.3 trillion in assets under custody, $1.4 trillion in assets under management and 27,500 employees. It provides a full range of products and services for large pools of investment assets worldwide.
Investment strategy
We rate the shares of State Street Buy/High Risk (1H), with a $57 target price. We view State Street as a focused global financial services provider to institutional asset owners and managers. We believe the company differentiates itself with its technological expertise and global presence that allows it to offer cost-saving and value-adding solutions to institutional clientele. In addition its asset management arm SSgA is one of the largest managers of institutional assets and capable of providing investment services across the investment style spectrum. With this model State Street is well positioned in our view to benefit from the increased focus of asset managers in improving operating efficiencies and cutting cost through the outsourcing of increasingly sophisticated tasks, the strong demands a global aging population is placing on the world’s retirement systems, the continued consolidation of the asset servicing business in Europe and the ongoing modernization of financial systems across the world.
Brokers & Asset Managers
Buy/High Risk 1HPrice (30 Jun 09) US$47.20Target price US$57.00Expected share price return 20.8%Expected dividend yield 0.6%Expected total return 21.4%Market Cap US$22,944M
Company Metrics
52-Week Range $74.24–$14.89 Div (E) $0.28 P/E (12/09E) 11.0x P/E (12/10E) 9.9x 12/08A EPS US$4.74 12/09E Cur EPS US$4.30 12/10E Cur EPS US$4.75
Price Performance (RIC: STT.N, BB: STT US)

TEN+ 2009-2010 1 July 2009
Citigroup Global Markets 56
Valuation
The stock is trading at approximately 12x consensus 12-month forward EPS, compared to 19x on average during the past 10 years and 17x on average since May 1989. Relative to its Trust and Processor peers as well as the S&P 500 the stock appears undervalued on a 12-month forward PE by 10 year historical standards. We believe the current valuation creates a buying opportunity and expect valuation multiples to trend toward historical average levels over the next 12 months. Our 12-month target price of $57 is derived by our residual income valuation model and translates to 12x our 2010 operating EPS estimate.
Residual Income Valuation — Our discounted residual income valuation model estimates a $52 fair value today which translates to $57 a year from now based on a 10.5% cost of equity assumption. Our valuation model is an extension of a dividend discount valuation model and values an enterprise based on its discounted excess returns over its cost of equity. It incorporates our three-year forward earnings projection, a seven-year fade period, and a steady state terminal value assumption at year ten. The key model inputs are our normalized ROE assumption of 16% at year 10, a 10.5% cost of equity, and a 4% perpetual growth rate, which is based on the 3-5% long term annual growth rate of the U.S. economy. Our normalized ROE assumption is based on our fundamental assessment of the company’s future profitability based on our analysis of its business model and future growth prospects. Reducing our cost of equity assumption by 50 bps increases our fair value estimate by $5.00.
Risks
We rate STT High Risk primarily because of the company’s sensitivity to the volatility of financial markets and the uncertainty over the timing, terms, and size of a common equity raise that we expect. This is partially offset by STT's continued growth in new business wins, its relatively diversified revenue mix (by types of fees as well as geography), and management’s focus on expense control and operating leverage.
Company-specific negative risk factors:
A larger than we have modeled common equity raise. We have modeled a common equity capital raise in 4Q09. Market conditions may force the company to raise common capital under terms that may be more onerous that we expect.
A prolonged bear market. A prolonged bear market could eventually lead to significant fund outflows from State Street’s asset management clients, which could have a negative impact on their businesses and consequently on STT’s asset volumes.
Deterioration in the credit quality of the investment portfolio. Potential deterioration in the credit quality and ratings of the investment portfolio could result in other than temporary impairment of securities and a direct impact on reported earnings.
Unexpected increased regulation in the U.S. or abroad. Depending on the specific nature of such development this could have a negative impact on expenses, new business growth, and M&A opportunities.
Turmoil in emerging/foreign markets. STT derives a relatively higher proportion of its revenues from outside the U.S. relative to its peers (41% vs 31% and 34% for BK and NTRS respectively in 2007). As a result it should be a bit more susceptible to instability in these regions.
If the impact on the company from any of these factors proves to be greater than we anticipate, the stock will likely have difficulty achieving our target price.

TEN+ 2009-2010 1 July 2009
Citigroup Global Markets 57
Tyco Electronics Ltd (TEL)
Jim Suva, CPA +1-415-951-1703
Why Now? – TEL shares were removed from the S&P 500 index in late June as the company is reincorporating from Bermuda to Switzerland due to US political pressures to change tax regulations. This appears to have created an overhang on the shares in late June 2009, but this reincorporation seems to have no impact on earnings or the company's operations. Furthermore, global automotive production is starting to improve, with production levels 45m units meaningfully below end market sales rates of 60m units (70m pre recession), as such a difference results in a multi-quarter production increase for TEL.
The Edge — Automotive headwinds are well known and now built into expectations. We believe valuation is now attractive for the prospects of TEL’s longer-term fundamentals given: 1) recent restructuring efforts, 2) an eventual recovery in the automotive market, 3) continued health of the Undersea cable business, and 4) renewed balance sheet strength after divestitures.
Key Catalysts – 1) Look for improvement in global auto trends especially in Europe where TEL is overweight Europe auto makers and this trend should last multiple quarters, 2) Positive EPS revision trend is just beginning, 3) TEL has completed much of its restructuring efforts and profits are set to improve, 4) In addition to continued dividend payments, look for a possible stock buyback to be implemented, which was stopped when automotive and the economy was falling.
Earnings Power – We believe TEL retains $2+ in EPS power and that more normalized earnings appear within reach by FY11 (Sept. quarter year end). Furthermore, we believe investors will be willing to pay a market multiple for shares of TEL over time given the company’s returns profile and competitive positioning.
Company description
Tyco Electronics (TEL) is a spin-out company (effective July 2, 2007) of parent company Tyco International (TYC). Tyco Electronics designs, manufactures, and markets about 500,000 different products for consumers within automotive, appliance, and aerospace and defense telecommunications, as well as computer and consumer electronic industries. It stands as a leading global provider of engineered electronic components, network solutions, and wireless systems, serving customers in over 150 countries with no customer accounting for more than 5% of sales (top 25 customers account for 30% of the company's total sales).
Investment strategy
We rate the shares of Tyco Electronics Buy/High Risk (1H) as we believe valuation is attractive for the prospects of the company’s longer-term fundamentals and that the bias on Consensus estimates is positive given our view that: 1.) The company will be successful in its restructuring efforts, 2.) The inventory correction in the automotive industry will eventually abate (global production is running at 45M units vs. a global annualized sales rate of 57.5M), 3.) The Undersea Cable business will provide sustainable revenue and
Electronics Manufacturing
Services
Buy/High Risk 1HPrice (30 Jun 09) US$18.59Target price US$25.00Expected share price return 34.5%Expected dividend yield 3.4%Expected total return 37.9%Market Cap US$8,515M
Company Metrics
52-Week Range $37.40–$7.44 Div (E) $0.64 P/E (9/09E) 25.9x P/E (9/10E) 19.2x 9/08A EPS US$2.69 9/09E Cur EPS US$0.67 9/10E Cur EPS US$1.00
Price Performance (RIC: TEL.N, BB: TEL US)
TEN+ 2009-2010 1 July 2009
Citigroup Global Markets 58
margin levels above current expectations driven by share gains, continued deployments in geographies such as Africa and the Middle East, and an eventual upgrade cycle of existing cable systems, and 4.) The company’s balance sheet strength, post recent divestitures, will allow for the flexibility to make tuck-in acquisitions, to continue to pay a $0.64 per share dividend, and to re-initiate a share buyback once the macro recovery is in full swing.
Valuation
Our $25 target price for TEL is based on P/E, and we believe Connector & EMS stocks should trade closely with the S&P Industrial cycle rather than their own 5-10 year historical averages.
Historically, TEL has traded at a 7% discount to the S&P500 FTM P/E multiple. However we believe shares are likely to trade more inline with the market going forward given its returns profile, competitive positioning, and the lack of overhang previously created by the company’s need to divest and prune a portion of the company’s revenue stream and by its past association with Tyco International (and the potential shareholder liabilities therein).
Furthermore, we believe investors are likely to look to more normalized FTM P/E multiples when attempting to assess longer term valuation and price targets. As such, we believe it is appropriate to use a 15x to 16x P/E multiple in our valuation work with TEL (the historic average range of the S&P 500 FTM P/E multiple vs. the 14x level of today).
Finally, we believe investors are likely to look to FY11 estimates (roughly 15 months forward) to determine the longer-term value TEL given that the company is likely to reach more normalized levels of profitability by that date on the heels of its various restructuring efforts.
Our target price is thus derived by applying a 15x P/E multiple to our $1.68 EPS estimate for FY11 (15 x $1.68 = $25.20, rounded to $25).
Risks
We rate Tyco High Risk primarily due to the stock’s volatility (beta of 1.3 vs. the S&P 500) using a two-year weekly measurement and the volatility of the EMS and highly fragmented connector industry. In addition to these, we have also incorporated other factors such as earnings stability, credit rating (BBB), interest coverage, and uses of cash (acquisitions, dividends, stock repurchases). Tyco has a much stronger history of stable revenues, earnings, and cash flow compared to other companies under our coverage that we rate Speculative. Risks to the stock deviating from our valuation target include the following: 1) A further economic slowdown that impacts the recovery of auto production; 2) Restructuring implementation ; 3) A failure to garner a fair share of quotable Undersea Cable business; 4) Acquisition integration; 5) Divestitures; 6) Currency fluctuations; 7) Acute Competition; 8) Changes to Dividend payments and stock buyback plans; 9) Failure of internal controls; 10) Liability sharing--TEL may be held liable for the entire amount of US income taxes should Tyco International or Covidien default on their obligations; and 11) Raw material prices.

TEN+ 2009-2010 1 July 2009
Citigroup Global Markets 59
Vale (VALE)
Alexander Hacking, CFA +1-212-816-6232
The Company — Vale is the world's No.1 iron ore miner and No.2 nickel miner located in Brazil. Iron ore is the underlying raw material in the steel making process and nickel is primarily used as an alloying agent in stainless steel. Vale is the second largest mining company in the world by market cap and is considered one of the five diversified majors.
Why Now? — Vale's current valuation is excessively depressed by cyclically weak earnings, in our view. Normalized/mid-cycle earnings for Vale are estimated at $2.00-3.00 per share, suggesting fair value for Vale shares in the range of $20-36. We believe in the short-term, Vale's earnings could double in 2010 compared with 2009, if European demand for iron ore improves. The company has valuable Tier 1 assets with large reserves close to the bottom of respective cost curves. In the short-run, OECD steel utilization rates are depressed by de-stocking and should improve independent of demand. Longer-term, continued industrialization of emerging markets should drive strong demand for minerals.
Key Catalysts — Mining is heavily cyclical and Vale's earnings have been severely diminished in 2009; -66% vs 2008. We believe the key catalysts for Vale's earnings are: 1) Improved production of steel in Europe and Brazil (China is running flat out with downside risk), 2) higher nickel prices (currently close to costs), and 3) iron ore prices in 2010 and beyond. Other important catalysts are improved OECD macro data and sustained resilience in the Chinese economy.
Company description
Vale is a global mining company based in Brazil. The company’s primary business is the mining and selling of iron ore and nickel. Vale also produces other minerals such as copper, aluminum, and coal, and it operates logistics businesses. Vale’s production facilities are mainly located in Brazil (100% of iron ore production), Canada (70% of nickel production) and Indonesia (30% of Nickel production). The company’s most important sales markets are Brazil, China, Europe, and Japan.
Investment strategy
We rate the shares of Vale Buy/Medium Risk. We are positive on Vale for the following reasons: 1. Current multiples are the lowest we have seen in over five years, 2. Vale has a strong balance sheet and cash position, 3. Vale has a strong portfolio of organic growth projects, 4. We believe that Vale is beneficially exposed to a secular “commodities super-cycle” which will drive high commodity prices once the current cyclical weakness is over.
Valuation
Our target price on the ADR Ordinary shares of Vale is US$28 per share. We use a 50:50 weighting of valuation multiples and DCF modeling.
Our target multiples for Vale are 8x EBITDA and 20x PE. These multiples are appropriate for Citi's mid-to-trough commodity price forecasts. Applying these multiples to 2009 earnings results in a target of US$33.
Metals & Mining
Buy/Medium Risk 1MPrice (30 Jun 09) US$17.63Target price US$28.00Expected share price return 58.8%Expected dividend yield 2.8%Expected total return 61.7%Market Cap US$92,000M
Company Metrics
52-Week Range $36.29–$8.80 Div (E) $0.50 P/E (12/09E) 20.0x P/E (12/10E) 20.7x 12/08A EPS US$2.63 12/09E Cur EPS US$0.88 12/10E Cur EPS US$0.85
Price Performance (RIC: VALE.N, BB: VALE US)

TEN+ 2009-2010 1 July 2009
Citigroup Global Markets 60
We explicitly model DCF cash flows out to 2015 and then use a terminal value. Key assumptions include long-run iron ore prices of $50/t and nickel prices of $6/lb. Our WACC is 11.2% which is calculated based on a beta of 1.0 (relative to Bovespa), a Brazil risk free rate of 7.9% and a Brazil ERP of 5.7% (per CIR LatAm Chartbook), cost of debt of 8%, tax of 30% and a target weight of debt of 30%. DCF modeling yields a US$23 target.
The average of these two results is US$28 per share.
Risks
We rate Vale Medium Risk. Vale’s earnings are exposed to highly volatile commodity prices, but this is mitigated by the company’s size, investment grade debt, and increasing diversification out of iron ore. Key risks that could prevent the shares from reaching our target price include a slowdown in Chinese industrial production, executing on major projects, future oversupply in the iron ore market, future expensive acquisitions, and political instability in Brazil.

TEN+ 2009-2010 1 July 2009
Citigroup Global Markets 61
Ventas Inc (VTR)
Michael Bilerman +1-212-816-1383
Uniquely Positioned — We believe Ventas is uniquely positioned to weather the challenging economic environment, given below average leverage, resilient cash flows and a prudent management team. Given the company’s relative balance sheet strength and capital capacity, VTR will likely be able to take advantage of potentially accretive opportunities as they arise, thereby driving above-average future growth. VTR has a solid track record of selling mature, non-core assets, while maintaining leasing velocity and liquidity. The company’s diversified healthcare platform leaves management with multiple levers for growth and cycle timing.
Potential Catalysts and Valuation — Although much of the REIT universe is in the process of significant (and often costly/dilutive) re-capitalization, we believe Ventas remains in a position of strength in terms of deciding how, when and where to strengthen its balance sheet. The company has access to multiple sources of attractively priced capital, including unsecured and GSE debt. The potential to raise additional capital gives VTR the benefit of accretive growth down the line, which will likely come through both acquisitions and development. VTR currently trades at an 8.5% implied cap rate, in-line with the REIT sector.
Risks — We view the greatest risk to Ventas is a material degradation of fundamentals, particularly in the senior living segment. Macroeconomic factors, particularly rising unemployment and continued housing market chaos, could sap demand. Operator bankruptcy is also a potential risk..
Company description
Ventas is a healthcare REIT that owns 243 senior housing facilities (assisted and independent living), 40 hospitals, 193 skilled nursing facilities 21 medical office buildings and 8 other properties in 43 states and 2 provinces in Canada. Ventas was formed in May 1998, when it was spun-off from Vencor, which is now Kindred, as the real estate holding entity and Vencor as the facility operator. In 1998, a cut in Medicare reimbursement rates caused the bankruptcy of many providers, including Vencor. Under CEO Debbie Carfaro's lead, Ventas structured a lease with Vencor/Kindred to pay lower rents to improve its financial position with a one-way rent reset option in 2006 to mark the rents in the leases to market. Ventas' management team has focused on growing the portfolio and diversifying away from its initial 100% Kindred exposure. In 2Q07, Ventas closed on the acquisition of Sunrise REIT which included ~75 senior housing communities and puts the Sunrise portfolio as the highest contributor as a percentage revenue.
Investment strategy
We rate shares of VTR Buy/High Risk (1H). Ventas is the second largest health care REIT and appears to be the most attractive value in the health care sector. Ventas' diversified portfolio by facility type and entrepreneurial mgmt team make VTR appealing. The company's purchase of Sunrise REIT for $2 billion reduced the company's exposure to Kindred to less than 30% of revenues from 49% and increases exposure to private pay sources to 2/3rds of revenue from ~50%, which could lead to multiple expansion. Management will likely further
Real Estate Investment
Trusts
Buy/High Risk 1HPrice (30 Jun 09) US$29.86Target price US$32.00Expected share price return 7.2%Expected dividend yield 6.9%Expected total return 14.0%Market Cap US$4,673M
Company Metrics
52-Week Range $512.00–$17.34 Div (E) $2.05 P/E (12/09E) 11.7x P/E (12/10E) 11.4x 12/08A EPS US$2.74 12/09E Cur EPS US$2.55 12/10E Cur EPS US$2.63
Price Performance (RIC: VTR.N, BB: VTR US)
TEN+ 2009-2010 1 July 2009
Citigroup Global Markets 62
reduce tenant concentration via acquisitions (particularly in the medial office space) or potentially selling assets back to Kindred/Brookdale or third parties.
Valuation
We use a dividend plus growth model to forecast total returns, which generally assumes the current-year multiple is applied to next year’s earnings. For example, if a company’s normalized AFFO (adjusted funds from operations) is expected to grow by 8%, our target price is 8% above the current level. We then add the dividend yield to arrive at a 12-month forward expected total return. We currently believe that REITs will deliver a flat to negative 10% total return in the next 12 months, hence we assume earnings multiples will contract by 10-15% on average given current earnings growth expectations. We consider a result falling within a range of +/- 10% relative to this expected multiple contraction as typically within the margin of error.
VTR has exposure to a diversified portfolio of high growth business segments within the defensive healthcare industry. We expect an additional 10% expansion on top of this year's growth; the above factors resulted in a target price of $32, which is currently within the specified margin.
Risks
We rate VTR shares High Risk, reflecting our increased concern over REIT sector valuations. All of the REITs in our coverage universe have High Risk or Speculative ratings. Continued concerns regarding reduced liquidity, wider credit spreads, lack of transactions to validate our beliefs that REITs are trading at a discount, though still well above historical valuation metrics, cause us to be more cautious as REITs will likely continue to be volatile.
Risks to the stock achieving our target price include the following:
Tenant concentration – Roughly 85% of revenues are generated from Ventas' top 3 tenants, with Sunrise at 43%, Kindred at 28% and Brookdale at 14%. If the health of any of these tenants deteriorates the company's earnings and cash flow could be at risk.
Sunrise Increases volatility – The Sunrise assets bring a degree of seasonality to the company's business making FFO more difficult to estimate on a quarterly basis.
If the impact of any of these factors proves greater than we anticipate, the stock could have difficulty achieving our target price.
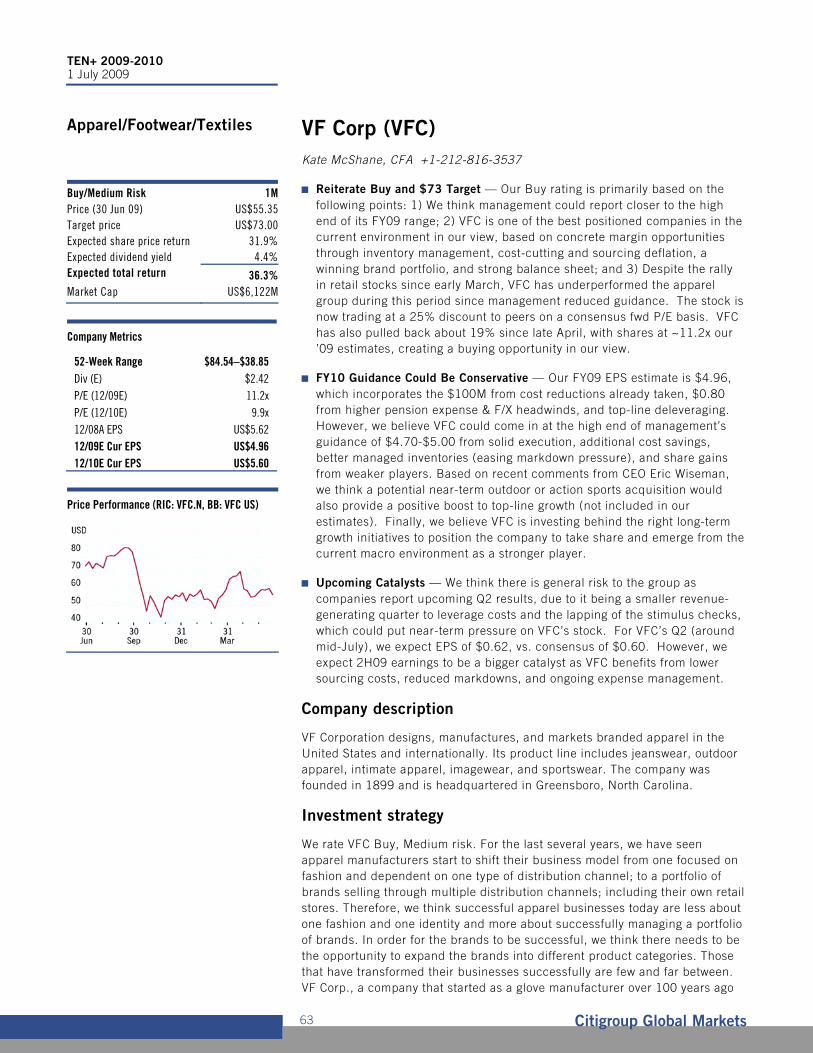
TEN+ 2009-2010 1 July 2009
Citigroup Global Markets 63
VF Corp (VFC)
Kate McShane, CFA +1-212-816-3537
Reiterate Buy and $73 Target — Our Buy rating is primarily based on the following points: 1) We think management could report closer to the high end of its FY09 range; 2) VFC is one of the best positioned companies in the current environment in our view, based on concrete margin opportunities through inventory management, cost-cutting and sourcing deflation, a winning brand portfolio, and strong balance sheet; and 3) Despite the rally in retail stocks since early March, VFC has underperformed the apparel group during this period since management reduced guidance. The stock is now trading at a 25% discount to peers on a consensus fwd P/E basis. VFC has also pulled back about 19% since late April, with shares at ~11.2x our ’09 estimates, creating a buying opportunity in our view.
FY10 Guidance Could Be Conservative — Our FY09 EPS estimate is $4.96, which incorporates the $100M from cost reductions already taken, $0.80 from higher pension expense & F/X headwinds, and top-line deleveraging. However, we believe VFC could come in at the high end of management’s guidance of $4.70-$5.00 from solid execution, additional cost savings, better managed inventories (easing markdown pressure), and share gains from weaker players. Based on recent comments from CEO Eric Wiseman, we think a potential near-term outdoor or action sports acquisition would also provide a positive boost to top-line growth (not included in our estimates). Finally, we believe VFC is investing behind the right long-term growth initiatives to position the company to take share and emerge from the current macro environment as a stronger player.
Upcoming Catalysts — We think there is general risk to the group as companies report upcoming Q2 results, due to it being a smaller revenue-generating quarter to leverage costs and the lapping of the stimulus checks, which could put near-term pressure on VFC’s stock. For VFC’s Q2 (around mid-July), we expect EPS of $0.62, vs. consensus of $0.60. However, we expect 2H09 earnings to be a bigger catalyst as VFC benefits from lower sourcing costs, reduced markdowns, and ongoing expense management.
Company description
VF Corporation designs, manufactures, and markets branded apparel in the United States and internationally. Its product line includes jeanswear, outdoor apparel, intimate apparel, imagewear, and sportswear. The company was founded in 1899 and is headquartered in Greensboro, North Carolina.
Investment strategy
We rate VFC Buy, Medium risk. For the last several years, we have seen apparel manufacturers start to shift their business model from one focused on fashion and dependent on one type of distribution channel; to a portfolio of brands selling through multiple distribution channels; including their own retail stores. Therefore, we think successful apparel businesses today are less about one fashion and one identity and more about successfully managing a portfolio of brands. In order for the brands to be successful, we think there needs to be the opportunity to expand the brands into different product categories. Those that have transformed their businesses successfully are few and far between. VF Corp., a company that started as a glove manufacturer over 100 years ago
Apparel/Footwear/Textiles
Buy/Medium Risk 1MPrice (30 Jun 09) US$55.35Target price US$73.00Expected share price return 31.9%Expected dividend yield 4.4%Expected total return 36.3%Market Cap US$6,122M
Company Metrics
52-Week Range $84.54–$38.85 Div (E) $2.42 P/E (12/09E) 11.2x P/E (12/10E) 9.9x 12/08A EPS US$5.62 12/09E Cur EPS US$4.96 12/10E Cur EPS US$5.60
Price Performance (RIC: VFC.N, BB: VFC US)

TEN+ 2009-2010 1 July 2009
Citigroup Global Markets 64
has been able to successfully transform its business from a pure manufacturer of several brands to a diversified portfolio of over 50 brands. Also, VF Corp is focused on expanding its specialty retail business in order showcase their brands profitably and to gain more control over its brands. Based on our analysis, we rate VF Corp with a Buy, Medium Risk rating. We think the company's diverse portfolio of brands, its experienced management team and strong balance sheet should enable the company to capture future growth opportunities. Furthermore, our proprietary sum of the parts valuation analysis indicates there is room for multiple expansion as VF Corp's faster growing lifestyle brands become a bigger portion of the portfolio.
Valuation
Our $73 target is based on an average of our sum of the parts P/E analysis and our 10-year discounted cash flow analysis:
Sum of the Parts P/E Analysis - Applying a 9x multiple to the heritage business drives a value of $24 per share. This multiple is in-line with the peer average. Applying a 14.0x P/E multiple to the lifestyle business drives a value of roughly $38 per share. The multiple is in-line with the '09 P/E average of this business' closest comparables, which include COLM and WWW (outdoor businesses manufacturing outerwear, sportswear & apparel), and TRLG. The sum of these two businesses is $65 per share.
Discounted Cash Flow Analysis - Based on our 10-yr DCF flow analysis, we calculate a value of $81. We assume a terminal growth rate of 3% (roughly in-line with inflation). Our weighted average cost of capital (WACC) of 8.1% is based on: a beta assumption of 0.97 (source: Bloomberg); a risk premium of 6.40%; a risk-free rate of 2.70%; and our assumption of VFC's average post-tax cost of debt of 4.8%.
Risks
Based on the company's debt rating, stock price volatility, financial strength, experienced management, earnings and free cash flow stability, we think VF Corp's stock should be rated Medium Risk.
Other risks we see for the stock not achieving the target price include:
Notable Exposure to Wal-Mart – Around 12% of VFC's business is through Wal-Mart (WMT, covered by Citi Investment Research analyst Deborah Weinswig), where we believe there is constant pricing pressure as well as the threat of Wal-Mart's expanding private label business.
Exposure to Lower-End Consumer
Potential Acquisition Targets May be Hard to Come By
International Risk

TEN+ 2009-2010 1 July 2009
Citigroup Global Markets 65
Appendix A-1 Analyst Certification
Each research analyst(s) principally responsible for the preparation and content of all or any identified portion of this research report hereby certifies that, with respect to each issuer or security or any identified portion of the report with respect to an issuer or security that the research analyst covers in this research report, all of the views expressed in this research report accurately reflect their personal views about those issuer(s) or securities. Each research analyst(s) also certify that no part of their compensation was, is, or will be, directly or indirectly, related to the specific recommendation(s) or view(s) expressed by that research analyst in this research report.
IMPORTANT DISCLOSURES
An employee of Citigroup Global Markets or its affiliates is a Non-Executive Director of British American Tobacco Congo.
A director of Citi serves as a director of Estee Lauder Companies Inc.
A director of Citi serves as a director of Halliburton Company.
A director of Citi serves as director of Hewlett Packard Co.
Customers of the Firm in the United States can receive independent third-party research on the company or companies covered in this report, at no cost to them, where such research is available. Customers can access this independent research at http://www.citigroupgeo.com or http://www.smithbarney.com or can call (866) 836-9542 to request a copy of this research.
Citigroup Global Markets Inc. or its affiliates beneficially owns 1% or more of any class of common equity securities of Bank of America Corp, Cliffs Natural Resources Inc., Ventas Inc. This position reflects information available as of the prior business day.
Within the past 12 months, Citigroup Global Markets Inc. or its affiliates has acted as manager or co-manager of an offering of securities of Bank of America Corp, British American Tobacco PLC, Estee Lauder Inc, Equinix Inc, Halliburton Co, Ingersoll Rand Co LTD, Merck, Microsoft Corp, Norfolk Southern, Tyco Electronics Ltd, Vale (Preferred), Ventas Inc.
Citigroup Global Markets Inc. or its affiliates has received compensation for investment banking services provided within the past 12 months from Bank of America Corp, British American Tobacco PLC, BJ Services Co, Covidien Ltd, Estee Lauder Inc, Equinix Inc, Gilead Sciences Inc, Halliburton Co, Hewlett-Packard Co, Hershey Foods Corp, Ingersoll Rand Co LTD, MetLife Inc, Merck, Microsoft Corp, Norfolk Southern, NV Energy, Owens Illinois Inc, State Street Corp, Vale (Preferred), VF Corp, Ventas Inc.
Citigroup Global Markets Inc. or its affiliates expects to receive or intends to seek, within the next three months, compensation for investment banking services from Microsoft Corp, Vale (Preferred).
Citigroup Global Markets Inc. or an affiliate received compensation for products and services other than investment banking services from Automatic Data Processing Inc, Bank of America Corp, British American Tobacco PLC, BJ Services Co, Cliffs Natural Resources Inc., CME Group Inc, Costco Wholesale Corp, Covidien Ltd, Estee Lauder Inc, Equinix Inc, Gilead Sciences Inc, Google Inc, Halliburton Co, Home Depot Inc, Hewlett-Packard Co, Hershey Foods Corp, Ingersoll Rand Co LTD, MetLife Inc, Merck, Microsoft Corp, Newfield Exploration Co, Norfolk Southern, NVIDIA Corp, NV Energy, Owens Illinois Inc, State Street Corp, Tyco Electronics Ltd, Vale (Preferred), VF Corp, Ventas Inc in the past 12 months.
Citigroup Global Markets Inc. currently has, or had within the past 12 months, the following as investment banking client(s): Bank of America Corp, British American Tobacco PLC, BJ Services Co, Covidien Ltd, Estee Lauder Inc, Equinix Inc, Gilead Sciences Inc, Halliburton Co, Hewlett-Packard Co, Hershey Foods Corp, Ingersoll Rand Co LTD, MetLife Inc, Merck, Microsoft Corp, Norfolk Southern, NV Energy, Owens Illinois Inc, State Street Corp, Vale (Preferred), VF Corp, Ventas Inc.
Citigroup Global Markets Inc. currently has, or had within the past 12 months, the following as clients, and the services provided were non-investment-banking, securities-related: Automatic Data Processing Inc, Bank of America Corp, British American Tobacco PLC, BJ Services Co, CME Group Inc, Costco Wholesale Corp, Covidien Ltd, Estee Lauder Inc, Equinix Inc, Gilead Sciences Inc, Google Inc, Halliburton Co, Home Depot Inc, Hewlett-Packard Co, Hershey Foods Corp, Ingersoll Rand Co LTD, MetLife Inc, Merck, Microsoft Corp, Newfield Exploration Co, Norfolk Southern, NVIDIA Corp, NV Energy, Owens Illinois Inc, State Street Corp, Tyco Electronics Ltd, Vale (Preferred), VF Corp.
Citigroup Global Markets Inc. currently has, or had within the past 12 months, the following as clients, and the services provided were non-investment-banking, non-securities-related: Automatic Data Processing Inc, Bank of America Corp, British American Tobacco PLC, BJ Services Co, Cliffs Natural Resources Inc., CME Group Inc, Costco Wholesale Corp, Covidien Ltd, Estee Lauder Inc, Gilead Sciences Inc, Google Inc, Halliburton Co, Home Depot Inc, Hewlett-Packard Co, Hershey Foods Corp, Ingersoll Rand Co LTD, MetLife Inc, Merck, Microsoft Corp, Norfolk Southern, NVIDIA Corp, NV Energy, Owens Illinois Inc, State Street Corp, Tyco Electronics Ltd, Vale (Preferred), VF Corp, Ventas Inc.
State Street Corp or its affiliates beneficially owns 2% or more of any class of common equity securities of Citigroup Inc.
Analysts' compensation is determined based upon activities and services intended to benefit the investor clients of Citigroup Global Markets Inc. and its affiliates ("the Firm"). Like all Firm employees, analysts receive compensation that is impacted by overall firm profitability which includes investment banking revenues.
The Firm is a market maker in the publicly traded equity securities of Automatic Data Processing Inc, CME Group Inc, Costco Wholesale Corp, CVS Caremark Corp, Equinix Inc, Gilead Sciences Inc, Google Inc, Microsoft Corp, NVIDIA Corp, Research In Motion Ltd.
For important disclosures (including copies of historical disclosures) regarding the companies that are the subject of this Citi Investment Research & Analysis product ("the Product"), please contact Citi Investment Research & Analysis, 388 Greenwich Street, 29th Floor, New York, NY, 10013, Attention: Legal/Compliance. In addition, the same important disclosures, with the exception of the Valuation and Risk assessments and historical disclosures, are contained on the Firm's disclosure website at www.citigroupgeo.com. Valuation and Risk assessments can be found in the text of the most recent research note/report regarding the subject company. Historical disclosures (for up to the past three years) will be provided upon request.
Citi Investment Research Ratings Distribution Data current as of 30 Jun 2009 Buy Hold Sell

TEN+ 2009-2010 1 July 2009
Citigroup Global Markets 66
Citi Investment Research Global Fundamental Coverage 41% 38% 21%% of companies in each rating category that are investment banking clients 46% 45% 39%
Guide to Fundamental Research Investment Ratings: Citi Investment Research's stock recommendations include a risk rating and an investment rating. Risk ratings, which take into account both price volatility and fundamental criteria, are: Low (L), Medium (M), High (H), and Speculative (S). Investment ratings are a function of Citi Investment Research's expectation of total return (forecast price appreciation and dividend yield within the next 12 months) and risk rating.
For securities in developed markets (US, UK, Europe, Japan, and Australia/New Zealand), investment ratings are:Buy (1) (expected total return of 10% or more for Low-Risk stocks, 15% or more for Medium-Risk stocks, 20% or more for High-Risk stocks, and 35% or more for Speculative stocks); Hold (2) (0%-10% for Low-Risk stocks, 0%-15% for Medium-Risk stocks, 0%-20% for High-Risk stocks, and 0%-35% for Speculative stocks); and Sell (3) (negative total return).
For securities in emerging markets (Asia Pacific, Emerging Europe/Middle East/Africa, and Latin America), investment ratings are:Buy (1) (expected total return of 15% or more for Low-Risk stocks, 20% or more for Medium-Risk stocks, 30% or more for High-Risk stocks, and 40% or more for Speculative stocks); Hold (2) (5%-15% for Low-Risk stocks, 10%-20% for Medium-Risk stocks, 15%-30% for High-Risk stocks, and 20%-40% for Speculative stocks); and Sell (3) (5% or less for Low-Risk stocks, 10% or less for Medium-Risk stocks, 15% or less for High-Risk stocks, and 20% or less for Speculative stocks).
Investment ratings are determined by the ranges described above at the time of initiation of coverage, a change in investment and/or risk rating, or a change in target price (subject to limited management discretion). At other times, the expected total returns may fall outside of these ranges because of market price movements and/or other short-term volatility or trading patterns. Such interim deviations from specified ranges will be permitted but will become subject to review by Research Management. Your decision to buy or sell a security should be based upon your personal investment objectives and should be made only after evaluating the stock's expected performance and risk. Guide to Corporate Bond Research Credit Opinions and Investment Ratings: Citi Investment Research's corporate bond research issuer publications include a fundamental credit opinion of Improving, Stable or Deteriorating and a complementary risk rating of Low (L), Medium (M), High (H) or Speculative (S) regarding the credit risk of the company featured in the report. The fundamental credit opinion reflects the CIR analyst's opinion of the direction of credit fundamentals of the issuer without respect to securities market vagaries. The fundamental credit opinion is not geared to, but should be viewed in the context of debt ratings issued by major public debt ratings companies such as Moody's Investors Service, Standard and Poor's, and Fitch Ratings. CBR risk ratings are approximately equivalent to the following matrix: Low Risk Triple A to Low Double A; Low to Medium Risk High Single A through High Triple B; Medium to High Risk Mid Triple B through High Double B; High to Speculative Risk Mid Double B and Below. The risk rating element illustrates the analyst's opinion of the relative likelihood of loss of principal when a fixed income security issued by a company is held to maturity, based upon both fundamental and market risk factors. Certain reports published by Citi Investment Research will also include investment ratings on specific issues of companies under coverage which have been assigned fundamental credit opinions and risk ratings. Investment ratings are a function of Citi Investment Research's expectations for total return, relative return (to publicly available Citigroup bond indices performance), and risk rating. These investment ratings are: Buy/Overweight the bond is expected to outperform the relevant Citigroup bond market sector index (Broad Investment Grade, High Yield Market or Emerging Market), performances of which are updated monthly and can be viewed at http://sd.ny.ssmb.com/ using the "Indexes" tab; Hold/Neutral Weight the bond is expected to perform in line with the relevant Citigroup bond market sector index; or Sell/Underweight the bond is expected to underperform the relevant sector of the Citigroup indexes.
OTHER DISCLOSURES
Citigroup Global Markets Inc. and/or its affiliates has a significant financial interest in relation to Automatic Data Processing Inc, Bank of America Corp, British American Tobacco PLC, BJ Services Co, CME Group Inc, Costco Wholesale Corp, Covidien Ltd, Estee Lauder Inc, Gilead Sciences Inc, Google Inc, Halliburton Co, Home Depot Inc, Hewlett-Packard Co, Ingersoll Rand Co LTD, MetLife Inc, Merck, Microsoft Corp, Norfolk Southern, State Street Corp, Tyco Electronics Ltd, Vale (Preferred), VF Corp, Ventas Inc. (For an explanation of the determination of significant financial interest, please refer to the policy for managing conflicts of interest which can be found at www.citigroupgeo.com.)
For securities recommended in the Product in which the Firm is not a market maker, the Firm is a liquidity provider in the issuers' financial instruments and may act as principal in connection with such transactions. The Firm is a regular issuer of traded financial instruments linked to securities that may have been recommended in the Product. The Firm regularly trades in the securities of the issuer(s) discussed in the Product. The Firm may engage in securities transactions in a manner inconsistent with the Product and, with respect to securities covered by the Product, will buy or sell from customers on a principal basis.
Securities recommended, offered, or sold by the Firm: (i) are not insured by the Federal Deposit Insurance Corporation; (ii) are not deposits or other obligations of any insured depository institution (including Citibank); and (iii) are subject to investment risks, including the possible loss of the principal amount invested. Although information has been obtained from and is based upon sources that the Firm believes to be reliable, we do not guarantee its accuracy and it may be incomplete and condensed. Note, however, that the Firm has taken all reasonable steps to determine the accuracy and completeness of the disclosures made in the Important Disclosures section of the Product. The Firm's research department has received assistance from the subject company(ies) referred to in this Product including, but not limited to, discussions with management of the subject company(ies). Firm policy prohibits research analysts from sending draft research to subject companies. However, it should be presumed that the author of the Product has had discussions with the subject company to ensure factual accuracy prior to publication. All opinions, projections and estimates constitute the judgment of the author as of the date of the Product and these, plus any other information contained in the Product, are subject to change without notice. Prices and availability of financial instruments also are subject to change without notice. Notwithstanding other departments within the Firm advising the companies discussed in this Product, information obtained in such role is not used in the preparation of the Product. Although Citi Investment Research does not set a predetermined frequency for publication, if the Product is a fundamental research report, it is the intention of Citi Investment Research to provide research coverage of the/those issuer(s) mentioned therein, including in response to news affecting this issuer, subject to applicable quiet periods and capacity constraints. The Product is for informational purposes only and is not intended as an offer or solicitation for the purchase or sale of a security. Any decision to purchase securities mentioned in the Product must take into account existing public information on such security or any registered prospectus.
Investing in non-U.S. securities, including ADRs, may entail certain risks. The securities of non-U.S. issuers may not be registered with, nor be subject to the reporting requirements of the U.S. Securities and Exchange Commission. There may be limited information available on foreign securities. Foreign companies are generally not subject to uniform audit and reporting standards, practices and requirements comparable to those in the U.S. Securities of some foreign companies may be less liquid and their prices more volatile than securities of comparable U.S. companies. In addition, exchange rate movements may have an adverse effect on the value of an investment in a foreign stock and its corresponding dividend payment for U.S. investors. Net dividends to ADR investors are estimated, using withholding tax rates conventions, deemed accurate, but investors are urged to consult their tax advisor for exact dividend computations. Investors who have received the Product from the Firm may be prohibited in certain states or other jurisdictions from purchasing securities mentioned in the Product from the Firm. Please ask your Financial Consultant for additional details.

TEN+ 2009-2010 1 July 2009
Citigroup Global Markets 67
Citigroup Global Markets Inc. takes responsibility for the Product in the United States. Any orders by US investors resulting from the information contained in the Product may be placed only through Citigroup Global Markets Inc.
Important Disclosures for Morgan Stanley Smith Barney LLC Customers: Morgan Stanley & Co. Incorporated (Morgan Stanley) research reports may be available about the companies that are the subject of this Citi Investment Research & Analysis (CIRA) research report. Ask your Financial Advisor or use smithbarney.com to view any available Morgan Stanley research reports in addition to CIRA research reports. In addition to the disclosures on this research report and on the CIRA disclosure website (https://www.citigroupgeo.com/geopublic/Disclosures/index_a.html), important disclosures regarding the relationship between the companies that are the subject of this report and Morgan Stanley Smith Barney LLC, Morgan Stanley or any of its affiliates, are available at www.morganstanley.com/researchdisclosures. This CIRA research report has been reviewed and approved on behalf of Morgan Stanley Smith Barney LLC. This review and approval was conducted by the same person who reviewed this research report on behalf of CIRA. This could create a conflict of interest.
The Citigroup legal entity that takes responsibility for the production of the Product is the legal entity which the first named author is employed by. The Product is made available in Australia through Citigroup Global Markets Australia Pty Ltd. (ABN 64 003 114 832 and AFSL No. 240992), participant of the ASX Group and regulated by the Australian Securities & Investments Commission. Citigroup Centre, 2 Park Street, Sydney, NSW 2000. The Product is made available in Australia to Private Banking wholesale clients through Citigroup Pty Limited (ABN 88 004 325 080 and AFSL 238098). Citigroup Pty Limited provides all financial product advice to Australian Private Banking wholesale clients through bankers and relationship managers. If there is any doubt about the suitability of investments held in Citigroup Private Bank accounts, investors should contact the Citigroup Private Bank in Australia. Citigroup companies may compensate affiliates and their representatives for providing products and services to clients. The Product is made available in Brazil by Citigroup Global Markets Brasil - CCTVM SA, which is regulated by CVM - Comissão de Valores Mobiliários, BACEN - Brazilian Central Bank, APIMEC - Associação Associação dos Analistas e Profissionais de Investimento do Mercado de Capitais and ANBID - Associação Nacional dos Bancos de Investimento. Av. Paulista, 1111 - 11º andar - CEP. 01311920 - São Paulo - SP. If the Product is being made available in certain provinces of Canada by Citigroup Global Markets (Canada) Inc. ("CGM Canada"), CGM Canada has approved the Product. Citigroup Place, 123 Front Street West, Suite 1100, Toronto, Ontario M5J 2M3. The Product is made available in France by Citigroup Global Markets Limited, which is authorised and regulated by Financial Services Authority. 1-5 Rue Paul Cézanne, 8ème, Paris, France. The Product may not be distributed to private clients in Germany. The Product is distributed in Germany by Citigroup Global Markets Deutschland AG & Co. KGaA, which is regulated by Bundesanstalt fuer Finanzdienstleistungsaufsicht (BaFin). Frankfurt am Main, Reuterweg 16, 60323 Frankfurt am Main. If the Product is made available in Hong Kong by, or on behalf of, Citigroup Global Markets Asia Ltd., it is attributable to Citigroup Global Markets Asia Ltd., Citibank Tower, Citibank Plaza, 3 Garden Road, Hong Kong. Citigroup Global Markets Asia Ltd. is regulated by Hong Kong Securities and Futures Commission. If the Product is made available in Hong Kong by The Citigroup Private Bank to its clients, it is attributable to Citibank N.A., Citibank Tower, Citibank Plaza, 3 Garden Road, Hong Kong. The Citigroup Private Bank and Citibank N.A. is regulated by the Hong Kong Monetary Authority. The Product is made available in India by Citigroup Global Markets India Private Limited, which is regulated by Securities and Exchange Board of India. Bakhtawar, Nariman Point, Mumbai 400-021. The Product is made available in Indonesia through PT Citigroup Securities Indonesia. 5/F, Citibank Tower, Bapindo Plaza, Jl. Jend. Sudirman Kav. 54-55, Jakarta 12190. Neither this Product nor any copy hereof may be distributed in Indonesia or to any Indonesian citizens wherever they are domiciled or to Indonesian residents except in compliance with applicable capital market laws and regulations. This Product is not an offer of securities in Indonesia. The securities referred to in this Product have not been registered with the Capital Market and Financial Institutions Supervisory Agency (BAPEPAM-LK) pursuant to relevant capital market laws and regulations, and may not be offered or sold within the territory of the Republic of Indonesia or to Indonesian citizens through a public offering or in circumstances which constitute an offer within the meaning of the Indonesian capital market laws and regulations. The Product is made available in Italy by Citigroup Global Markets Limited, which is authorised and regulated by Financial Services Authority. Foro Buonaparte 16, Milan, 20121, Italy. If the Product was prepared by Citi Investment Research and distributed in Japan by Nikko Citigroup Limited ("NCL"), it is being so distributed under license. If the Product was prepared by NCL and distributed by Nikko Cordial Securities Inc. or Citigroup Global Markets Inc. it is being so distributed under license. NCL is regulated by Financial Services Agency, Securities and Exchange Surveillance Commission, Japan Securities Dealers Association, Tokyo Stock Exchange and Osaka Securities Exchange. Shin-Marunouchi Building, 1-5-1 Marunouchi, Chiyoda-ku, Tokyo 100-6520 Japan. In the event that an error is found in an NCL research report, a revised version will be posted on Citi Investment Research's Global Equities Online (GEO) website. If you have questions regarding GEO, please call (81 3) 6270-3019 for help. The Product is made available in Korea by Citigroup Global Markets Korea Securities Ltd., which is regulated by Financial Supervisory Commission and the Financial Supervisory Service. Hungkuk Life Insurance Building, 226 Shinmunno 1-GA, Jongno-Gu, Seoul, 110-061. The Product is made available in Malaysia by Citigroup Global Markets Malaysia Sdn Bhd, which is regulated by Malaysia Securities Commission. Menara Citibank, 165 Jalan Ampang, Kuala Lumpur, 50450. The Product is made available in Mexico by Acciones y Valores Banamex, S.A. De C. V., Casa de Bolsa, Integrante del Grupo Financiero Banamex ("Accival") which is a wholly owned subsidiary of Citigroup Inc. and is regulated by Comision Nacional Bancaria y de Valores. Reforma 398, Col. Juarez, 06600 Mexico, D.F. In New Zealand the Product is made available through Citigroup Global Markets New Zealand Ltd. (Company Number 604457), a Participant of the New Zealand Exchange Limited and regulated by the New Zealand Securities Commission. Level 19, Mobile on the Park, 157 Lambton Quay, Wellington. The Product is made available in Pakistan by Citibank N.A. Pakistan branch, which is regulated by the State Bank of Pakistan and Securities Exchange Commission, Pakistan. AWT Plaza, 1.1. Chundrigar Road, P.O. Box 4889, Karachi-74200. The Product is made available in Poland by Dom Maklerski Banku Handlowego SA an indirect subsidiary of Citigroup Inc., which is regulated by Komisja Nadzoru Finansowego. Dom Maklerski Banku Handlowego S.A. ul. Chalubinskiego 8, 00-630 Warszawa. The Product is made available in the Russian Federation through ZAO Citibank, which is licensed to carry out banking activities in the Russian Federation in accordance with the general banking license issued by the Central Bank of the Russian Federation and brokerage activities in accordance with the license issued by the Federal Service for Financial Markets. Neither the Product nor any information contained in the Product shall be considered as advertising the securities mentioned in this report within the territory of the Russian Federation or outside the Russian Federation. The Product does not constitute an appraisal within the meaning of the Federal Law of the Russian Federation of 29 July 1998 No. 135-FZ (as amended) On Appraisal Activities in the Russian Federation. 8-10 Gasheka Street, 125047 Moscow. The Product is made available in Singapore through Citigroup Global Markets Singapore Pte. Ltd., a Capital Markets Services Licence holder, and regulated by Monetary Authority of Singapore. 1 Temasek Avenue, #39-02 Millenia Tower, Singapore 039192. The Product is made available by The Citigroup Private Bank in Singapore through Citibank, N.A., Singapore branch, a licensed bank in Singapore that is regulated by Monetary Authority of Singapore. Citigroup Global Markets (Pty) Ltd. is incorporated in the Republic of South Africa (company registration number 2000/025866/07) and its registered office is at 145 West Street, Sandton, 2196, Saxonwold. Citigroup Global Markets (Pty) Ltd. is regulated by JSE Securities Exchange South Africa, South African Reserve Bank and the Financial Services Board. The investments and services contained herein are not available to private customers in South Africa. The Product is made available in Spain by Citigroup Global Markets Limited, which is authorised and regulated by Financial Services Authority. 29 Jose Ortega Y Gassef, 4th Floor, Madrid, 28006, Spain. The Product is made available in Taiwan through Citigroup Global Markets Taiwan Securities Company Ltd., which is regulated by Securities & Futures Bureau. No portion of the report may be reproduced or quoted in Taiwan by the press or any other person. No. 8 Manhattan Building, Hsin Yi Road, Section 5, Taipei 100, Taiwan. The Product is made available in Thailand through Citicorp Securities (Thailand) Ltd., which is regulated by the Securities and Exchange Commission of Thailand. 18/F, 22/F and 29/F, 82 North Sathorn Road, Silom, Bangrak, Bangkok 10500, Thailand. The Product is made available in Turkey through Citibank AS which is regulated by Capital Markets Board. Tekfen Tower, Eski Buyukdere Caddesi # 209 Kat 2B, 23294 Levent, Istanbul, Turkey. In the U.A.E, these materials (the "Materials") are communicated by Citigroup Global Markets Limited, DIFC branch ("CGML"), an entity registered in the Dubai International Financial Center ("DIFC") and licensed and regulated by the Dubai Financial Services Authority ("DFSA" to Professional Clients and Market Counterparties only and should not be relied upon
TEN+ 2009-2010 1 July 2009
Citigroup Global Markets 68
or distributed to Retail Clients. A distribution of the different CIRA ratings distribution, in percentage terms for Investments in each sector covered is made available on request. Financial products and/or services to which the Materials relate will only be made available to Professional Clients and Market Counterparties. The Product is made available in United Kingdom by Citigroup Global Markets Limited, which is authorised and regulated by Financial Services Authority. This material may relate to investments or services of a person outside of the UK or to other matters which are not regulated by the FSA and further details as to where this may be the case are available upon request in respect of this material. Citigroup Centre, Canada Square, Canary Wharf, London, E14 5LB. The Product is made available in United States by Citigroup Global Markets Inc, which is regulated by NASD, NYSE and the US Securities and Exchange Commission. 388 Greenwich Street, New York, NY 10013. Unless specified to the contrary, within EU Member States, the Product is made available by Citigroup Global Markets Limited, which is regulated by Financial Services Authority. Many European regulators require that a firm must establish, implement and make available a policy for managing conflicts of interest arising as a result of publication or distribution of investment research. The policy applicable to Citi Investment Research's Products can be found at www.citigroupgeo.com. Compensation of equity research analysts is determined by equity research management and Citigroup's senior management and is not linked to specific transactions or recommendations. The Product may have been distributed simultaneously, in multiple formats, to the Firm's worldwide institutional and retail customers. The Product is not to be construed as providing investment services in any jurisdiction where the provision of such services would not be permitted. Subject to the nature and contents of the Product, the investments described therein are subject to fluctuations in price and/or value and investors may get back less than originally invested. Certain high-volatility investments can be subject to sudden and large falls in value that could equal or exceed the amount invested. Certain investments contained in the Product may have tax implications for private customers whereby levels and basis of taxation may be subject to change. If in doubt, investors should seek advice from a tax adviser. The Product does not purport to identify the nature of the specific market or other risks associated with a particular transaction. Advice in the Product is general and should not be construed as personal advice given it has been prepared without taking account of the objectives, financial situation or needs of any particular investor. Accordingly, investors should, before acting on the advice, consider the appropriateness of the advice, having regard to their objectives, financial situation and needs. Prior to acquiring any financial product, it is the client's responsibility to obtain the relevant offer document for the product and consider it before making a decision as to whether to purchase the product.
© 2009 Citigroup Global Markets Inc. (© Nikko Citigroup Limited, if this Product was prepared by it). Citi Investment Research is a division and service mark of Citigroup Global Markets Inc. and its affiliates and is used and registered throughout the world. Citi and Citi with Arc Design are trademarks and service marks of Citigroup Inc and its affiliates and are used and registered throughout the world. Nikko is a registered trademark of Nikko Cordial Corporation. All rights reserved. Any unauthorized use, duplication, redistribution or disclosure is prohibited by law and will result in prosecution. Where included in this report, MSCI sourced information is the exclusive property of Morgan Stanley Capital International Inc. (MSCI). Without prior written permission of MSCI, this information and any other MSCI intellectual property may not be reproduced, redisseminated or used to create any financial products, including any indices. This information is provided on an "as is" basis. The user assumes the entire risk of any use made of this information. MSCI, its affiliates and any third party involved in, or related to, computing or compiling the information hereby expressly disclaim all warranties of originality, accuracy, completeness, merchantability or fitness for a particular purpose with respect to any of this information. Without limiting any of the foregoing, in no event shall MSCI, any of its affiliates or any third party involved in, or related to, computing or compiling the information have any liability for any damages of any kind. MSCI, Morgan Stanley Capital International and the MSCI indexes are services marks of MSCI and its affiliates. The information contained in the Product is intended solely for the recipient and may not be further distributed by the recipient. The Firm accepts no liability whatsoever for the actions of third parties. The Product may provide the addresses of, or contain hyperlinks to, websites. Except to the extent to which the Product refers to website material of the Firm, the Firm has not reviewed the linked site. Equally, except to the extent to which the Product refers to website material of the Firm, the Firm takes no responsibility for, and makes no representations or warranties whatsoever as to, the data and information contained therein. Such address or hyperlink (including addresses or hyperlinks to website material of the Firm) is provided solely for your convenience and information and the content of the linked site does not in anyway form part of this document. Accessing such website or following such link through the Product or the website of the Firm shall be at your own risk and the Firm shall have no liability arising out of, or in connection with, any such referenced website.
ADDITIONAL INFORMATION IS AVAILABLE UPON REQUEST