Embed Size (px)
Citation preview
Industry Best Practicesin Cost Estimatingin Cost Estimating
SM&A
MCR, LLC
U.S. COST
Project Time & Cost IncProject Time & Cost, Inc.
• SM&A (Moderator)• SM&A (Moderator)– Michael R. Nosbisch, Vice President
• MCR LLCMCR, LLC– Neal D. Hulkower, Vice President
• U S CostU.S. Cost– Wade L. Martin, Sr. Vice President
• Project Time & Cost, Inc.Project Time & Cost, Inc.– Kenneth A. Roberts, Executive Vice President
The Panel215 March 2011

Modern Cost Estimating: A Work in Progress
Neal D Hulkower Ph DNeal D. Hulkower, Ph.D.
Vice President, Technical Planning d Q lit S tand Quality Support
MCR, LLC

“S-Curve”
ValuePercentile FY10$M10% 516.8120% 538.9830% 557.85
Cumulative Chart
.750
1.00010,000 Trials
Program Alpha
40% 575.4850% 592.7260% 609.7070% 629.1980% 650.9790% 683 01
.000
.250
.500
462.43 537.16 611.89 686.62 761.35FY10$M
10,000596.40592.72
Statistics ValueTrialsMean*Median* “Density Curve”
Frequency Chart
.015
.02010,000 Trials
Program Alpha
90% 683.01 FY10$M
450.19
Mode ---Standard Deviation* 63.18Range Minimum*Range Maximum* 796.68
.000
.005
.010
462 43 537 16 611 89 686 62 761 35* In FY$10M
What a Cost Estimate Looks Like
462.43 537.16 611.89 686.62 761.35FY10$M
In FY$10M
15 March 2011 4
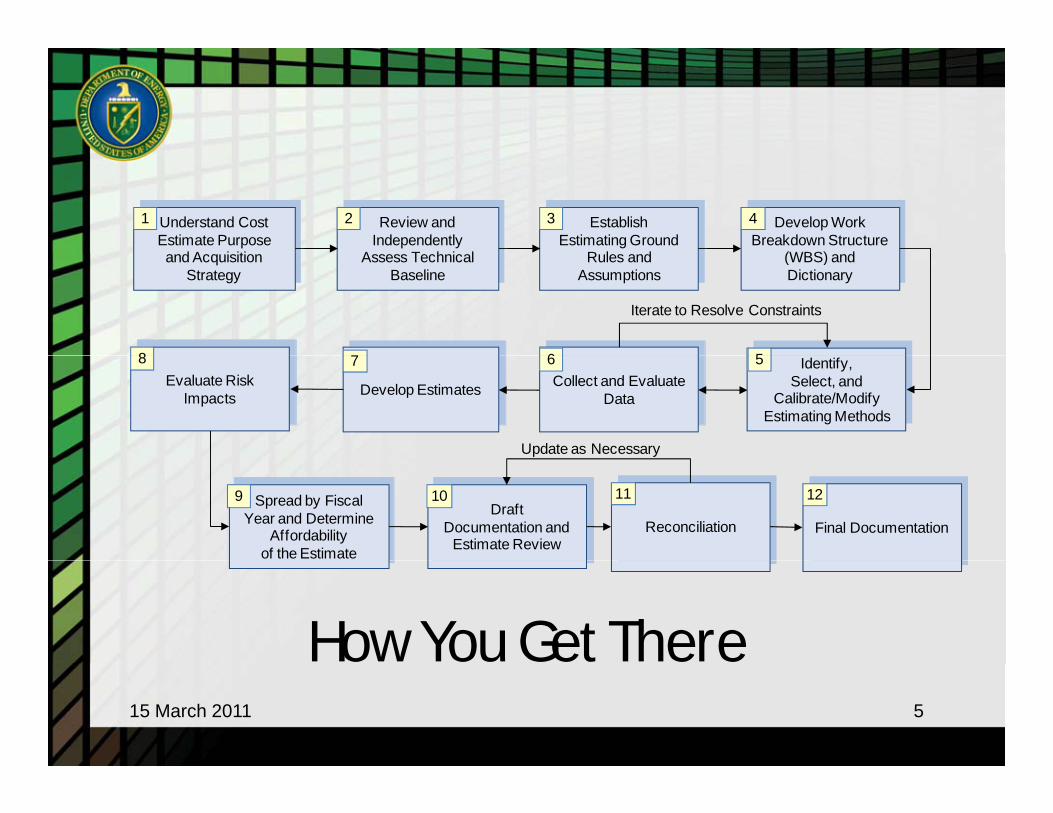
Understand Cost Estimate Purpose
d A i iti
Review and Independently
A T h i l
EstablishEstimating Ground
R l d
Develop Work Breakdown Structure
(WBS) d
1 3 42
Iterate to Resolve Constraints
and Acquisition Strategy
Assess Technical Baseline
Rules and Assumptions
(WBS) and Dictionary
6 578 Identify,Select, and
Calibrate/Modify Estimating Methods
Collect and Evaluate Data
Develop EstimatesDevelop EstimatesEvaluate Risk
Impacts
6 578
Update as Necessary
DraftDocumentation and
Estimate Review
Spread by Fiscal Year and Determine
Affordabilityof the Estimate
9 10
Reconciliation
11
Final Documentation
12
How You Get There515 March 2011
• A cost estimate is not “real” - you cannot• A cost estimate is not real - you cannot observe an estimated cost in the real world
• The cost estimator/analyst must build anThe cost estimator/analyst must build an estimate from the engineers’ model of a yet unrealized programp g
• In other words, every cost estimate is a (model, estimate, incomplete characterization, copy) of a (model, estimate, incomplete characterization, copy) which is
i i t freminiscent of....
Why Cost Estimating is Hard6
y g15 March 2011
715 March 2011

• Fits empirical data• Is shaved by Occam’s RazorIs shaved by Occam s Razor• Is predictive across the broadest set of
inputsinputs• Satisfies an appropriate theory and/or
hil hi l id tiphilosophical consideration
A Good Cost Model815 March 2011

Out In Comments
“Point Estimate” Estimate with associated confidence level
“Point Estimate” is an undefined term. A proper cost estimate must reflect its probabilistic nature.
Arithmetic Summing of Estimates
Statistical Summing of Estimates
Only means of distributions can be arithmetically summed and nothing else!
Ordinary Least Squares (OLS) and Log-OLS
Minimum Percent Error - Zero Percent Bias (MPE-ZPB)
The world is rarely linear and the assumptions for OLS are even more rarely satisfied. Multiplicative error makes more sense for cost estimatesZPB) error makes more sense for cost estimates.
Learning Curves Quantity as an Independent Variable (QAIV)
Learning slope is a significant cost driver but its selection rarely has a solid justification. Let the data dictate adjustment.
Black Box Cost Models Transparent Cost Models
Need information about the programs comprising the data base and form of the equations to bolster confidence in model outputs.
Cost as an Independent V i bl (CAIV)
Reduction of Total O hi C (RTOC)
Cost is a dependent random variable, not i d d RTOC fl
What’s Hot and What’s Not
Variable (CAIV) Ownership Cost (RTOC) independent. RTOC reflects a more comprehensive goal.
915 March 2011

• Impact of Technology Readiness Levels• Joint Cost-Schedule Confidence LevelsJoint Cost Schedule Confidence Levels• Advanced Estimating Relationship
DevelopmentDevelopment• Bringing cost methods to earned value
l ianalysis• Application of voting theory to trade
studiesPushing the State of the Art
10
g15 March 2011
Estimating RiskEstimating Risk
Wade L. Martin, CCC, CVS, LEED AP, , ,Senior Vice President
Construction Cost Management GroupU S COSTU.S. COST
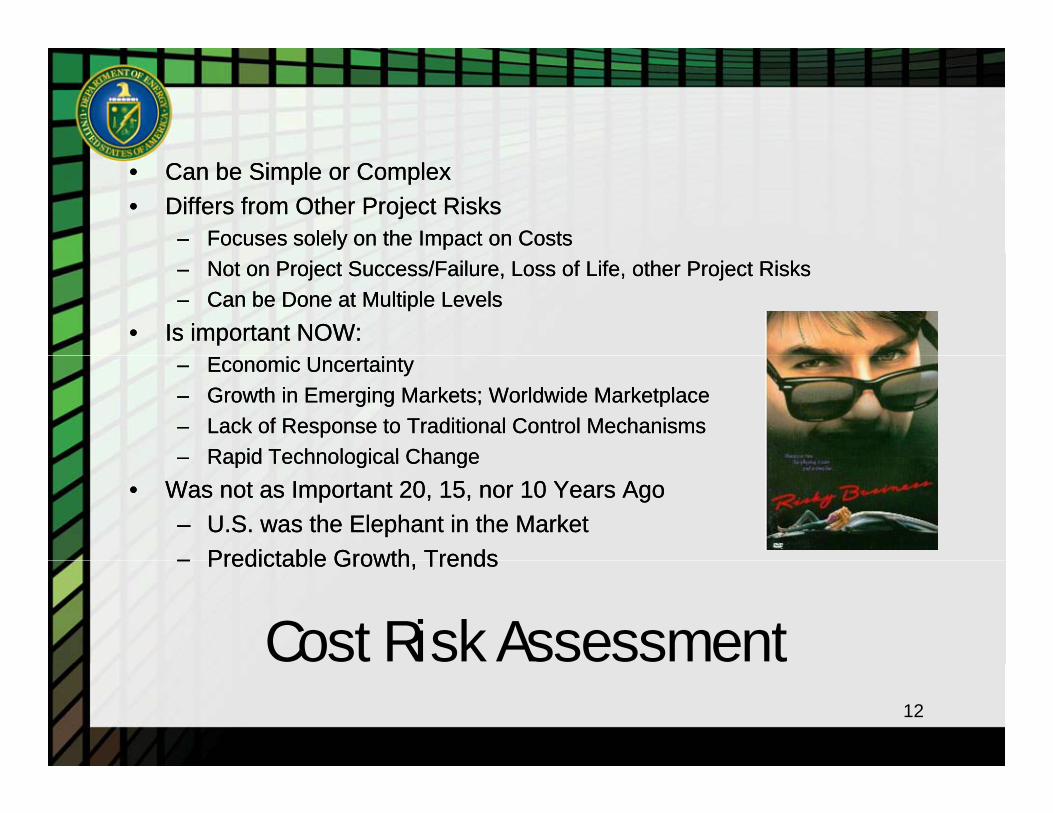
•• Can be Simple or ComplexCan be Simple or Complex•• Differs from Other Project Risks Differs from Other Project Risks
–– Focuses solely on the Impact on CostsFocuses solely on the Impact on Costs–– Not on Project Success/Failure, Loss of Life, other Project Risks Not on Project Success/Failure, Loss of Life, other Project Risks –– Can be Done at Multiple LevelsCan be Done at Multiple Levels
•• Is important NOW:Is important NOW:–– Economic UncertaintyEconomic Uncertainty–– Growth in Emerging Markets; Worldwide MarketplaceGrowth in Emerging Markets; Worldwide Marketplace–– Lack of Response to Traditional Control MechanismsLack of Response to Traditional Control Mechanisms–– Rapid Technological ChangeRapid Technological Change–– Rapid Technological ChangeRapid Technological Change
•• Was not as Important 20, 15, nor 10 Years AgoWas not as Important 20, 15, nor 10 Years Ago–– U.S. was the Elephant in the MarketU.S. was the Elephant in the Market–– Predictable Growth TrendsPredictable Growth Trends–– Predictable Growth, TrendsPredictable Growth, Trends
Cost Risk Assessment12

• Permitting/Permits• Material Availability/Cost • Scope Definition
250
275
300
el
• Labor Rates/Availability• Equipment Availability• Weather/Climate• Delays/Funding Environment• Schedule/Work Restrictions 150
175
200
225
250
Perc
ent
of 1
2/03
Lev
e
Schedule/Work Restrictions• Acquisition Strategy• Bidding Climate• Competing Projects• Fuel Costs
D i M t it
100
125
12/03 12/04 12/05 12/06 12/07
#2 diesel fuel Copper and brass mill shapesConcrete products Steel mill productsGypsum products Consumer price index• Design Maturity
• PM Team – Experience– Qualifications/Certifications– Empowerment
Gypsum products Consumer price index
Typical Cost Risksyp13

Just the Data14
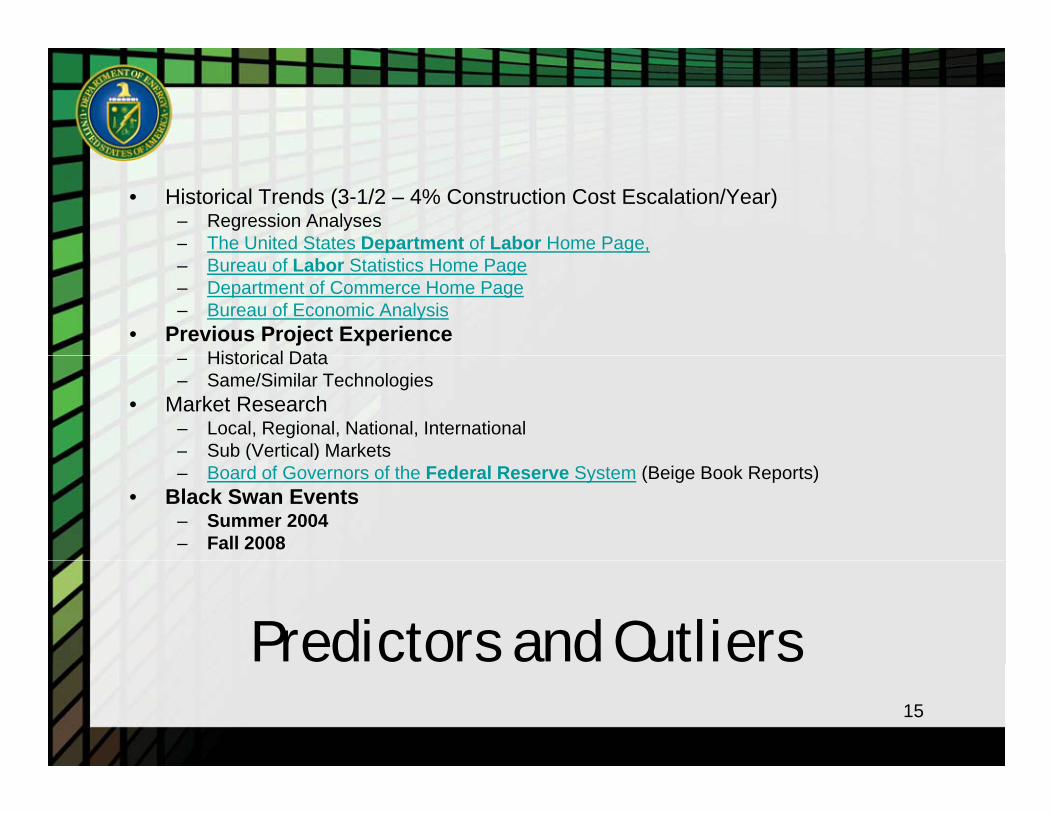
• Historical Trends (3-1/2 – 4% Construction Cost Escalation/Year)– Regression Analyses– The United States Department of Labor Home Page, g– Bureau of Labor Statistics Home Page– Department of Commerce Home Page– Bureau of Economic Analysis
• Previous Project ExperienceHistorical Data– Historical Data
– Same/Similar Technologies • Market Research
– Local, Regional, National, International– Sub (Vertical) Markets( )– Board of Governors of the Federal Reserve System (Beige Book Reports)
• Black Swan Events – Summer 2004– Fall 2008
Predictors and Outliers15

• Project Timeframe and Timing• Longer Timeframe: Less Accuracyg y• Further in the Future: Less Accuracy
• Client Determined Certainty Level• Risk Adverse; Risk AcceptingRisk Adverse; Risk Accepting• Consequences• Unknowns and Unknowable's
Future Predictions16

Independent Cost Estimates and Independent Cost Reviews
Kenneth A. Roberts, PMP CCC
Executive Vice PresidentExecutive Vice President
Project Time & Cost , Inc.

• Purpose: Assure Management that project budgets are adequate prior to p j g q papprovals to proceed/fund
• Required/essential at different projectRequired/essential at different project stages – with different uses:– Validation: Scope Schedule & Cost– Validation: Scope, Schedule & Cost– Negotiation Tool
New Perspective: Thought Catalyst– New Perspective: Thought Catalyst
ICEs & ICRs15 March 2011 18

• Independent Cost Estimate (ICE)– Same Basis as Project Cost Estimate (PCE)Sa e as s as ojec Cos s a e ( C )– Reconcilable with PCE to Facilitate Validation
• Independent Cost Review (ICR)• Independent Cost Review (ICR)– Review/Analyze the PCE
Assess Quality and Accuracy of PCE– Assess Quality and Accuracy of PCE• Examine Approach/Methodology,
Assumptions, etc. ssu p o s, e c
ICE vs. ICR15 March 2011 19

• Project Cost Estimate– Prepared by or Under Authority of Project Team– Should Apply Most Appropriate Methods and
Level of Effort to Assure AccuracyI d d t C t E ti t• Independent Cost Estimate– Prepared by Independent (objective) Party
Typically Shorter Duration/Level of Effort– Typically Shorter Duration/Level of Effort– Level of Detail & Methodologies May Differ – Not Limited to a Point EstimateNot Limited to a Point Estimate
ICE vs. Project Cost Estimate15 March 2011 20
j

• Objective and impartial• No equity or outcome interests• Should possess sufficient institutional
knowledge with minimal learning curveA l ti l ith b d ti ti• Analytical with broad estimating abilities: ability to hone in on critical elements and identify and applyelements and identify and apply appropriate methodology and level of effort
ICE and ICR Team15 March 2011 21
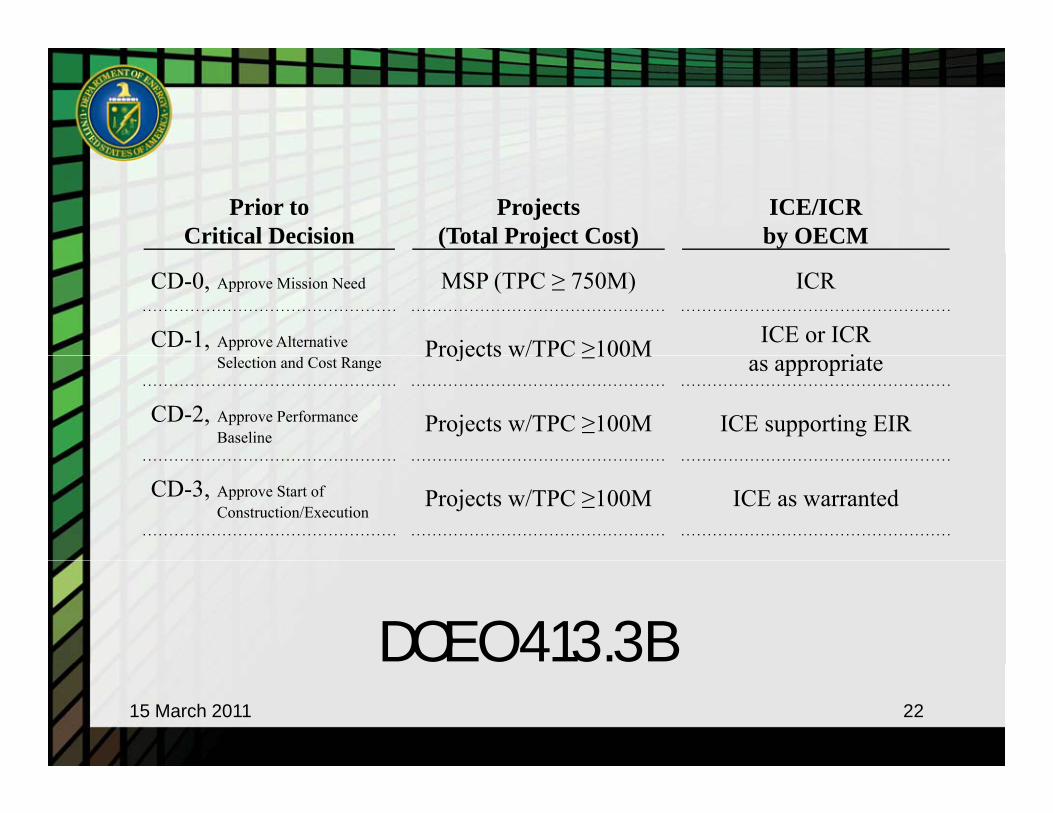
Prior toCritical Decision
Projects(Total Project Cost)
ICE/ICRby OECM
CD-0, Approve Mission Need MSP (TPC ≥ 750M) ICR
CD-1, Approve Alternative Projects w/TPC ≥100M ICE or ICRiSelection and Cost Range
Projects w/TPC ≥100M as appropriate
CD-2, Approve Performance Baseline
Projects w/TPC ≥100M ICE supporting EIR
CD-3, Approve Start of Construction/Execution
Projects w/TPC ≥100M ICE as warranted
DOE O 413.3B15 March 2011 22

• Understand Objectives (Use of ICE/ICR)• Time & Resource ConstraintsTime & Resource Constraints• Prioritize – Pareto Analysis (20/80)
F & F t t F ilit t R ili ti• Form & Format to Facilitate Reconciliation• Estimating Methodologies• Procurement Strategy Implications• Scope Schedule & Cost RisksScope, Schedule & Cost Risks
ICE & ICR Considerations15 March 2011 23