Embed Size (px)
Citation preview

Industrial & Logistics
Market in Georgia |
2019
PREPARED FOR:

2
CONTENTS
Colliers International Georgia
Executive Summary 3
Country Profile 4
International Rankings 6
Economic Overview 7
Free Industrial Zones in Georgia 14
Tbilisi Industrial and Logistics Market Overview 15
Batumi Industrial and Logistics Market Overview 23
Kutaisi Industrial and Logistics Market Overview 28
Poti Industrial and Logistics Market Overview 33
Rustavi Industrial and Logistics Market Overview 37
Construction Cost 38
Conclusion 39
Appendix 1 - Real Estate Registration 40
& Construction Permits
Appendix 2- Primary Information Sources, 44
Data Used for the Study & Definitions
Disclaimer 46
Project Team 47
Colliers at a Glance 48

3
The total volume of industrial and logistics space in Tbilisi,
Batumi, Kutaisi an Poti amounts to approximately 2.5
million sq m, of which 1.16 million sq m is leasable. Tbilisi
is the country’s largest supplier, with 767 K leasable area,
followed by Kutaisi with 230 K, respectively.
The total capacity of the cold storage in the researched
cities amounts to 60,300 sq. m, whereas the share of dry
storage is 95% and accounts for 57 K sq m.
A Class space is in short supply, with just 13,000 sq m
being operated by the Austrian logistics specialist,
Gebrüder Weiss. B and C class storages hold almost the
same share in the total leasable area (around 48%).
In 2018-2019, the overall leasable space grew by 17,000 sq
m, of which 89% was in Tbilisi.
Transportation, together with Food & Beverage,
Construction and Consumer goods are the largest
occupier categories in Tbilisi’s storages, renting at around
67% (111 K sq m) of the total leased area in 2019.
In recent years, Tbilisi has experienced the lowest vacancy
rate in dry storage, at 8%.
The weighted average rent for dry storages in Tbilisi
stands around at USD 3 per sq m in B class, while the
figure in C class accounts for USD 2 per sq m.
The weighted average rent for Georgian cold storage
facilities usually varies between USD 6-18 /ton net of VAT,
depending on the location and quality of the property.
Concerning the regional market, the largest volume of
industrial and logistics space is located in Kutaisi, with the
area of 347 K sq m in 2019. It is followed by Batumi (277 K
sq m) and Poti (132 K sq m). 46% of the total supply in
Poti is represented by Terminals.
The weighted average rent for dry storages in the regional
cities varies between USD 1.8 per sq m – USD 3 per sq m.
In 2019, the overall vacancy rate in Batumi, Kutaisi, and
Poti stands around 30%, 70%, and 17%, respectively. The
significant changes was observed in Batumi, where the
figure has decreased by 10 percentage points.
EXECUTIVE SUMMARY
Colliers International Georgia

4Colliers International Georgia
At the crossroads of Europe and Asia, Georgia
borders Turkey, Armenia, Azerbaijan, and Russia. The
country occupies an area of 69,700 square kilometers
(sq km) and is home to a population of 3.7 million
people. The country’s land borders run a length of
1,839 kilometers (km), while the Black sea coastline is
315 km.
During last two decades, Georgia has implemented
large-scale reforms that have led to political and
economic transformation. It has strengthened its
democracy and furthered its relationship with the
European Union (EU). The Association Agreement
with EU was signed and ratified in 2014. Georgia has
also made business development within the country a
top priority through encouraging entrepreneurship,
attracting private investments, and shifting tax
incentives, thereby positioning itself as an attractive
option to the international business world.
With its unique cultural heritage and exuberant
hospitality, Georgia’s tourism industry continues to
grow and thrive, further bolstering economic growth.
Government
Georgia is a parliamentary republic. Parliamentary
elections are held every four years. In 2018, Georgia’s
parliament relocated to Tbilisi from Kutaisi. It acts as
the representative body for the country, exercising
legislative power and developing domestic and
foreign policy. As an executive council of government
ministers, Georgia’s cabinet is headed by Giorgi
Gakharia, a member of the majority ‘Georgian Dream
Party.’ Based on accountability, citizen participation,
technology, and innovation as its guiding values,
today’s government continues to make European and
Euro-Atlantic integration a primary strategic
objective.
Background
CAPITAL CITY OF GEORGIA TBILISI
OFFICIAL LANGUAGE GEORGIAN
CURRENCY GEORGIAN LARI (GEL)
GDP PER CAPITA, 2019* USD 4,763
REAL GDP GROWTH RATE, 2019 5.1%
UNEMPLOYMENT RATE, 2019 11.6%
AVERAGE MONTHLY SALARY, 2019* USD 567.9
LIFE EXPECTANCY, 2018 74 years
3.7mln 69.7K km2
POPULATION AREA
Source: Geostat (preliminary data)
COUNTRY PROFILE

5Colliers International Georgia
Legal Framework
The Georgian Constitution, adopted in 1995, lays out
the structure of the national government and defines
its authority and function. Georgia’s court system has
three branches: the Courts of First Instance (District or
City Courts), the Appellate Courts, and the Supreme
Court. The Courts of First Instance have jurisdiction
over all civil, criminal, and administrative cases.
Decisions from the Courts of First Instance may be
appealed at the Appellate Courts and further
appealed at the Supreme Court.
As an alternative to litigation, Georgian laws allow
arbitration both in local as well as international
arbitration institutions. Georgia is a member of the
International Centre for Settlement of Investment
Disputes (ICSID). The Public Service Hall in Georgia
provides customers with state services, including
business registration and property registration
through the ‘one-stop-shop’ principle that ensures
efficient service delivery.
Tax Climate
To stimulate investments and boost economic
growth, developing an attractive tax system is one of
the main goals of the Georgian government. With
only six flat-rate taxes (Personal Income Tax – 20%,
VAT – 18%, Profit Tax – 15%, Import Tax – 0%, 5%, or
12%, Excise Tax – on a few selected goods, and
Property Tax – up to 1%) and the Estonian tax model
implemented in 2017 that exempts undistributed
earnings from profit tax, has made Georgia one of
the most competitive places to invest in. Georgia’s
liberal trade regimes include: “Double Taxation
Avoidance” 56 countries and the DCFTA with the EU
(since 2014).
In January 2019, a new pension fund system was
launched in Georgia that is compulsory for every
hired person under the age of 40. For self-employed
people and those above the age of 40, engagement
in the system is optional. The methodology of the
reform is a 2+2+2 scheme, meaning that employer,
employee, and government transfer 2% of the gross
volume of the employee’s income on a personal
account.

6Colliers International Georgia
EASE OF DOING BUSINESS
GLOBAL COMPETITIVENESS INDEX
Source: World Bank, Colliers International
Georgia has improved its status as a free economy
thanks to its fiscal policy, regulatory efficiency, and
open market policies. According to the World Bank’s
Doing Business report 2020, Georgia ranks 7th for
“ease of doing business” among 190 economies, 2nd
for “ease of starting a business”, and 5th for “ease of
registering property”.
In 2019, Fitch Ratings upgraded Georgia's Long-Term
Foreign-Currency Issuer Default Rating from 'BB-' to
'BB' with a stable outlook. As Fitch explains, it was
due to the country maintaining a resilient economy
during the regional shocks in 2018 and adds that
Georgia ranks above the current medians of 'BB'
category peers. Standard & Poor’s also raised
Georgia’s ranking from ‘BB-’ to ‘BB’, while Moody’s
credit rating for Georgia remains at ‘Ba2’.
Registering a new business takes a maximum of two
days and requires no minimum capital requirements.
According to the ‘Heritage Foundation Index of
Economic Freedom 2020,’ Georgia’s economy is
categorized as Mostly Free, ranking 12th across 180
countries.
Georgia remains the least corrupt country in
the region. According to Transparency
International, Georgia is the top performer
among the Eastern European and Central
Asian countries.
Foreign investors in Georgia are guaranteed equal
rights to those of Georgian citizens. After payment of
taxes, foreign investors are entitled to repatriate the
earnings (income) gained from investments and other
funds abroad.
THE WORLD CORRUPTION RANKING
Source: World Bank, Colliers International
Georgia44
Belarus66
Romania70
Bulgaria74
Armenia77 Turkey
91
Moldova120
Ukraine126
Azerbaijan126
Source: World Bank, Colliers International
International Rankings
Property Ownership & Non-agricultural Lands
In Georgia, property rights are recognized and protected by the Law. An owner has the right to possess, use
and dispose of his or her property. The rights of individual owners to possess, use and dispose of land are
regulated by the land legislation. There is no restriction on non-agricultural land ownership in Georgia.
According to the Heritage Foundation Index, Georgia has substantial improvement in property rights in 2020
and is 21% above the world average.

7Colliers International Georgia
Gross Domestic Product
In 2019, according to the preliminary data of Geostat,
the gross domestic product of Georgia reached an
all-time high of GEL 40.4 billion. Despite the political
and economic difficulties at the edge of the 2nd and
3rd quarters of 2019, the real GDP growth reached its
maximum after 2015 at 5.1%, well above the
Caucasus (Russia, Azerbaijan, Armenia, Georgia)
region average of 3.7%.
As of 2019, according to the Ministry of Finance of
Georgia, the ratio of total government debt to
nominal GDP is 40.6%, well below the euro area
average (86.4% - 2019 Q2). During the last eight years
(up to and including 2018), the budget deficit has
remained under 4%. As of 2018, the budget deficit
constitutes only 2.9% of the nominal GDP.
GDP STRUCTURE
13%
Trade
Real Estate
Industry
Transport & Communication
Construction
Agriculture
Public Administration
Financial Activities
Accommodation
Education
Health & Social Work
Other
Source: Geostat, Colliers International
Source: Geostat, Colliers International
GDP AT CONSTANT PRICES BY YEARS (GEL, BLN)
Georgia has recorded the highest
real GDP growth of 5.1% since 2012.
Fast-growing Sectors
Despite the political and economic difficulties at the
edge of the 2nd and 3rd quarters, strong growth in
the professional, scientific and technical activities
(26% YoY), administrative and support activities (20%
YoY) and information and communication (19% YoY),
as well as art and entertainment (19% YoY) sectors
contributed positively to the real GDP growth.
REAL GDP GROWTH (%)
Source: Geostat, Colliers International
Georgia Caucasus
ECONOMIC OVERVIEW
33.9 34.936.6
38.440.4
2015 2016 2017 2018 2019
3.0 2.9
4.8 4.85.1
1.3
0.1
3.53.3
3.7
2015 2016 2017 2018 2019

8Colliers International Georgia
Source: Geostat, Colliers International
Exports
The main exporting partners for the country in 2019
were Russia, Azerbaijan, Armenia, Bulgaria, and
Ukraine. In 2019, based on the preliminary data, total
exports grew by 12% YoY. This figure is significantly
lower compared to the previous years, when the
growth rate was above 20%. The increase in exports
to EU countries was also 12% YoY and represented
22% of the total exports. For CIS countries, it grew by
20% YoY, making up 53% of total exports.
498 497
412
284245
228202
178
132
MAIN EXPORT COUNTRIES, 2019 (MLN,USD)
Azerbaijan
Russia
Armenia
Bulgaria
Ukraine
China
Turkey
Romania
USA
CURRENCY FLUCTUATIONS (LCU vs. USD)
Source: Geostat, Colliers International
Currency Fluctuations
Depreciation and high volatility of the Georgian national currency was one of the main issues of the first half
of 2019, seeing it reach a peak in August when, after the effects of flight ban from Russia were fully realized, 1
USD was exchanged for 2.97 GEL. However, as the negative expectations eventually dissipated following
intervention by the National Bank of Georgia in the FX market, and the fundamental macroeconomic
indicators showed a positive trend, the GEL quickly strengthened and at the end of 2019, 1 USD was traded
for 2.82 GEL.
-20%
0%
20%
40%
60%
80%
100%
2015 2016 2017 2018 2019
The high volatility and depreciation
of the Georgian national currency is
one of the main challenges in recent years.
Azerbaijan Armenia
Georgia TurkeyRussia
Ukraine

9Colliers International Georgia
Unemployment Rate
Georgia’s labor force comprises approximately
1,911,200 people. The unemployment rate is 11.6%,
which is the lowest it has been for more than a
decade. Since 2013, the unemployment rate in urban
areas has declined by approximately 10%; however,
the flat trend in rural areas indicates the fact that the
main cities of Georgia remain the gravitational centre
for businesses and are more attractive places to
invest in. The distribution of hired people in the labor
force for Tbilisi and rest of the country is significantly
different.
Remittances
In 2019, the total number of
remittances amounted to USD 1.73
billion, reflecting a 10% growth
compared to 2018.
The main source markets are Russia (25%), Italy
(14%), Greece (11%), USA (10%), Israel (9%), and
Turkey (6%).
REMITTANCES (USD), 2015-2019
1.08 1.15 1.39 1.58 1.73
7%
20%
14%
10%
0%
5%
10%
15%
20%
25%
0.0
0.5
1.0
1.5
2.0
2015 2016 2017 2018 2019
Billio
n (
USD
)
Remittances Growth y-o-y
Source: National Bank of Georgia, Colliers
International
CONSUMER PRICE INDEX (INFLATION, %)
Source: Geostat, Colliers International
Headline Inflation Core Inflation
Inflation
The annual inflation rate in 2019 was 4.2% (IMF
estimate). The main source of inflationary pressure on
prices was the depreciation of the nominal currency.
As a result, the monetary committee of the central
bank raised the monetary policy rate from 6.5%
(September) to 9.0% (December). It is expected that
during the year, the refinancing rate will decrease as
mid-term inflation expectations become positive.
14.1% 14.0% 13.9%12.7%
11.6%
2015 2016 2017 2018 2019
UNEMPLOYMENT RATE IN GEORGIA (%)
Source: Geostat, Colliers International
3.9
6.1 6.06.4
4.3
2.52.8
2.3 2.2
4.14.6
6.96.4
2.83.3
4.3 4.4
3.0
1.81.4
1.7 1.7
3.6 3.4
4.74.4
Jan 2017 Apr 2017 Jul 2017 Oct 2017 Jan 2018 Apr 2018 Jul 2018 Oct 2018 Jan 2019 Apr 2019 Jul 2019 Oct 2019 Jan 2020

10Colliers International Georgia
According to the preliminary estimates of Geostat, in
2019, the volume of FDI increased by a modest 0.2%
(amounting to USD 1,268 million) compared to the
previous year, while dramatically decreased compared
to 2017.. Among the reasons for the decline may be
the completion of magistral gas pipeline project, the
transfer of several enterprises to the ownership of
Georgian residents, as well as the reduction of non-
resident direct investors liabilities.
The United Kingdom, Turkey, and Ireland were the
main investors, with shares of 19.5%, 18.7%, and
10.5%, respectively. As for the sectoral distribution,
20.6% of total FDI was invested in the financial sector,
while the second and the third were the energy and
manufacturing sectors with 15.4% and 13.4%,
respectively.
In 2019, unlike other sectors, FDI in real estate
experienced a significant decrease and recorded a
negative figure. The first quarter of 2019 was
particularly remarkable in terms of decline as the
number stood at USD -125 million. The most likely
reason for such a sharp decline in 2019 was the fact
that companies moved to ownership by residents,
from non-residents.
FDI BY SECTORS (MLN, USD)
FOREIGN DIRECT INVESTMENT (FDI)
262
194
171158
118 117
14 14 -32
253
Financial
Energy
Mining & Manufacturing
Hotels & Restaurants
Construction
Transport & Communication
Health & Social Work
Agriculture
Real Estate
Other
1,7291,650
1,963
1,265 1,268
2015 2016 2017 2018 2019
FDI INFLOWS BY YEARS (MLN, USD)
Source: Geostat, Colliers International
Source: Geostat, Colliers International
In 2019, Financial, Energy &
Manufacturing were the key sectors
that attracted around 50% of total
FDI. In 2020-23, around USD 1 billion
is expected to be invested in the
construction of hydroelectric power
stations.

11Colliers International Georgia
While already contributing roughly 9% to the country’s Gross Domestic Product (GDP), Georgia’s manufacturing sector is poised to provide further significant investment opportunities. Greenfield investments are expected to rise in the export-oriented manufacturing sectors, for which access to the European market would be attractive. Together with international and local experts, Georgia’s government is performing a deep analysis of the competitive sectors, and seeking new ways to stimulate foreign investment, attract new technology and know-how, and create high value-add production in the country.
From the transport and logistics perspective, Georgia can serve as a gateway for foreign companies interested in the Caucasus/CIS region due to its geographic location and open business environment. Georgia is uniquely positioned to capitalize on the increasing trade flows between Europe, the Caspian Region, Central Asia, and China. With a transport system that functions as a key link in the historic “Silk Road,” it offers the shortest route between the Black and Caspian seas.
In October 2017, leaders of Georgia, Azerbaijan, and Turkey officially opened the Baku-Tbilisi-Kars (BTK) railway as a part of Iron Silk Road project. The 826-kilometer (km) / 513-mile line has the capacity to transport one million passengers and 6.5 million tons of freight per year. The project will deepen trade relations between Georgia and China, making the country a primary link between Europe and Asia. Additionally, the government is investing heavily in road infrastructure, including highways and local roads. It is believed that long-term growth will stem from Georgia’s role as a transit state for pipelines. Three pipelines currently exist:
• The Baku-Supsa pipeline;
• The Baku-Tbilisi-Ceyhan oil pipeline;
• The South Caucasus pipeline (operated by BP).
Georgia has 1,603 km of international roads, 5,298 km of internal state roads, and 2,084 km of railway lines. Construction of Georgia’s central highway is one of the top priorities in the government’s infrastructure rehabilitation program. Since 2005, most of the country’s significant roads for international trade have been upgraded or are now under reconstruction.
Poti Sea Port is the largest port in Georgia. Currently serving as the European gateway for international trade in Georgia, Armenia, and Azerbaijan, it is ideally located to become a future hub for trade with central Asia. Together with the Georgian government, the Chinese conglomerate CEFC China Energy group recently signed a cooperative agreement regarding the construction of a Common Market Zone in Poti that will actively promote the export of advanced technologies, production capacity, and products from China to countries in the Eurasian region, and build a new Eurasian land bridge that will function as an economic corridor between China, Central Asia, and Western Asia.
Georgia’s five airports are located in various regions, with the largest - operated by TAV Airports - in Tbilisi. The Ambrolauri airport opened in December 2016; it serves smaller aircraft with a 30-50 passenger capacity. Georgia’s additional airports are in Batumi, Mestia, and Kutaisi.
A recent governmental initiative regarding the establishment of logistic centres in Tbilisi and Kutaisi created substantial interest from investors. Along with several Georgian companies, applications from companies registered in China, Switzerland, Turkey, and others were received. The anticipated development of infrastructure and manufacturing in Georgia, combined with its increasingly recognized strategic location at the crossroads of Europe and Asia, will open up opportunities for modern industrial and logistics real estate investments.
TRANSPORT & LOGISTICS INFRASTRUCTURE
AMBROLAURI
5AIRPORTS RAILWAY
2,084km
1,603km
INTERNATIONAL
ROADS
5,298km
INTERNAL
STATE ROADS

12Colliers International Georgia
Georgia’s economic sectors are exposed to the crisis on different scales.
The Hotels, Food & Beverage and Entertainment sectors are highly
exposed; however, in total, their share in the GDP amounts to 10%. Trade
(14%) and Construction & Development (8.6%) have a relatively larger
share in the GDP, yet both fall into the category of highly exposed sectors.
Covid-19 Effects & Economic Outlook
Source: Geostat, Colliers International
Wholesale & Retail Trade
14.4%
Real Estate
Activities
11.5%
Manufacturing
10.1%
Construction
8.6%
Agricalture, Forestry
& Fishery
7.2%
Public Administration &
Defence
6.8%
Transportation &
Storage
6.5%
Financial & Insurance Activities
5.4%
Accommodation &
Food Service Activities
4.8%
Education
4.5%
Health & Social Work
Activities
4.3%
Arts, Entertainment &
Recreation
3.2%
Information &
Communication
3.0%
Professional, Scientific &
Technical Services
2.9%
Other Sectors
6.7%
GROSS DOMESTIC PRODUCT, COVID-19 IMPACT ON SECTORS (2019)
Very Exposed Exposed Partially Exposed
Neutral/Limited Impact More positive, than negative
Exposure Of Economic Sectors Towards Covid-19

13Colliers International Georgia
The Influence of Covid-19 on Foreign Direct Investments
LARGEST DIRECT INVESTOR COUNTRIES
(USD,MILLIONS), 2019*
UNITED KINGDOM 247.8
TURKEY236.5
132.7IRELAND
USA 99.0
PANAMA 78.1 NETHERLANDS 52.9
CHINA 50.5RUSSIA 40.4
39.2JAPAN
Source: Geostat, Colliers International
According to the national statistics
office, in 2019 the foreign direct
investments (FDI) slightly increased by
0.2% and amounted to USD 1,267.7
million. Around 50% of the
investments are coming in from the
UK, Turkey and Ireland (preliminary
data, Geostat). The way these
countries tackle the spread of Novel
Coronavirus, and their investing
strategy, will be critical for the inflow
of future investment in Georgia.
The crisis of 2008-2009 had a
negative impact on direct foreign
investment inflows in Georgia,
recording a 60% decrease compared
to the previous year.
Agriculture,
Forestry and
Fishing
1.1%
Mining &
Quarrying
5.4%
Manufacturing
8.1%
Electricity, Gas,
Steam and Air
Conditioning
Supply
15.3%
Construction
9.3%
Hotels and
Restaurants
12.4%
Transport and
Communications
9.2%
Financial
Sector
20.6%
Other Sectors
18.5%
FOREIGN DIRECT INVESTMENT BY LARGEST
SECTORS IN THE ECONOMY, 2019*
Very Exposed Exposed Partially Exposed Neutral Other
Note: *Preliminary data
Source: Geostat, Colliers International
In 2019, (preliminary data)
investments were made in the
given sectors: Finance (20.6%),
Electricity, Gas, Steam and Air
Conditioning supply (15.3%),
and Hotels & Restaurants
(12.4%). Hotels & Restaurants
and Construction sectors fall
into the very exposed and
exposed category, respectively.
In the period of isolation, it is
expected that investments in
Hotels & Restaurants and
Construction sectors will
dramatically decrease.

The Georgian government adopted a law that provides for the establishment of Free Industrial Zones (FIZ) in strategic locations of the country. Companies operating in a FIZ are not subject to import and export duties, corporate profit tax, dividends, VAT, or property taxes. The only tax levied on companies within a FIZ is a 4% import/export duty on the transactions between the zone and mainland Georgia. Georgian legislation does not impose restrictions regarding foreign ownership of companies. Therefore, any legal and natural person, resident or foreigner, is allowed to register a company in the country.
Four Free Industrial Zones operate in three Georgian cities: the Tbilisi Free Industrial Zone, the Kutaisi Free Industrial Zone, the Hualing Free Industrial Zone (in Kutaisi), and the Poti Free Industrial Zone.
The Kutaisi FIZ, established in 2009 in Georgia’s second largest city, was the country’s first tax-free territory. Its largest tenant is Fresh Georgia, producing home appliances in several factories. The FIZ covers 27 hectares of land and is currently operated by the Georgian International Holding Company.
The Hualing Free Industrial Zone was created in 2015 by Hualing Group, which supplies the market with 25,000 sq m of dry storage space. The Hualing FIZ specializes in wood and stone processing, metal construction, and furniture and mattress production. Leasable Warehouse space amounts to 25,000 sq m.
The Free Industrial Zone in Poti was founded in 2010. This FIZ was operated by Rakia Georgia FIZ LLC until the end of 2017. Starting in 2018, the Poti FIZ will be operated by CEFC China Energy group, a large Chinese conglomerate. The total warehouse space in Poti FIZ is around 7,000 sq m.
In November 2015, Tbilisi’s Free Industrial Zone was developed by the BitFury Group, who have retained ownership. The company has already launched a mega data centre (6,000 sq m) in the Tbilisi Free Zone (TFZ). The territory’s 170,000 sq m is divided into 28 individual plots that can be leased separately or collectively for up to 50 years. As the TFZ becomes more established, it will facilitate further development of Tbilisi’s warehouse and industrial market.
There are around 10 K industrial properties in Georgia. Approximately 3,000 of them are located in Tbilisi, 700 in Kutaisi, 550 in Batumi, 100 in Poti, and 350 in Rustavi. The industrial sector is not commercially developed in Georgia, meaning that the majority of industrial properties are owner-occupied, where owners carry out the production process themselves. Commercial industrial real estate consists of warehouse properties that are leasable and may also be used for industrial activities. Therefore, the main subject of research is warehouse properties.
Colliers International Georgia 14
Georgian
International
HoldingOp
era
tor
27ha
Land plot with
total size of
KUTAISI FREE
INDUSTRIAL ZONE
CEFC
China
EnergyOp
era
tor
7k
Warehouse space
with total size of
POTI FREE
INDUSTRIAL ZONE
Hualing
GroupO
pera
tor
25k
Warehouse space
with total size of
HUALING FREE
INDUSTRIAL ZONE
BitFury
Group
Op
era
tor
170k
land plots with
total size of
TBILISI FREE
INDUSTRIAL ZONE
Georgian Laws Regarding Free Industrial Zones
Taxes in Free Industrial Zones
1. Issues related to taxes in free industrial zone shall be regulated by the Tax and Customs Codes of Georgia.
2. Profit taxes shall not apply only to those enterprises in free industrial zone that are granted the status of international enterprise under
the Georgian Tax Code.
3. Import of foreign goods into free industrial zone shall be exempt from any value-added tax.
4. Operations carried out in free industrial zone shall be exempt from any value-added tax.
5. Property in free industrial zone shall be exempt from property taxes.
6. The import of foreign goods into free industrial zone shall be exempted from customs duties.
7. The import of goods produced in free industrial zone from an industrial free zone to another Georgian territory (beyond the industrial
free zone) shall be exempt from customs duties.
8. Employees shall pay income taxes in free industrial zone based on income declaration.
FREE INDUSTRIAL ZONES IN GEORGIA

Industrial &
Logistics Market
Overview | Tbilisi
Photo: Gebruder Weiss Tbilisi
Colliers International Georgia 16
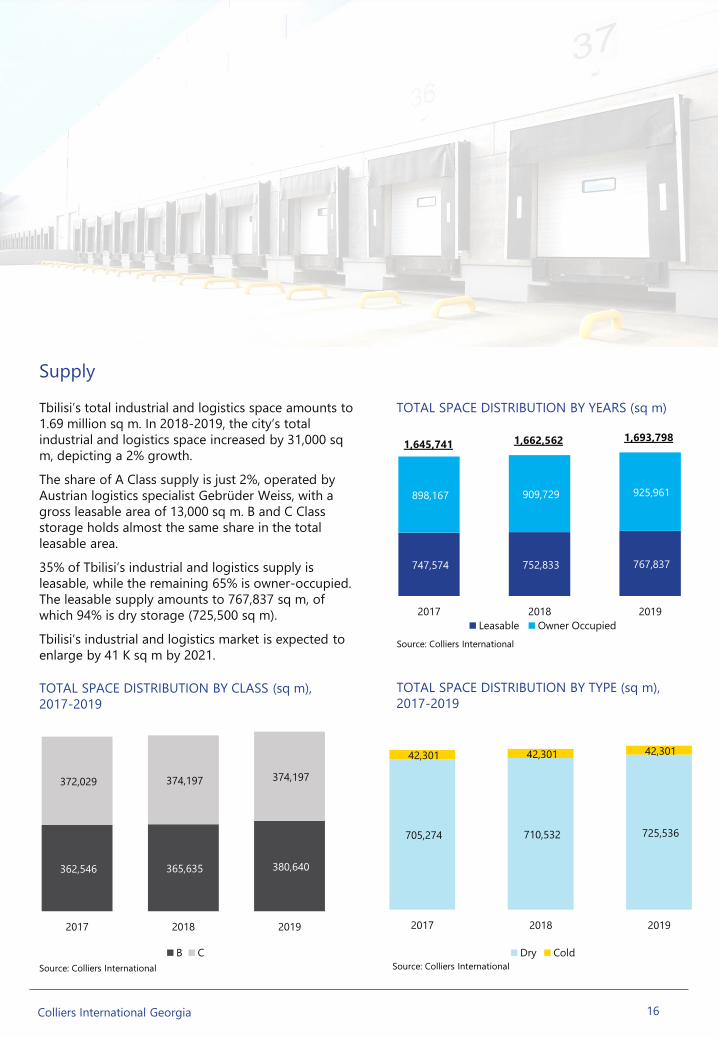
Tbilisi’s total industrial and logistics space amounts to
1.69 million sq m. In 2018-2019, the city’s total
industrial and logistics space increased by 31,000 sq
m, depicting a 2% growth.
The share of A Class supply is just 2%, operated by
Austrian logistics specialist Gebrüder Weiss, with a
gross leasable area of 13,000 sq m. B and C Class
storage holds almost the same share in the total
leasable area.
35% of Tbilisi’s industrial and logistics supply is
leasable, while the remaining 65% is owner-occupied.
The leasable supply amounts to 767,837 sq m, of
which 94% is dry storage (725,500 sq m).
Tbilisi’s industrial and logistics market is expected to
enlarge by 41 K sq m by 2021.
Supply
TOTAL SPACE DISTRIBUTION BY YEARS (sq m)
362,546 365,635 380,640
372,029 374,197 374,197
2017 2018 2019
B C
TOTAL SPACE DISTRIBUTION BY CLASS (sq m),
2017-2019
705,274 710,532 725,536
42,301 42,301 42,301
2017 2018 2019
Dry Cold
TOTAL SPACE DISTRIBUTION BY TYPE (sq m),
2017-2019
747,574 752,833 767,837
898,167 909,729 925,961
2017 2018 2019
Leasable Owner Occupied
Source: Colliers International
1,645,741 1,662,562 1,693,798
Source: Colliers InternationalSource: Colliers International

Colliers International Georgia 17
Main Market Players (Leasable Industrial and Logistics Spaces )
Map of Existing & Upcoming Industrial Properties
# Operator District GLA (sq m) Class Type
1 Gebruder Weiss Lilo 13,000 A Dry
2 Lilo 1 Lilo 61,500 B Dry
3 Tbilabreshumi Nadzaladevi 60,000 B Dry
4 Smart Warehouse Didube 40,000 C Dry
5 Maudi Didube 38,000 C Dry
6 GLS Samgori 25,000 B Dry
7 OGT Didi Dighomi 24,345 C Dry
8 Bom Terano Didube 17,500 B Dry
9 Saqinvesti Didube 20,000 B Dry
10 LC Tbilisi Samgori 17,000 B Dry
11 Trialeti Avchala 10,812 B Dry
12 Smart Warehouse Village Dighomi 10,000 B Dry
13 Iceberg Tbilisi Avchala 6,300 B Dry
Colliers International Georgia 18
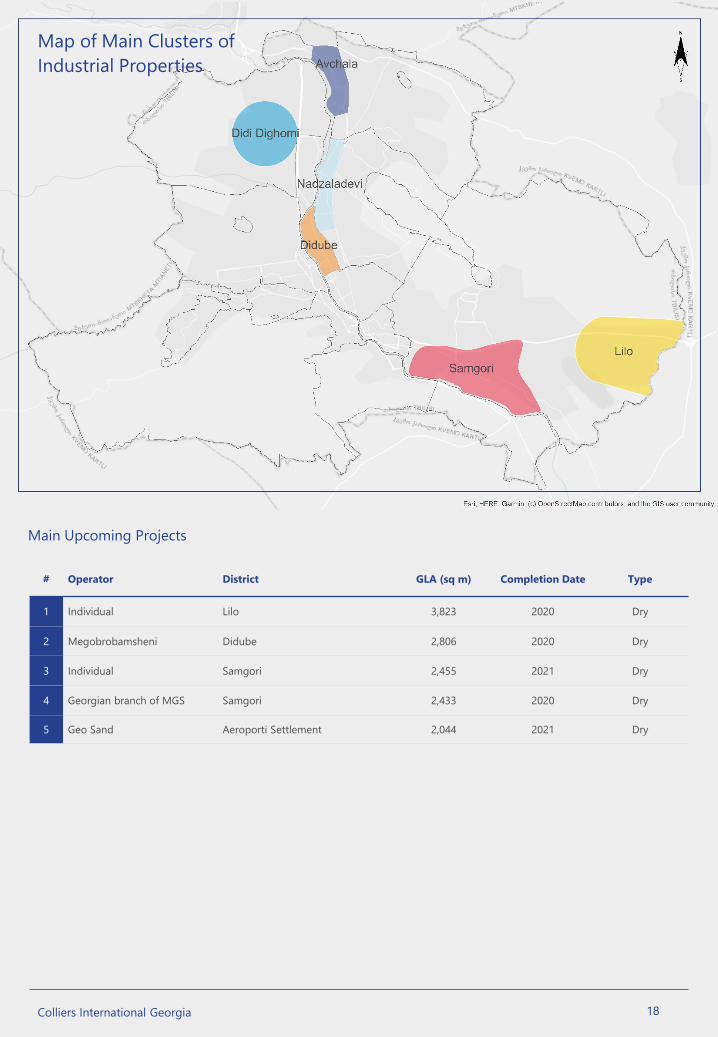
Main Upcoming Projects
# Operator District GLA (sq m) Completion Date Type
1 Individual Lilo 3,823 2020 Dry
2 Megobrobamsheni Didube 2,806 2020 Dry
3 Individual Samgori 2,455 2021 Dry
4 Georgian branch of MGS Samgori 2,433 2020 Dry
5 Geo Sand Aeroporti Settlement 2,044 2021 Dry
Map of Main Clusters of
Industrial Properties

Colliers International Georgia 19
Furniture Production
Food & Beverage
Building MaterialsMap of Main Category Clusters
of Industrial Properties

Colliers International Georgia 20
In recent years, transportation has been the
largest occupier category, renting at around
24% of the total leased area in 2019. The
share of this category in the tenant
distribution mix increased by 6 percentage
points in 2018-2019.
Food & Beverage is the second largest
category, occupying 16% of the leased area,
and primarily represented by local and
international supermarket chains,
wholesalers.
The third main category is Construction,
holding a 16% of the leased space.
In 2019, the Service category share grew by
4 percentage points, while the figure for
Electronics declined by the same amount.
Demand
TENANT DISTRIBUTION MIX BY CATEGORY,
2017-2019
20% 18%24%
17%16%
16%
10% 13%
16%
14% 13%
12%5% 5%
9%7% 6%
6%12%10%
5%4%
7%3%
1% 2%2%
10% 11% 9%
2017 2018 2019
Transportation & Logistics
Food & Beverage
Construction
Consumer goods
Service
Autoparts
Pharmacy
Electronics
Alcohol & Tobacco
Other
Source: Colliers International

Colliers International Georgia 21
Performance Indicators
WEIGHTED AVERAGE RENT IN DRY STORAGE,
2017-2019 (USD, sq m)
13.2
11.7 10.9
2017 2018 2019
WEIGHTED AVERAGE RENT IN COLD STORAGE
(USD, TON)
Weighted Average Rent
Since 2017, the overall weighted average rent
has seen a declining trend in both dry and cold
storage. The figure has decreased in both B
and C Class properties: a 6.4% and 4.7% drop,
respectively.
In 2019, a 6.8% decline was seen in cold
storage properties when compared to the
previous year. If compare to 2017, a significant
(17.4%) decline is observed in the weighted
average rent.
In the majority of leasable industrial and
logistics spaces tenants do not pay additional
fixed costs for the service and utility. Each of
them have their own power meters and pay
according to the consumed resources. In some
cases, landlords of the cold storages offer
cargo loading-unloading service to their
consumers. The price for this service varies
between USD 5-10 per ton.
Vacancy Rate
The vacancy rate in both cold and dry storage
decreased in 2019. Compared to 2018, the rate
fell by 11 percentage points in cold storage,
while an insignificant 2 percentage point
decrease was observed in dry storage.
The same picture is seen in the vacancy rates
by class. When compared with 2017, the figure
in dry storage dropped by 10 percentage
points in B Class, and by 12 percentage points
in C Class.
VACANCY RATE BY TYPE, 2017-2019 VACANCY RATE BY CLASS IN DRY STORAGES,
2017-2019
3.1
2.1
2.9
2.0
2.9
2.0
B Class C Class
2017 2018 2019
34%
16%
30%
10%
19%
8%
Cold Dry
2017 2018 2019
17%
21%
12%
6%7%
9%
B Class C Class
2017 2018 2019
Source: NAPR, Colliers International
Source: NAPR, Colliers International
Source: Colliers InternationalSource: Colliers International
Colliers International Georgia 22
Benchmarking
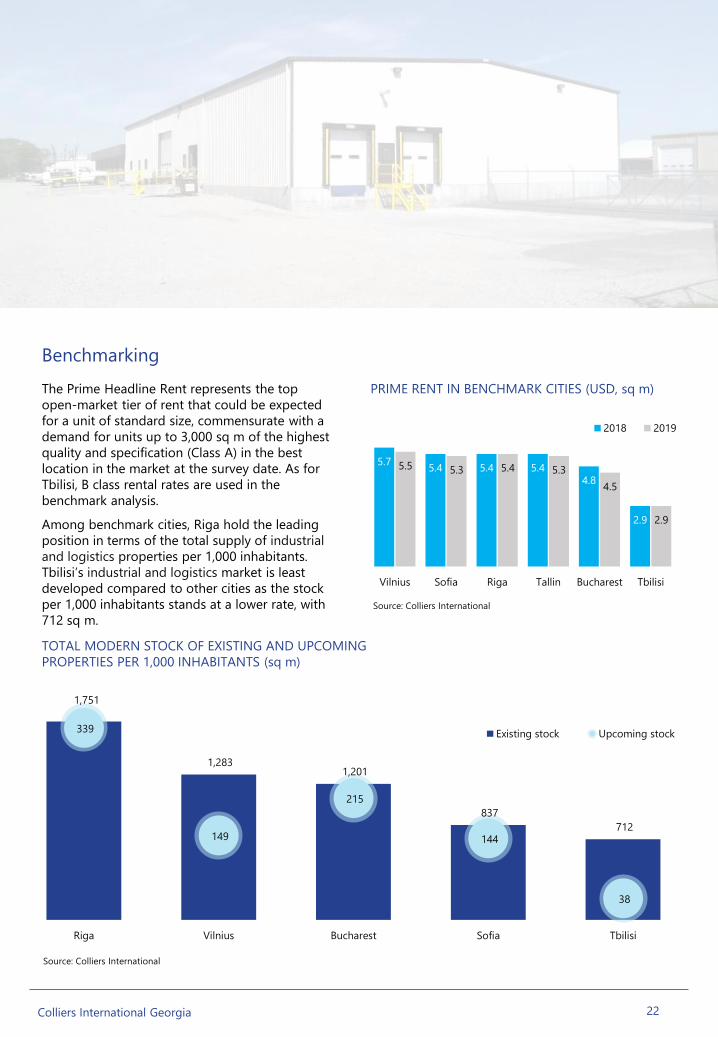
PRIME RENT IN BENCHMARK CITIES (USD, sq m)The Prime Headline Rent represents the top
open-market tier of rent that could be expected
for a unit of standard size, commensurate with a
demand for units up to 3,000 sq m of the highest
quality and specification (Class A) in the best
location in the market at the survey date. As for
Tbilisi, B class rental rates are used in the
benchmark analysis.
Among benchmark cities, Riga hold the leading
position in terms of the total supply of industrial
and logistics properties per 1,000 inhabitants.
Tbilisi’s industrial and logistics market is least
developed compared to other cities as the stock
per 1,000 inhabitants stands at a lower rate, with
712 sq m.
Source: Colliers International
TOTAL MODERN STOCK OF EXISTING AND UPCOMING
PROPERTIES PER 1,000 INHABITANTS (sq m)
5.75.4 5.4 5.4
4.8
2.9
5.5 5.3 5.4 5.3
4.5
2.9
Vilnius Sofia Riga Tallin Bucharest Tbilisi
2018 2019
1,751
1,283 1,201
837
712
339
149
215
144
38
Riga Vilnius Bucharest Sofia Tbilisi
Existing stock Upcoming stock
Source: Colliers International

Photo: Batumi Sea Port
Industrial &
Logistics Market
Overview | Batumi

Colliers International Georgia 24
Supply
The total amount of industrial and logistics space in
Batumi equates to 132,651 sq m, of which 46% is
leasable. The majority of facilities in Batumi are old,
Soviet-era buildings, some of which have recently
been renovated.
In 2018-2019, Batumi’s total space of storages grew
by 5 000 sq m, which was reflected by an increased
supply of leasable and owner-occupied area.
The vast majority of Batumi’s industrial and logistics
supply is dry storage space, while cold storage
represents an inconsiderable share of the leasable
supply. B Class supply remains stable, whereas C Class
space grew by 1 700 sq m in 2019.
Several warehouse projects are under construction in
Batumi. In 2019, the supply of industrial and logistics
increased by 2,500 sq m, while in 2020, another 7,700
sq m will be added.
TOTAL SPACE DISTRIBUTION BY YEARS (sq m)
TOTAL SPACE DISTRIBUTION IN DRY
STORAGES BY CLASS, 2017-2019 (sq m)
124,271 127,316 129,038
143,668 145,282 148,891
2017 2018 2019
Leasable Owner Occupied
52,242 52,242 52,242
72,029 75,074 76,796
2017 2018 2019
B Class C Class
267,939 272,598 277,929 285,589 285,589
2017 2018 2019 2020 2021
EXISTING & UPCOMING SUPPLY BY
YEARS (sq m)
Existing Upcoming
Source: Colliers International
Source: Colliers InternationalSource: Colliers International

Colliers International Georgia 25
# Operator Location GLA (sq m) ClassConstruction
Status
Completion
Date
1 Maxima 71 Khakhuli II turn 3,500 B Ongoing 2020
2 Lideri-2015 I Lane Oltisi Street, 8A-10 1,400 B Ongoing 2020
3 Sakartvelo 255B Airport Highway 2,400 B Ongoing 2020
Upcoming Projects
# Operator Location GLA (sq m) Class Type
1Batumi Housebulding
Combinant302 Khalvashi Street 22,838 B Dry
2 Buka LLC 1 Chkhaidze Street 12,330 C Dry
3 Star Ar Ge 16a General Abashidze Street 11,059 B Dry
4 Imperial 2,000 133 Bagrationi Street 6,000 B Dry
5 Anagi 18 General Abashidze Street 5,086 B Cold
6 Georgian Logistics Company 1 Lermontovi Dead End 3,100 B Dry
Main Market Players
Map of Existing & Upcoming Industrial Properties

Colliers International Georgia 26
Weighted Average Rent
In 2019, the weighted average rent decreased
industrial and logistics spaces. The figure
stood at USD 2 per sq m in 2018, and
dropped to USD 1.9 per sq m, reflecting a 5%
decrease.
In the majority of industrial and logistics
tenants do not pay additional fixed costs for
the service and utility. Each of them have
their own power meters and pay according to
consumed resources.
Vacancy Rate
In 2019, the overall vacancy rate in Batumi’s
dry industrial and logistics increased
significantly, by 10 percentage points: up
from 30% in 2018 to 40% in 2019.
The B Class vacancy rate dropped by 13
percentage points in 2019, while in C Class, a
slight 2 percentage points decline was seen, a
figure accounting for 40% in 2019.
WEIGHTED AVERAGE RENT BY YEARS (USD, sq m)
VACANCY RATE BY CLASS
39%42%
26%
40%
B Class C Class
2018 2019
Source: Colliers International
Source: NAPR, Colliers International
1.8 2.0 1.9
2017 2018 2019
Performance Indicators

Colliers International Georgia 27
Major part of industrial properties in Batumi is owner occupied. Demand is dominated by producers of building materials and furniture. Average rent of industrial space ranges between USD 2 - USD 5 per sq mbased on space condition and existence of production machinery in the property.
Furniture Production
Food & Beverage
Building Materials
Map of Main Clusters of
Industrial Properties

Photo: Hualing Free Industrial Zone in Kutaisi
Industrial &
Logistics Market
Overview | Kutaisi
Colliers International Georgia 29
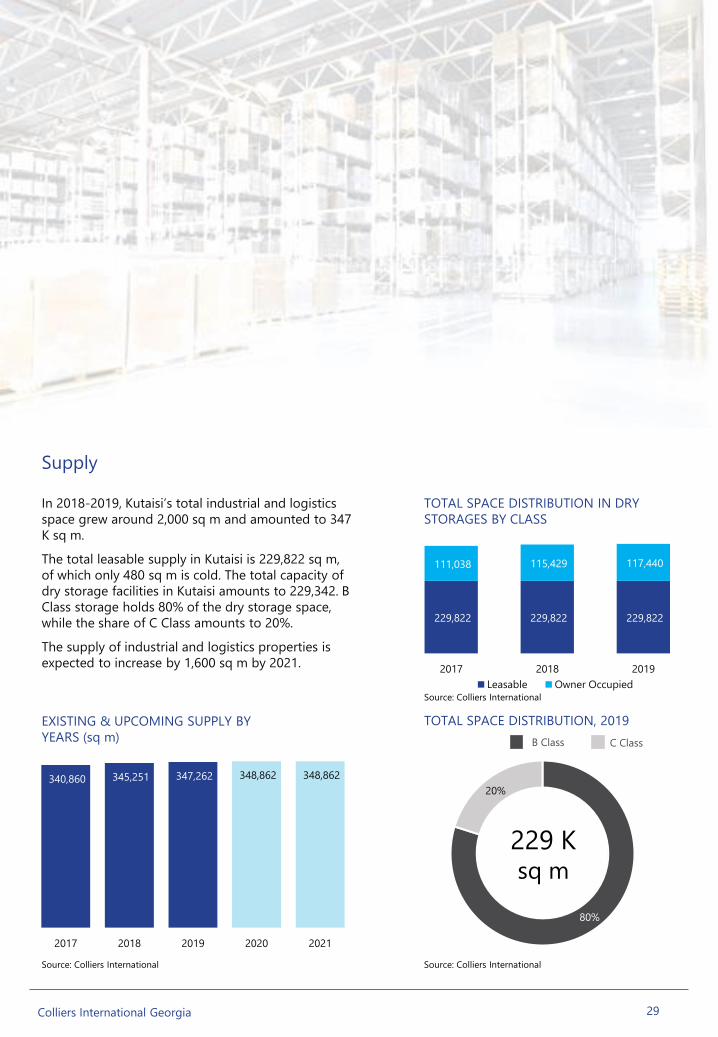
Supply
In 2018-2019, Kutaisi’s total industrial and logistics
space grew around 2,000 sq m and amounted to 347
K sq m.
The total leasable supply in Kutaisi is 229,822 sq m,
of which only 480 sq m is cold. The total capacity of
dry storage facilities in Kutaisi amounts to 229,342. B
Class storage holds 80% of the dry storage space,
while the share of C Class amounts to 20%.
The supply of industrial and logistics properties is
expected to increase by 1,600 sq m by 2021.
TOTAL SPACE DISTRIBUTION, 2019
229,822 229,822 229,822
111,038 115,429 117,440
2017 2018 2019
Leasable Owner Occupied
80%
20%
TOTAL SPACE DISTRIBUTION IN DRY
STORAGES BY CLASS
229 Ksq m
B Class C Class
340,860 345,251 347,262 348,862 348,862
2017 2018 2019 2020 2021
EXISTING & UPCOMING SUPPLY BY
YEARS (sq m)
Source: Colliers International Source: Colliers International
Source: Colliers International

Colliers International Georgia 30
# Operator District GLA (sq m) Class Type
1Georgian International
Holding Kutaisi Free Industrial Zone 120,000 B Dry
2 Hualing Group Kutaisi Free Industrial Zone 25,000 B Dry
3 Mirage 3 9 Aprili Street 15,277 C Dry
4 Individual 186 Tsereteli Street 10,000 B Mixed
5 Green Flower 1950 14 Orkhelashvili Street 10,000 B Dry
Main Market Players
Map of Existing & Upcoming Industrial Properties
Colliers International Georgia 31
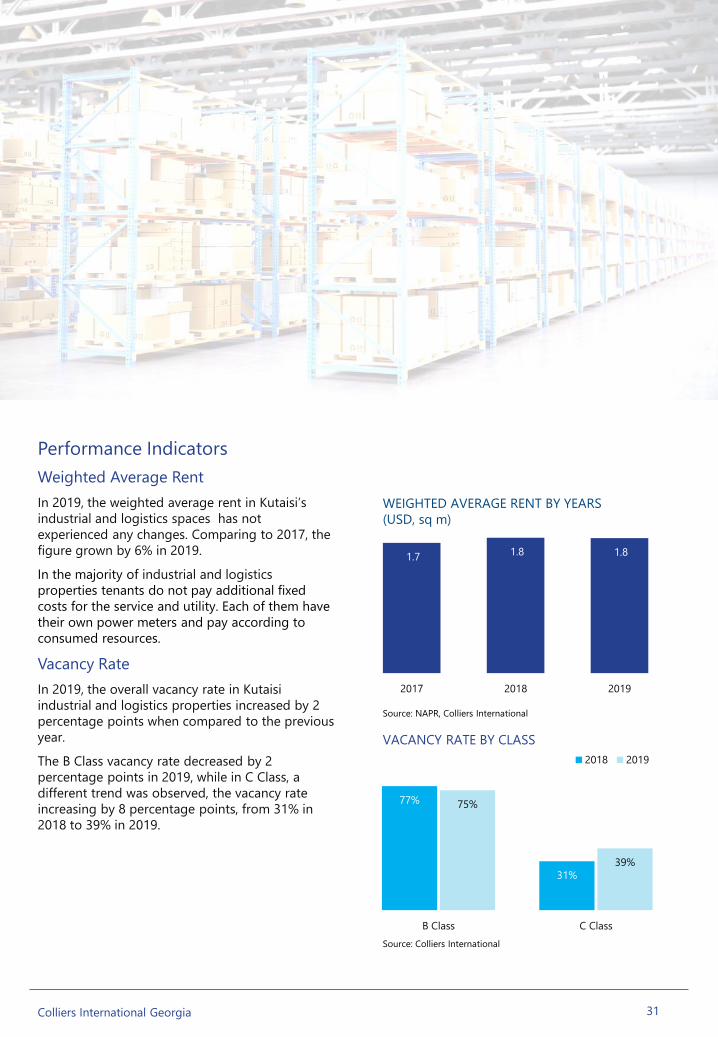
Performance Indicators
Weighted Average Rent
In 2019, the weighted average rent in Kutaisi’s
industrial and logistics spaces has not
experienced any changes. Comparing to 2017, the
figure grown by 6% in 2019.
In the majority of industrial and logistics
properties tenants do not pay additional fixed
costs for the service and utility. Each of them have
their own power meters and pay according to
consumed resources.
Vacancy Rate
In 2019, the overall vacancy rate in Kutaisi
industrial and logistics properties increased by 2
percentage points when compared to the previous
year.
The B Class vacancy rate decreased by 2
percentage points in 2019, while in C Class, a
different trend was observed, the vacancy rate
increasing by 8 percentage points, from 31% in
2018 to 39% in 2019.
WEIGHTED AVERAGE RENT BY YEARS
(USD, sq m)
VACANCY RATE BY CLASS
77%
31%
75%
39%
B Class C Class
2018 2019
Source: Colliers International
Source: NAPR, Colliers International
1.7 1.8 1.8
2017 2018 2019

Colliers International Georgia 32
Major part of industrial properties in Kutaisi are
located in Free Industrial Zones. Hualing FIZ
specializes in wood and stone processing, metal
construction, and furniture and mattresses
production. As regards Kutaisi FIZ, its largest tenant
is Fresh Georgia, who produce home appliances in
several factories.
Davit Aghmashenebeli Ave
Map of Main Clusters of Industrial Properties
Furniture Production
Food & Beverage
Building Materials
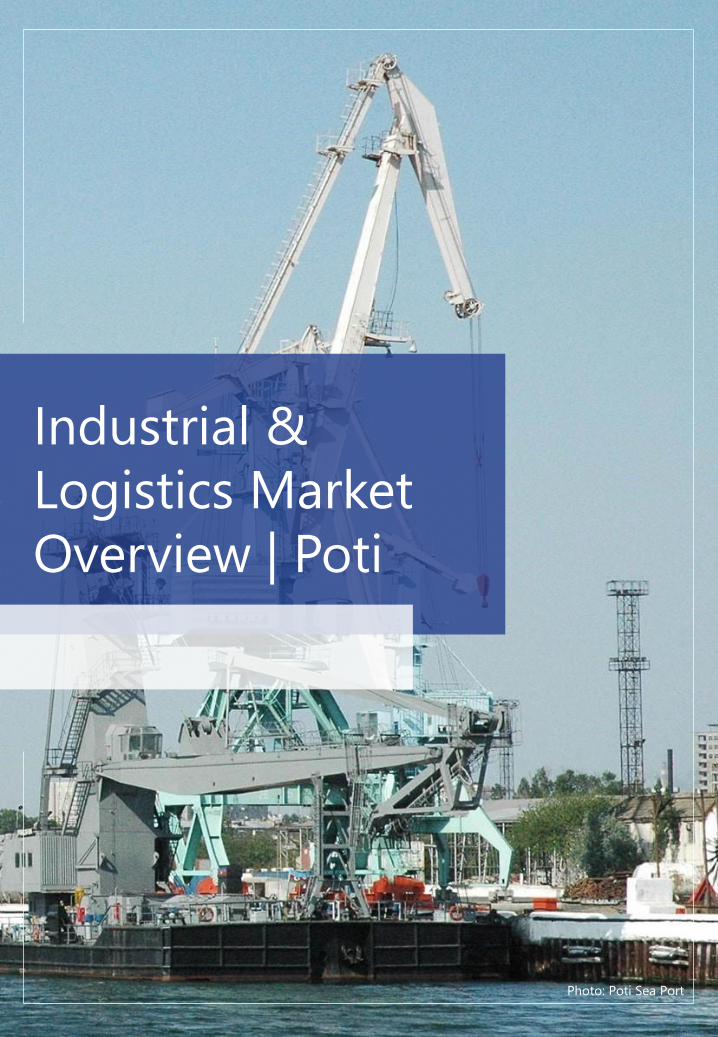
Photo: Poti Sea Port
Industrial &
Logistics Market
Overview | Poti

Colliers International Georgia 34
Supply
The total industrial and logistics space in Poti
amounts to 132,700 sq m, of which 61,939 is
terminal area. Poti’s dry storage leasable supply
is represented by only B Class industrial and
logistics , an area accounting for 38,566 sq m.
The total leasable capacity of cold storage
facilities in Poti is around 15,916 tons, while dry
storage equates to 22,739 tons.
In 2018-2019, the leasable market supply
remained steady, varying between 37-38 K sq
m. There are no upcoming projects planned for
the near future.
Weighted Average Rent
The weighted average rent in B Class leasable
facilities largely increased in 2019, from USD 2.2
per sq m in 2018 to USD 3 per sq m. This
change reflects a 36% growth rate y-o-y.
In the majority of industrial and logistics
properties tenants do not pay additional fixed
costs for the service and utility. Each of them
have their own power meters and pay according
to consumed resources.
Vacancy Rate
The vacancy rate in dry storage over the past
two years has been 17%, whereas the figure for
cold storage reduced by 5 percentage points
and amounted to 4% in 2019.
TOTAL SPACE DISTRIBUTION
59%
41%
39Ksq m
TOTAL SPACE DISTRIBUTION IN LEASABLE
DRY STORAGES BY CLASS, 2019
WEIGHTED AVERAGE RENT BY YEARS
(USD, sq m)
VACANCY RATE BY TYPE
ColdDry
2.4 2.2
3.0
2017 2018 2019
17%
9%
17%
4%
Dry Cold
2018 2019
37,575 38,655 38,655
32,057 32,057 32,057
61,939 61,939 61,939
2017 2018 2019
Leasable Owner Occupied Terminal
Source: NAPR, Colliers International Source: Colliers International
Source: Colliers International
Source: Colliers International

Colliers International Georgia 35
# Operator District GLA (sq m) Class Type
1 Esperance 24 Larnaka Street 15,014 B Dry
2 American Monolith Larnaka Street, Center-Maltakva 9,000 B Cold
3 Iceberg Poti LLC 7 Larnaka Street, Center-Maltakva 5,000 B Cold
4 Pace Warehousing Georgia 15/39 Gegidze Street, Center-
Maltakva4,530 B Cold
5 Pasidi Larnaka Street 3,769 B Dry
Main Market Players
Map of Existing Industrial Properties

Colliers International Georgia 36
Industrial real estate supply in Poti is
primarily owner occupied, mainly
represented by large scale factories. Fish
and seafood manufacturing is the main
driver of Poti Industrial Market.
Compared to other cities, Poti has a large
number of cold storages.
Wood Manufacturing
Fish Manufacturing
Food Manufacturing
Building Materials
Map of Main Clusters of
Industrial Properties

Colliers International Georgia 37
Despite its position as a former industrial centre in
close proximity to Tbilisi, the industrial and logistics
market in Rustavi is less developed in comparison to
other cities in Georgia.
Demand for industrial and logistics in Rustavi is
relatively low. Landlords do not have cause to
renovate old buildings as existing occupiers are
more or less satisfied by the general terms of
agreement – poor conditions and low rent.
industrial and logistics are mainly occupied by
providers of building materials, marble and steel.
Leasable warehouses located in Rustavi are
characterized as C class buildings. industrial and
logistics rental rate varies from USD 1 to USD 2 per
sq m per month.
Rustavi Industrial and Logistics Market
Photo: Rustavi

Colliers International Georgia 38
CONSTRUCTION COST
Sandwich-Panel Construction
Reinforced Concrete Construction
Metal Construction
Construction cost per sq m: USD 263 net of VAT.
Condition: White Frame
Construction cost per sq m: USD 143 net of VAT
Condition: White Frame
Construction cost per sq m: USD 183 net of VAT
Condition: Renovated
Construction cost per sq m: USD 68 net of VAT.
Condition: White Frame
Note: It is assumed that the geology of the land plot is not problematic, communications are nearby, and topography is leveled.

Colliers International Georgia 39
CONCLUSIONS & OUTLOOK
The vacancy rate declines across EMEA countries.
The figure fell in 45% of markets in H1 2019. The
fastest declines in vacancy rates were registered in
Eastern European markets. Moreover, the pace of
vacancy declines is forecast to continue
moderating in the near future.
Overall, rents remained largely stable in 70% of
markets. Growth accelerated in 22% of markets in
H1 2019 indicating that despite the current macro-
economic environment and weak industrial
sentiment, real estate market fundamentals remain
in favour of landlords.
The warehouse market in Georgia is not
distinguished by high performance
Compared to other European cities, Tbilisi’s
existing and upcoming warehouse supply per
1,000 inhabitants, as well as the rental rates for
storage spaces are remarkably low. Furthermore,
Tbilisi ranks last among comparable cities in terms
of upcoming stock. These characteristics indicate
that the warehouse market in Georgia is
underdeveloped.
Tbilisi is the largest supplier of warehouse
spaces
The total area of warehouse spaces in Tbilisi,
Batumi, Kutaisi and Poti amounts to approximately
2.5 million sq m, 1.16 million sq m of which is
leasable. With 767 K sq m leasable storage area,
Tbilisi is the largest supplier in the country,
followed by Kutaisi with 230 K sq m leasable area.
There is a limited supply of A Class storages
Supply of modern A Class spaces is limited and is
represented only by Gebrüder Weiss hat offers a
complex rental service. Due to limited demand for
A Class storages in the country, a high share of
(local) owner-occupied stock, and a limited
number of international tenants, the leasable area
of Gebrüder Weiss has increased only slightly in
recent years.
The market is dominated by old buildings
The majority of leasable and owner-occupied
spaces are located in old buildings. After the
collapse of the Soviet Union, the ownership of
state-owned industrial buildings was transferred to
the individuals. This led to an increase of low-class
warehouse spaces, the majority of which is now
occupied by the local companies. As the rental
rates are quite low, the construction of new
properties is not profitable for interested
individuals, thus the market is dominated by old
storages.

APPENDIX
Real Estate Registration
& Construction Permits
1

41Colliers International Georgia
Real Estate Registration
In Georgia, the National Agency of Public Registry is the state institution responsible for the registration of property,
registering both transfers between private entities and state-owned properties.
In case of private transfer, the purchaser has two options:
• Via a notary - contract drafting and legalization by the notary and subsequent registration. The notary assumes
responsibility for the content of the draft and its legalization. The presence of a translator and his signature on the
bilingual purchase document is required and the translator assumes responsibility for the authenticity of texts. Time
for preparation of the bilingual document and its legalization varies depending on the notary
• Via the National Agency of Public Registry - direct submission of the purchase contract for legalization and
registration. In this case, the bilingual purchase document is to be drafted directly by both parties or by their
authorized representatives. The Agency’s representative certifies the signatures and may provide recommendations if the document is not accurately drafted but does not carry any responsibility for the validity or its content.
• The National Agency of Public Registry is represented in: a) Public Services Halls (Tbilisi, Gori, Kutaisi, Batumi,
Ozurgeti, Mestia, Zugdidi, Rustavi, Marneuli, Gurjaani, Telavi, Kvareli and Akhaltsikhe) and b) regional departments of
the National Agency of Public Registry (located in cities throughout the country).
In the case the property being purchased from the state/municipality (privatization, auction or other form of purchase)
the documents should be submitted directly to the Agency.
Times and fees for registration
• 4 working days upon the submitting of documents (ordinary time) - the day of submission of documents is not
counted - GEL 50 (registration fee per one property) + GEL 5 for certifying the document (GEL 5 per each document
subject to submission)
• 1 working day - GEL 150 + GEL 5 for certifying the document
• On the day of submitting the agreement in the Agency - GEL 200 + GEL 5
Times and fees for renewal of public registry information
Online
• 1 working day - GEL 10 (USD 4.4)
• Same working day - GEL 40 (USD 17.6)
Justice House
• 1 working day - GEL 15 (USD 6.6)
• Same working day - GEL 50 (USD 22)
Service Fee Payment
Application
Submission
Property
AcquisitionPurchase / Gift
Document
Preparation
Documents needed:
- Proof of identity document
- Duly attested Purchase
Contract / deed of gift on
immovable item
Public Service Hall or
territorial office of
National Agency of
Public registry
Within 4 business days - 50 GEL
Within 1 business day - 150GEL
On the day of application - 200 GEL

42Colliers International Georgia
Construction Permits
For the purposes of construction, buildings are divided into five types:
1st class buildings - no construction permit is required;
2nd class buildings - buildings with low risk factors;
3rd class buildings - buildings with medium risk factors;
4th class buildings - buildings with high risk factors;
5th class buildings - buildings with very high-risk factors.
The permit issuance process is divided into three stages:
Stage I - Statement of urban construction terms;
Stage II - Approval of architectural-construction project;
Stage III - Issuance of Construction Permit;
State organs responsible for the issuance of permits:
Local self-governmental (municipal) organs - for II, III class buildings within the municipal territory (at stages I and II)
except from Gudauri, Bakuriani, Bakhmaro, Ureki-Shekvetili recreation territories and for special regulatory zones on the
territory of Borjomi.
Local self-governmental (municipal) organs - for IV class buildings (at stages I and II) with the participation of
corresponding state organs
Local self-governmental (municipal) organs - for II, III and IV class buildings (at III stage) independently (including Gudauri,
Bakuriani, Bakhmaro, Ureki-Shekvetili recreation territories and for special regulatory zones on the territory of Borjomi)
Tbilisi City Hall - for II, III and IV class buildings in Tbilisi Municipality (at all stages) independently
Corresponding local organs of Adjara Autonomous Republic and Abkhazia Autonomous Republic - for II, III and IV class (at
all stages) on the territory of the Autonomous Republics
Local self-governmental (municipal) organs - II, III and IV class buildings (at stages I and II) for Gudauri, Bakuriani,
Bakhmaro, Ureki-Shekvetili recreation territories and for special regulatory zones on the territory of Borjomi - with the
participation of the Ministry of Economy and Sustainable Development.
Ministry of Economy and Sustainable Development - for V class buildings
Ordinary terms per each stage (working days):
Stage I
10 days for II, III and IV class buildings
15 days for Bakhmaro, Bakuriani and Ureki-Shekvetili recreation territories (excluding V class buildings), also for all
buildings that require ecological expertise.
30 days for V class buildings
Stage II
18 days for II and III class buildings
20 days for all IV class buildings, for Bakuriani, Bakhmaro, Ureki-Shekvetili recreation territories , for all buildings that
require ecological expertise and for V class buildings.
Stage III
5 days for II, III and IV class buildings
10 days for V class buildings

43Colliers International Georgia
Exceptions:
The special terms for permission process:
Construction permits concerning:
III class buildings with an intensity coefficient up to 1,500 p/m2 and for buildings with a height of up to the 14
meters that will be located on the territories where urbanization regulatory plans do not exist and are
organized according to land use or which are organized according to the perspective development regulatory
plans on the territory of Tbilisi - the permission process may involve II and III stages only
The simplified permit procedure may involve just two stages and the permit is issued in the second stage.
The terms for the simplified procedure are as follows:
Stage I - 12 days for II and III class buildings
15 days for all IV and V class buildings, for Bakuriani, Bakhmaro, Ureki-Shekvetili recreation territories and for
all buildings that require ecological expertise.
Stage II (issue of permit) - 20 days for all classes
Permission fees
The municipal organs determine the permission fees though the maximum limits are envisaged by the Law:
For all territory of Georgia - 1 (one) GEL (USD 0.4) p/m 2 of construction territory
For construction of industrial buildings at resort areas- 5 (five) GEL (USD 2.2) p/m2 of construction territory
Exceptions:
Investors seeking the construction of hotels in free tourism zones and investing not less than 1,000,000 (one
million) GEL (USD 440,494) per each hotel are exempted from paying the permission fee.
Construction Permits

APPENDIX
2Primary Information Sources,
Data Used for the Study,
Definitions & Assumptions

45Colliers International Georgia
In the process of preparing the research, we were guided by the information provided by property managers, owners,
developers, governmental institutions (The National Agency of Public Registry, the National Statistics Office of Georgia, the
National Bank of Georgia, the Ministry of Economy and Sustainable Development of Georgia, Georgian Civil Aviation
Agency, City Halls, World Economic Forum). The following web-portals is also used:
www.geostat.ge; www.nbg.ge; www.gnta.ge; www.tas.ge; www.worldbank.com; www.imf.org; www.cia.gov
Definitions & Assumptions
EMEA: Europe, Middle East and Africa
FDI: Foreign Direct Investment
IMF: International Monetary Fund
GDP: Gross Domestic Product
GEL: Georgian Lari
GLA: Gross Leasable Area
NLA: Net Leasable Area
sq m: Square metre
USD: The United States Dollar
HVAC: Heating, ventilation, and air conditioning
VAT: Value added tax
EBITDA: Earnings Before Interest, Taxes, Depreciation and Amortization
IRR: Internal Rate of Return
Primary Information Sources, Data Used for the Study, Definitions &
Assumptions
Rent Prices: Are calculated based on the data provided by
warehouse developers and owners, property managers, tenants,
National Agency of Public Registry etc. all rents are calculated in
USD per month net of VAT and service charges. Rents for dry
storages are calculated per m2 except Poti, where it is calculated
per ton. All rents for cold warehouses are calculated per ton.
Prime Rent: The Prime Logistics & Distribution Headline
Rent represents the top open-market tier of rent that could be
expected for a unit of standard size commensurate with demand
for units over 3,000 m2 or greater, of the highest quality and
specification (Grade A) in the best location in the market at the
survey date. Warehouse Units would typically include up to 10%
office space, the balance being general
warehousing/logistics/distribution space with at least 6 to 12
metre ceiling heights. All loading is dock-height. Prime Headline
Rent should reflect the level at which relevant transactions are
being completed in the market at the time but need not be exactly
identical to any of them, particularly if deal flow is very limited or
made up of unusual one-off deals. If there are no relevant
transactions during the survey period, the quoted figure will be
more hypothetical, based on expert opinion of market conditions,
but the same criteria on building size and specification will still
apply. The figure should exclude service charges and taxes, and
not reflect tenant incentives.

CONTACT DETAILS
DIR +995 32 296 0010
18 Uznadze Street
0102 Tbilisi Georgia
www.investingeorgia.org
www.enterprisegeorgia.gov.ge
CONTACT DETAILS
DIR +995 32 222 4477
12 M.Aleksidze Street
King David Business Centre
0193 Tbilisi Georgia
www.colliers.com/georgia
Colliers International is a leading commercial real estate
services company operating in 67 countries, providing a
full range of services to real estate occupiers,
developers and investors on a local, national and
international basis. Services include brokerage sales and
leasing (landlord and tenant representation), real estate
management, valuation, consulting, project
management, project marketing and research, and a
recently added GIS services.
Colliers International provides services across the
following core sectors as well as many specialized
property types: retail, office, hotel, industrial and
logistics.
Established by the Ministry of Economy and
Sustainable Development of Georgia, “Enterprise
Georgia” is a legal entity of public law aimed at
development of Georgian enterprises. As the first
state-owned institution mandated to facilitate
development, growth and internationalization of
country’s private sector through use of different
mechanisms, Enterprise Georgia operates within its
three pillars: EG – Business, EG – Invest, and EG –
Export.
As one of the EG Pillars, Investment Promotion and
Support Divisions play a role of moderator between
foreign investors and the Government of Georgia,
ensuring that the investor gets different types of
updated information and has means of effective
communication with the Government bodies. The aim
of the Invest division is to attract, promote and
develop foreign direct investments in Georgia. It
serves as a “One-stop-shop” for investors to support
companies before, during & after investment process.
All rights reserved including those of translation into foreign languages. No part of this document may be reproduced, distributed or transmitted in any form or
by any means, electronic or mechanical, including photocopying, recording, or any information storage and retrieval system, without the prior written
permission of the author, except in the case of brief quotations and other noncommercial uses permitted by copyright law.
46Colliers International Georgia
DISCLAIMER

47Colliers International Georgia
PROJECT TEAM
Ramaz SharabidzeProject Manager, Director | Research & Publications
Colliers International Georgia
RESEARCH & PUBLICATIONS
Kristine BakradzeSenior Researcher | Research & Publications
Colliers International Georgia
Shota NatenadzeIntern | Research & Publications
Colliers International Georgia
Elene SeturidzeIntern | Research & Publications
Colliers International Georgia
Levan GvaramadzeManaging Partner | Development Advisory
Colliers International Georgia
DEVELOPMENT ADVISORY
Etuna MunjishviliDirector | Development Advisory
Colliers International Georgia
Leo ChikavaDirector | Data Services
Colliers International Georgia
DATA SERVICES
Mariam AsatianiSenior Data Manager | Data Services
Colliers International Georgia
Tamar KhurtsilavaData Analyst | Data Services
Colliers International Georgia
Teimuraz MosulishviliData Analyst | Data Services
Colliers International Georgia
Nini ShoniaData Analyst | Data Services
Colliers International Georgia
Giga NozadzeIntern | Data Services
Colliers International Georgia

COLLIERS GLOBAL AT A GLANCE
This document has been prepared by Colliers International for general information only. Colliers International makes no
guarantees, representations or warranties of any kind, expressed or implied, regarding the information including, but not
limited to, warranties of content, accuracy and reliability. Any interested party should undertake their own inquiries as to
the accuracy of the information. Colliers International excludes unequivocally all inferred or implied terms, conditions
and warranties arising out of this document and excludes all liability for loss and damages arising there from. This
publication is the copyrighted property of Colliers International and/or its licensor(s). ©2020. All rights reserved.