Embed Size (px)
Citation preview
Dynamics of Confusion 1
Running head: CONFUSION DURING DEVICE COMPREHENSION
Confusion and its Dynamics during Device Comprehension with Breakdown Scenarios
Sidney D’Mello1 and Art Graesser2
1University of Notre Dame
2University of Memphis
Corresponding Author:
Sidney D’Mello,
384 Fitzpatrick Hall
University of Notre Dame
Notre Dame, IN 46556, USA
574-631-8322
Dynamics of Confusion 2
Abstract
The incidence and dynamics of confusion during complex learning and problem solving were
investigated in an experiment where participants first read illustrated texts on everyday devices
(e.g., an electric bell) followed by breakdown scenarios reflecting device malfunctions (e.g.,
“When a person rang the bell there was a short ding and then no sound was heard”). The
breakdown scenarios were expected to trigger impasses and put participants in a state of
cognitive disequilibrium where they would experience confusion and engage in effortful
confusion resolution activities in order to restore equilibrium. The results confirmed that
participants reported more confusion when presented with the breakdown scenarios compared to
control scenarios that involved focusing on important device components in the absence of
malfunctions. A second-by-second analysis of the dynamics of confusion yielded two
characteristic trajectories that distinguished participants who partially resolved their confusion
from those who remained confused. Participants who were successful in partial confusion
resolution while processing the breakdowns outperformed their counterparts on knowledge
assessments after controlling for scholastic aptitude, engagement, and frustration. This effect was
amplified for those who were highly confused by the breakdowns. There was no direct
breakdown vs. control effect on learning, but being actively engaged and partially resolving
confusion during breakdown processing were positive predictors of increased learning with the
breakdown compared to control scenarios. Implications of our findings for theories that highlight
the role of impasses, cognitive disequilibrium, and confusion to learning are discussed.
Dynamics of Confusion 3
Confusion and its Dynamics during Device Comprehension with Breakdown Scenarios
The statement, “we problem solve when our world breaks down in front of us,” is
perhaps an accurate categorization of the factors that facilitate complex problem solving in our
everyday worlds. Quite different from formal educational settings, when one is asked to learn
concepts, procedures, and problem solving strategies in the context of imagined problems or in
anticipation of future applications, real-world problem solving is often triggered by an actual
problem that needs to be solved to advance a more immediate goal. For example, toasters,
doorbells, dishwashers, and telephones are widely used everyday devices, yet people have
surprisingly limited knowledge on how these devices function, presumably because this
information is not essential for typical use of these devices. As such, peoples’ understanding of
everyday devices is restricted to some knowledge of observable parts, basic operational
procedures, and general functions. They can rarely articulate the mechanical and electrical
principles that govern device functioning and are generally unaware of misconceptions and
problems with their explanations (Ahn & Kalish, 2000; Graesser & Clark, 1985; Graesser, Lu,
Olde, Cooper-Pye, & Whitten, 2005; Kieras & Bovair, 1984; Rozenblit & Keil, 2002).
The situation can drastically change when a device fails to function as expected or
intended, as is the case when a doorbell is depressed but an unexpected “clank” is heard instead
of the anticipated “ding.” In these situations, an individual is likely to experience cognitive
disequilibrium (or cognitive conflict), which is a state that occurs when an individual is
confronted with discrepant events, such as deviations from the norms, obstacles to goals,
interruptions of action sequences, contradictions, anomalous information, unexpected feedback,
and other forms of uncertainty. Cognitive disequilibrium is likely to persist until equilibrium is
restored or disequilibrium is dampened by problem solving and reasoning.
Dynamics of Confusion 4
The importance of cognitive disequilibrium in learning and problem solving has a long
history in psychology that spans the developmental, social, learning, and cognitive sciences
(Berlyne, 1960, 1978; Chinn & Brewer, 1993; Collins, 1974; Festinger, 1957; Graesser & Olde,
2003; Laird, Newell, & Rosenbloom, 1987; Limón, 2001; Miyake & Norman, 1979; Mugny &
Doise, 1978; Piaget, 1952; Schank, 1999). The notion that cognitive disequilibrium extends
beyond cognition and into emotions has also been acknowledged and investigated for decades
(Festinger, 1957; Graesser et al., 2005; Lazarus, 1991; Mandler, 1976; Piaget, 1952; Stein,
Hernandez, & Trabasso, 2008). What is less clear, however, is the trajectory of cognitive-
affective processes that are spawned by cognitive disequilibrium and how these processes impact
learning and problem solving. In this paper, we focus on confusion, which is considered to be
one of the key affective signatures of cognitive disequilibrium.
Confusion
What exactly is confusion? Most are familiar with the feeling of being confused, but
there is the question of whether confusion should be classified as a bonafide emotion like anger
or fear, or an affective state, which is more general than an emotion. D'Mello and Graesser
(2014) recently suggested that confusion shares several of the properties commonly attributed to
emotion, such as a predictable appraisal structure (Silvia, 2009; Silvia, 2010) and identifiable
facial markers (i.e., furrowed brow - Craig, D'Mello, Witherspoon, and Graesser (2008)), but
evidence is lacking on a few additional properties of emotion (e.g., neural circuits partially
dedicated to “emotional processing” - Izard (2010)). Although more research is needed before
this issue can be settled, what is clear is that confusion is more than a mere cognitive state, a
position that has considerable support in the affective sciences literature (Ellsworth, 2003; Hess,
2003; Keltner & Shiota, 2003; Pekrun & Stephens, 2011; Rozin & Cohen, 2003a; Rozin &
Dynamics of Confusion 5
Cohen, 2003b; Silvia, 2009; Silvia, 2010). In line with this, we consider confusion to be an
affective state.
Similar to other affective states, confusion emerges as a product of an individual’s
appraisals of relevant events (both internal and external) (Ortony, Clore, & Collins, 1988;
Scherer, Schorr, & Johnstone, 2001; Scherer, 2009; Smith & Ellsworth, 1985). According to
Mandler's interruption (discrepancy) theory (Mandler, 1990) and goal-appraisal theories of
emotion (Stein & Levine, 1991), individuals are constantly assimilating new information into
existing knowledge schemas as they pursue goal-directed activities. When new or discrepant
information is detected (e.g., a conflict with prior knowledge), attention shifts to discrepant
information, the autonomic nervous system increases in arousal, and the individual experiences a
variety of possible affective states, depending on the context, the amount of change, and whether
the goal is blocked. In the case of extreme novelty, the event evokes surprise. Confusion occurs
when the discrepancy or novelty triggers an impasse (i.e., the person encounters an error, gets
stuck, and is unsure how to proceed - VanLehn, Siler, Murray, Yamauchi, and Baggett (2003))
that blocks the current goal and possibly results in the individual being uncertain about what to
do next.
Once confusion is experienced, the individual needs to engage in problem solving
activities in order to successfully restore equilibrium by resolving their confusion. Confusion
resolution requires people to stop, think, effortfully deliberate, problem solve, and revise their
existing mental models. These activities have the potential to inspire greater depth of processing
during training, more durable memory representations, and more successful retrieval (Craik &
Lockhart, 1972; Craik & Tulving, 1975). Some evidence for this form of impasse-driven learning
can be found in early work on skill acquisition as well as more recent studies on complex
Dynamics of Confusion 6
learning (Brown & VanLehn, 1980; Carroll & Kay, 1988; D'Mello, Lehman, Pekrun, &
Graesser, 2014; Siegler & Jenkins, 1989; VanLehn et al., 2003). For example, in an analysis of
approximately 125 hours of human-human tutorial dialogs, VanLehn et al. (2003) discovered
that comprehension of physics concepts was rare when students did not reach an impasse,
irrespective of quality of the explanations provided by tutors. Recent evidence also suggests that
confusion is positively correlated with learning, presumably because of activities associated with
confusion resolution, such as more effortful elaboration and causal reasoning during problem
solving (Craig, Graesser, Sullins, & Gholson, 2004; D’Mello & Graesser, 2011; Graesser,
Chipman, King, McDaniel, & D'Mello, 2007).
In addition to confusion that is eventually resolved, unresolved confusion can spawn
trajectories of negative affective states (D'Mello & Graesser, 2012). For example, frustration
occurs when an individual experiences repeated failures and is stuck. Persistent confusion occurs
when confusion resolution fails and an individual is unable to restore equilibrium. This form of
unresolved confusion is expected to accompany negligible or poor learning when compared to
situations where confusion is immediately or eventually resolved (Bosch, D’Mello, & Mills,
2013). In the VanLehn et al. (2003) tutoring example discussed earlier, students acquired a
physics principle in only 33 of the 62 impasses, ostensibly because their impasses were not
resolved for the remaining 29 cases. Therefore, it is important to distinguish between productive
and unproductive confusion (D'Mello & Graesser, 2012).
To summarize, confusion is an affective state that is highly relevant to learning and
problem solving because it can perform two of the key functions attributed to affect: to
communicate the result of an individual’s appraisal of the world (Schwarz, 2012; Schwarz &
Skurnik, 2003) and to motivate instrumental action based on said appraisals (Frijda, 1986; Izard,
Dynamics of Confusion 7
2010). Confusion brings appraisals of knowledge to the forefront by signaling a discrepancy in
one’s model of the world, and is therefore sometimes referred to as a knowledge emotion (Silvia,
2010) or an epistemic emotion (Pekrun & Stephens, 2011). Confusion can motivate effortful
cognitive activities in an attempt for the individual to resolve the discrepancy and restore
equilibrium. The effect of confusion on the outcomes of a learning or problem solving activity is
unlikely to be causal because performance relies on the extent to which confusion is attended to
and resolved. Therefore, we would expect confusion to exhibit different dynamics and have
differential impacts on performance based on whether it is simply ignored, attended to and
successfully resolved, or attended to and left unresolved.
Overview and Motivation of Present Study
The present study investigated confusion and its resolution in the context of
comprehending how everyday devices function (device comprehension) from illustrated texts
such as the cylinder lock shown in Figure 1. We chose this task because of its ecological
relevance to everyday life and its long history in the cognitive sciences. It is also a challenging
task because it involves the construction of complex mental representations from impoverished
information, which is common to many real world tasks.
Device comprehension involves the construction of a device model (Hegarty & Just,
1993; Hegarty, Just, & Morrison, 1988; Kieras & Bovair, 1984), which following Kieras and
Bovair (1984), is defined as an accurate conceptual model of a device (to be distinguished from
other types of mental models - Johnson-Laird (2006)). A device model is needed to generate
inferences about device operations, answer causal questions, diagnose and solve device
malfunctions, make conceptual comparisons between device components, and generate coherent
explanations of intricate mechanisms.
Dynamics of Confusion 8
Hegarty and colleagues (2002) provide a process-level account in their cognitive model
of the stages involved in constructing a device model from illustrated texts. Their model consists
of the following five phases: (a) constructing a static device model by decomposing the diagram
into simpler parts and connecting these parts in a mental representation, (b) making
representational connections from prior knowledge and spatial relations among components, (c)
making referential connections between the text and diagram, (d) identifying the causal chain of
events, and (e) constructing a dynamic model by mentally simulating the static model (Hegarty
& Just, 1993; Hegarty, Narayanan, & Freitas, 2002). This model has been used to guide research
on the cognitive processes that underlie device comprehension and to scaffold the construction of
instructional materials on device functioning.
Confusion was manipulated in the present study via breakdown scenarios. Participants in
the main experimental condition were presented with an illustrated text describing the workings
of a household device along with a description of a specific device malfunction (breakdown
scenario). For example, a breakdown scenario for the cylinder lock presented in Figure 1 is: “A
person puts the key into the lock and turns the lock but the bolt doesn’t move.” Participants were
asked to attempt to diagnose why the device was broken but were not provided with any
additional information or instructional scaffolds.
The breakdowns were presented after participants had a few minutes to build a device
model from the illustrated texts. Confusion is not expected to occur if the breakdowns can be
readily assimilated into this existing device model. However, the breakdowns were explicitly
designed to pose comprehension difficulties because they reflect discrepancies between (a)
device states/events manifested in the breakdown scenario and (b) expectations on device
activities according to prior world knowledge and successful device functioning depicted in the
Dynamics of Confusion 9
illustrated text. We posit that such discrepancies should put a knowledgeable person in the state
of cognitive disequilibrium and the associated affective state of confusion. At that point a
conscientious, knowledgeable comprehender should initiate cognitive activities to restore
equilibrium by resolving confusion, such as searching for the causes of the breakdown and
finding ways to fix the device. Successful confusion resolution should result in an extended
mental model that accommodates the breakdown, thereby leading to a new device model. In line
with this, we track the dynamics of the confusion resolution process in order to identify
trajectories corresponding to confusion that is resolved vs. not resolved and investigate the effect
of confusion resolution on device comprehension.
The use of breakdown scenarios to induce cognitive disequilibrium is not new. However,
the present study has a different emphasis and expands on previous research in significant ways.
In two previous studies, Graesser and colleagues attempted to induce cognitive disequilibrium
during or after the comprehension of an illustrated text by providing participants with breakdown
scenarios (Graesser et al., 2005; Graesser & Olde, 2003). The studies were designed to test a
model of question generation that specified how people ask questions that potentially illuminate
the causes and restoration of device malfunctions. The results confirmed their predictions that
deep questions highlighting potential faults emerged when knowledgeable participants were in a
state of cognitive disequilibrium, whereas low knowledge participants had less discriminating
questions. Interestingly, it was not the number of questions produced but the quality of questions
that was positively correlated with scores on a device comprehension posttest. Eye tracking
results also indicated that the deep rather than the shallow comprehenders were more likely to
fixate on device components that could potentially explain the cause of the malfunctions
(Graesser et al., 2005).
Dynamics of Confusion 10
Although this research provided some initial evidence regarding a correlation between
cognitive disequilibrium and device comprehension, it was assumed that the breakdown
scenarios induced cognitive disequilibrium, but this was not experimentally tested with a control
group that did not receive the breakdowns. The present study addressed this limitation with an
experimental design that manipulated whether participants were provided with either breakdown
scenarios or alternate control texts. Another limitation was that cognitive disequilibrium was not
measured, but rather was inferred from the quality of questions asked. This limitation was
addressed by explicitly monitoring confusion along with engagement and frustration. An
important point of divergence from Graesser et al.’s (2003; 2005) previous research on
breakdown scenarios is that the present focus is not on question asking, but on confusion and its
resolution during cognitive disequilibrium.
Research Questions
Available research suggests a complex relationship between confusion, its resolution, and
learning. This paper attempts to elucidate this relationship in the context of four research
questions: (RQ1) what is the effect of breakdown processing on affect (with an emphasis on
confusion)?, (RQ2) what is the effect of breakdown processing on learning?, (RQ3) what are the
dynamics of confusion during breakdown processing?, and (RQ4) is the outcome of confusion
resolution predictive of affect and learning?
We tested these questions in an experiment in which participants first read an illustrated
text on an everyday device after which they were presented with either a breakdown scenario or
an appropriate control scenario in a within-subjects design involving four devices. Participants
completed knowledge tests to measure recall and device comprehension. Self-reports of
confusion, engagement, and frustration across breakdown and control scenarios were used to

Dynamics of Confusion 11
answer RQ1. We addressed RQ2 by comparing test scores across breakdown and control
scenarios. A key aspect of this research is to track the dynamics of confusion resolution and to
compare the outcomes of individuals who successfully report resolving their confusion versus
those who do not. This was done with a retrospective affect judgment procedure where
participants provide moment-to-moment confusion judgments via video-based cued recall after
the primary device comprehension activities. Time series analyses on these confusion trajectories
revealed two distinct profiles with respect to confusion resolution. These profiles were examined
to address RQ3 and RQ4.
It should be noted that our approach to testing RQ3 and RQ4 is inherently correlational
because our goal is to investigate the dynamics and impacts of self-regulated confusion
resolution and its effects on learning. We focused on self-regulated confusion resolution because
it more closely reflects real-world conditions where individuals are left to their own devices
without any experimenter-interventions as is sometimes done (Silvia, 2010). However, by
definition, self-regulated confusion resolution cannot be manipulated and it is possible that other
variables could explain any differences in outcomes beyond confusion resolution itself. To
address this, we measured additional pertinent variables (i.e., scholastic aptitude, engagement,
and frustration) and included them as covariates in the analyses for RQs 3 and 4.
Method
Participants
The participants were 88 undergraduate students from a mid-south university in the U.S.,
who participated for course credit. Participants were 17 to 40 years old with an average age of
20.6 years (SD = 4.14 years). The sample contained 68 females (77.3%). Self-reported
Dynamics of Confusion 12
ethnicities were 53.4% African-American, 37.5% Caucasian, 3.4% Asian, 4.5% Hispanic, and
1.1% did not report an ethnicity.
Design
The experiment had a within-subjects design in which participants studied four devices,
two with the breakdown scenarios and two with the control scenarios. Ordering of devices was
counterbalanced across participants with a Latin Square. Orderings of devices were: (a) Bell,
Toaster, Gauge, Lock; (b) Toaster, Lock, Bell, Gauge; (c) Lock, Gauge, Toaster, Bell; and (d)
Gauge, Bell, Lock, Toaster.
The assignment of devices to scenarios and the presentation order of scenarios (control
first and breakdown second or breakdown first and control second) were counterbalanced across
participants. More specifically, half the participants received the breakdown scenarios for the
first two devices and the control scenarios for the third and fourth device; vice versa for the
second half. Thus, ordering of scenarios was: Breakdown-Breakdown-Control-Control or
Control-Control-Breakdown-Breakdown.
Materials
Illustrated texts, breakdown, and control scenarios. The participants read four
illustrated texts on everyday devices: a cylinder lock, an electric bell, a car temperature gauge,
and a toaster. Descriptions of the device mechanisms along with illustrations were extracted from
Macaulay (1988) book of illustrated texts, The Way Things Work. The illustrated texts contained
small sections in printed text, visual diagrams of the components of the device, labels of major
components, and directional arrows that convey motion or temporal changes (see Figure 1). The
text descriptions were about a paragraph long and did not contain any additional explanations
other than what was provided in the Macaulay (1988) book. For example, the short paragraph in
Dynamics of Confusion 13
the lower right of Figure 1 is the only explanation participants received to understand the inner-
workings of the cylinder lock.
A breakdown scenario was prepared for each of the four devices. The breakdown
scenario consisted of one or two sentences that identified physical symptoms of a device
malfunction. The breakdown could be explained by a very small number of components, parts,
events, or processes in the device system. In the case of the cylinder lock, for example, the fault
would converge on the cam, parts of the cam, parts that interact with the cam, and events that
move the cam. There are a host of other components, parts, events, and processes in Figure 1 that
would not be plausible explanations of the breakdown.
Each breakdown scenario was accompanied by a control scenario. For example,
participants studying the cylinder lock in the control scenario were instructed to “Try to
understand the role of the cam in the functioning of the cylinder lock.” The components
emphasized in this focused-component control scenario were always matched to the critical
causes of the device malfunction in the breakdown scenario. This control scenario was expected
to bias participants to perseverate on particular device components, instead of simply re-reading
as this might favorably influence participants to adopt a more global perspective while
constructing the device model. But it was not expected to induce high levels of confusion
because there was no mechanism that explicitly triggered impasses.
Knowledge tests. There were two tests that measured the extent to which participants
comprehended the functioning of the devices. The component identification test was
administered four times during the session, once after studying each device. This test simply
asked participants to list the components of the device they had just studied in the order of
importance (the most important component goes first). Participants had 30-seconds to list the
Dynamics of Confusion 14
components before additional keyboard input was prevented and the screen automatically
advanced.
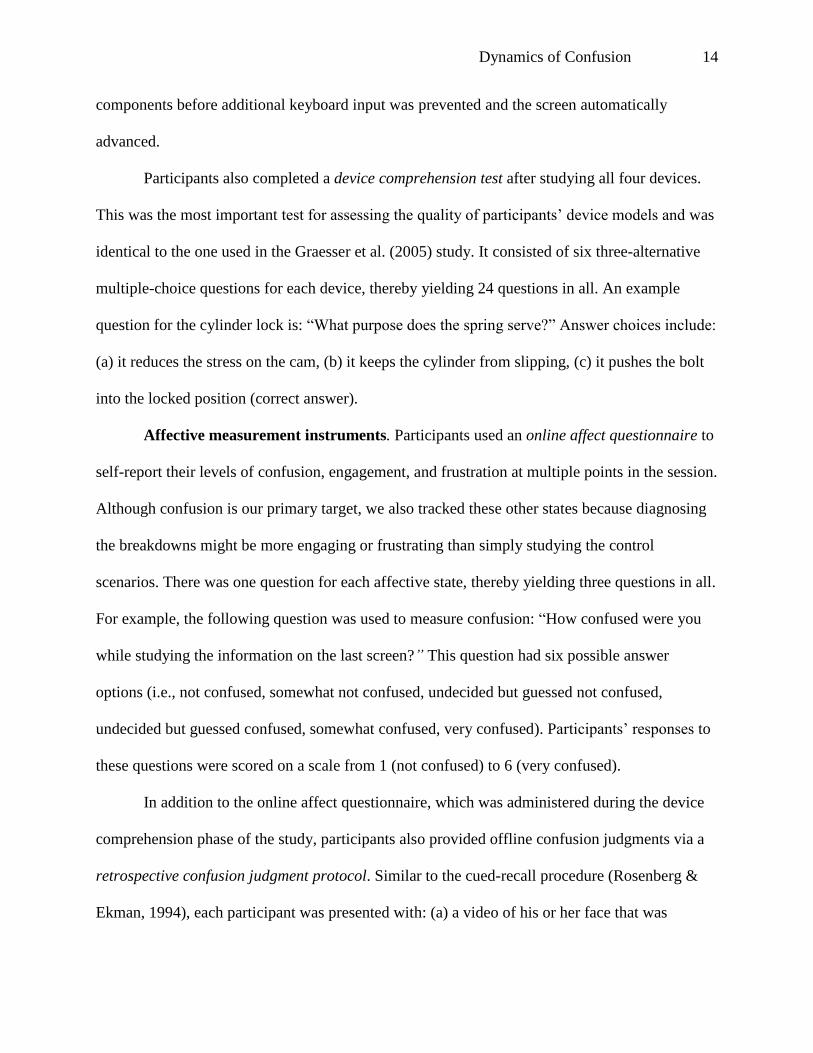
Participants also completed a device comprehension test after studying all four devices.
This was the most important test for assessing the quality of participants’ device models and was
identical to the one used in the Graesser et al. (2005) study. It consisted of six three-alternative
multiple-choice questions for each device, thereby yielding 24 questions in all. An example
question for the cylinder lock is: “What purpose does the spring serve?” Answer choices include:
(a) it reduces the stress on the cam, (b) it keeps the cylinder from slipping, (c) it pushes the bolt
into the locked position (correct answer).
Affective measurement instruments. Participants used an online affect questionnaire to
self-report their levels of confusion, engagement, and frustration at multiple points in the session.
Although confusion is our primary target, we also tracked these other states because diagnosing
the breakdowns might be more engaging or frustrating than simply studying the control
scenarios. There was one question for each affective state, thereby yielding three questions in all.
For example, the following question was used to measure confusion: “How confused were you
while studying the information on the last screen?” This question had six possible answer
options (i.e., not confused, somewhat not confused, undecided but guessed not confused,
undecided but guessed confused, somewhat confused, very confused). Participants’ responses to
these questions were scored on a scale from 1 (not confused) to 6 (very confused).
In addition to the online affect questionnaire, which was administered during the device
comprehension phase of the study, participants also provided offline confusion judgments via a
retrospective confusion judgment protocol. Similar to the cued-recall procedure (Rosenberg &
Ekman, 1994), each participant was presented with: (a) a video of his or her face that was
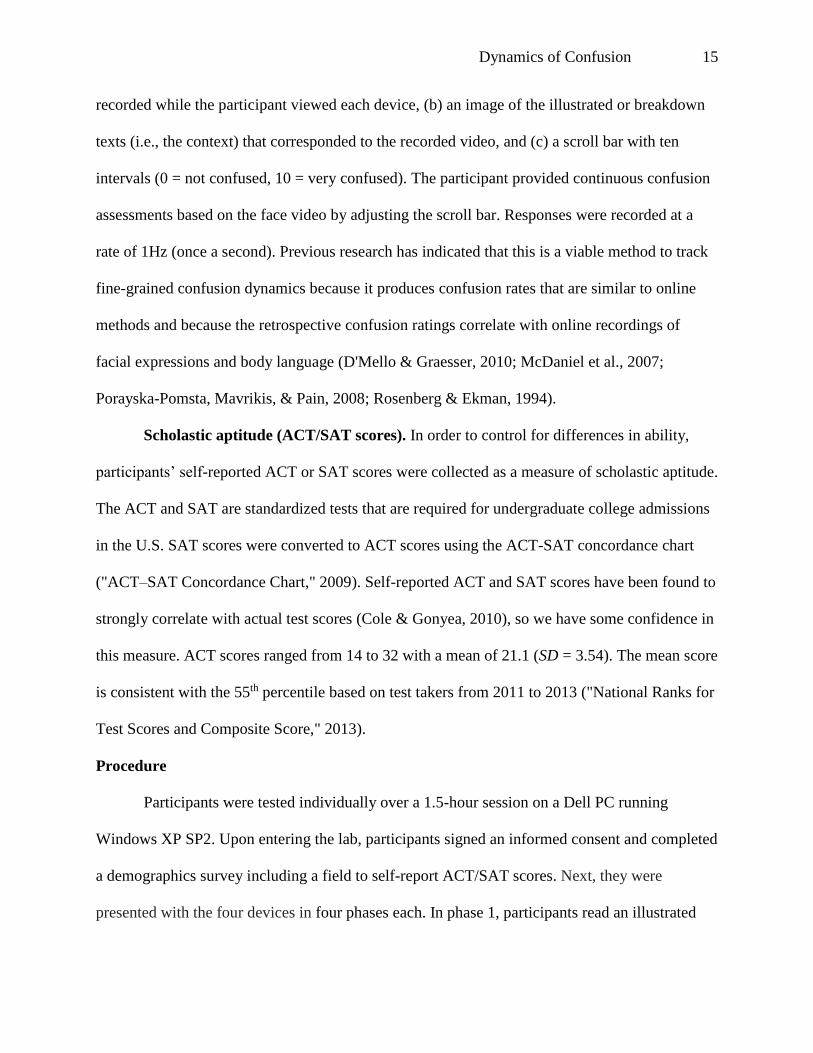
Dynamics of Confusion 15
recorded while the participant viewed each device, (b) an image of the illustrated or breakdown
texts (i.e., the context) that corresponded to the recorded video, and (c) a scroll bar with ten
intervals (0 = not confused, 10 = very confused). The participant provided continuous confusion
assessments based on the face video by adjusting the scroll bar. Responses were recorded at a
rate of 1Hz (once a second). Previous research has indicated that this is a viable method to track
fine-grained confusion dynamics because it produces confusion rates that are similar to online
methods and because the retrospective confusion ratings correlate with online recordings of
facial expressions and body language (D'Mello & Graesser, 2010; McDaniel et al., 2007;
Porayska-Pomsta, Mavrikis, & Pain, 2008; Rosenberg & Ekman, 1994).
Scholastic aptitude (ACT/SAT scores). In order to control for differences in ability,
participants’ self-reported ACT or SAT scores were collected as a measure of scholastic aptitude.
The ACT and SAT are standardized tests that are required for undergraduate college admissions
in the U.S. SAT scores were converted to ACT scores using the ACT-SAT concordance chart
("ACT–SAT Concordance Chart," 2009). Self-reported ACT and SAT scores have been found to
strongly correlate with actual test scores (Cole & Gonyea, 2010), so we have some confidence in
this measure. ACT scores ranged from 14 to 32 with a mean of 21.1 (SD = 3.54). The mean score
is consistent with the 55th percentile based on test takers from 2011 to 2013 ("National Ranks for
Test Scores and Composite Score," 2013).
Procedure
Participants were tested individually over a 1.5-hour session on a Dell PC running
Windows XP SP2. Upon entering the lab, participants signed an informed consent and completed
a demographics survey including a field to self-report ACT/SAT scores. Next, they were
presented with the four devices in four phases each. In phase 1, participants read an illustrated
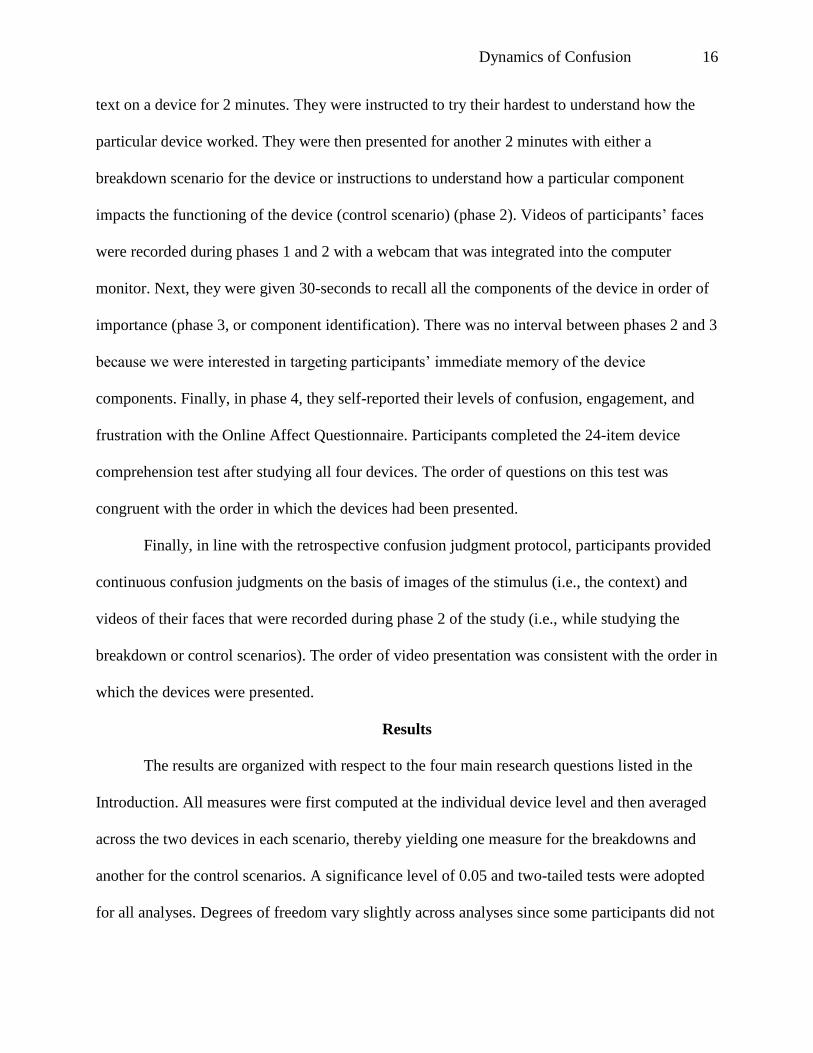
Dynamics of Confusion 16
text on a device for 2 minutes. They were instructed to try their hardest to understand how the
particular device worked. They were then presented for another 2 minutes with either a
breakdown scenario for the device or instructions to understand how a particular component
impacts the functioning of the device (control scenario) (phase 2). Videos of participants’ faces
were recorded during phases 1 and 2 with a webcam that was integrated into the computer
monitor. Next, they were given 30-seconds to recall all the components of the device in order of
importance (phase 3, or component identification). There was no interval between phases 2 and 3
because we were interested in targeting participants’ immediate memory of the device
components. Finally, in phase 4, they self-reported their levels of confusion, engagement, and
frustration with the Online Affect Questionnaire. Participants completed the 24-item device
comprehension test after studying all four devices. The order of questions on this test was
congruent with the order in which the devices had been presented.
Finally, in line with the retrospective confusion judgment protocol, participants provided
continuous confusion judgments on the basis of images of the stimulus (i.e., the context) and
videos of their faces that were recorded during phase 2 of the study (i.e., while studying the
breakdown or control scenarios). The order of video presentation was consistent with the order in
which the devices were presented.
Results
The results are organized with respect to the four main research questions listed in the
Introduction. All measures were first computed at the individual device level and then averaged
across the two devices in each scenario, thereby yielding one measure for the breakdowns and
another for the control scenarios. A significance level of 0.05 and two-tailed tests were adopted
for all analyses. Degrees of freedom vary slightly across analyses since some participants did not
Dynamics of Confusion 17
complete all measures. For example, five participants misunderstood the instructions and
provided sentence-long descriptions of the devices instead of listing the important components;
component identification scores were not computed for these participants. Table 1 presents
descriptive statistics on key dependent measures across breakdown and control scenarios.
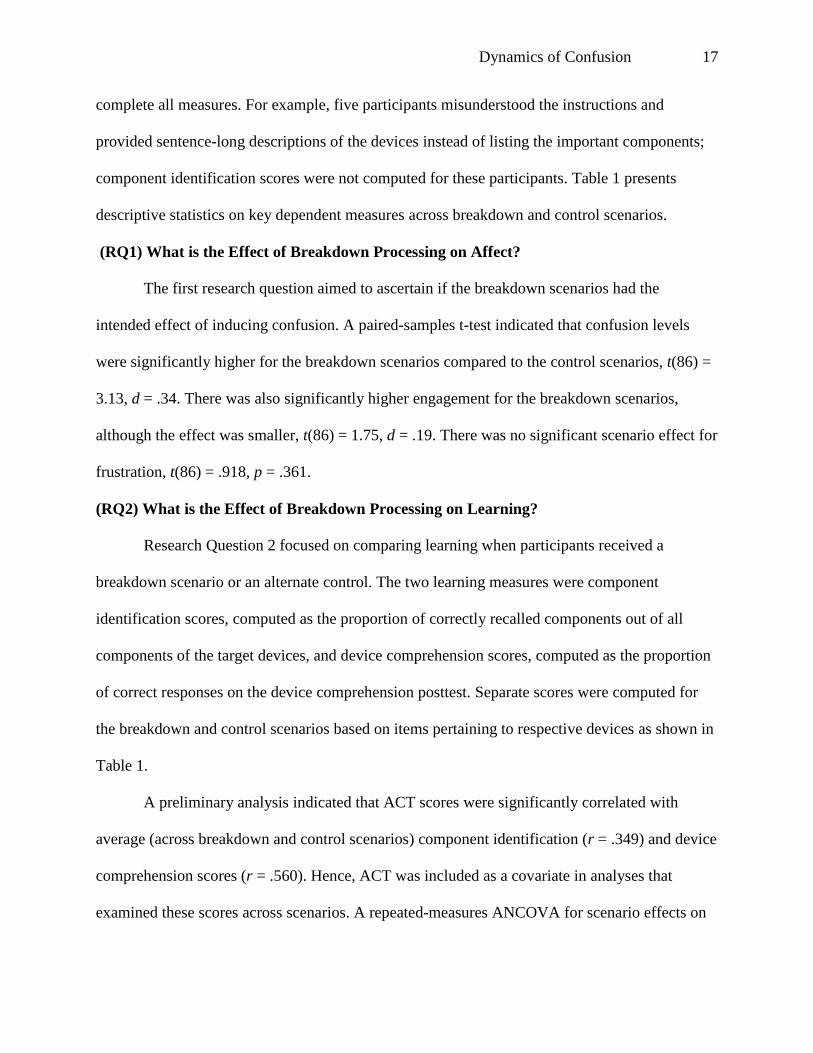
(RQ1) What is the Effect of Breakdown Processing on Affect?
The first research question aimed to ascertain if the breakdown scenarios had the
intended effect of inducing confusion. A paired-samples t-test indicated that confusion levels
were significantly higher for the breakdown scenarios compared to the control scenarios, t(86) =
3.13, d = .34. There was also significantly higher engagement for the breakdown scenarios,
although the effect was smaller, t(86) = 1.75, d = .19. There was no significant scenario effect for
frustration, t(86) = .918, p = .361.
(RQ2) What is the Effect of Breakdown Processing on Learning?
Research Question 2 focused on comparing learning when participants received a
breakdown scenario or an alternate control. The two learning measures were component
identification scores, computed as the proportion of correctly recalled components out of all
components of the target devices, and device comprehension scores, computed as the proportion
of correct responses on the device comprehension posttest. Separate scores were computed for
the breakdown and control scenarios based on items pertaining to respective devices as shown in
Table 1.
A preliminary analysis indicated that ACT scores were significantly correlated with
average (across breakdown and control scenarios) component identification (r = .349) and device
comprehension scores (r = .560). Hence, ACT was included as a covariate in analyses that
examined these scores across scenarios. A repeated-measures ANCOVA for scenario effects on
Dynamics of Confusion 18
component identification scores with ACT as a covariate failed to reach significance, F(1, 77) =
1.11, Mse = .021, p = .295. There was also no significant scenario effect on device
comprehension scores, F(1, 82) = 2.18, Mse = .019, p = .143.
(RQ3) What are the Dynamics of Confusion during Breakdown Processing?
Thus far, our analyses revealed that the breakdown scenarios led to an increase in
confusion compared to the control scenarios, but there were no differences in learning across
scenarios. It might be the case that learning is impacted by the outcome of confusion-resolution
processes induced by the breakdowns. To address this, we analyzed participants’ fine-grained
confusion ratings from the retrospective affect judgment protocol in order to uncover the
dynamics of confusion during the breakdown or control scenarios1. Data from 10 of the
participants in both scenarios and one additional participant in the control scenarios had to be
discarded due to computer failures (dropped frames due to computational load and memory
leaks). Retrospective affect judgments were collected at a sample rate of 1Hz (once per second),
so we proceeded by preparing 120-item time series for each of the remaining participants. As an
initial check of the reliability of these retrospective judgments, we correlated average offline
confusion ratings collected from the retrospective affect judgment procedure (completed after
studying all four devices) with online confusion ratings from the online affective questionnaire
(completed after studying each device). The correlations were significant and strong for both the
breakdown (r = .531) and control (r = .538) scenarios.
A visual analysis (eyeballing) of the confusion time series did not yield any single trend
that was consistently observed across participants (e.g., linear, logarithmic, or exponential
growth, saw tooth patterns). This raised some challenges for the simple curve fitting approaches
1 It should be noted that the offline confusion ratings collected via the retrospective affect judgment protocol were
only used to identify confusion trajectories. All other analyses utilize the confusion ratings from the online affect
questionnaire.
Dynamics of Confusion 19
that are typically used to analyze such data. Hence, we adopted an alternate set of analyses that
were aimed at identifying latent characteristics in participants’ confusion time series.
Principal components analysis on time series. The time series analyses for the
breakdown and control scenarios were processed independently according to the following
procedure, which was inspired by functional principal components analyses (Ramsay &
Silverman, 2005), especially when applied to time series of affective intensities (Verduyn, Van
Mechelen, Tuerlinckx, Meers, & Van Coillie, 2009). The time series were first grouped into time
step × participant matrices, a 120 × 78 matrix for breakdowns and a 120 × 77 for control
scenarios. A principal component analysis was then applied to each matrix, so that participants
who reported similar confusion levels across time would load on to the same component. Time
series associated with the first two components were retained. These components explained a
robust 68.1% of the variance for the breakdown scenarios (Components 1 and 2 explained 40.4%
and 27.7 of the variance, respectively) and 67.1% of the variance for the control scenarios
(Components 1 and 2 explained 41.9% and 25.2% of the variance, respectively).
The two components for the breakdown scenarios are shown in Figure 2. Components for
the control scenario exhibited similar behaviors and are not shown. Component 1 is akin to a
slow nonlinear growth function that appears to be consistent with unresolved confusion. In
contrast, Component 2 is consistent with partially-resolved confusion because confusion is
reduced but never fully dissipates. Specifically, confusion rapidly grows when the breakdown
scenario is presented until it peaks approximately 20 seconds into the breakdown. Confusion
then gradually starts to decay over the remaining time. Interestingly, the two components
intersect approximately 60 seconds (or halfway) into processing the breakdown, but confusion
Dynamics of Confusion 20
for the unresolved component continues to increase while confusion for the partially-resolved
component keeps decreasing.
Cluster analysis. Participants were assigned to either an unresolved or a partially-
resolved confusion group based on whether their time series loaded onto Components 1 and 2,
respectively. This was automatically done with a k-means cluster analysis with the number of
clusters (i.e., the k) set to 2 (for the two components).
For the breakdowns, the clustering resulted in 43 and 35 participants being assigned to
the unresolved and partially-resolved confusion groups, respectively. Descriptives on loadings of
each component (unresolved vs. partially-resolved) on the respective groups (clusters) are shown
in Table 2. An independent samples t-test confirmed that mean loading for the unresolved group
on the unresolved component was significantly greater than the mean loading for the partially-
resolved group on this component, t(76) = 14.3, d = 3.19. Similarly, mean loading of the
unresolved group on the partially-resolved component was significantly lower than the loadings
of the partially-resolved group on this component, t(76) = -12.8, d = -2.94.
The results of the clustering are shown in Figure 3 for the breakdown scenarios. The two
groups are mostly well separated, but there are a small number of participants that lie close to the
boundary line that separates the two groups. We chose to retain these participants in the
subsequent analyses because removal would reduce statistical power. All major patterns were
replicated when we repeated all subsequent analyses after removing these participants.
For the control scenarios, the clustering resulted in 43 and 34 participants in the
unresolved and partially-resolved groups, respectively. Loadings for the unresolved confusion
group were significantly higher on the unresolved confusion component than for the partially-
resolved group, t(75) = 16.2, d = 3.59. Similarly, loadings for the unresolved confusion group
Dynamics of Confusion 21
were significantly lower on the partially-resolved component than for the partially-resolved
group, t(75) = -6.2, d = -0.43. Taken together, these results suggest that the groups were in fact
significantly different with respect to how they loaded onto their respective components.
We further examined if confusion resolution outcomes reflected dispositional (similar
patterns for both scenarios) versus situational (different patterns for each scenario) properties. An
examination of the scenario × confusion resolution contingency table (see Table 3) indicated that
75.3% of the participants showed consistent confusion resolution patterns across scenarios, while
confusion resolution for the remaining 24.7% varied across scenarios. Confusion resolution
across scenarios was also significantly correlated (Spearman rho = .501). Therefore, although
both situational and dispositional patterns were observed, confusion resolution demonstrated
stronger dispositional characteristics.
(RQ4) Is the Outcome of Confusion Resolution Predictive of Affect and Learning?
Now that we categorized participants as either partially-resolving their confusion or
having unresolved confusion for each scenario, we proceed by investigating whether the
outcome of confusion resolution was predictive of key dependent variables, namely online affect
and learning. Differences in ACT scores across the two confusion resolution groups were also
analyzed in order to address ability-related confounds. Table 2 lists descriptive statistics for
affect, ACT, and learning for unresolved and partially-resolved confusion groups across
breakdown and control scenarios.
Affect. Independent samples t-tests comparing confusion-resolution outcomes on affect
measures were conducted. For the breakdown scenarios, there was significantly higher (online)
confusion for the unresolved group compared to the partially-resolved group, t(76) = 2.73, d =
.63. Though expected, this finding provides confirmatory evidence in support of the validity of
Dynamics of Confusion 22
the retrospective affect judgment protocol due to alignment with online judgments of confusion.
There were no significant group differences for engagement (p = .504) and frustration (p = .522).
Similar comparisons for the control scenarios also yielded higher levels of (online) confusion for
the unresolved group compared to the partially-resolved group, t(75) = 2.63, d = .60. There was
no group difference for engagement (p = .103), but the unresolved group reported higher levels
of frustration than the partially-resolved group, t(75) = 4.07, d = .96.
ACT. To address ability-related confounds, we examined if there were group differences
on ACT scores. The analyses revealed that the unresolved group had significantly lower ACT
scores than the partially-resolved group for both the breakdown, t(72) = -2.71, d = -.65, and
control scenarios, t(71) = -2.51, d = -.59 (see Table 2). The participants who resolved their
confusion in both scenarios (M = 22.9, SD = 3.53) also had higher ACT scores that those whose
confusion remained unresolved in both scenarios (M = 20.2, SD = 3.62), t(53) = -2.83, d = .76.
Hence, some of the differences in confusion resolution might be attributed to scholastic aptitude,
which is not entirely unexpected.
Learning. We examined if the two observed patterns of confusion dynamics were
predictive of scores on the component identification and device comprehension tests (see Table
2). The prediction is that learning would be greater for individuals who partially resolve their
confusion compared to those who remain confused. The data were analyzed separately for the
control and breakdown scenarios and for the component identification and device comprehension
tests with four between-subjects ANCOVAs. Confusion resolution group was the independent
variable (unresolved vs. partially-resolved confusion) and ACT scores, engagement, and
frustration ratings were covariates in order to control for these factors.
Dynamics of Confusion 23
For the breakdown scenarios, the main effect of confusion resolution was not significant
for the component identification test, F(1, 67) = 1.21, Mse = .016, p = .276, but was in the
expected direction. There was the expected significant effect for the device comprehension test,
F(1, 69) = 4.13, Mse = .023, with the partially-resolved group outperforming the unresolved
confusion group, d = .63 sigma. There were no significant differences for the control scenarios
on either the component identification test, F(1, 66) = 1.10, Mse = .025, p = .298, or the device
comprehension test, F(1, 68) = .019, Mse = .031, p = .890.
The lack of a significant confusion resolution effect on the component identification test
for both scenarios is perhaps not surprising since this measure simply tests participants’ shallow
recall of device components. However, there was a notable confusion resolution effect for the
device comprehension test, but only for the breakdown scenarios. This might be due to different
confusion levels while studying the breakdowns versus the control scenarios. It might be the case
that participants need to experience a certain threshold of confusion in order for meaningful
confusion resolution to occur. Confusion levels for the breakdown scenarios were higher than the
control scenarios (d = .34), which might explain why a positive effect of confusion resolution on
device comprehension was observed for the breakdown but not the control scenarios.
To test this possibility, we assigned participants to a high vs. low confusion group by
performing a median split on their online confusion judgments. Since confusion levels for the
breakdown scenarios were higher than the control scenarios, the median was identified from the
pooled distribution of both scenarios2. The median of 2.5 (on a 1-6 point scale) significantly
separated high from low confused participants for both scenarios (d = 3.12 sigma for breakdown
and d = 3.36 sigma for control scenarios). Importantly, confusion levels associated with
2 We also split the groups based on each distribution independently, but this did not change the results.
Dynamics of Confusion 24
breakdown and control scenarios were not significantly different for either the low, paired-
samples t(34) = -1.61, p = .117, or high confusion groups, t(25) = -1.00, p = .327.
We repeated the four ANCOVAs with an added confusion level × confusion resolution
interaction term. The interaction is depicted in Figure 4. For the breakdown scenarios, significant
interactions were discovered for both the component identification, F(1, 65) = 4.45, Mse = .016,
and device comprehension tests, F(1, 67) = 4.21, Mse = .022. Pairwise comparisons indicated
that participants in the high confusion group who partially resolved their confusion scored higher
on both the component identification, F(1, 65) = 5.61, Mse = .016, d = 1.1 sigma, and device
comprehension tests, F(1, 67) = 8.92, Mse = .022, d = 1.3 sigma. For participants in the low
confusion group, there was no confusion resolution effect for either the component identification
test, F(1, 65) = .247, Mse = .016, p = .621, or the device comprehension test, F(1, 67) = .064,
Mse = .022, p = .802.
For the control scenarios, the interaction term failed to reach statistical significance for
either the component identification, F(1, 64) = .759, Mse = .025, p = .387 or the device
comprehension test, F(1, 66) = 1.32, Mse = .031, p = .255. However, as can be seen in the
interaction plots in Figure 4, there is a trend in favor of participants who partially resolved their
confusion outperforming those with unresolved confusion, but only for the high confusion group.
General Discussion
We were interested in analyzing the affective dimensions of problem solving and learning
under cognitive disequilibrium. We conducted an experiment to answer four basic research
questions on the role of cognitive disequilibrium and confusion during device comprehension in
the presence of breakdown scenarios. In this section, we discuss our findings within the context
of our four research questions and consider limitations and possible avenues for future work.
Dynamics of Confusion 25
Summary of Findings with Respect to Research Questions
The present research was grounded in theories that highlight the role of impasses,
cognitive disequilibrium, and confusion during complex learning and problem solving (Berlyne,
1960, 1978; Chinn & Brewer, 1993; Collins, 1974; Festinger, 1957; Graesser & Olde, 2003;
Laird et al., 1987; Limón, 2001; Miyake & Norman, 1979; Mugny & Doise, 1978; Piaget, 1952;
Schank, 1999). These theories posit that individuals would experience cognitive disequilibrium
when confronted with discrepant events in the form of impasses, anomalies, and clashes with
prior knowledge. Thus, within the context of the present experiment, a breakdown scenario was
expected to trigger impasses and put participants in a state of cognitive disequilibrium where
they would experience confusion. To test this hypothesis, our first research question (RQ1)
attempted to identify the affective states that accompany breakdown processing. When compared
to control scenarios, we found that the breakdown scenarios elicited higher levels of confusion
(small3 to medium effect of .34 sigma) and engagement (small effect of .19 sigma), but not
frustration. In addition to confirming a key prediction of these theories, these data provide
experimental evidence for Graesser et al.’s (2005) correlational finding that the breakdowns
induce cognitive disequilibrium and its affiliated affective state of confusion.
Some of the theories that underlie this research would also accommodate the claim that
confusion might be beneficial to learning because it provides an opportunity for deeper
processing when an individual successfully revises or extends his or her existing mental model
during the confusion resolution process. To test this claim, we compared the quality of device
models (learning) when participants processed the breakdowns compared to the control scenarios
(RQ2). Comparisons of scores on the component identification and device comprehension tests
associated with each scenario did not result in any significant differences. There is, of course, the
3 Using Cohen’s (1992) guidelines of 0.2, 0.5, and 0.8 sigma for small, medium, and large effects, respectively.
Dynamics of Confusion 26
possibility that our sample was underpowered to detect a significant effect. However, a power
analysis (power of 0.8 and alpha of 0.05) indicated that the sample was sufficiently large to
detect effects of 0.30 sigma of higher with a two-tailed ANCOVA with one covariate (ACT
scores). We still cannot claim, however, that there were no differences in learning across
scenarios because our sample was insufficiently powered to detect very small effects.
Perhaps a more fundamental question pertains to the relationship between breakdown-
induced confusion levels and learning. While a simple view would posit that confusion should be
negatively associated with learning, in addition to a non-significant breakdown vs. control
difference, confusion levels themselves were non-significantly and only weakly correlated with
performance on the device comprehension test (r = -.148 and r = -.050 for breakdown and
control scenarios, respectively). Does this lack of a correlation with learning imply that
confusion is merely an incidental affective state that is inconsequential for learning? We adopt a
different view by suggesting that the role of confusion in learning might be better explained by
the outcome of confusion resolution than on the overall levels of confusion.
The next set of analyses tested this claim by tracking the dynamics of confusion while
processing the breakdowns and control scenarios (RQ3). A principal components analysis
followed by k-means clustering was applied to time series of participants’ offline confusion
ratings. We discovered two confusion trajectories that were consistent with unresolved versus
partially-resolved confusion and these components explained a robust amount of the variance
(67%-68%). As a point of comparison, the third principal component explained a mere 6.8% and
8.6% of the variance for the breakdown and control scenarios, respectively. This suggests that
the two confusion trajectories were representative of the dominant patterns in the data.
Dynamics of Confusion 27
An analysis of whether confusion resolution outcomes were dispositional (similar
patterns for both scenarios) versus situational (different patterns for each scenario) indicated that
they were largely consistent across scenarios (dispositional for 75.3% of participants). It was also
discovered that ACT scores separated those who partially resolved their confusion from those
who were unsuccessful at confusion resolution (for both scenarios). This is not entirely
surprising given the difficulty and unscaffolded nature of the device comprehension task.
The two confusion resolution trajectories were then examined to ascertain if they were
predictive of affect and learning (RQ4). We confirmed that individuals who were assigned to the
partially-resolved confusion group based on their offline confusion trajectories did in fact report
lower confusion levels on the online affect questionnaire than those designated as having
unresolved confusion. This provided some evidence for the validity of our approach towards
analyzing confusion trajectories. Given the inherent correlational nature of the confusion
resolution analyses, we covaried ACT scores, frustration, and engagement, when analyzing
relationships between confusion resolution and learning. We discovered that individuals who
partially resolved their confusion outperformed their unresolved counterparts, but only for the
device comprehension test and only when processing the breakdown scenarios. The lack of a
confusion resolution effect for the control scenarios made us consider the possibility that
confusion levels might moderate the effect of confusion resolution on learning. This conjecture
was supported for the breakdown scenarios when we discovered that the participants who
partially resolved their confusion outperformed those with unresolved confusion on both
knowledge tests, but only when confusion levels were high. A similar pattern was discovered for
the control scenarios, although the differences did not approach significance. In general, these
Dynamics of Confusion 28
findings support the conclusion that confusion needs to exceed a certain threshold for meaningful
confusion resolution to occur.
One puzzling item, however, pertains to a lack of any learning benefit for the breakdown
compared to the control scenarios. To shed some light on this issue, we conducted an exploratory
analysis to ascertain what factors, if any, could predict higher learning for the breakdown over
the control scenarios. The analysis proceeded by computing the difference between device
comprehension scores for the breakdowns vs. the control scenarios (a higher score would
indicate that learning was greater for breakdown over control scenarios). The difference score
was then regressed on ACT, engagement, frustration, and outcome of confusion resolution
(partially-resolved coded as 1 vs. unresolved coded as 0) for both scenarios (seven predictors in
all). Confusion was not included as a predictor since it is correlated with confusion resolution
outcomes. A significant model was discovered, F(2, 75) = 4.50, R2adj. = .083. Engagement
levels while processing the breakdowns emerged as a significant predictor (β = .266), while the
outcome of confusion resolution during breakdown processing approached significance (β =
.213, p = .055)4. Thus, actively engaging in processing the breakdowns and partial confusion
resolution were both predictive of greater learning from the breakdowns versus control scenarios.
While at first blush, the lack of a direct breakdown vs. control learning effect appeared to
contradict a key claim of theories of impasse-driven learning and merits of cognitive
disequilibrium, a more careful analysis of the data yielded more nuanced patterns. Specifically,
the learning benefits of confusion appear to be predicated on the individual: (a) exceeding a
threshold of confusion to encourage active engagement in confusion resolution, (b) having the
4 In lieu of difference scores, an additional model that regressed breakdown device comprehension scores on
breakdown engagement and confusion resolution after covarying ACT and control device comprehension scores was
also significant, F(4, 73) = 17.0, R2adj.= .467. Both breakdown engagement (β = .311) and breakdown confusion
resolution (β= .197) were significant predictors.
Dynamics of Confusion 29
requisite knowledge and ability to effectively resolve his or her confusion, and (c) completely or
partially resolve the confusion. In essence, impasses and confusion do not guarantee learning, but
provide opportunities for learning by encouraging deeper processing.
Limitations and Future Work
There are a number of limitations with the present experiment that should be addressed in
subsequent studies. First, we did not collect any data on participants’ cognitive states while they
were comprehending the devices. This made it difficult to identify what led to the partial
resolution of confusion. For example, is there a eureka (i.e., “aha”) moment when an individual
discovers a relevant insight that can resolve the source of a discrepancy? A more detailed
examination of the cognitive processes involved in confusion resolution would be needed to
answer this question. One possibility is to ask participants to think-aloud (Ericsson & Simon,
1993) while they are problem solving. This was not done in the present study due to concerns
that thinking aloud might interfere with the primary task. Nevertheless, collecting and coding
think-aloud protocols would have potentially provided insights into participants’ cognitive states
and could have revealed some of the cognitive processes that underlie confusion resolution.
A second limitation is that self-reports served as the only measure of affect. Self-reports
are advantageous because they are easy to administer and can be interpreted at face value.
However, their validity depends upon a number of factors that are outside of the control of the
researcher (Rasinski, Visser, Zagatsky, & Rickett, 2005; Tourangeau & Yan, 2007). Therefore, it
would be advisable to include objective affective measures, such as physiological monitoring
and/or facial expression analysis to complement the subjective self-reports.
A third limitation pertains to the items from the device comprehension test. These items
were taken from previous studies with these devices (Graesser et al., 2005; Graesser & Olde,
Dynamics of Confusion 30
2003) where they were found to be quite diagnostic of participants’ device models. However,
there were only six items per device, and these items focused on each device as a whole, instead
of emphasizing specific device components that are aligned with the breakdown scenarios. It
might have been the case that when studying the breakdown scenarios, participants could have
developed better device models for the aspects of the devices that were more closely related to
the breakdowns, but there is no way to test this hypothesis with the current items. On a related
note, the device comprehension test only included three answer options per question, which
increases the amount of noise due to guessing. Another test-related limitation is the lack of a
pretest, which would have been helpful to study learning gains by covarying out prior
knowledge. Hence, future work should focus on improving the knowledge assessments used in
this study by expanding the set of items, including breakdown-specific questions, increasing the
number of alternatives per question or collecting free responses by asking participants to explain
the functioning of the devices, and including a pretest so prior knowledge can be measured and
analyzed.
Another limitation of this experiment pertains to the time allotted to study each device
(two minutes) and to process the breakdowns (an additional two minutes). There was the concern
that the relatively short time span of four minutes per device might not have been sufficient for
such a complex task. This might explain why we did not discovered any trajectories consistent
with fully-resolved confusion as the two minute breakdown study time might not be sufficient
for complete confusion resolution to occur. There is the tradeoff between increasing study time
while simultaneously keeping fatigue under check, so pilot studies that vary study time might be
needed to select an appropriate cutoff to balance these factors.
Dynamics of Confusion 31
Concluding Remarks
Cognitive disequilibrium and confusion are very relevant to complex learning and
problem solving because these activities inherently involve impasses and failure, which trigger a
host of cognitive and affective states. Although the role of cognitive disequilibrium on learning
has been known for decades (Festinger, 1957; Lazarus, 1991; Mandler, 1976, 1999; Piaget, 1952;
Stein & Levine, 1991), little is known about the trajectory of cognitive-affective processes over
time and also the impact of these trajectories on performance. The present research empirically
contributed to this area by analyzing affective states during breakdown processing, investigating
trajectories of confusion during breakdown processing, ascertaining whether confusion
resolution outcomes were predictive of affect and learning, and investigating the conditions
when breakdowns were associated with increased learning over controls. It also made a
theoretical contribution by expanding or refining existing theories to take into consideration
levels of confusion and the outcomes of confusion resolution on learning. Further theoretical
development and empirical research is needed to more carefully elucidate the factors that
underlie these relationships. These presumably include the complexity of the stimuli and tasks,
as well as the person’s cognitive appraisal of the situation, their attribution, goals, meta-
knowledge, and the social context (Clore & Huntsinger, 2007; Fielder, 2001; Ortony et al., 1988;
Scherer, 2009). Understanding how these factors interact and influence cognitive and affective
processes during learning and problem solving is an important direction for future research.
Although there is much more to be done, the empirical and theoretical contributions of this work
should be useful to researchers or educators interested in the use of cognitive conflict as an
instructional strategy to promote deeper learning in classrooms.

Dynamics of Confusion 32
References
ACT–SAT Concordance Chart. (2009). Retrieved April 26, 1010, from ACT
http://www.act.org/aap/concordance/
Ahn, W., & Kalish, C. (2000). The role of mechanism beliefs in causal reasoning. In F. C. Keil
& R. A. Wilson (Eds.), Cognition and explanation. Boston, MA: MIT Press.
Berlyne, D. (1960). Conflict, arousal, and curiosity. New York: McGraw-Hill Inc.
Berlyne, D. (1978). Curiosity in learning. Motivation and Emotion, 2, 97-175. doi:
10.1007/BF00993037
Bosch, N., D’Mello, S., & Mills, C. (2013). What Emotions Do Novices Experience during Their
First Computer Programming Learning Session? In K. Yacef, C. Lane, J. Mostow & P.
Pavlik (Eds.), Proceedings of the 16th International Conference on Artificial Intelligence
in Education (AIED 2013) (pp. 11-20). Berlin Heidelberg: Springer-Verlag.
Brown, J., & VanLehn, K. (1980). Repair theory: A generative theory of bugs in procedural
skills. Cognitive Science, 4(379-426,). doi: 10.1016/S0364-0213(80)80010-3
Carroll, J., & Kay, D. (1988). Prompting, feedback and error correction in the design of a
scenario machine. International Journal of Man-Machine Studies, 28(1), 11-27. doi:
10.1016/S0020-7373(88)80050-6
Chinn, C., & Brewer, W. (1993). The role of anomalous data in knowledge acquisition - A
theoretical framework and implications for science instruction. Review of Educational
Research, 63(1), 1-49. doi: 10.2307/1170558
Clore, G. L., & Huntsinger, J. R. (2007). How emotions inform judgment and regulate thought.
Trends in Cognitive Sciences, 11(9), 393-399. doi: 10.1016/j.tics.2007.08.005
Cohen, J. (1992). A power primer. Psychological Bulletin, 112(1), 155-159.
Dynamics of Confusion 33
Cole, J. S., & Gonyea, R. M. (2010). Accuracy of self-reported SAT and ACT test scores:
Implications for research. Research in Higher Education, 51(4), 305-319. doi:
10.1007/s11162-009-9160-9
Collins, A. (1974). Reasoning from incomplete knowledge. Bulletin of the Psychonomic Society,
4, 254-254.
Craig, S., D'Mello, S., Witherspoon, A., & Graesser, A. (2008). Emote aloud during learning
with AutoTutor: Applying the facial action coding system to cognitive-affective states
during learning. Cognition & Emotion, 22(5), 777-788.
Craig, S., Graesser, A., Sullins, J., & Gholson, J. (2004). Affect and learning: An exploratory
look into the role of affect in learning. Journal of Educational Media, 29, 241-250.
Craik, F. I. M., & Lockhart, R. S. (1972). Levels of processing: A framework for memory
research. Journal of Verbal Learning and Verbal Behavior, 11, 671-684. doi:
10.1016/S0022-5371(72)80001-X
Craik, F. I. M., & Tulving, E. (1975). Depth of processing and the retention of words in episodic
memory. Journal of Experimental Psychology: General, 104, 268-294. doi:
10.1037//0096-3445.104.3.268
D'Mello, S., & Graesser, A. (2010). Multimodal semi-automated affect detection from
conversational cues, gross body language, and facial features. User Modeling and User-
adapted Interaction, 20(2), 147-187.
D'Mello, S., & Graesser, A. (2012). Dynamics of affective states during complex learning.
Learning and Instruction, 22(2), 145-157. doi: 10.1016/j.learninstruc.2011.10.001
D'Mello, S., Lehman, S., Pekrun, R., & Graesser, A. (2014). Confusion can be beneficial for
learning. Learning and Instruction, 29(1), 153-170.
Dynamics of Confusion 34
D'Mello, S. K., & Graesser, A. C. (2014). Confusion. In R. Pekrun & L. Linnenbrink-Garcia
(Eds.), International handbook of emotions in education (pp. 289-310). New York, NY:
Routledge.
D’Mello, S., & Graesser, A. (2011). The half-life of cognitive-affective states during complex
learning. Cognition & Emotion, 25(7), 1299-1308.
Ellsworth, P. C. (2003). Confusion, concentration, and other emotions of interest: Commentary
on Rozin and Cohen (2003). Emotion, 3(1), 81-85.
Ericsson, K., & Simon, H. (1993). Protocol analysis: Verbal reports as data (Rev. ed.).
Cambridge, MA: The MIT Press.
Festinger, L. (1957). A theory of cognitive dissonance. Stanford, CA: Stanford University Press.
Fielder, K. (2001). Affective states trigger processes of assimilation and accommodation. In K.
Martin & G. Clore (Eds.), Theories of Mood and Cognition: A User’s Guidebook (pp. 85-
98). Mahwah, NJ: Erlbaum.
Frijda, N. H. (1986). The emotions: Cambridge University Press.
Graesser, A., Chipman, P., King, B., McDaniel, B., & D'Mello, S. (2007). Emotions and learning
with AutoTutor. In R. Luckin, K. Koedinger & J. Greer (Eds.), Proceedings of the 13th
International Conference on Artificial Intelligence in Education (pp. 569-571).
Amsterdam: IOS Press.
Graesser, A., & Clark, L. C. (1985). Structures and procedures of implicit knowledge. Norwood,
NJ: Ablex.
Graesser, A., Lu, S., Olde, B., Cooper-Pye, E., & Whitten, S. (2005). Question asking and eye
tracking during cognitive disequilibrium: Comprehending illustrated texts on devices
Dynamics of Confusion 35
when the devices break down. Memory and Cognition, 33, 1235-1247. doi:
10.3758/BF03193225
Graesser, A., & Olde, B. (2003). How does one know whether a person understands a device?
The quality of the questions the person asks when the device breaks down. Journal of
Educational Psychology, 95(3), 524-536. doi: 10.1037/0022-0663.95.3.524
Hegarty, M., & Just, M. (1993). Constructing mental models of machines from text and
diagrams. Journal of Memory and Language, 32(6), 717-742.
Hegarty, M., Just, M. A., & Morrison, I. R. (1988). Mental models of mechanical systems -
Individual differences in qualitative and quantitative reasoning. [Article]. Cognitive
Psychology, 20(2), 191-236.
Hegarty, M., Narayanan, N. H., & Freitas, P. (2002). Understanding machines from multimedia
and hypermedia presentations. In J. Otero & A. Graesser (Eds.), The Psychology of
Science Text Comprehension (pp. 357-384). Mahwah, NJ.: Lawrence Erlbaum Associate.
Hess, U. (2003). Now you see it, now you don’t - the confusing case of confusion as an emotion:
Commentary on Rozin and Cohen (2003). Emotion, 3(1), 76-80.
Izard, C. (2010). The many meanings/aspects of emotion: Definitions, functions, activation, and
regulation. Emotion Review, 2(4), 363-370. doi: 10.1177/1754073910374661
Johnson-Laird, P. N. (2006). How We Reason. New York: Oxford University Press.
Keltner, D., & Shiota, M. (2003). New displays and new emotions: A commentary on Rozin and
Cohen (2003). Emotion, 3, 86-91. doi: 10.1037/1528-3542.3.1.86
Kieras, D. E., & Bovair, S. (1984). The role of a mental model in learning to operate a device.
Cognitive Science, 8(3), 255-273.
Dynamics of Confusion 36
Laird, J. E., Newell, A., & Rosenbloom, P. S. (1987). Soar - An architecture for general
intelligence. Artificial Intelligence, 33(1), 1-64. doi: 10.1016/0004-3702(87)90050-6
Lazarus, R. (1991). Emotion and adaptation. New York: Oxford University Press.
Limón, M. (2001). On the cognitive conflict as an instructional strategy for conceptual change: a
critical appraisal. Learning and Instruction, 11(4–5), 357-380. doi: 10.1016/s0959-
4752(00)00037-2
Macaulay, D. (1988). The way things work. Boston, MA.: Houghton Mifflin.
Mandler, G. (1976). Mind and emotion. New York: Wiley.
Mandler, G. (1990). Interruption (discrepancy) theory: Review and extensions. In S. Fisher & C.
L. Cooper (Eds.), On the Move: The Psychology of Change and Transition (pp. 13-32).
Chichester: Wiley.
Mandler, G. (1999). Emotion. In B. M. Bly & D. E. Rumelhart (Eds.), Cognitive science.
Handbook of perception and cognition (2nd ed., pp. 367-382). San Diego, CA: Academic
Press.
McDaniel, B., D’Mello, S., King, B., Chipman, P., Tapp, K., & Graesser, A. (2007). Facial
features for affective state detection in learning environments. In D. McNamara & G.
Trafton (Eds.), Proceedings of the 29th Annual Meeting of the Cognitive Science Society
(pp. 467-472). Austin, TX: Cognitive Science Society.
Miyake, N., & Norman, D. (1979). To ask a question, one must know enough to know what is
not known. Journal of Verbal Learning and Verbal Behavior, 18(3), 357-364. doi:
10.1016/S0022-5371(79)90200-7
Mugny, G., & Doise, W. (1978). Socio-cognitive conflict and structure of individual and
collective performances. European Journal of Social Psychology, 8(2), 181-192.
Dynamics of Confusion 37
National Ranks for Test Scores and Composite Score. (2013). from ACT
http://www.actstudent.org/scores/norms1.html
Ortony, A., Clore, G., & Collins, A. (1988). The cognitive structure of emotions. New York:
Cambridge University Press.
Pekrun, R., & Stephens, E. J. (2011). Academic emotions. In K. Harris, S. Graham, T. Urdan, S.
Graham, J. Royer & M. Zeidner (Eds.), APA educational psychology handbook, Vol 2:
Individual differences and cultural and contextual factors (pp. 3-31). Washington, DC:
American Psychological Association.
Piaget, J. (1952). The origins of intelligence. New York: International University Press.
Porayska-Pomsta, K., Mavrikis, M., & Pain, H. (2008). Diagnosing and acting on student affect:
the tutor's perspective. User Modeling and User-Adapted Interaction, 18(1-2), 125-173.
doi: 10.1007/s11257-007-9041-x
Ramsay, J., & Silverman, B. W. (2005). Functional data analysis. New York: Springer.
Rasinski, K. A., Visser, P. S., Zagatsky, M., & Rickett, E. M. (2005). Using implicit goal
priming to improve the quality of self-report data. Journal of Experimental Social
Psychology, 41(3), 321-327. doi: 10.1016/j.jesp.2004.07.001
Rosenberg, E., & Ekman, P. (1994). Coherence between expressive and experiential systems in
emotion. Cognition & Emotion, 8(3), 201-229.
Rozenblit, L., & Keil, F. (2002). The misunderstood limits of folk science: an illusion of
explanatory depth. Cognitive Science, 26(5), 521-562.
Rozin, P., & Cohen, A. (2003a). High frequency of facial expressions corresponding to
confusion, concentration, and worry in an analysis of maturally occurring facial
expressions of Americans. Emotion, 3, 68-75.
Dynamics of Confusion 38
Rozin, P., & Cohen, A. B. (2003b). Reply to commentaries: Confusion infusions, suggestives,
correctives, and other medicines. Emotion, 3(1), 92-96.
Schank, R. (1999). Dynamic Memory Revisited: Cambridge University Press.
Scherer, K., Schorr, A., & Johnstone, T. (Eds.). (2001). Appraisal processes in emotion: Theory,
methods, research. London: London University Press.
Scherer, K. R. (2009). The dynamic architecture of emotion: Evidence for the component
process model. Cognition & Emotion, 23(7), 1307-1351. doi:
10.1080/02699930902928969
Schwarz, N. (2012). Feelings-as-Information Theory. In P. Van Lange, A. Kruglanski & T.
Higgins (Eds.), Handbook of theories of social psychology (pp. 289-308). Thousand
Oaks, CA: Sage.
Schwarz, N., & Skurnik, I. (2003). Feeling and thinking: Implications for problem solving. In J.
Davidson & R. Sternberg (Eds.), The Psychology of Problem Solving (pp. 263-290). New
York: Cambridge University Press.
Siegler, R., & Jenkins, E. (Eds.). (1989). Strategy discovery and strategy generalization.
Hillsdale, NJ,: Lawrence Erlbaum Associates.
Silvia, P. J. (2009). Looking past pleasure: Anger, confusion, disgust, pride, surprise, and other
unusual aesthetic emotions. Psychology of Aesthetics Creativity and the Arts, 3(1), 48-51.
doi: 10.1037/a0014632
Silvia, P. J. (2010). Confusion and interest: The role of knowledge emotions in aesthetic
experience. Psychology of Aesthetics Creativity and the Arts, 4, 75-80. doi:
10.1037/a0017081

Dynamics of Confusion 39
Smith, C., & Ellsworth, P. (1985). Patterns of Cognitive Appraisal in Emotion. Journal of
Personality and Social Psychology, 48(4), 813-838.
Stein, N., & Levine, L. (1991). Making sense out of emotion. In W. Kessen, A. Ortony & F.
Kraik (Eds.), Memories, thoughts, and emotions: Essays in honor of George Mandler
(pp. 295-322). Hillsdale, NJ: Erlbaum.
Tourangeau, R., & Yan, T. (2007). Sensitive questions in surveys. Psychological Bulletin,
133(5), 859. doi: 10.1037/0033-2909.133.5.859
VanLehn, K., Siler, S., Murray, C., Yamauchi, T., & Baggett, W. (2003). Why do only some
events cause learning during human tutoring? Cognition and Instruction, 21(3), 209-249.
doi: 10.1207/S1532690XCI2103_01
Verduyn, P., Van Mechelen, I., Tuerlinckx, F., Meers, K., & Van Coillie, H. (2009). Intensity
profiles of emotional experience over time. Cognition and Emotion, 23(7), 1427-1443.

Dynamics of Confusion 40
Author Notes
We thank Shulan Lu and Brent Olde for sharing experimental materials and Rebekah
Combs, Rosaire Daigle, Blair Lehman, and Kimberly Vogt for their invaluable assistance with
data collection.
This research was supported by the National Science Foundation (ITR 0325428, HCC
0834847, and DRL 1235958). Any opinions, findings and conclusions, or recommendations
expressed in this paper are those of the authors and do not necessarily reflect the views of NSF.

Dynamics of Confusion 41
Table 1.
Descriptive statistics for affect and learning measures for breakdown and control scenarios.
Breakdown Control
Measure M (SD) M (SD) r d
Affect
Confusion 2.84 (1.44) 2.39 (1.22) **.508 **.34
Engagement 3.61 (1.53) 3.37 (1.45) **.646 *.19
Frustration 2.09 (1.33) 1.98 (1.09) **.574 .10
Learning
Component Identification .337 (.135) .363 (.164) .099 -.13
Device Comprehension .591 (.194) .624 (.183) **.458 -.17
Note. ** p < .05; * p < .10; r is correlation of measures across scenarios; d is effect size for
scenario on each measure. Learning measures are the proportion of correct responses on the
component identification and device comprehension tests.
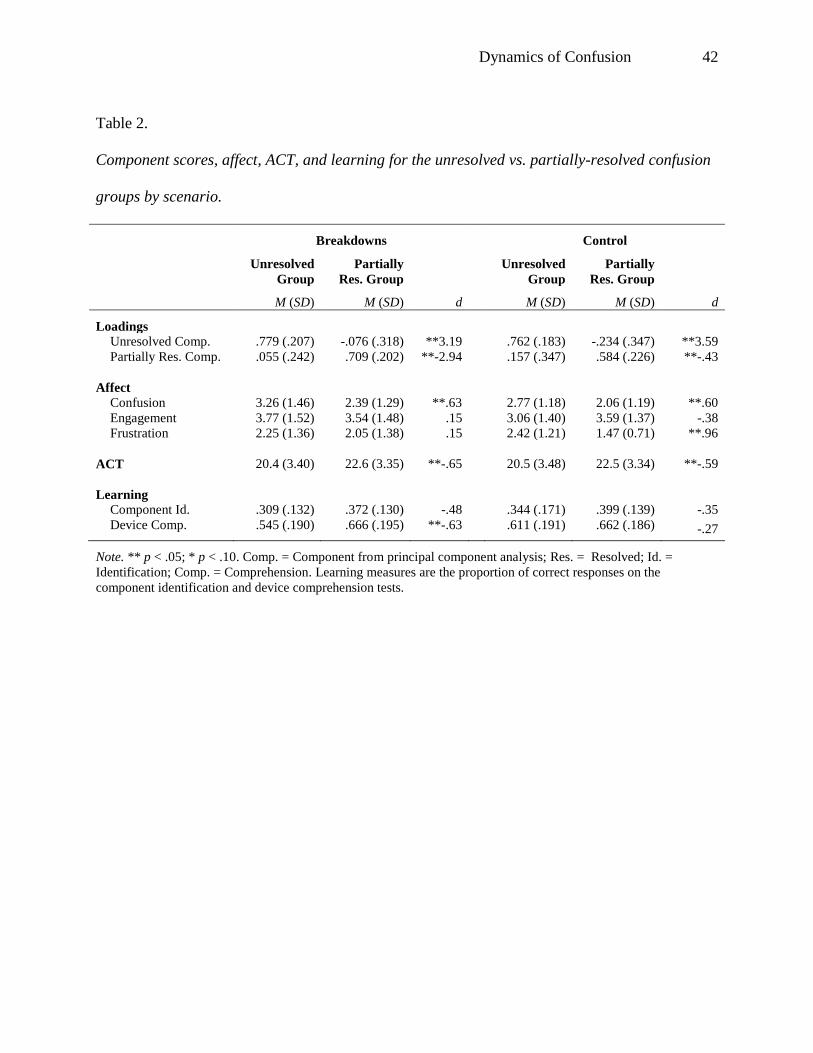
Dynamics of Confusion 42
Table 2.
Component scores, affect, ACT, and learning for the unresolved vs. partially-resolved confusion
groups by scenario.
Breakdowns Control
Unresolved
Group
Partially
Res. Group
Unresolved
Group
Partially
Res. Group
M (SD) M (SD) d M (SD) M (SD) d
Loadings
Unresolved Comp. .779 (.207) -.076 (.318) **3.19 .762 (.183) -.234 (.347) **3.59
Partially Res. Comp. .055 (.242) .709 (.202) **-2.94 .157 (.347) .584 (.226) **-.43
Affect
Confusion 3.26 (1.46) 2.39 (1.29) **.63 2.77 (1.18) 2.06 (1.19) **.60
Engagement 3.77 (1.52) 3.54 (1.48) .15 3.06 (1.40) 3.59 (1.37) -.38
Frustration 2.25 (1.36) 2.05 (1.38) .15 2.42 (1.21) 1.47 (0.71) **.96
ACT 20.4 (3.40) 22.6 (3.35) **-.65 20.5 (3.48) 22.5 (3.34) **-.59
Learning
Component Id. .309 (.132) .372 (.130) -.48 .344 (.171) .399 (.139) -.35
Device Comp. .545 (.190) .666 (.195) **-.63 .611 (.191) .662 (.186) -.27
Note. ** p < .05; * p < .10. Comp. = Component from principal component analysis; Res. = Resolved; Id. =
Identification; Comp. = Comprehension. Learning measures are the proportion of correct responses on the
component identification and device comprehension tests.
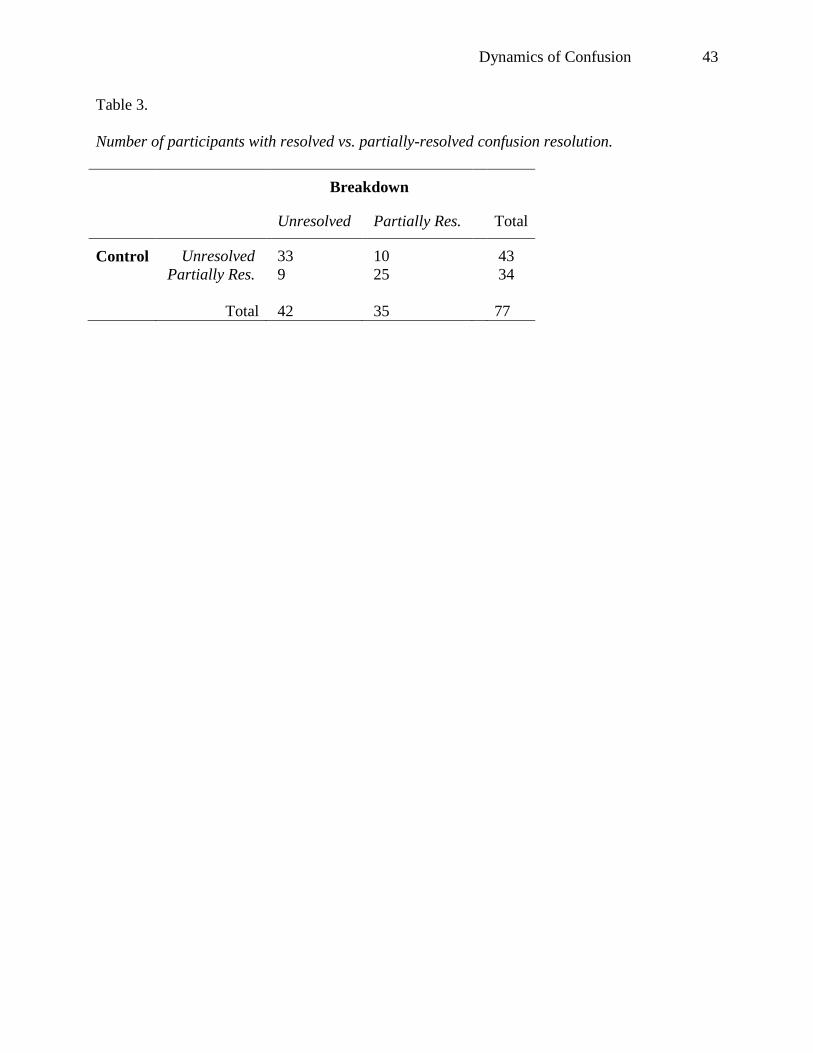
Dynamics of Confusion 43
Table 3.
Number of participants with resolved vs. partially-resolved confusion resolution.
Breakdown
Unresolved Partially Res. Total
Control Unresolved 33 10 43
Partially Res. 9 25 34
Total 42 35 77

Dynamics of Confusion 44
Figure Captions
Figure 1. Illustrated text of the cylinder lock obtained from the book The Way Things Work
(Macaulay, 1988).
Figure 2. Observed confusion dynamics for breakdown scenarios.
Figure 3. Results of cluster analysis on component loadings for breakdown scenarios.
Figure 4. Interaction between confusion levels (low vs. high) and confusion resolution.
(unresolved vs. partially-resolved) for component identification (left column) and device
comprehension (right column) by scenario (breakdown on top row, control on bottom
row). Scores are covariate adjusted means of learning measures computed as the
proportion of correct responses on the component identification and device
comprehension tests. ** indicate that comparison is significant at p < .05.
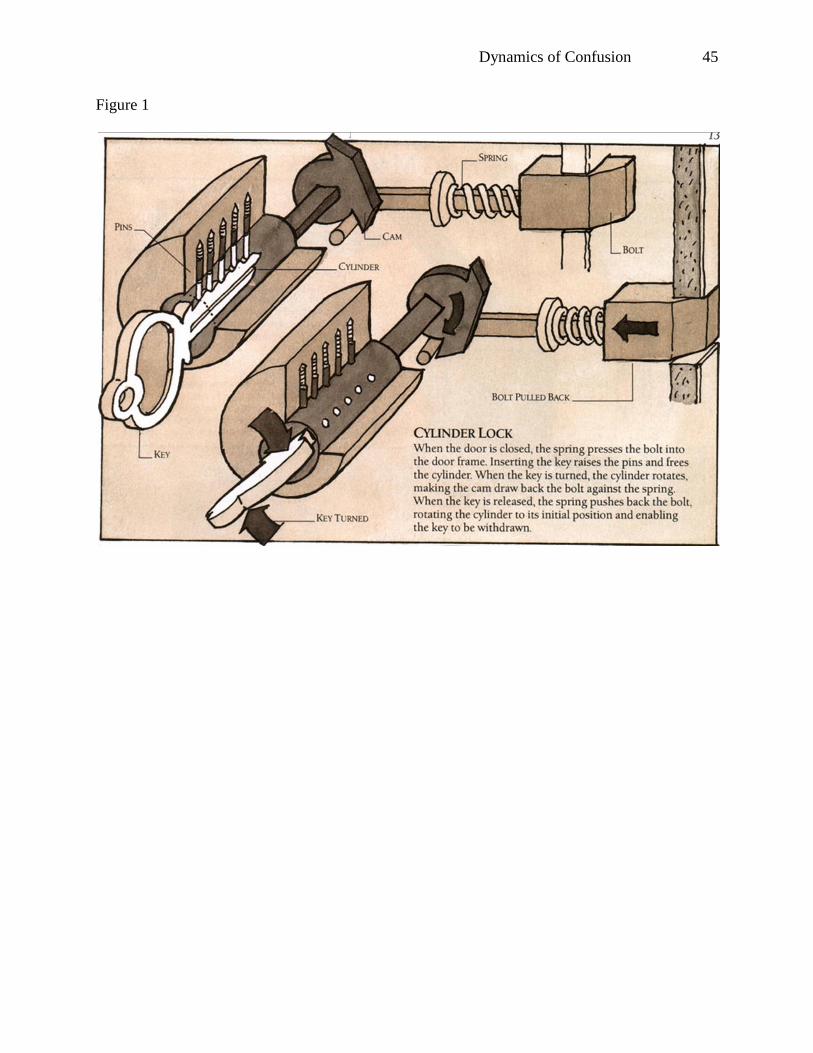
Dynamics of Confusion 45
Figure 1
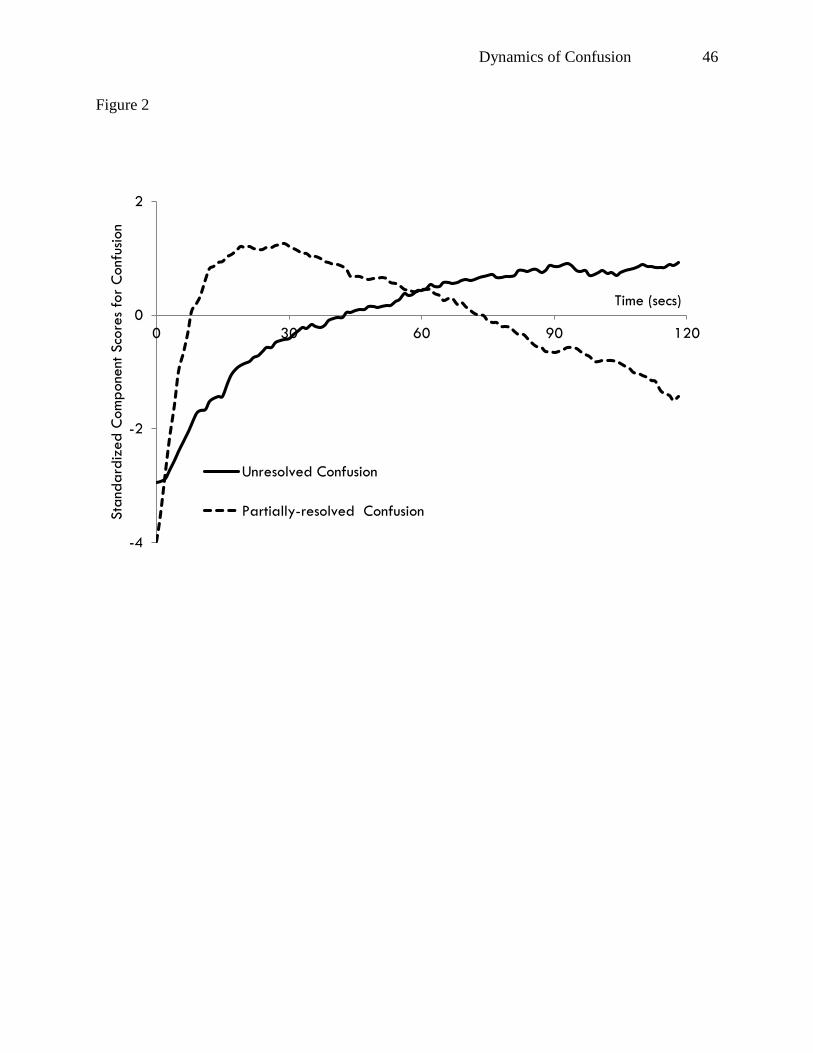
Dynamics of Confusion 46
Figure 2
-4
-2
0
2
0 30 60 90 120
Sta
ndard
ized C
om
pone
nt S
core
s fo
r C
onf
usio
n
Time (secs)
Unresolved Confusion
Partially-resolved Confusion
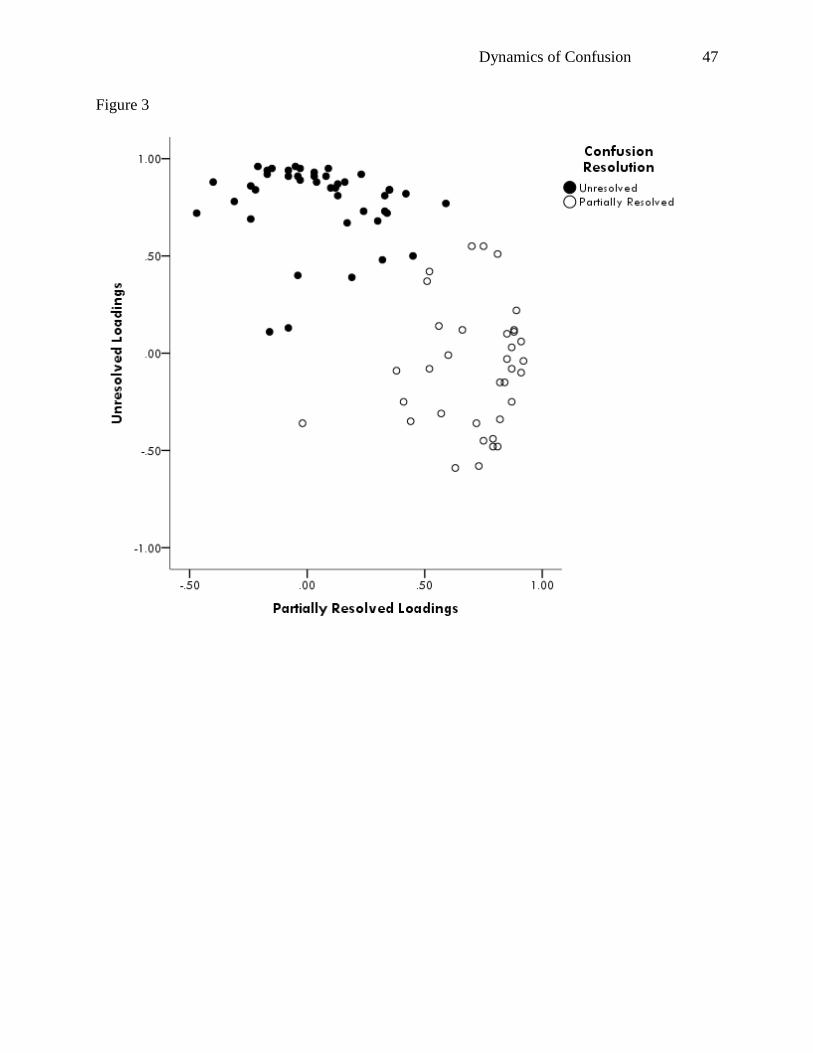
Dynamics of Confusion 47
Figure 3
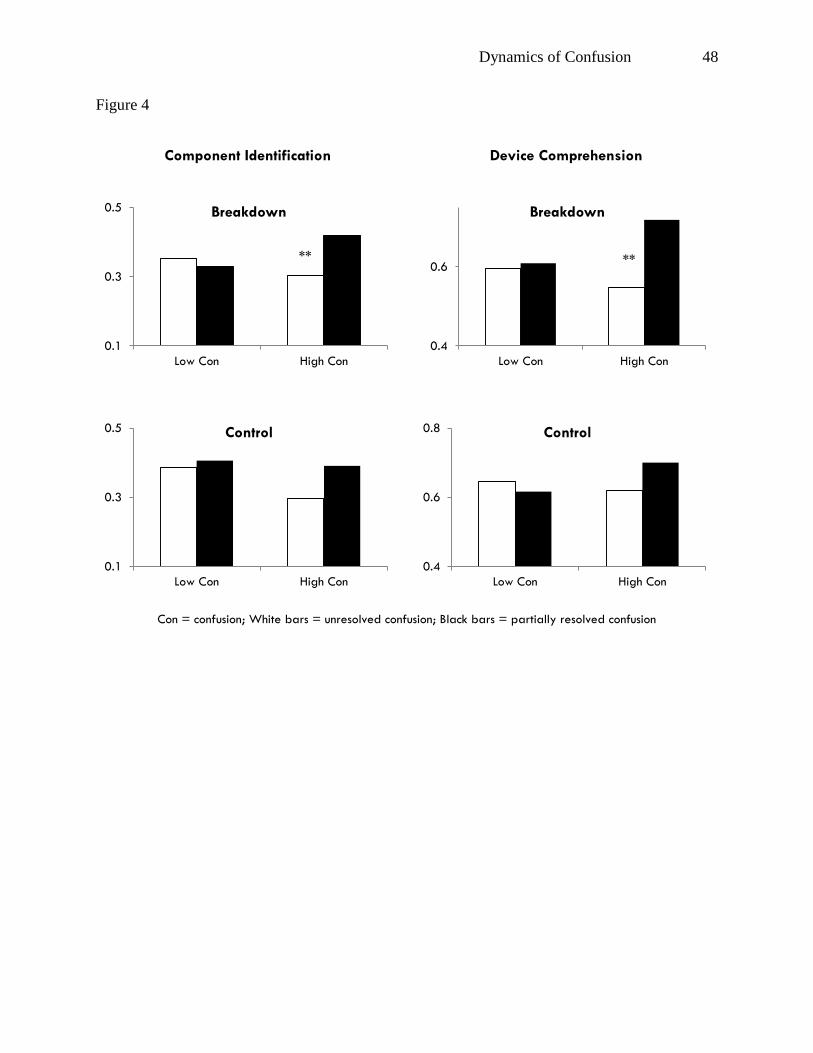
Dynamics of Confusion 48
Figure 4
Component Identification Device Comprehension
Con = confusion; White bars = unresolved confusion; Black bars = partially resolved confusion
0.1
0.3
0.5
Low Con High Con
Breakdown
**
0.4
0.6
Low Con High Con
Breakdown
**
0.1
0.3
0.5
Low Con High Con
Control
0.4
0.6
0.8
Low Con High Con
Control