Embed Size (px)
Citation preview

1
Indoor PM2.5 / PM10 / CO2 /
Temperature / Humidity 5-In-1
Detection Sensor
Model: WH45
Contents 1. Introduction ................................................. 2
2. Unpacking ................................................... 3
3. Features ...................................................... 4
4. Sensor Set Up .............................................. 7
5. Sensor Installation ........................................ 9
6. Wi-Fi Configure with gateway...................... 11
6.1 Pair with Gateway .................................... 11
6.2 Wi-Fi Connection for the Gateway .............. 12
7. View Online Data on WS View .................... 12
8. Appendix .................................................. 13
9. Sensor Calibration ...................................... 17
2
10. Specification .......................................... 19
11. Warranty Information .............................. 21
1. Introduction
Thanks for your purchasing of this integrated multifunction
indoor air quality monitoring sensor. It measures PM2.5 /
PM10 / CO2 / Temperature / Humidity. To ensure the best
product performance, please read this manual and retain it
for future reference.

3
2. Unpacking
Open your box and inspect that the contents are intact
(nothing broken) and complete (nothing missing). Inside
you should find the following:
QTY Item Description
1 Particle Detection Sensor (PM2.5 / PM10 / /CO2 /
Temperature / Humidity 5-In-1)
1 USB Cable
1 User Manual
Table: Package content
If any component is missing from the package, or broken,
please contact our Customer Service department to resolve
the issue.

4
3. Features
Particle Detection Sensor
Measures indoor PM2.5, PM10, CO2
concentration, Temperature and Humidity
every 60 seconds when powered with USB or
detecting every 10 minutes when powered with
batteries only.
USB connection for indoor use only
CO2 value calibration function available on the
device
PM2.5 value Calibration function available when
paired with GW1000/HP2551/HP3500/HP3501
Long wireless range, up to 300 feet (100 meters)
in open areas
When paired with a GW1000 Wi-Fi Gateway:
5
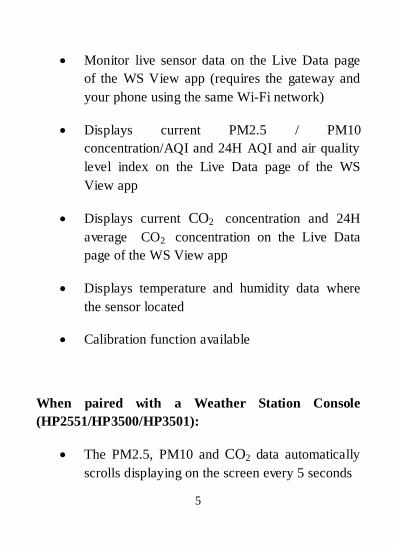
Monitor live sensor data on the Live Data page
of the WS View app (requires the gateway and
your phone using the same Wi-Fi network)
Displays current PM2.5 / PM10
concentration/AQI and 24H AQI and air quality
level index on the Live Data page of the WS
View app
Displays current CO2 concentration and 24H
average CO2 concentration on the Live Data
page of the WS View app
Displays temperature and humidity data where
the sensor located
Calibration function available
When paired with a Weather Station Console
(HP2551/HP3500/HP3501):
The PM2.5, PM10 and CO2 data automatically
scrolls displaying on the screen every 5 seconds

6
Calibration function available.
When uploaded to Ecowitt Weather Server:
View current sensor data & history records &
graph on the website
Set and receive email alerts from the server
Remote monitoring with smart phone, laptop, or
computer by visiting the website

7
4. Sensor Set Up
1. Remove the battery door on the base of the air quality sensor as shown in Figure 1
Figure 1
No Description No Description
1 Red LED Indicator
(RF transmission)
3 Battery Compartment
Cover
8
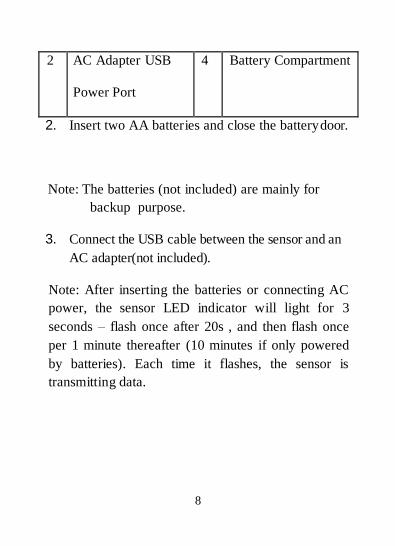
2 AC Adapter USB
Power Port
4 Battery Compartment
2. Insert two AA batteries and close the battery door.
Note: The batteries (not included) are mainly for
backup purpose.
3. Connect the USB cable between the sensor and an
AC adapter(not included).
Note: After inserting the batteries or connecting AC
power, the sensor LED indicator will light for 3
seconds – flash once after 20s , and then flash once
per 1 minute thereafter (10 minutes if only powered
by batteries). Each time it flashes, the sensor is
transmitting data.

9
5. Sensor Installation
Before install the sensor into its permanent location,
you may go to Section 6 to configure with the gateway
first. Once the sensor has been confirmed working
correctly, then you can go back here.
Place the sensor on a horizontally surface. Note that
the vents must be clear of any obstructions, and we
recommend placement away from other electronic
devices to prevent interference. Do not place on a
metal table to prevent RF signal loss.
Note: This sensor is designed for indoor use without
waterproof function.
Wireless communication is susceptible to
interference, distance, walls and metal barriers. We
recommend the following best practices for trouble
free wireless communication.
1. Electro-Magnetic Interference (EMI). Keep the
console several feet away from computer monitors

10
and TVs.
2. Radio Frequency Interference (RFI). If you have
other devices using the same RF frequency and
communication is intermittent, try turning off these
other devices for troubleshooting purposes. You may
need to relocate the transmitters or receivers to avoid
intermittent communication.
3. Line of Sight Rating. This device is rated at
300feet line of sight (no interference, barriers or
walls) but typically you will get 100feet maximum
under most real-world installations, which include
passing through barriers or walls.
4. Metal Barriers. Radio frequency will not pass
through metal barriers such as aluminum siding. If
you have metal siding, align the remote and console
through a window to get a clear line of sight.
11
6. Wi-Fi Configure with gateway
This Particle Detection Sensor doesn’t has a display
function and you need to use our WS View App to view
the data on your mobile application after pairing this
device with our GW1000 Wi-Fi Gateway or
HP2551/HP3500/HP3501 console (all sold separately).
6.1 Pair with Gateway
If GW1000 has been in operation, and you have never
had any WH45 sensor setup before, just power up the
sensor and GW1000 will pick sensor data automatically.
If a WH45 sensor has been hooked on GW1000 before,
and you have a new sensor to replace the old one, just
power off the old sensor and power on the new sensor,
open the APP: WS View, tap the device and go to sensor
ID page, locate the WH45 sensor, select “Register”, then
the gateway will erase the previous registered sensor and
have the new sensor paired.

12
6.2 Wi-Fi Connection for the Gateway
For this part, please refer to the manual of the GW1000
Wi-Fi gateway.
Any question, please contact the customer service.
7. View Online Data on WS View
When the Wi-Fi configuration is done, you can view the
live data of your sensor on the WS View application.

13
Note:
The WH45 sensor data can be only viewed on the Live
Data interface since it doesn’t support uploads to weather
underground.
If you choose to upload the data to our weather server:
https://www.ecowitt.net, you can view the live
data/history graph and download the records on the
website. You can add a shortcut of the website on the
home screen of your phone for quick access.
8. Appendix
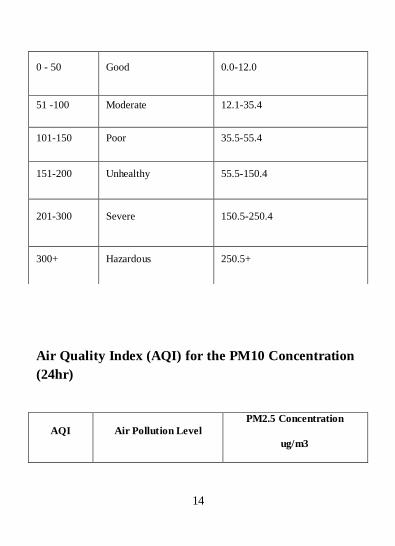
Air Quality Index (AQI) for the PM2.5 Concentration
(24hr)
AQI Air Pollution Level
PM2.5 Concentration
ug/m3
14
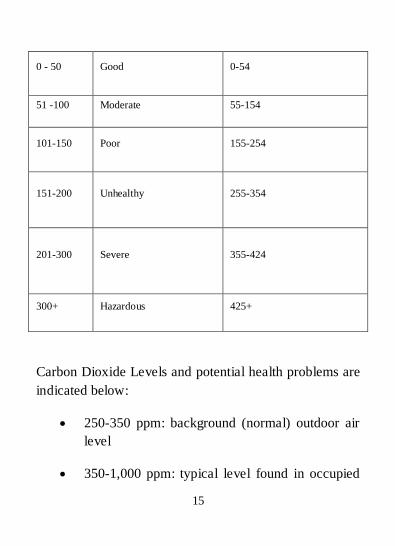
Air Quality Index (AQI) for the PM10 Concentration
(24hr)
0 - 50 Good 0.0-12.0
51 -100 Moderate 12.1-35.4
101-150 Poor 35.5-55.4
151-200 Unhealthy 55.5-150.4
201-300 Severe 150.5-250.4
300+ Hazardous 250.5+
AQI Air Pollution Level
PM2.5 Concentration
ug/m3
15
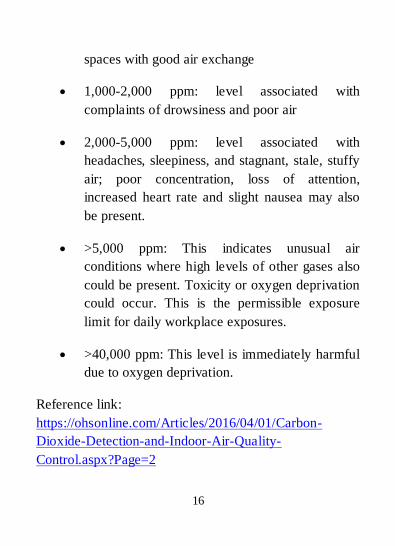
Carbon Dioxide Levels and potential health problems are
indicated below:
250-350 ppm: background (normal) outdoor air
level
350-1,000 ppm: typical level found in occupied
0 - 50 Good 0-54
51 -100 Moderate 55-154
101-150 Poor 155-254
151-200 Unhealthy 255-354
201-300 Severe 355-424
300+ Hazardous 425+
16
spaces with good air exchange
1,000-2,000 ppm: level associated with
complaints of drowsiness and poor air
2,000-5,000 ppm: level associated with
headaches, sleepiness, and stagnant, stale, stuffy
air; poor concentration, loss of attention,
increased heart rate and slight nausea may also
be present.
>5,000 ppm: This indicates unusual air
conditions where high levels of other gases also
could be present. Toxicity or oxygen deprivation
could occur. This is the permissible exposure
limit for daily workplace exposures.
>40,000 ppm: This level is immediately harmful
due to oxygen deprivation.
Reference link:
https://ohsonline.com/Articles/2016/04/01/Carbon-
Dioxide-Detection-and-Indoor-Air-Quality-
Control.aspx?Page=2

17
9. Sensor Calibration
CO2:There is an easy way to find the CO2 sensor is
drifted or not: put the sensor in outdoor open air locations,
away from any combustion exhausts, wait for 30 minutes,
you should see the CO2 reading is 420ppm +/-10. If it is
far from this reading, you can wait for some more time,
and test it during night to confirm. Once it is confirmed,
you can open the back housing, and use a clipper pin to
press the Calibrate button as below figure shows, leave it
for 30s, and the reading will be shifted back to 420ppm.

18
PM2.5: It is not possible to calibrate on the sensor side,
and you can calibrate through WS View App, which
saves the offset value on the gateway side before sending
data to www.ecowitt.net server. However if PM2.5 data
is persistently low, it can be that there is a spider net
going inside the sensor. So please clean the sensor from
time to time to see if there is any sign of spider
penetration.
Note: If the battery level is lower than 4 bars, calibration
is prohibited. When the led light on the sensor is steady
for 3 seconds, it indicates that calibration is prohibited.

19
10. Specification
Measurement Range Accuracy Resolution
PM 2.5 0~999ug/m3 >100ug/m3, ±15%
<100ug/m3, ±15ug/m3
1ug/m3
PM 10 0~999ug/m3 >100ug/m3, ±25%
<100ug/m3, ±25ug/m3
1ug/m3
CO2 0- 40000ppm 400-10000ppm
±(30ppm±3%)
1ppm
Temperature -40°C – 60°C (-40°F - 140°F)
± 1°C, or ± 2°F
0.1°C, or 0.1°F
Humidity 0%~99% ± 5% 1%

20
Transmission distance in open field: 100m(300 feet)
Frequency: 915/868/433MHz (915MHz for North
America, 868MHz for Europe, 433 for other areas)
Sensor reporting interval: 1 minutes (10 minutes when
only powered by batteries)
Power consumption
Particle Detection Sensor: AC power (5V 1A) - Not included 2 x AA 1.5V Batteries for back up - Not included
Note:
If you have a WH41 or WH43 PM2.5 sensor, the reading
of PM2.5 may be different due to different sensor type
used.

21
11. Warranty Information
We disclaim any responsibility for any technical error
or printing error, or the consequences thereof.
All trademarks and patents are recognized.
We provide a 1-year limited warranty on this product
against manufacturing defects, or defects in materials and
workmanship.
This limited warranty begins on the original date of
purchase, is valid only on products purchased, and only
to the original purchaser of this product. To receive
warranty service, the purchaser must contact us for
problem determination and service procedures.
This limited warranty covers only actual defects within
the product itself and does not cover the cost of
installation or removal from a fixed installation, normal
set-up or adjustments, or claims based on

22
misrepresentation by the seller, or performance variations
resulting from installation-related circumstances.