Embed Size (px)
Citation preview

Indoor Localizationusing Wireless LAN infrastructure
Location Based Services
Supervised byProf. Dr. Amal Elnahas
Presented byAhmed Ali Sabbour

Location based services
Make use of geospatial location information
Provide users withemergency, information, tracking and
entertainment services.

Motivation
Previous systems focused on outdoors
GPS not suitable for indoor localization
Indoor systems used sensor networks
Using WLAN infrastructure

Aim of the project
Design a system to locate users indoors
Provide location sensitive information
Can be used on campus and in
museums
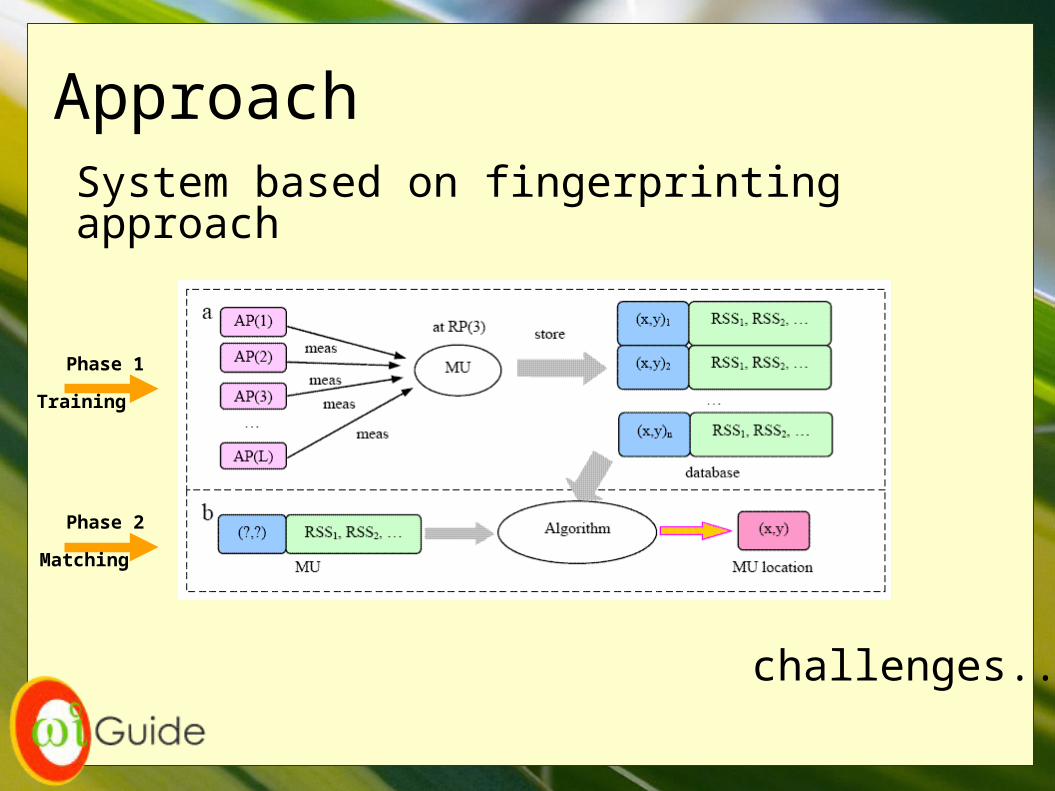
Approach
System based on fingerprinting approach
challenges..
Phase 1
Phase 2
Training
Matching

Signal instabilityChallenges

GranularityChallenges
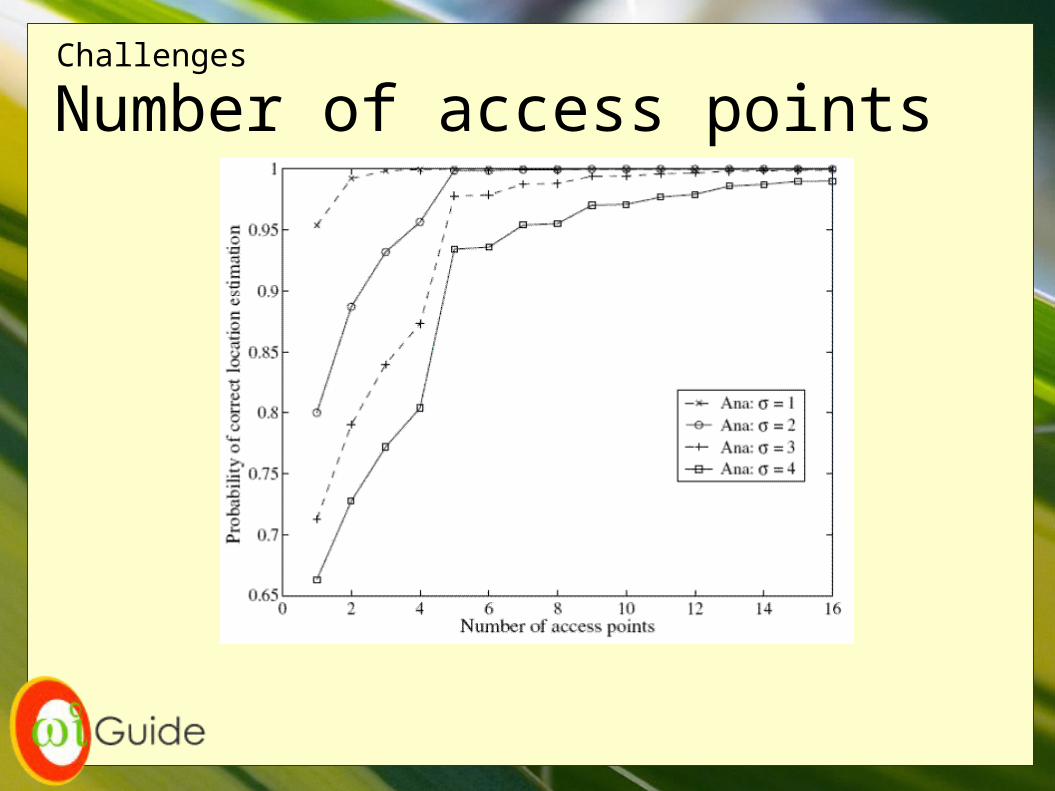
Number of access pointsChallenges

Number of samples
60 61 62
0
1
2
3
4
5
6
7
8
9
10
10 Readings
RSSI
FR
EQ
21 45 56 58 60 61 62
0
10
20
30
30 Readings
RSSI
FR
EQ
21 22 45 49 51 54 56 58 60 61 62 63 64
0
10
20
30
40
50
50 Readings
RSSI
FR
EQ
17 18 20 21 22 44 45 48 49 50 51 52 53 54 55 56 57 58 60 61 62 63 64
0
10
20
30
40
50
60
70
80
90
100
100 Readings
RSSI
FR
EQ
Challenges

User orientation
20 24 26 27 28 29 30 32 33 38 41 42 43 44 45 46 49 50 51 54 55 57 58
0
10
20
30
North
18 23 26 28 30 33 41 43 45 49 51 54 56 58 63
0
10
20
30
South
2023242627282930323338414243444546495051545557586364
0
10
20
30
East
18 23 26 28 30 33 38 42 44 46 49 51 54 56 58 63
0
10
20
30
West
Challenges

Goals
Server able to handle multiple clients
Thin client for deployment on small devices
Creating a fingerprinting training algorithm
Creating a location matching algorithm

System design
requestand
response

Algorithms
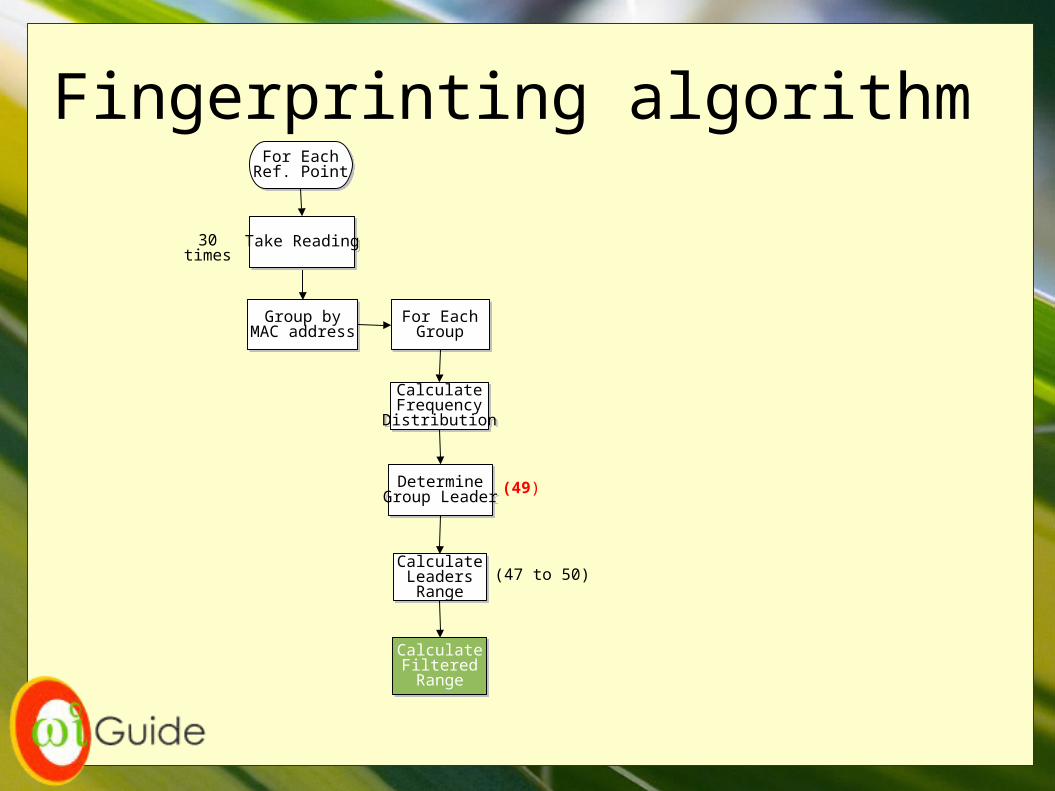
TrainingFingerprinting algorithm
• MatchingRange based algorithmEuclidean distance based algorithm

Fingerprinting algorithmFor EachRef. PointFor EachRef. Point
Group byMAC address
Group byMAC address
For EachGroup
For EachGroup
CalculateFrequencyDistribution
CalculateFrequencyDistribution
DetermineGroup Leader
DetermineGroup Leader
Take ReadingTake Reading30 times

Determine Group LeaderStartStart
Sort Readingsby FrequencyDescending
Sort Readingsby FrequencyDescending
Get FirstReadingGet FirstReading
Get NextReadingGet NextReading
current freq= previous?current freq= previous?
PossibleLeadersPossibleLeaders
Leader is mean ofpossible leaders
Leader is mean ofpossible leaders
add to
Yes, add to
No
50, 47
50472
=48.5≈49
Group A7C8
RSSI Frequency
50 20
47 2045 1136 625 3

Fingerprinting algorithmFor EachRef. PointFor EachRef. Point
Group byMAC address
Group byMAC address
For EachGroup
For EachGroup
CalculateFrequencyDistribution
CalculateFrequencyDistribution
DetermineGroup Leader
DetermineGroup Leader
CalculateLeadersRange
CalculateLeadersRange
Take ReadingTake Reading30 times
(49)
(47 to 50)
Fingerprinting algorithmFor EachRef. PointFor EachRef. Point
Group byMAC address
Group byMAC address
For EachGroup
For EachGroup
CalculateFrequencyDistribution
CalculateFrequencyDistribution
DetermineGroup Leader
DetermineGroup Leader
CalculateLeadersRange
CalculateLeadersRange
CalculateFilteredRange
CalculateFilteredRange
Take ReadingTake Reading30 times
(49)
(47 to 50)

Calculate Filtered Range
Minimum frequencyFreq(Leader) x Threshold = Freq(49) x 50% = 20 x 50% = 10 readings
Readings with frequency < 10 will not be considered.
ThresholdIf we take it as 50%
Group
RSSI Frequency
50 20
47 2045 1136 625 3

Calculate Filtered Range
Filtered Standard DeviationThe SD of all readings above the minimum frequency (10).
Filtered SD = 1.98 instead of 6.18
Group
RSSI Frequency
50 20
47 2045 1136 625 3
Filtered RangeThe leaders range ± filtered SD.
Why filtered standard deviation?

Fingerprinting algorithm
moregroups?more
groups?
For EachRef. PointFor EachRef. Point
Group byMAC address
Group byMAC address
For EachGroup
For EachGroup
CalculateFrequencyDistribution
CalculateFrequencyDistribution
DetermineGroup Leader
DetermineGroup Leader
CalculateLeadersRange
CalculateLeadersRange
CalculateFilteredRange
CalculateFilteredRange
AddFingerprintto Database
AddFingerprintto Database
No
Yes
Take ReadingTake Reading30 times
Store room, mac address, filtered range low, filtered range high, leader
for the 3 mostcommon access points
(49)
(47 to 50)
(45 to 52)

Matching algorithmClient side
<message> <group> <mac>0030BDF25F32</mac> <signal>52</signal> </group>
<group> <mac>00AF28911235</mac> <signal>45</signal> </group></message>
StartStart
DisplayLocationDisplayLocation
Take ReadingTake Reading
Group byMAC address
Group byMAC address
For EachGroup
For EachGroup
DetermineGroup Leader
DetermineGroup Leader
ConstructXML message
withGroup Leaders
ConstructXML message
withGroup Leaders
Sendto Server
Sendto Server
Parse responseXML message
Parse responseXML message
30 times
Server sideMatching
Server sideMatching
<reply valid=”1”><room id=”23” x=”50” y=”23”>
<name>Student class</name><num>301</num><building>B2</building>
</room></reply>
moregroups?more
groups?
Yes
No
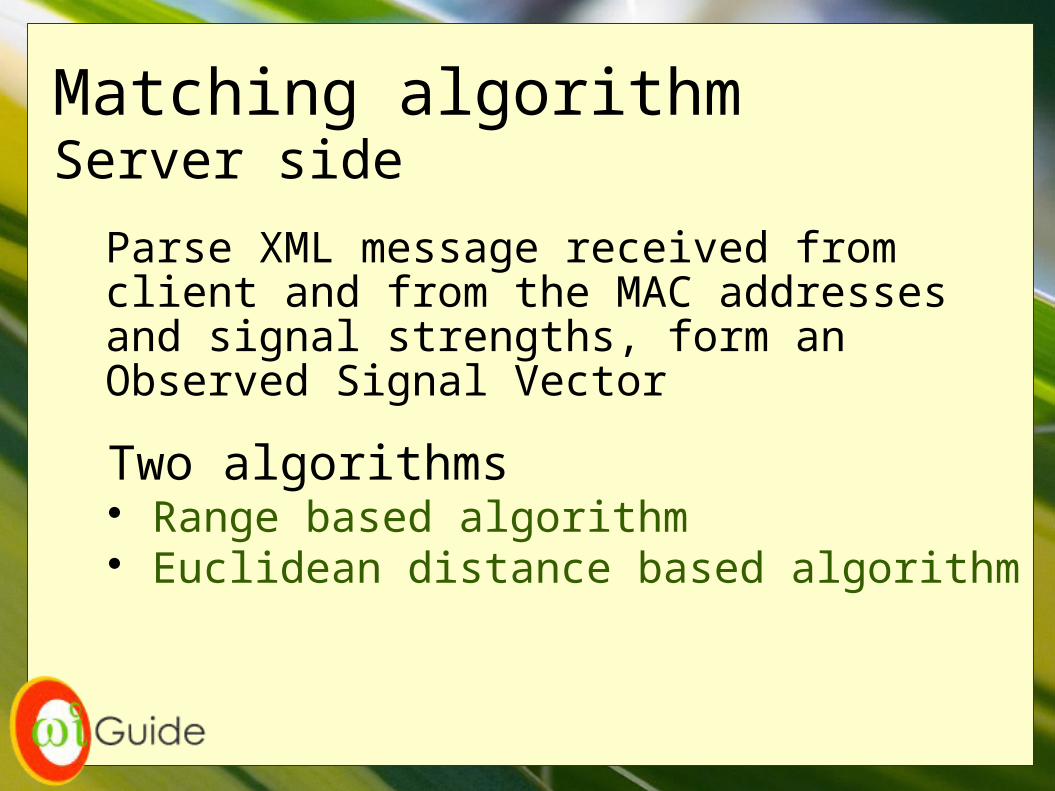
Matching algorithmServer side
Parse XML message received from client and from the MAC addresses and signal strengths, form an Observed Signal Vector
Two algorithms Range based algorithm Euclidean distance based algorithm
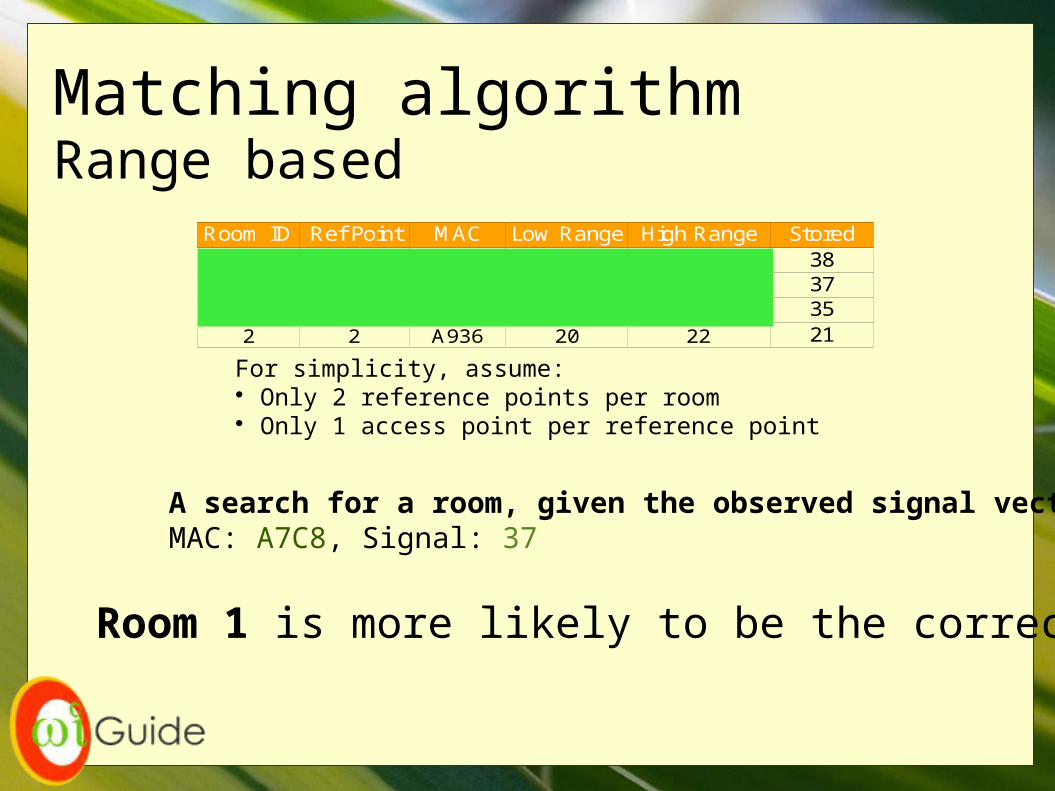
Matching algorithmRange based
Room ID Ref Point MAC Low Range High Range Stored1 1 A7C8 35 42 381 2 A7C8 35 41 372 1 A7C8 34 38 352 2 A936 20 22 21
For simplicity, assume: Only 2 reference points per room Only 1 access point per reference point
A search for a room, given the observed signal vector :MAC: A7C8, Signal: 37
Room 1 is more likely to be the correct location.

Matching algorithmEuclidean distance based
distance=∑i=1
n
o i−si2
n represents the number of access points recorded for each reference point, o is the observed signal value ands is a stored signal value in the database.
simplified distance=o−s2
For simplicity of the example, let n = 1, which means that only 1 access point is recorded for each reference point.
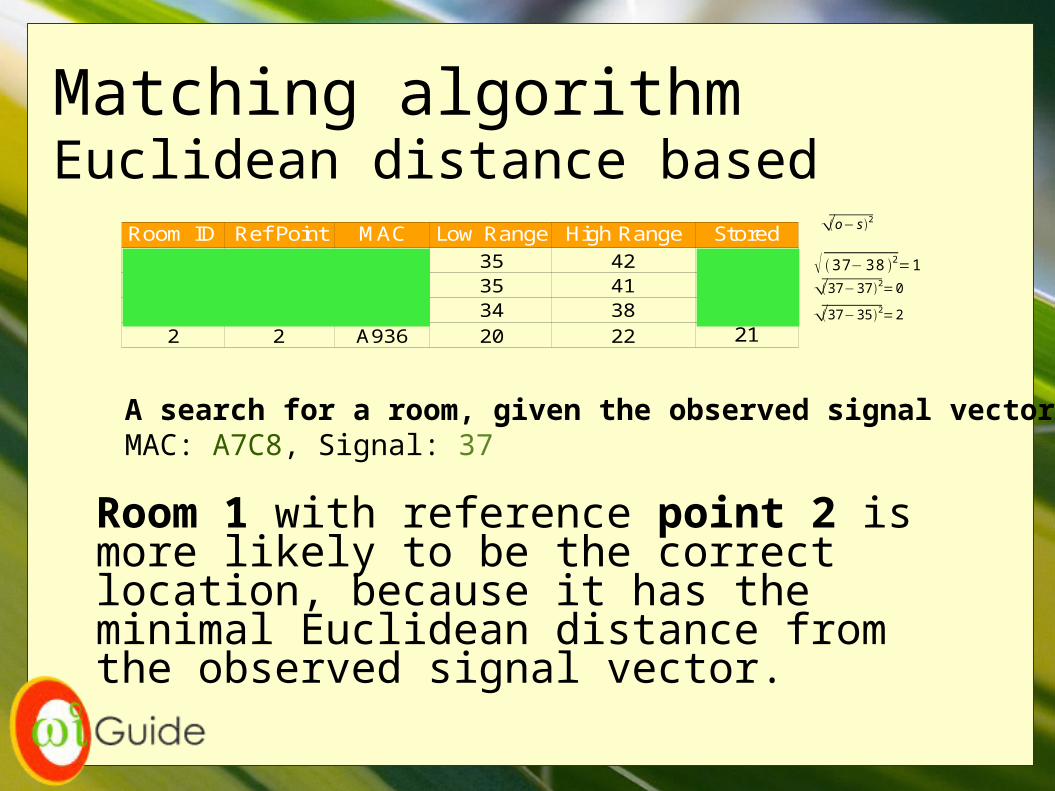
Matching algorithmEuclidean distance based
Room ID Ref Point MAC Low Range High Range Stored1 1 A7C8 35 42 381 2 A7C8 35 41 372 1 A7C8 34 38 352 2 A936 20 22 21
A search for a room, given the observed signal vector :MAC: A7C8, Signal: 37
Room 1 with reference point 2 is more likely to be the correct location, because it has theminimal Euclidean distance from the observed signal vector.
o− s 2
3 7− 3 8 2=1
37−37 2=0
37−35 2=2
Matching algorithmServer side
Server then constructs an XML message with
Detected room Coordinates
and sends message to the client.
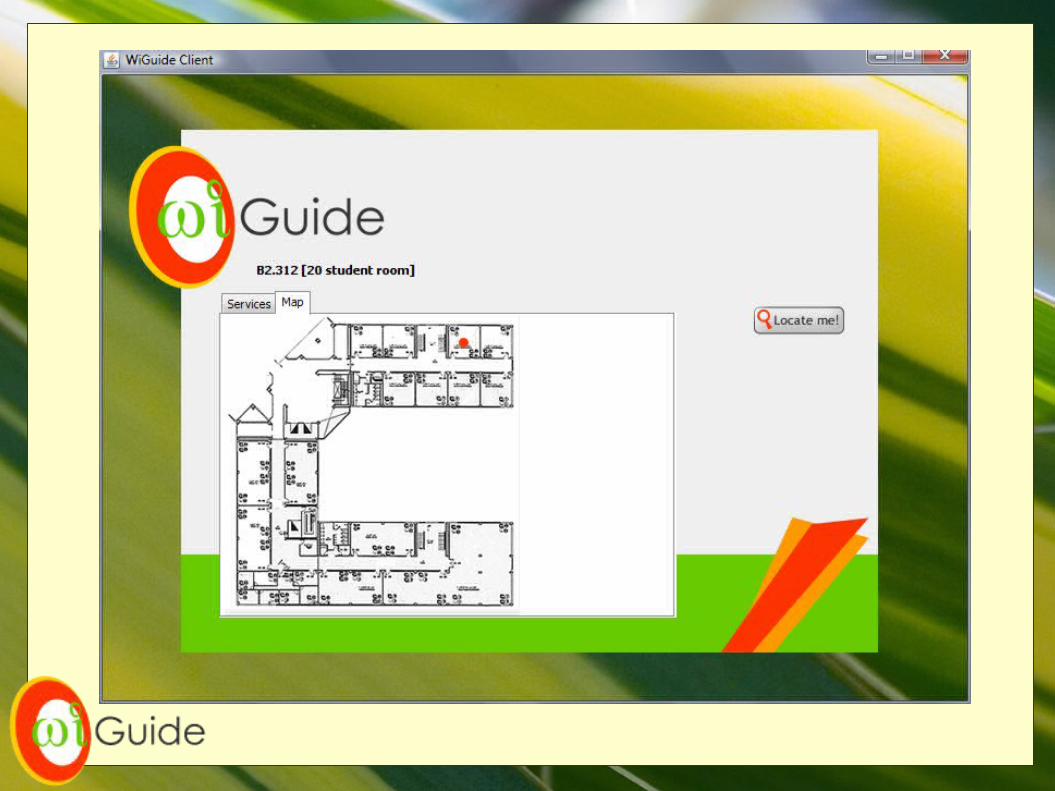
Accessing information
The client then opens an HTTP connection to the webserver
http://webserver/location.php?room=<id>The server then constructs an HTML page using PHP with information regarding the location.
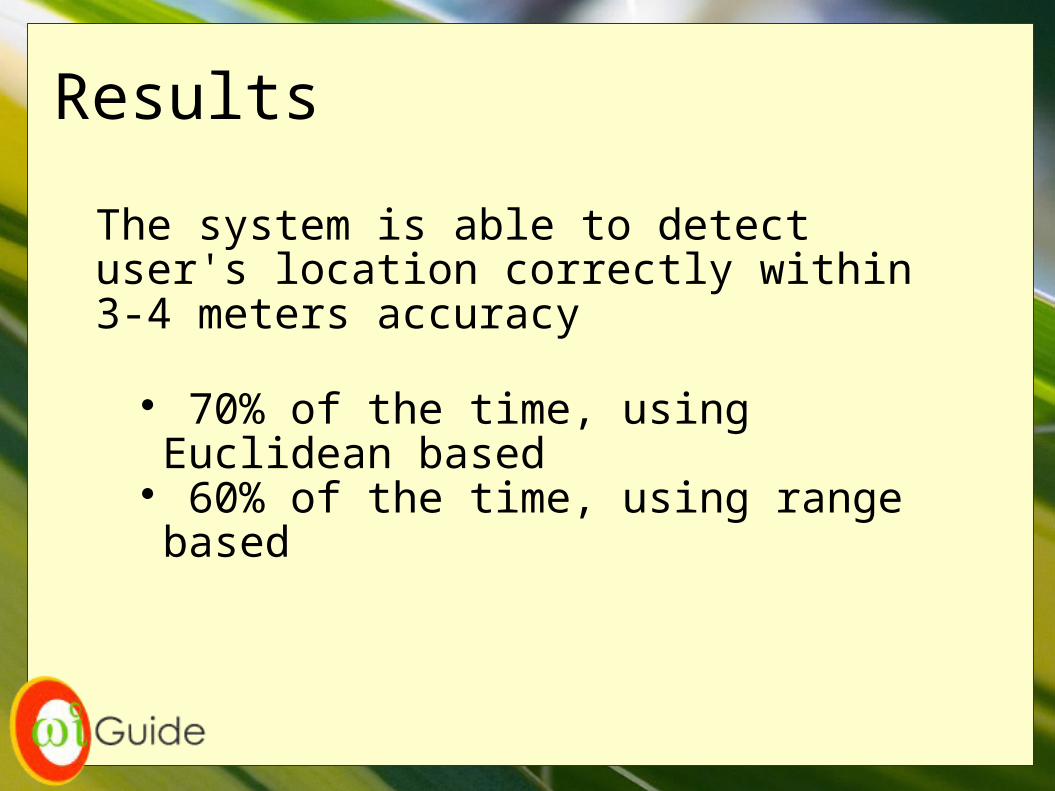
Results
The system is able to detect user's location correctly within 3-4 meters accuracy
70% of the time, using Euclidean based
60% of the time, using range based


Thank you.