Embed Size (px)
Citation preview

International Journal of
Environmental Research
and Public Health
Review
Indoor Exposure to Selected Air Pollutants in theHome Environment: A Systematic Review
Sotiris Vardoulakis 1,2,* , Evanthia Giagloglou 1, Susanne Steinle 1, Alice Davis 1,Anne Sleeuwenhoek 1, Karen S. Galea 1 , Ken Dixon 1 and Joanne O. Crawford 1,3
1 Institute of Occupational Medicine (IOM), Edinburgh EH14 4AP, UK; [email protected] (E.G.);[email protected] (S.S.); [email protected] (A.D.);[email protected] (A.S.); [email protected] (K.S.G.);[email protected] (K.D.); [email protected] (J.O.C.)
2 National Centre for Epidemiology and Population Health, Research School of Population Health,Australian National University, ACT 2601 Canberra, Australia
3 Faculty of Health, Victoria University of Wellington, 6410 Wellington, New Zealand* Correspondence: [email protected]
Received: 22 October 2020; Accepted: 27 November 2020; Published: 2 December 2020�����������������
Abstract: (1) Background: There is increasing awareness that the quality of the indoor environmentaffects our health and well-being. Indoor air quality (IAQ) in particular has an impact on multiplehealth outcomes, including respiratory and cardiovascular illness, allergic symptoms, cancers,and premature mortality. (2) Methods: We carried out a global systematic literature review on indoorexposure to selected air pollutants associated with adverse health effects, and related householdcharacteristics, seasonal influences and occupancy patterns. We screened records from six bibliographicdatabases: ABI/INFORM, Environment Abstracts, Pollution Abstracts, PubMed, ProQuest Biologicaland Health Professional, and Scopus. (3) Results: Information on indoor exposure levels anddeterminants, emission sources, and associated health effects was extracted from 141 studies from29 countries. The most-studied pollutants were particulate matter (PM2.5 and PM10); nitrogen dioxide(NO2); volatile organic compounds (VOCs) including benzene, toluene, xylenes and formaldehyde;and polycyclic aromatic hydrocarbons (PAHs) including naphthalene. Identified indoor PM2.5
sources include smoking, cooking, heating, use of incense, candles, and insecticides, while cleaning,housework, presence of pets and movement of people were the main sources of coarse particles.Outdoor air is a major PM2.5 source in rooms with natural ventilation in roadside households.Major sources of NO2 indoors are unvented gas heaters and cookers. Predictors of indoor NO2 areventilation, season, and outdoor NO2 levels. VOCs are emitted from a wide range of indoor andoutdoor sources, including smoking, solvent use, renovations, and household products. Formaldehydelevels are higher in newer houses and in the presence of new furniture, while PAH levels arehigher in smoking households. High indoor particulate matter, NO2 and VOC levels were typicallyassociated with respiratory symptoms, particularly asthma symptoms in children. (4) Conclusions:Household characteristics and occupant activities play a large role in indoor exposure, particularlycigarette smoking for PM2.5, gas appliances for NO2, and household products for VOCs and PAHs.Home location near high-traffic-density roads, redecoration, and small house size contribute to highindoor air pollution. In most studies, air exchange rates are negatively associated with indoor airpollution. These findings can inform interventions aiming to improve IAQ in residential properties ina variety of settings.
Keywords: indoor air; chemicals; particulate matter; VOC; PAH; benzene; toluene; formaldehyde;naphthalene; residential exposure; ventilation; asthma
Int. J. Environ. Res. Public Health 2020, 17, 8972; doi:10.3390/ijerph17238972 www.mdpi.com/journal/ijerph

Int. J. Environ. Res. Public Health 2020, 17, 8972 2 of 24
1. Introduction
There is increasing awareness that the quality of the indoor environment can affect our health andwell-being. Indoor air quality (IAQ) in particular has an impact on multiple health outcomes, includingrespiratory and cardiovascular illness, allergic symptoms, cancers, and premature mortality [1]. As theworld is becoming increasingly urbanised, with urban residents typically spending over 90% oftheir time indoors [2,3], it is important to characterise IAQ and understand which pollution sources,housing characteristics, and occupancy patterns have the largest impact on our exposure to pollutantspresent in the home environment.
Exposure to high concentrations of air pollutants indoors can cause both acute and chronic healtheffects. Examples of acute effects include exacerbation of allergic symptoms, such as atopic dermatitis,rhinitis, conjunctivitis and hay fever, and intoxication and death due to short-term exposure to veryhigh concentrations of carbon monoxide (CO) [4]. Examples of chronic health effects include cancerand non-cancer effects associated with organic chemicals [5], respiratory effects related to second-handtobacco smoke (e.g., chronic obstructive pulmonary disease (COPD)) [6], increased susceptibility torespiratory infections, and cardiovascular disease [7]. Certain pollutants, such as tobacco smoke andother combustion products, may aggravate asthma symptoms [8], while formaldehyde and othervolatile organic compounds (VOCs) have been associated with the sick building syndrome (SBS) [9].
IAQ is a complex function of outdoor and indoor sources of pollution, environmental conditions,housing characteristics, and behavioural factors [1]. Outdoor air pollution concentrations associatedwith anthropogenic and natural sources, such as road traffic, wildfire smoke and re-suspension of dust,can affect indoor air pollutant levels. In addition, dispersion characteristics of pollutants surroundingthe building influenced by, e.g., the type, position and distance of pollutant sources; size, shape,orientation and arrangement of buildings; topography and meteorological conditions also play arole [10–13].
Furthermore, IAQ levels are highly variable over time, depending on a range of internal factorsthat include (i) the physical and chemical properties of pollutants (gaseous or particulate, reactivity,deposition, size for particulates); (ii) use of household products, such as cleaning products, cosmeticsand insecticides, and appliances, such as gas cookers and stoves, and building and furnishing materialssuch as chemical flame retardants; (iii) building characteristics including infiltration and ventilationrates; (iv) occupant behaviour and activities, e.g., opening of windows, tobacco smoking, cleaning,cooking, and use of extractor fans [14,15].
The aim of this review is to characterise air pollution exposure levels and associated healtheffects in homes around the world and provide evidence-based recommendations for improving IAQ.To achieve this, we carried out a systematic search and review of the evidence in relation to IAQand human exposure in domestic environments. This review focused on measured concentrations ofcommon chemical pollutants from a wide range of outdoor and indoor sources, related health effects,building characteristics, and locational, seasonal and occupancy patterns.
2. Methods
2.1. Literature Searches
Peer-reviewed articles published between 2000 and 2017 were included in our searches.We excluded studies published prior to 2000, as these were largely covered by a comprehensivereview on IAQ and health by Jones (1999) [9], and excluded studies published in languages otherthan English or if their main focus was on the evaluation of outdoor air pollution or household airpollution from biomass burning in rural settings. We also excluded publications related to asbestos,radon, methane, biological pollutants, and acute carbon monoxide exposure. Furthermore, we focusedon measured exposures to chemical air pollutants and particles in the domestic indoor environment,excluding studies that relied entirely on IAQ modelling. Although we extracted health information,

Int. J. Environ. Res. Public Health 2020, 17, 8972 3 of 24
a comprehensive review of the health effects of specific indoor pollutants (e.g., including epidemiologicaland toxicological studies) was beyond the scope of this review.
The following online bibliographic databases were used: ABI/INFORM, Environment Abstracts,Pollution Abstracts, PubMed, ProQuest Biological and Health Professional, and Scopus. The searchresults from the databases were stored in the online reference manager RefWorks. Additional manualsearches in the reference lists of review papers were carried out. The search strategy adopted, including allsearch terms used in bibliographic database searches, is documented in Supplementary Materials.
2.2. Paper Screening and Data Extraction
After the searches were completed, the titles and, where available, abstracts were screened toidentify studies of relevance in accordance with the inclusion criteria. In all cases, a conservative strategywas adopted, where, if the relevance or otherwise of a paper was not apparent from the title/abstract,the paper was retained for full-text scanning. Following the screening of the titles and abstracts,copies of the full papers were obtained for those included. A data extraction template was developedand trialled before being applied to the included papers. The final data extraction template includedpublication title, authors, pollutant(s), country, location, study design, indoor sources, occupancypatterns, dwelling characteristics, exposure levels, method(s) of measurement, number and duration ofmeasurements, and health effects (if reported). Title, abstract and full-text screening, and data extractionfor each eligible paper were undertaken independently by two reviewers, with disagreements resolvedby a third reviewer. From the data extracted, summary tables were prepared to aid the assessmentprocess, and a narrative synthesis of the evidence was carried out.
3. Results
Overall, 2982 titles were identified and screened, 226 full-text articles were obtained and assessedfor eligibility, with 141 of them included in the evidence synthesis (Figure 1). Studies from 29 countrieswere included, with a relatively high number of studies from the USA, UK, Japan, Canada, and China(Figure 2). IAQ studies were very sparse for the Middle East, Central Asia, Latin America and Africa.The most-studied pollutants were particulate matter (PM) as PM2.5 and PM10; nitrogen dioxide (NO2);volatile organic compounds (VOCs) including formaldehyde, acetaldehyde, benzene, ethylbenzene,toluene, and xylenes; and to a lesser extent polycyclic aromatic hydrocarbons (PAHs) includingnaphthalene; and carbon monoxide (CO) (Figure 3). Fewer studies focused on other individual VOCs(limonenes, pinenes), sulphur oxides (SOx), and ozone (O3). Carbon dioxide (CO2) levels were reportedas an indicator of indoor ventilation in a number of studies.
A full list of the extracted information with a summary of the studies included can be found inSupplementary Materials (Table S1). Sources, exposure levels and health effects of selected chemicalsand groups of pollutants are discussed in Sections 3.1–3.7. Housing characteristics, occupancy,ventilation and activity patterns, seasonal and climatic influences, and dwelling location, setting andwithin-building variability are discussed in Sections 4.1–4.4.

Int. J. Environ. Res. Public Health 2020, 17, 8972 4 of 24
Int. J. Environ. Res. Public Health 2020, 17, x 4 of 24
Figure 1. Numbers of papers at each stage of the review process (PRISMA diagram).
Figure 2. Number of IAQ studies included per country. Studies with IAQ data from multiple
countries have been counted separately for each country.
Records identified through
database searching
(n = 2952)
Additional records identified
through manual searches
(n = 30)
Titles included in screening
(n = 2982)
Titles excluded
(n = 2414)
Abstracts screened
(n = 568)
Full-text articles assessed
for eligibility
(n = 226)
Full-text articles data
extracted (n = 197)
Abstracts rejected
(n = 342)
Non-eligible full-text
articles (n = 29)
Studies included in
evidence assessment
(n = 141)
Full-text articles
rejected
(n = 56)
Figure 1. Numbers of papers at each stage of the review process (PRISMA diagram).
Int. J. Environ. Res. Public Health 2020, 17, x 4 of 24
Figure 1. Numbers of papers at each stage of the review process (PRISMA diagram).
Figure 2. Number of IAQ studies included per country. Studies with IAQ data from multiple
countries have been counted separately for each country.
Records identified through
database searching
(n = 2952)
Additional records identified
through manual searches
(n = 30)
Titles included in screening
(n = 2982)
Titles excluded
(n = 2414)
Abstracts screened
(n = 568)
Full-text articles assessed
for eligibility
(n = 226)
Full-text articles data
extracted (n = 197)
Abstracts rejected
(n = 342)
Non-eligible full-text
articles (n = 29)
Studies included in
evidence assessment
(n = 141)
Full-text articles
rejected
(n = 56)
Figure 2. Number of IAQ studies included per country. Studies with IAQ data from multiple countrieshave been counted separately for each country.

Int. J. Environ. Res. Public Health 2020, 17, 8972 5 of 24
Int. J. Environ. Res. Public Health 2020, 17, x 5 of 24
Figure 3. Number of studies included for each indoor pollutant. Studies reporting indoor
concentrations of multiple pollutants have been counted separately for each pollutant. (PM2.5:
particles with aerodynamic diameter < 2.5 μm; PM10: particles with aerodynamic diameter < 10 μm;
PNC: particle number concentration; UFP: ultrafine particles.)
3.1. Particulate Matter
3.1.1. Exposure Levels, Sources and Determinants
Particulate matter (PM) is a complex mixture of organic and inorganic chemicals, including
organic carbon (OC) and elemental carbon (EC), which vary by season and geographic location
[16,17]. Indoor particles comprised ambient particles of different size fractions (typically reported as
PM10, PM2.5, and UFP) that infiltrated from outdoors, and particles that were generated indoors
[18,19]. Major indoor PM sources included smoking, cooking (particularly using kerosene and
biomass fuels), wood stoves and furnaces, use of incense and candles for fine particles (PM2.5), and
cleaning, presence of pets, and people’s movements for coarse particles [20–26].
Seventy-three studies reported indoor PM2.5, with mean concentrations ranging between 1.7
μg/m3 in Quebec City, Canada [27], and 428.6 μg/m3 in homes with hookah (i.e., water pipe) smoking
in Dubai, UAE [28] (Table S1). Cooking and smoking were major indoor sources of PM2.5 in homes in
the UK [29,30] and USA [31]. In addition to indoor smoking [32,33], PM2.5 levels were strongly
influenced by the use of coal for cooking [34] and motor vehicle emissions [35] in China. The use of
kerosene and biomass fuels for cooking increased indoor PM2.5 concentrations to a level 7-fold greater
than the World Health Organization (WHO) guidelines in Dhaka, Bangladesh [36].
Thirty-seven studies reported indoor PM10, with mean concentrations ranging between < 11.0 in
Quebec City, Canada [37], and 1275 μg/m3 in houses with soil floor in Lao PDR [38]. Very high PM10
levels were also reported in Delhi and Agra, India [39,40]. Relatively high indoor PM10 in southern
Europe compared to northern and central Europe was possibly due to higher ingress of mineral dust
from outdoor sources [41]. Higher indoor PM10 was reported in Portuguese [41] and UK homes [42]
compared to outdoor levels, although outdoor sources were a significant contributor to indoor
concentrations. OC content of PM10 was higher indoors than outdoors showing the influence of
indoor sources such as smoking, cooking, biomass burning and movement of people, while EC
sources were mainly outdoors [41].
Indoor UFP concentrations were affected by outdoor UFP concentrations, building
characteristics and infiltration, air exchange rates (AERs), indoor and outdoor meteorological
parameters, personal behaviours, as well as indoor sources and human activities such as cooking,
18
33
14
35
13 1217
6
32
6
35
28
1114
73
37
6 5 5 4 12
46
50
10
20
30
40
50
60
70
80
Figure 3. Number of studies included for each indoor pollutant. Studies reporting indoor concentrationsof multiple pollutants have been counted separately for each pollutant. (PM2.5: particles withaerodynamic diameter < 2.5 µm; PM10: particles with aerodynamic diameter < 10 µm; PNC: particlenumber concentration; UFP: ultrafine particles.)
3.1. Particulate Matter
3.1.1. Exposure Levels, Sources and Determinants
Particulate matter (PM) is a complex mixture of organic and inorganic chemicals, includingorganic carbon (OC) and elemental carbon (EC), which vary by season and geographic location [16,17].Indoor particles comprised ambient particles of different size fractions (typically reported as PM10,PM2.5, and UFP) that infiltrated from outdoors, and particles that were generated indoors [18,19].Major indoor PM sources included smoking, cooking (particularly using kerosene and biomass fuels),wood stoves and furnaces, use of incense and candles for fine particles (PM2.5), and cleaning, presenceof pets, and people’s movements for coarse particles [20–26].
Seventy-three studies reported indoor PM2.5, with mean concentrations ranging between 1.7µg/m3
in Quebec City, Canada [27], and 428.6 µg/m3 in homes with hookah (i.e., water pipe) smoking inDubai, UAE [28] (Table S1). Cooking and smoking were major indoor sources of PM2.5 in homes in theUK [29,30] and USA [31]. In addition to indoor smoking [32,33], PM2.5 levels were strongly influencedby the use of coal for cooking [34] and motor vehicle emissions [35] in China. The use of keroseneand biomass fuels for cooking increased indoor PM2.5 concentrations to a level 7-fold greater than theWorld Health Organization (WHO) guidelines in Dhaka, Bangladesh [36].
Thirty-seven studies reported indoor PM10, with mean concentrations ranging between < 11.0in Quebec City, Canada [37], and 1275 µg/m3 in houses with soil floor in Lao PDR [38]. Very highPM10 levels were also reported in Delhi and Agra, India [39,40]. Relatively high indoor PM10 insouthern Europe compared to northern and central Europe was possibly due to higher ingress ofmineral dust from outdoor sources [41]. Higher indoor PM10 was reported in Portuguese [41] and UKhomes [42] compared to outdoor levels, although outdoor sources were a significant contributor toindoor concentrations. OC content of PM10 was higher indoors than outdoors showing the influence ofindoor sources such as smoking, cooking, biomass burning and movement of people, while EC sourceswere mainly outdoors [41].
Indoor UFP concentrations were affected by outdoor UFP concentrations, building characteristicsand infiltration, air exchange rates (AERs), indoor and outdoor meteorological parameters,
Int. J. Environ. Res. Public Health 2020, 17, 8972 6 of 24
personal behaviours, as well as indoor sources and human activities such as cooking, candle burning,heating devices, environmental tobacco smoke (ETS), and office equipment [43–45]. In a study inCalifornia, USA, cooking caused the highest indoor UFP exposures [46].
3.1.2. Health Effects
Exposure to ambient PM has been linked to decline in pulmonary function and cardiovascularevents possibly through inflammation. Indoor UFP exposure is of particular concern due to theenhanced ability of UFP to cause oxidative stress and inflammation in the lungs [47]. However, less isknown about individual exposure to UFP inside and outside modern homes and associated healtheffects [48].
Higher concentrations of indoor (fine and coarse) PM were associated with increases in asthmasymptoms and relief medication use in children in Baltimore, USA [49,50]. Significantly positiveassociations were found between indoor PM2.5 and new wheeze in children in New York City, USA [51].However, a study in California, USA, showed mixed respiratory effects of PM in children with asthmain various microenvironments [52]. Indoor exposure to PM increases the risk of acute lower respiratorytract infections, which are the leading cause of death in young children in low-income countries [36].Increased indoor PM levels have been associated with worse respiratory symptoms and increased riskof exacerbation in patients with COPD [53,54].
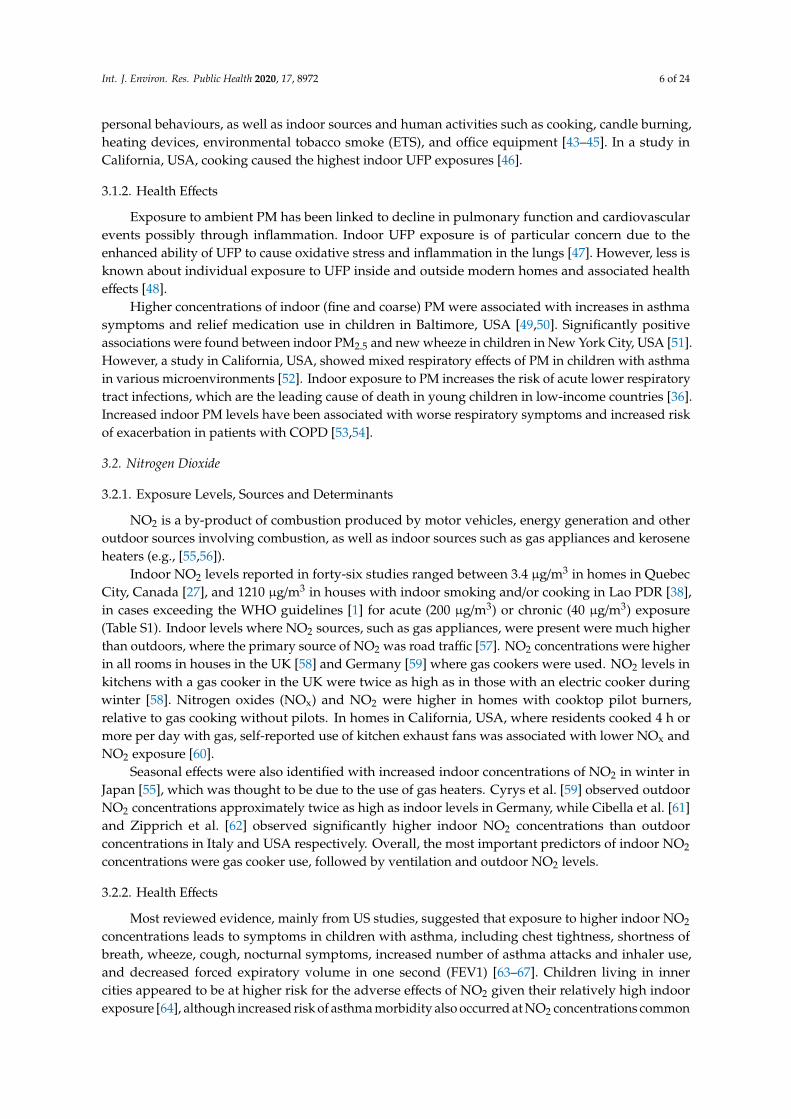
3.2. Nitrogen Dioxide
3.2.1. Exposure Levels, Sources and Determinants
NO2 is a by-product of combustion produced by motor vehicles, energy generation and otheroutdoor sources involving combustion, as well as indoor sources such as gas appliances and keroseneheaters (e.g., [55,56]).
Indoor NO2 levels reported in forty-six studies ranged between 3.4 µg/m3 in homes in QuebecCity, Canada [27], and 1210 µg/m3 in houses with indoor smoking and/or cooking in Lao PDR [38],in cases exceeding the WHO guidelines [1] for acute (200 µg/m3) or chronic (40 µg/m3) exposure(Table S1). Indoor levels where NO2 sources, such as gas appliances, were present were much higherthan outdoors, where the primary source of NO2 was road traffic [57]. NO2 concentrations were higherin all rooms in houses in the UK [58] and Germany [59] where gas cookers were used. NO2 levels inkitchens with a gas cooker in the UK were twice as high as in those with an electric cooker duringwinter [58]. Nitrogen oxides (NOx) and NO2 were higher in homes with cooktop pilot burners,relative to gas cooking without pilots. In homes in California, USA, where residents cooked 4 h ormore per day with gas, self-reported use of kitchen exhaust fans was associated with lower NOx andNO2 exposure [60].
Seasonal effects were also identified with increased indoor concentrations of NO2 in winter inJapan [55], which was thought to be due to the use of gas heaters. Cyrys et al. [59] observed outdoorNO2 concentrations approximately twice as high as indoor levels in Germany, while Cibella et al. [61]and Zipprich et al. [62] observed significantly higher indoor NO2 concentrations than outdoorconcentrations in Italy and USA respectively. Overall, the most important predictors of indoor NO2
concentrations were gas cooker use, followed by ventilation and outdoor NO2 levels.
3.2.2. Health Effects
Most reviewed evidence, mainly from US studies, suggested that exposure to higher indoor NO2
concentrations leads to symptoms in children with asthma, including chest tightness, shortness ofbreath, wheeze, cough, nocturnal symptoms, increased number of asthma attacks and inhaler use,and decreased forced expiratory volume in one second (FEV1) [63–67]. Children living in innercities appeared to be at higher risk for the adverse effects of NO2 given their relatively high indoorexposure [64], although increased risk of asthma morbidity also occurred at NO2 concentrations common

Int. J. Environ. Res. Public Health 2020, 17, 8972 7 of 24
in urban and suburban homes [57]. In addition, exposure to higher indoor NO2 concentrations wasassociated with increased respiratory symptoms and risk of COPD exacerbations in former smokerswith moderate to severe COPD [56].
3.3. Volatile Organic Compounds
3.3.1. Exposure Levels, Sources and Determinants
VOCs are emitted from a very wide range of indoor and outdoor sources through combustionand evaporation, e.g., cigarette smoking, solvent-related emissions, renovations, household productsand pesticides [5,68]. Typical VOCs found in the indoor environment include benzene, toluene,ethylbenzene and xylenes (BTEX) from fuel combustion and evaporation, and house renovations;benzene and styrene from cigarette smoking; alkanes from natural gas; 1,4-dichlorobenzene from mothrepellents; a-pinene from wood-based building materials; and limonene from fragranced householdcleaning and laundry products (e.g., [69–72]).
Forty-two studies reported indoor concentrations of one or more VOCs (excluding studies thatonly reported formaldehyde or other carbonyls). VOC levels in homes depended on many factors,such as the strength of emission sources, ventilation rates, and the indoor oxidative environment,which reflected differences in chemical use, building design and materials, occupant behaviour,and season (e.g., [32,73,74]). Reported VOC concentrations were generally higher indoors thanoutdoors, including for benzene, particularly in colder seasons due to reduced ventilation and theuse of oil and gas heaters [75–81]. Indoor sources were dominant for most VOCs and particularly forlimonene, a-pinene, hexanal, pentanal, o-xylene, and n-dodecane [76,82]. Use of artificial air freshenerwas significantly associated with total VOC (TVOC), benzene, toluene and ethylbenzene [78].
Thirty-nine studies reported indoor levels of benzene and/or toluene, ranging from 0.6 and3.0 µg/m3 in Kaunas, Lithuania [75], to 24.8 µg/m3 in Perth, Australia [74], and 325.5 µg/m3 in Sapporo,Japan [83], respectively (Table S1). Studies previously reviewed by Sarigiannis et al. (2011) reportedsimilar, though narrower, ranges of benzene (1.2–17.0 µg/m3) and toluene (4.3–86.2 µg/m3) in homeswithin the European Union [5]
Homes where ETS was present had higher concentrations of almost all VOCs includingbenzene [70,72,76,84,85]. Indoor toluene, ethylbenzene and xylenes concentrations were mainlydominated by outdoor sources such as road traffic [75,77], although toluene and o-xylene concentrationswere also elevated in smoking homes [85] and toluene levels were affected by the presence of carpets [76].Elevated levels of benzene and toluene were also found in basements and garages adjacent to residences,probably due to the use and storage of solvents, petrol and petrol-powered equipment [70,82].
Use of low-emission and non-absorbent indoor materials, and climatic conditions that favournatural ventilation, resulted in reduced indoor benzene, toluene and xylene levels in Athens, Greece,and in Seoul, Korea [77,78]. However, two studies from northern Europe reported indoor concentrationsof toluene and xylene significantly higher than outdoor levels [86,87]. An international study showedthat levels of VOCs in new homes decreased dramatically and were close to the mean values for theolder homes after one year from construction [88]. However, a study from Hong Kong [89] found norelationship between VOC concentrations (other than formaldehyde) and building age.
Occupant density was positively associated with indoor VOC and BTEX concentrations inAustralia [71] and Canada [70], respectively. Indoor VOC concentrations were negatively correlatedwith ventilation. Indoor alkanes and aromatics were associated with proximity to major roads. Levels ofVOCs in Australian dwellings were lower than those from studies in North America and Europe,probably due to the leakier nature of Australian dwellings [71].
3.3.2. Health Effects
Many VOCs are classified as known or possible carcinogens (benzene in particular is a knownhuman carcinogen mainly associated with leukaemia risk), irritants and toxicants, and measurement

Int. J. Environ. Res. Public Health 2020, 17, 8972 8 of 24
of TVOCs may underestimate the risks associated with individual compounds [5,70]. Most VOCs havealso been reported to be significant risk factors for asthma [73,74,90–92], with the strongest associationwith benzene followed by ethylbenzene and toluene. However, after adjustment for confoundingfactors, no significant associations were found between residential benzene exposure and respiratoryhealth in infants in Spain [79], or between low-level exposure to VOCs (except for d-limonene) andasthma status in children in Portugal [93]. Exposure to high concentration of VOCs during infancyincreased the risk of atopic dermatitis in Korean children [94]. Residential exposure to a-pinene wasassociated with throat and respiratory symptoms in Japan [83]. However, there were no significanteffects of a-pinene on SBS symptoms [95]. Overall, there was less attention on the SBS in the studiesreviewed here than in the earlier IAQ review by Jones (1999) [9].
3.4. Formaldehyde and Other Carbonyls
3.4.1. Exposure Levels, Sources and Determinants
Formaldehyde is mainly emitted from building materials (e.g., insulating materials andpressed-wood products), household products (e.g., paints, cleaning products, pesticides, adhesives),parquet flooring and carpets, smoking (although not a dominant source), and unvented fuel-burningappliances (e.g., [5,55,89,96]). Carbonyl compounds can also occur in the indoor environment assecondary pollutants as products of the reaction of a primarily pollutants with ozone.
Thirty-three studies reported indoor formaldehyde levels with concentrations ranging from7.5 µg/m3 in Quebec City, Canada [37], to 134 µg/m3 in new homes (first year) across various cities inJapan [88] (Table S1). Studies previously reviewed by Sarigiannis et al. (2011) reported a narrowerrange of formaldehyde concentrations (12.3–46.1 µg/m3) in homes within the European Union [5].Differences among indoor concentrations of formaldehyde were due to differences in building ages,geography, building materials, furniture, and household products. Formaldehyde levels were generallyhigher in newer houses [55,78,89], particularly in those with wooden frames or furniture bought newor restored [76,97]. Maruo et al. (2010) estimated the relationship between formaldehyde levels and theage and temperature of homes in Japan [98]. They obtained the highest formaldehyde concentrationsfor apartments 0–2 years after their renovation, with a linear relationship between formaldehydeconcentration and years after renovation. Formaldehyde and a-pinene related to wooden materialsneeded a longer flushing period than other VOCs in new homes [88].
Indoor formaldehyde and styrene levels in Hong Kong were higher than in other East Asiancities in Japan, China, Korea, Hong Kong and Taiwan, reflecting the higher prevalence of householdproducts and materials containing these chemicals in Hong Kong [89]. An Italian study [97] reportedlower indoor concentrations of formaldehyde than those reported in Japan [99] and France [96,100].Formaldehyde levels ranged very widely in households in England [101] and Canada [102,103].
Indoor sources were dominant for formaldehyde, acetaldehyde and acetone [76,104].Formaldehyde concentrations tended to be higher in summer when temperatures were higher.For example, Rancière et al. [105] found an increase in the concentrations of formaldehyde as a resultof indoor chemistry involving oxidants such as ozone, which is present at higher concentrationsin summer, and unsaturated organic compounds, such as terpenes, in homes in Paris. However,formaldehyde and acetaldehyde levels were significantly higher in winter than in spring-summer indwellings in Bari, Italy [97], possibly because of windows kept open during good weather.
3.4.2. Health Effects
Formaldehyde is carcinogenic to humans, based on increased risk of nasopharyngeal cancerand leukaemia [1]. It is also an irritant of the upper respiratory tract with symptoms such as eye,nose and throat irritation commonly associated with indoor exposure. Exposure to low concentrationsof formaldehyde for a short period of time influences the skin barrier function in patients with atopicdermatitis. Low level exposure to indoor formaldehyde may increase the risk of allergic sensitization

Int. J. Environ. Res. Public Health 2020, 17, 8972 9 of 24
to common aeroallergens in children [78], although this risk was low in households in south Italy [97].Young children experiencing recent indoor renovation in German houses showed increased risk ofeczema [106]. Formaldehyde was associated with neurological symptoms (difficulty concentrating)in a study in UAE [107]. Elevated levels of indoor aldehydes increased the possible risk of SBS inresidents living in new houses in Japan [108].
3.5. Polycyclic Aromatic Hydrocarbons
3.5.1. Exposure Levels, Sources and Determinants
PAHs are products of incomplete combustion generated through wood, coal, oil, and gasburning, smoking, waste incineration, industrial power generation, and vehicle emissions (e.g., [75]).PAHs with low molecular weight (i.e., with 2 or 3 rings) are emitted in the gaseous phase,while high-molecular-weight PAHs (i.e., with 5 or more rings) are emitted in the particulate phase [109].
Twelve studies reported indoor levels of PAHs, with the sum of different groups of PAHs rangingfrom 1.5 ng/m3 in homes in Agra, India [40], to 9568 ng/m3 in homes in Hangzhou, China [110] (Table S1).A number of studies, mostly from China and Japan, have shown residential indoor PAH concentrationsgenerally higher than outdoor [110,111], but the opposite was observed in a suburban home in Brisbane,Australia [112]. Indoor air PAHs, especially low-molecular-weight PAHs, mainly came from indooremission sources. Higher PAH concentrations were observed in smoking houses in China, Japan,and the UK [84,113]. In non-smoking houses, moth repellent and cooking practice were the mainsources of 2- and 3-ring PAHs, respectively. Low-molecular-weight PAHs were also associated withkerosene heating and the outdoor pollution in non-smoking houses. In a study in Italy, the presenceof fireplaces could explain the higher indoor levels of total PAHs and pyrene (4-ring PAHs) found inrural households compared to urban households [114]. High-molecular-weight (5- and 6-ring) PAHsin indoor air were mainly associated with outdoor sources and their levels tended to be the same orlower than those in outdoor air.
PAH concentrations both indoor and outdoor were significantly higher in the gaseous fraction(2-, 3-, and 4-ring PAHs) than in the particulate fraction (5- and 6-ring PAHs) in India (Masih et al.,2010). PAHs in the indoor environment were mainly attributable to gas usage, cooking (frying and oilcombustion), smoking and incense burning, whereas outdoors the most common sources of PAHswere petrol and diesel vehicles.
3.5.2. Health Effects
There is evidence for the genotoxicity and carcinogenicity of many PAHs in animal species,and epidemiological studies demonstrated that there is a correlation between PAH exposure and cancerincidence for various human tissues [115].
3.6. Naphthalene
3.6.1. Exposure Levels, Sources and Determinants
Naphthalene (both a VOC and a 2-ring PAH) is a ubiquitous pollutant, and very high concentrationsare sometimes encountered indoors when it is used as an insect repellent or deodorant [82,116].Other sources that have an impact on indoor levels include (to lesser extents) cigarette smoking andmotor vehicle emissions.
Fourteen studies reported naphthalene levels in domestic indoor environments,with concentrations ranging from 0.12 µg/m3 in homes in Kaunas, Lithuania [75], to 26.3 µg/m3
(and in one case exceeding 1000 µg/m3) in houses in Michigan, USA [82]. Jia and Batterman(2010) suggested typical naphthalene concentrations ranged from 0.18 to 1.7 µg/m3 in non-smokers’homes [117], which were less variable than the indoor concentrations reported in this review (Table S1).Outdoor concentrations in urban areas reported by Jia and Batterman (2010) were typically lower than
Int. J. Environ. Res. Public Health 2020, 17, 8972 10 of 24
indoor levels [117]. Naphthalene was the dominant PAH at both urban background and roadsidelocations (indoors and outdoors) in Agra, India [118].
3.6.2. Health Effects
Large amounts of naphthalene in the air can irritate the eyes and respiratory system. The WHO(2010) established an annual average IAQ guideline (10 µg/m3) based on respiratory tract lesions,including tumors in the upper respiratory tract demonstrated in animal studies, and hemolytic anemiain humans [1]. Overall, naphthalene presents health risks in a subset of homes where inappropriateuse of repellents and deodorants takes place [116].
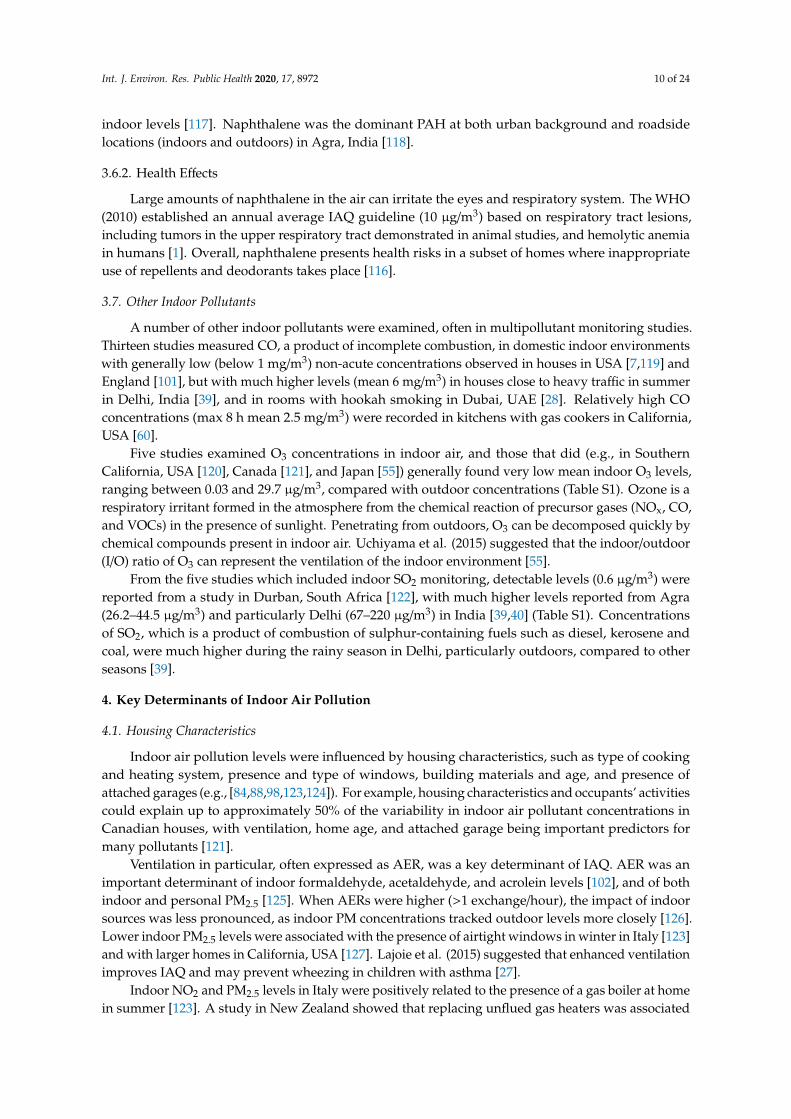
3.7. Other Indoor Pollutants
A number of other indoor pollutants were examined, often in multipollutant monitoring studies.Thirteen studies measured CO, a product of incomplete combustion, in domestic indoor environmentswith generally low (below 1 mg/m3) non-acute concentrations observed in houses in USA [7,119] andEngland [101], but with much higher levels (mean 6 mg/m3) in houses close to heavy traffic in summerin Delhi, India [39], and in rooms with hookah smoking in Dubai, UAE [28]. Relatively high COconcentrations (max 8 h mean 2.5 mg/m3) were recorded in kitchens with gas cookers in California,USA [60].
Five studies examined O3 concentrations in indoor air, and those that did (e.g., in SouthernCalifornia, USA [120], Canada [121], and Japan [55]) generally found very low mean indoor O3 levels,ranging between 0.03 and 29.7 µg/m3, compared with outdoor concentrations (Table S1). Ozone is arespiratory irritant formed in the atmosphere from the chemical reaction of precursor gases (NOx, CO,and VOCs) in the presence of sunlight. Penetrating from outdoors, O3 can be decomposed quickly bychemical compounds present in indoor air. Uchiyama et al. (2015) suggested that the indoor/outdoor(I/O) ratio of O3 can represent the ventilation of the indoor environment [55].
From the five studies which included indoor SO2 monitoring, detectable levels (0.6 µg/m3) werereported from a study in Durban, South Africa [122], with much higher levels reported from Agra(26.2–44.5 µg/m3) and particularly Delhi (67–220 µg/m3) in India [39,40] (Table S1). Concentrationsof SO2, which is a product of combustion of sulphur-containing fuels such as diesel, kerosene andcoal, were much higher during the rainy season in Delhi, particularly outdoors, compared to otherseasons [39].
4. Key Determinants of Indoor Air Pollution
4.1. Housing Characteristics
Indoor air pollution levels were influenced by housing characteristics, such as type of cookingand heating system, presence and type of windows, building materials and age, and presence ofattached garages (e.g., [84,88,98,123,124]). For example, housing characteristics and occupants’ activitiescould explain up to approximately 50% of the variability in indoor air pollutant concentrations inCanadian houses, with ventilation, home age, and attached garage being important predictors formany pollutants [121].
Ventilation in particular, often expressed as AER, was a key determinant of IAQ. AER was animportant determinant of indoor formaldehyde, acetaldehyde, and acrolein levels [102], and of bothindoor and personal PM2.5 [125]. When AERs were higher (>1 exchange/hour), the impact of indoorsources was less pronounced, as indoor PM concentrations tracked outdoor levels more closely [126].Lower indoor PM2.5 levels were associated with the presence of airtight windows in winter in Italy [123]and with larger homes in California, USA [127]. Lajoie et al. (2015) suggested that enhanced ventilationimproves IAQ and may prevent wheezing in children with asthma [27].
Indoor NO2 and PM2.5 levels in Italy were positively related to the presence of a gas boiler at homein summer [123]. A study in New Zealand showed that replacing unflued gas heaters was associated

Int. J. Environ. Res. Public Health 2020, 17, 8972 11 of 24
with a 67% reduction in NO2 levels in living rooms [128]. Replacing unvented gas stoves with electricstoves or placement of air purifiers with high-efficiency particulate air (HEPA) and carbon filtersdecreased indoor NO2 concentrations in homes in Baltimore, USA [129]. However, NO2 concentrationsin the kitchen and bedroom did not significantly change following range hood installation.
Attached garages affected indoor levels of VOCs such as benzene [91]. Concentrations measuredin houses with integral garages in the UK showed higher concentrations for almost all VOCs, but not forPAHs [84]. Wang et al. (2017) identified the most abundant VOCs in 25 homes in the UK, which includedbenzene, toluene, xylenes, d-limonene and a-pinene [90]. Although concentrations within homesvaried considerably, no statistically significant association with the building age, size, single/doubleglazed windows, or occupancy patterns was found in this study (possibly due to the small number ofhouses examined).
Green eco-friendly housing, which includes approaches to reduce indoor air pollutant sourcesand to increase energy efficiency, reduced the penetration of outdoor pollutants. Colton et al. (2014)observed lower PM2.5 and NO2 levels in green vs. conventional apartments, and improvements inself-reported health and reductions in SBS symptoms in Boston, USA [130]. However, making housesmore airtight could result in increased build up of indoor pollutants and building overheating [131,132].
Informal building structures made of low quality building materials were characterised byunregulated AERs, which were likely to contribute to indoor air pollution. In informal houses,surfaces (e.g., walls made of corrugated sheet, mud or wood) were likely to release or re-suspendparticles into the air when disturbed. Informally constructed houses in a study in Durban, South Africahad higher PM10 concentrations when compared to formally constructed houses [122]. Gurley et al.(2013) found that each additional external window and/or door was associated with a 22 µg/m3
decrease on average in indoor PM2.5 in households in Dhaka, Bangladesh [36]. PM10 concentrationswere significantly lower in houses in which cooking occurred on a stove with a chimney, compared tohouses in which cooking occurred on stoves without chimneys in Lao PDR [38].
4.2. Occupancy, Natural Ventilation and Activity Patterns
Indoor pollution levels were positively associated with household and personal activities, such ascooking, smoking, use of a fireplace, stove, candles, incense or vacuum cleaners, and interior rebuildingor renovation (e.g., [132–136]), as well as with the number of occupants in the household [137,138].Extremely high indoor concentrations of chemicals (naphthalene, p-dichlorobenzene) were associatedwith inappropriate use of insecticides and space deodorisers [55,116].
Natural ventilation and window opening were beneficial or in cases detrimental for IAQ,depending on the location of the household, the emission source and the season. Open windows weregenerally beneficial in houses with smokers [20,139]. In Denmark, opening of windows in infants’bedrooms during the summer decreased PM2.5 concentrations, whereas open windows during winterresulted in a higher indoor concentrations possibly due to greater contributions of outdoor PM2.5 [139].Open windows were associated with significantly lower indoor PM2.5 and PM10 levels in Baltimore,USA [134]. In the same study, the use of air conditioning did not have a significant impact on indoorPM2.5 or PM10 [134]. Klepeis et al. (2017) did not observe an association between particle counts andwindow opening, use of kitchen exhaust fans, or other ventilation activities in low-income householdsin San Diego, USA [127]. In a study in Italy, indoor NO2 concentrations increased with increasingnumber of hours of open windows in summer [123].
PM2.5 concentrations were reduced by use of a range hood for frying, by not using candles,a fireplace or a stove, by increasing the distance between the bedroom and the smoking area and byopening windows in houses of smokers in Denmark [139]. Agricultural and housing variables werepoorly associated with indoor and outdoor PM10 and PM2.5 in rural Iowa, USA, except for homecleanliness which was highly associated with indoor PM10 [140]. Major determinants of indoor NO2
concentrations in two cohorts in Spain and one in the UK were the heating/cooking fuel used in thehouse (gas fire and gas cooker increased average NO2 concentrations by 1.27 and 2.13 fold, respectively),
Int. J. Environ. Res. Public Health 2020, 17, 8972 12 of 24
parental cigarette smoking, and season of measurement [141]. NOx, NO2 and CO were higher inhomes that cooked with gas and increased with amount of gas cooking in California, USA [60].
Tobacco smoking and burning of incense were significant contributors to indoor air pollutionin studies in South Africa [122] and India [142]. Vanker et al. (2015) found a significant associationbetween the use of fossil fuels for cooking and increased benzene, CO and NO2 levels in Cape Town,South Africa [143]. A study by Lawrence et al. (2005) in Agra, India, suggested that indoor sources(e.g., wood burning, smoking) mainly affected indoor CO levels during winter [144]. At urban siteswhere NO and NO2 concentrations were very high, IAQ was mainly affected by outdoor sources.At these sites, the usage of heavy diesel generators and traffic pollution were the major outdoor sourcesaffecting IAQ.
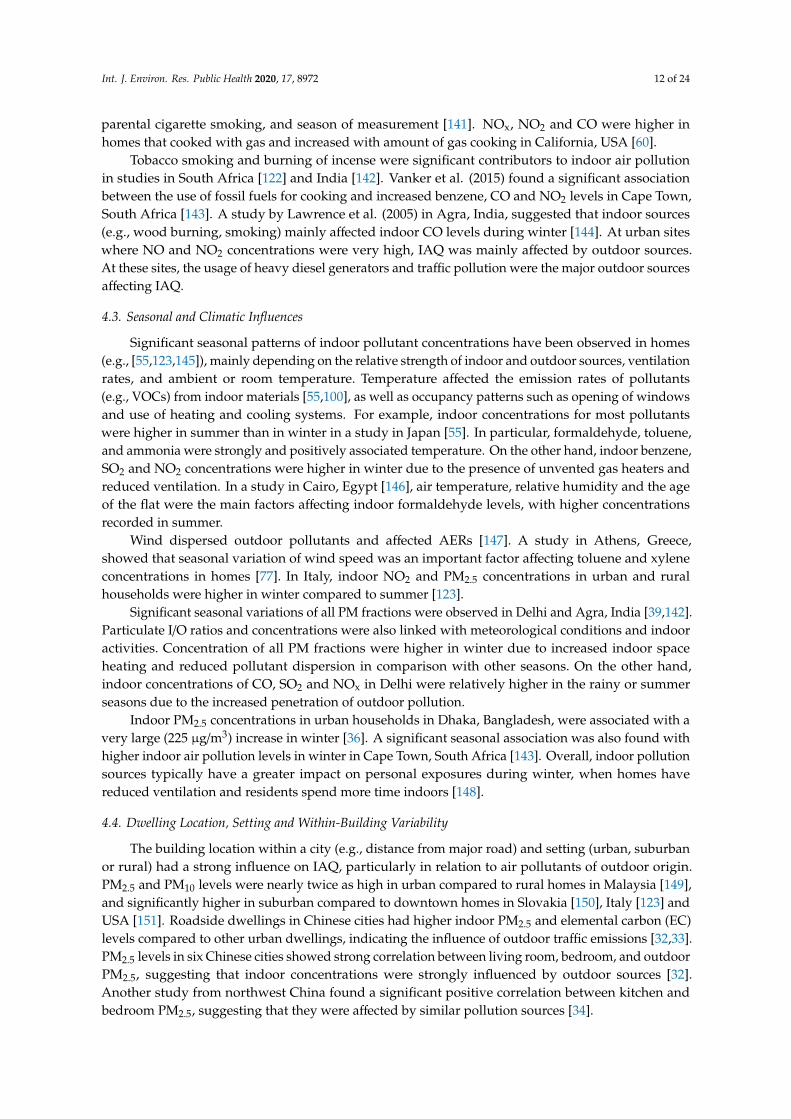
4.3. Seasonal and Climatic Influences
Significant seasonal patterns of indoor pollutant concentrations have been observed in homes(e.g., [55,123,145]), mainly depending on the relative strength of indoor and outdoor sources, ventilationrates, and ambient or room temperature. Temperature affected the emission rates of pollutants(e.g., VOCs) from indoor materials [55,100], as well as occupancy patterns such as opening of windowsand use of heating and cooling systems. For example, indoor concentrations for most pollutantswere higher in summer than in winter in a study in Japan [55]. In particular, formaldehyde, toluene,and ammonia were strongly and positively associated temperature. On the other hand, indoor benzene,SO2 and NO2 concentrations were higher in winter due to the presence of unvented gas heaters andreduced ventilation. In a study in Cairo, Egypt [146], air temperature, relative humidity and the ageof the flat were the main factors affecting indoor formaldehyde levels, with higher concentrationsrecorded in summer.
Wind dispersed outdoor pollutants and affected AERs [147]. A study in Athens, Greece,showed that seasonal variation of wind speed was an important factor affecting toluene and xyleneconcentrations in homes [77]. In Italy, indoor NO2 and PM2.5 concentrations in urban and ruralhouseholds were higher in winter compared to summer [123].
Significant seasonal variations of all PM fractions were observed in Delhi and Agra, India [39,142].Particulate I/O ratios and concentrations were also linked with meteorological conditions and indooractivities. Concentration of all PM fractions were higher in winter due to increased indoor spaceheating and reduced pollutant dispersion in comparison with other seasons. On the other hand,indoor concentrations of CO, SO2 and NOx in Delhi were relatively higher in the rainy or summerseasons due to the increased penetration of outdoor pollution.
Indoor PM2.5 concentrations in urban households in Dhaka, Bangladesh, were associated with avery large (225 µg/m3) increase in winter [36]. A significant seasonal association was also found withhigher indoor air pollution levels in winter in Cape Town, South Africa [143]. Overall, indoor pollutionsources typically have a greater impact on personal exposures during winter, when homes havereduced ventilation and residents spend more time indoors [148].
4.4. Dwelling Location, Setting and Within-Building Variability
The building location within a city (e.g., distance from major road) and setting (urban, suburbanor rural) had a strong influence on IAQ, particularly in relation to air pollutants of outdoor origin.PM2.5 and PM10 levels were nearly twice as high in urban compared to rural homes in Malaysia [149],and significantly higher in suburban compared to downtown homes in Slovakia [150], Italy [123] andUSA [151]. Roadside dwellings in Chinese cities had higher indoor PM2.5 and elemental carbon (EC)levels compared to other urban dwellings, indicating the influence of outdoor traffic emissions [32,33].PM2.5 levels in six Chinese cities showed strong correlation between living room, bedroom, and outdoorPM2.5, suggesting that indoor concentrations were strongly influenced by outdoor sources [32].Another study from northwest China found a significant positive correlation between kitchen andbedroom PM2.5, suggesting that they were affected by similar pollution sources [34].

Int. J. Environ. Res. Public Health 2020, 17, 8972 13 of 24
Location also played a role in indoor NO2 and VOC levels in homes in Europe and USA [151–153].Urban dwellings in France were found to be more polluted than rural ones, with concentrationsapproximately 2-fold higher for NO2, benzene, toluene, ethylbenzene in urban homes [152].Indoor benzene, toluene, and xylene levels were influenced by location (i.e., centre or suburb),proximity to busy road and proximity to petrol station in Athens, Greece, with proximity to petrolstation or busy road having the greatest impact on indoor levels of benzene possibly due to higherevaporative emissions [77,153]. However, in a UK study, homes located on roadsides and homeslocated away from traffic had similar concentrations for high-molecular-weight PAHs and almost allVOCs, except toluene which was significantly higher in first-line homes [84].
There was limited evidence of IAQ variability within the same residence or building [30,45,62,104,145].For example, significant positive correlations between formaldehyde in bedrooms and living roomswere reported for homes in Spain [104], between PM2.5 in kitchens and living rooms in the UK [30],and between NO2 in bedrooms and living rooms in USA [62]. In a study in Western Australia,Jones et al. [154] showed that there were no significant differences between levels of PM measured attwo different heights in the living room, and between living room and bedroom levels. In a study inLao PDR, Morawska et al. [38] found no significant differences in PM10 levels as a function of cookinglocation within homes. However, Nasir and Colbeck [155] found higher PM levels in UK houses withopen plan kitchens compared to those with separate kitchens. In Boston, USA [156,157], there wastransfer of second-hand smoke within multiunit residential buildings, which had an impact on PM2.5
levels in smoke-free apartments directly adjacent to smoking households.
5. Discussion
This review focused on indoor air pollution levels, influencing factors and related health effects indomestic dwellings. We systematically reviewed the global scientific literature and extracted data from141 eligible studies published over eighteen years. Concentrations of most indoor pollutants varied verywidely, in cases exceeding WHO air quality guidelines (Table 1) [1,158,159]. The reviewed evidencesuggests that even in highly polluted urban environments, indoor activities play a major role in indoorexposure, particularly cigarette smoking for PM2.5, unvented gas appliances for NO2, moth repellentsfor naphthalene, and household products and materials for VOCs including formaldehyde.
Table 1. Mean indoor air pollutant concentrations (µg/m3) reported in the reviewed studies andrelevant indoor and/or outdoor World Health Organization guidelines [1,158,159].
Pollutant Range (indoor) WHO (indoor) WHO (outdoor)
PM2.5 1.7–428.6 - 25/10 e
PM10 11.0–1275 - 50/20 e
NO2 3.4–1210 200/40 a 200/40 a
Benzene 0.6–24.8 1.7 b 1.7 b
Toluene 3.0–325.5 - 1000/260 f
Formaldehyde 7.5–134.0 100 c 100 c
Naphthalene 0.12–26.3 10 d -a 1 h average/annual mean guidelines recommended by the WHO (2005; 2010) for outdoor and indoor air quality.b Concentration associated with an excess lifetime risk of 1/100,000 in the WHO (2000; 2010) guidelines for outdoorand indoor air quality. c Not to be exceeded at any 30 min interval during a day recommended by the WHO (2005;2010) for outdoor and indoor air quality. d Annual mean guideline recommended by the WHO (2010) for indoor airquality. e The 24 h/annual mean guidelines recommended by the WHO (2005) for outdoor air quality. f 30 min/7 dayaverage guidelines recommended by the WHO (2000) for outdoor air quality.
The I/O concentration ratios (e.g., of PM2.5, BTEX) typically exceeded 1 in households with smokers.Formaldehyde was typically present at higher concentration indoors than outdoors, with indoor levelspositively correlated with temperature and negatively correlated with age of building. In most studies,AERs were negatively associated with indoor air pollution levels. Built environment characteristics,

Int. J. Environ. Res. Public Health 2020, 17, 8972 14 of 24
such as homes near high-traffic-density roads, redecoration, small house size, and informal buildingstructure contributed to high indoor air pollution levels.
Indoor NO2 and PM2.5 exposures were associated with the presence of acute respiratory symptomsand mild lung function impairment, respectively. Exposure to indoor NO2 is of particular concern inrelation to the respiratory health of children with asthma. Interventions aimed at lowering indoorNO2 concentrations, particularly in inner-city homes, may reduce asthma morbidity in children.Reducing the use of unvented gas heating in homes would substantially lower indoor NO2 exposure.
Improved stoves with chimneys, use of cleaner household fuels, and better housing and kitchendesign with improved ventilation will help control indoor air pollution. Behavioural interventions,such as raising awareness for reducing smoking and ETS exposure, reducing emissions from stovesand modified cooking practices (e.g., use of range hoods) will help in reducing indoor pollution levels.A large proportion of indoor carbonaceous PM (particularly EC) comes from outdoor sources in highlypolluted urban environments. Therefore, it is critical to control outdoor emissions from motor vehiclesto improve IAQ [160]. In highly polluted roadside environments, natural ventilation strategies shouldtake into account the location of windows and time of opening to reduce ingress of outdoor pollutants.
Interventions to reduce biomass burning for cooking and heating could result in a substantialreduction in indoor PM2.5 levels in lower income urban households. In high-income settings, there is atrend towards more airtight and smaller dwellings, often with an open plan configuration, which in thepresence of indoor pollution sources may result in higher exposures to indoor air pollutants. Domesticexposure to PM, NO2 and VOCs at levels even below current recommendations may increase the riskof childhood asthma. Therefore, it is important to better control indoor emissions, including PM2.5
from smoking, NO2 from gas appliances, formaldehyde from building materials and furnishings,and BTEX from integrated garages.
Low-income dwellings are often disproportionately affected by indoor air pollution due toinadequate ventilation, overcrowding, and greater contributions from indoor (e.g., smoking) andoutdoor (e.g., heavy road traffic) pollution sources [137,161,162]. Therefore, isolated interventions maynot be sufficient to reduce interrelated exposures to air pollutants from multiple sources, particularlyin low-income dwellings. Holistic system-based approaches are required to reduce health burdensand inequalities associated with exposure to chemical air pollutants, microbial contamination andoverheating in residences, as well as reduce the carbon footprint of the housing sector [130,131,163,164].These approaches involve controlling indoor sources of chemicals, improving ventilation, and providingair filtration [101,165–167].
As pointed out by other authors [9,168], we still know much less about IAQ than we do aboutoutdoor air quality. More comprehensive and standardised IAQ data and measurement methods [169],and information on related health effects, including synergistic effects of multipollutant exposures,are needed, particularly from countries undergoing rapid economic and demographic change in Africa,Central Asia, and Latin America.
6. Conclusions
Although most people spend the largest proportion of their time indoors, information about levelsof IAQ, particularly in homes, is sparse and less accessible than for outdoor air quality. We systematicallyreviewed 141 IAQ studies in homes in 29 countries published over a period of 18 years (2000–2017).Indoor levels of most air pollutants were very variable and largely depended on the strength of indoorsources, such as tobacco smoking, unvented gas appliances and certain household products (e.g., mothrepellents), proximity of residence to road traffic, and room ventilation rates. Intervention to improveIAQ, for example by removing indoor pollution sources, providing adequate mechanical ventilationwith air filtration or increasing natural ventilation during periods of the day when outdoor air pollutionis low, are likely to benefit occupants’ respiratory health and reduce asthma morbidity in children.Standardized IAQ measurement and analytical methods, and longer monitoring periods over multiple

Int. J. Environ. Res. Public Health 2020, 17, 8972 15 of 24
sites are needed to develop a more comprehensive understanding of the complex factors that influenceair quality in the home environment.
Supplementary Materials: The following are available online at http://www.mdpi.com/1660-4601/17/23/8972/s1,Search strategy; Search terms; Table S1: Summary of eligible study findings. References [2,7,16–105,107,108,110–114,116,118–130,132–157,159,160,169] are cited in the supplementary materials.
Author Contributions: Conceptualization, S.V.; Methodology, S.V., J.O.C., and A.D.; Data Curation, A.D., E.G.,S.S., K.S.G., A.S., and K.D.; Writing—Original Draft Preparation, S.V.; Writing—Review and Editing, E.G., S.S.,A.D., and K.S.G.; Visualization, S.V., E.G., and A.D.; Supervision, S.V.; Project Administration, A.D. and K.D.;Funding Acquisition, S.V. All authors have read and agreed to the published version of the manuscript.
Funding: This review of the scientific literature was funded by Dyson Technology Limited. The funder had norole in the design, execution, interpretation, or writing of this study.
Acknowledgments: We thank Sally Spankie (IOM) and Amelia Joshy (ANU) for their assistance with dataextraction, and Hilary Cowie (IOM) for critically reviewing the study findings.
Conflicts of Interest: The authors declare no conflict of interest.
References
1. World Health Organization. WHO Guidelines for Indoor Air Quality: Selected Pollutants; World HealthOrganization Regional Office for Europe: Copenhagen, Denmark, 2010. Available online: https://www.euro.who.int/__data/assets/pdf_file/0009/128169/e94535.pdf (accessed on 10 November 2020).
2. Lai, H.K.; Kendall, M.; Ferrier, H.; Lindup, I.; Alm, S.; Hänninen, O.; Jantunen, M.; Mathys, P.; Colvile, R.;Ashmore, M.R.; et al. Personal exposures and microenvironment concentrations of PM2.5, VOC, NO2 andCO in Oxford, UK. Atmos. Environ. 2004, 38, 6399–6410. [CrossRef]
3. Vardoulakis, S.; Kinney, P. Grand Challenges in Sustainable Cities and Health. Front. Sustain. Cities 2019, 1.[CrossRef]
4. de Juniac, A.; Kreis, I.; Ibison, J.; Murray, V. Epidemiology of unintentional carbon monoxide fatalities in theUK. Int. J. Environ. Health Res. 2012, 22, 210–219. [CrossRef] [PubMed]
5. Sarigiannis, D.A.; Karakitsios, S.P.; Gotti, A.; Liakos, I.L.; Katsoyiannis, A. Exposure to major volatile organiccompounds and carbonyls in European indoor environments and associated health risk. Environ. Int. 2011,37, 743–765. [CrossRef]
6. Jordan, R.E.; Cheng, K.K.; Miller, M.R.; Adab, P. Passive smoking and chronic obstructive pulmonary disease:Cross-sectional analysis of data from the Health Survey for England. BMJ Open 2011, 1, e000153. [CrossRef][PubMed]
7. Blanc, P.D.; Eisner, M.D.; Katz, P.P.; Yen, I.H.; Archea, C.; Earnest, G.; Janson, S.; Masharani, U.B.; Quinlan, P.J.;Hammond, S.K.; et al. Impact of the home indoor environment on adult asthma and rhinitis. J. Occup.Environ. Med. 2005, 47, 362–372. [CrossRef]
8. Rushton, L. Health impact of environmental tobacco smoke in the home. Rev. Environ. Health 2004, 19,291–309.
9. Jones, A.P. Indoor air quality and health. Atmos. Environ. 1999, 33, 4535–4564. [CrossRef]10. Vardoulakis, S.; Fisher, B.E.A.; Pericleous, K.; Gonzalez-Flesca, N. Modelling air quality in street canyons:
A review. Atmos. Environ. 2003, 37, 155–182. [CrossRef]11. Crump, D.; Brown, V.; Rowley, J.; Squire, R. Reducing ingress of organic vapours into homes situated on
contaminated land. Environ. Technol. 2004, 25, 443–450. [CrossRef]12. Vardoulakis, S.; Dimitrova, R.; Richards, K.; Hamlyn, D.; Camilleri, G.; Weeks, M.; Sini, J.-F.; Britter, R.;
Borrego, C.; Schatzmann, M.; et al. Numerical Model Inter-comparison for Wind Flow and TurbulenceAround Single-Block Buildings. Environ. Model. Assess. 2011, 16, 169–181. [CrossRef]
13. Hall, D.J.S.; Spanton, A.M. Ingress of External Contaminants into Buildings–A Review. AtmosphericDispersion Modelling Liaison Committee. 2012. ADMLC/2012/01. Available online: https://admlc.files.wordpress.com/2014/05/admlc-r7-2012-1.pdf (accessed on 10 November 2020).
14. Milner, J.; Vardoulakis, S.; Chalabi, Z.; Wilkinson, P. Modelling inhalation exposure to combustion-related airpollutants in residential buildings: Application to health impact assessment. Environ. Int. 2011, 37, 268–279.[CrossRef]

Int. J. Environ. Res. Public Health 2020, 17, 8972 16 of 24
15. Nazaroff, W. Exploring the consequences of climate change for indoor air quality*. Environ. Res. Lett. 2013, 8,015022. [CrossRef]
16. Ryan, P.H.; Brokamp, C.; Fan, Z.H.; Rao, M.B. Analysis of personal and home characteristics associated withthe elemental composition of PM2.5 in indoor, outdoor, and personal air in the RIOPA Study. Res. Rep. HealthEff. Inst. 2015, 185, 3–40.
17. Clougherty, J.E.; Houseman, E.A.; Levy, J.I. Source apportionment of indoor residential fine particulatematter using land use regression and constrained factor analysis. Indoor Air 2011, 21, 53–66. [CrossRef]
18. MacNeill, M.; Kearney, J.; Wallace, L.; Gibson, M.; Héroux, M.E.; Kuchta, J.; Guernsey, J.R.; Wheeler, A.J.Quantifying the contribution of ambient and indoor-generated fine particles to indoor air in residentialenvironments. Indoor Air 2014, 24, 362–375. [CrossRef]
19. Mohammadyan, M.; Ashmore, M. Personal Exposure and Indoor PM2.5 Concentrations in an UrbanPopulation. Indoor Built Environ. 2005, 14, 313–320. [CrossRef]
20. Wallace, L.; Mitchell, H.; O’Connor, G.; Neas, L.; Lippmann, M.; Kattan, M.; Koenig, J.; Stout, J.; Vaughn, B.;Wallace, D.; et al. Particle concentrations in inner-city homes of children with asthma: The effect of smoking,cooking, and outdoor pollution. Environ. Health Perspect. 2003, 111, 1265–1272. [CrossRef]
21. Rojas-Bracho, L.; Suh, H.H.; Catalano, P.J.; Koutrakis, P. Personal exposures to particles and their relationshipswith personal activities for chronic obstructive pulmonary disease patients living in Boston. J. Air WasteManag. Assoc. 2004, 54, 207–217. [CrossRef]
22. Rosen, L.; Zucker, D.; Hovell, M.; Brown, N.; Ram, A.; Myers, V. Feasibility of Measuring Tobacco SmokeAir Pollution in Homes: Report from a Pilot Study. Int. J. Environ. Res. Public Health 2015, 12, 15129–15142.[CrossRef]
23. Wyss, A.B.; Jones, A.C.; Bølling, A.K.; Kissling, G.E.; Chartier, R.; Dahlman, H.J.; Rodes, C.E.; Archer, J.;Thornburg, J.; Schwarze, P.E.; et al. PM2.5 exposure and self-reported use of wood stoves and other indoorcombustion sources in urban nonsmoking homes in Norway. PLoS ONE 2016, 11, e0166440. [CrossRef]
24. Brown, D.R.; Alderman, N.; Weinberger, B.; Lewis, C.; Bradley, J.; Curtis, L. Outdoor wood furnaces createsignificant indoor particulate pollution in neighboring homes. Inhal. Toxicol. 2014, 26, 628–635. [CrossRef]
25. McNamara, M.; Thornburg, J.; Semmens, E.; Ward, T.; Noonan, C. Coarse particulate matter and airborneendotoxin within wood stove homes. Indoor Air 2013, 23, 498–505. [CrossRef]
26. Mills, L.M.; Semple, S.E.; Wilson, I.S.; MacCalman, L.; Amos, A.; Ritchie, D.; O’Donnell, R.; Shaw, A.;Turner, S.W. Factors influencing exposure to secondhand smoke in preschool children living with smokingmothers. Nicotine Tob. Res. 2012, 14, 1435–1444. [CrossRef]
27. Lajoie, P.; Aubin, D.; Gingras, V.; Daigneault, P.; Ducharme, F.; Gauvin, D.; Fugler, D.; Leclerc, J.M.; Won, D.;Courteau, M.; et al. The IVAIRE project—A randomized controlled study of the impact of ventilation onindoor air quality and the respiratory symptoms of asthmatic children in single family homes. Indoor Air2015, 25, 582–597. [CrossRef]
28. Weitzman, M.; Yusufali, A.H.; Bali, F.; Vilcassim, M.J.R.; Gandhi, S.; Peltier, R.; Nadas, A.; Sherman, S.; Lee, L.;Hong, Z.; et al. Effects of hookah smoking on indoor air quality in homes. Tob. Control 2016, 26, 586–591.[CrossRef]
29. Jones, N.C.; Thornton, C.A.; Mark, D.; Harrison, R.M. Indoor/outdoor relationships of particulate matter indomestic homes with roadside, urban and rural locations. Atmos. Environ. 2000, 34, 2603–2612. [CrossRef]
30. Wigzell, E.; Kendall, M.; Nieuwenhuijsen, M.J. The spatial and temporal variation of particulate matterwithin the home. J. Expo. Sci. Environ. Epidemiol. 2000, 10, 307–314. [CrossRef]
31. Tunno, B.J.; Kyra Naumoff, S.; Cambal, L.; Tripathy, S.; Holguin, F.; Lioy, P.; Clougherty, J.E. Indoor airsampling for fine particulate matter and black carbon in industrial communities in Pittsburgh. Sci. TotalEnviron. 2015, 536, 108–115. [CrossRef]
32. Hu, J.; Li, N.; Lv, Y.; Liu, J.; Xie, J.; Zhang, H. Investigation on Indoor Air Pollution and Childhood Allergiesin Households in Six Chinese Cities by Subjective Survey and Field Measurements. Int. J. Environ. Res.Public Health 2017, 14, 979. [CrossRef]
33. Lai, S.; Ho, K.F.; Zhang, Y.; Lee, S.; Huang, Y.; Zou, S. Characteristics of Residential Indoor CarbonaceousAerosols: A Case Study in Guangzhou, Pearl River Delta Region. Aerosol Air Qual. Res. 2010, 10, 472–478.[CrossRef]
Int. J. Environ. Res. Public Health 2020, 17, 8972 17 of 24
34. Li, T.; Cao, S.; Fan, D.; Zhang, Y.; Wang, B.; Zhao, X.; Leaderer, B.P.; Shen, G.; Zhang, Y.; Duan, X. Householdconcentrations and personal exposure of PM2.5 among urban residents using different cooking fuels. Sci. TotalEnviron. 2016, 548–549, 6–12. [CrossRef]
35. Cao, J.J.; Lee, S.C.; Chow, J.C.; Cheng, Y.; Ho, K.F.; Fung, K.; Liu, S.X.; Watson, J.G. Indoor/outdoorrelationships for PM2.5 and associated carbonaceous pollutants at residential homes in Hong Kong-casestudy. Indoor Air 2005, 15, 197–204. [CrossRef]
36. Gurley, E.S.; Salje, H.; Homaira, N.; Ram, P.K.; Haque, R.; Petri, W.A., Jr.; Bresee, J.; Moss, W.J.; Luby, S.P.;Breysse, P.; et al. Seasonal concentrations and determinants of indoor particulate matter in a low-incomecommunity in Dhaka, Bangladesh. Environ. Res 2013, 121, 11–16. [CrossRef]
37. Lévesque, B.; Allaire, S.; Gauvin, D.; Koutrakis, P.; Gingras, S.; Rhainds, M.; Prud’Homme, H.; Duchesne, J.-F.Wood-burning appliances and indoor air quality. Sci. Total Environ. 2001, 281, 47–62. [CrossRef]
38. Morawska, L.; Mengersen, K.; Wang, H.; Tayphasavanh, F.; Darasavong, K.; Holmes, N.S. Pollutantconcentrations within households in Lao PDR and association with housing characteristics and occupants’activities. Environ. Sci. Technol. 2011, 45, 882–889. [CrossRef]
39. Kulshreshtha, P.; Khare, M.; Seetharaman, P. Indoor air quality assessment in and around urban slums ofDelhi city, India. Indoor Air 2008, 18, 488–498. [CrossRef]
40. Taneja, A.; Saini, R.; Masih, A. Indoor air quality of houses located in the urban environment of Agra, India.Ann. N. Y. Acad. Sci. 2008, 1140, 228–245. [CrossRef]
41. Custódio, D.; Pinho, I.; Cerqueira, M.; Nunes, T.; Pio, C. Indoor and outdoor suspended particulate matterand associated carbonaceous species at residential homes in northwestern Portugal. Sci. Total Environ. 2014,473–474, 72–76. [CrossRef]
42. BéruBé, K.A.; Sexton, K.J.; Jones, T.P.; Moreno, T.; Anderson, S.; Richards, R.J. The spatial and temporalvariations in PM10 mass from six UK homes. Sci. Total Environ. 2004, 324, 41–53. [CrossRef]
43. Chen, Y.; Li, X.; Zhu, T.; Han, Y.; Lv, D. PM2.5-bound PAHs in three indoor and one outdoor air in Beijing:Concentration, source and health risk assessment. Sci. Total Environ. 2017, 586, 255–264. [CrossRef]
44. Wallace, L. Indoor sources of ultrafine and accumulation mode particles: Size distributions, size-resolvedconcentrations, and source strengths. Aerosol Sci. Technol. 2006, 40, 348–360. [CrossRef]
45. Karottki, D.G.; Spilak, M.; Frederiksen, M.; Jovanovic Andersen, Z.; Madsen, A.M.; Ketzel, M.; Massling, A.;Gunnarsen, L.; Møller, P.; Loft, S. Indoor and outdoor exposure to ultrafine, fine and microbiologicallyderived particulate matter related to cardiovascular and respiratory effects in a panel of elderly urban citizens.Int. J. Environ. Res. Public Health 2015, 12, 1667–1686. [CrossRef]
46. Bhangar, S.; Mullen, N.A.; Hering, S.V.; Kreisberg, N.M.; Nazaroff, W.W. Ultrafine particle concentrationsand exposures in seven residences in northern California. Indoor Air 2011, 21, 132–144. [CrossRef]
47. Weichenthal, S.; Dufresne, A.; Infante-Rivard, C.; Joseph, L. Indoor ultrafine particle exposures and homeheating systems: A cross-sectional survey of Canadian homes during the winter months. J. Expo. Sci.Environ. Epidemiol. 2007, 17, 288–297. [CrossRef]
48. Olsen, Y.; Karottki, D.G.; Jensen, D.M.; Bekö, G.; Kjeldsen, B.U.; Clausen, G.; Hersoug, L.-G.; Holst, G.J.;Wierzbicka, A.; Sigsgaard, T.; et al. Vascular and lung function related to ultrafine and fine particles exposureassessed by personal and indoor monitoring: A cross-sectional study. Environ. Health 2014, 13, 112. [CrossRef]
49. McCormack, M.C.; Breysse, P.N.; Matsui, E.C.; Hansel, N.N.; Williams, D.; Curtin-Brosnan, J.; Eggleston, P.;Diette, G.B. In-home particle concentrations and childhood asthma morbidity. Environ. Health Perspect. 2009,117, 294–298. [CrossRef]
50. McCormack, M.C.; Breysse, P.N.; Matsui, E.C.; Hansel, N.N.; Peng, R.D.; Curtin-Brosnan, J.; Williams, D.L.;Wills-Karp, M.; Diette, G.B. Indoor particulate matter increases asthma morbidity in children with non-atopicand atopic asthma. Ann. Allergy Asthma Immunol. 2011, 106, 308–315. [CrossRef]
51. Jung, K.H.; Hsu, S.I.; Yan, B.; Moors, K.; Chillrud, S.N.; Ross, J.; Wang, S.; Perzanowski, M.S.; Kinney, P.L.;Whyatt, R.M.; et al. Childhood exposure to fine particulate matter and black carbon and the development ofnew wheeze between ages 5 and 7 in an urban prospective cohort. Environ. Int. 2012, 45, 44–50. [CrossRef]
52. Delfino, R.; Quintana, P.; Floro, J.; Gastañaga, V.; Samimi, B.; Kleinman, M.; Liu, L.J.; Bufalino, C.; Wu, C.-F.;McLaren, C. Association of FEV1 in Asthmatic Children with Personal and Microenvironmental Exposure toAirborne Particulate Matter. Environ. Health Perspect. 2004, 112, 932–941. [CrossRef]

Int. J. Environ. Res. Public Health 2020, 17, 8972 18 of 24
53. Chi, M.C.; Guo, S.E.; Hwang, S.L.; Chou, C.T.; Lin, C.M.; Lin, Y.C. Exposure to Indoor Particulate MatterWorsens the Symptoms and Acute Exacerbations in Chronic Obstructive Pulmonary Disease Patients ofSouthwestern Taiwan: A Pilot Study. Int. J. Environ. Res. Public Health 2016, 14, 4. [CrossRef] [PubMed]
54. Osman, L.M.; Douglas, J.G.; Garden, C.; Reglitz, K.; Lyon, J.; Gordon, S.; Ayres, J.G. Indoor air quality inhomes of patients with chronic obstructive pulmonary disease. Am. J. Respir. Crit. Care Med. 2007, 176,465–472. [CrossRef]
55. Uchiyama, S.; Tomizawa, T.; Tokoro, A.; Aoki, M.; Hishiki, M.; Yamada, T.; Tanaka, R.; Sakamoto, H.;Yoshida, T.; Bekki, K.; et al. Gaseous chemical compounds in indoor and outdoor air of 602 houses throughoutJapan in winter and summer. Environ. Res. 2015, 137, 364–372. [CrossRef]
56. Hansel, N.; McCormack, M.; Belli, A.; Matsui, E.; Peng, R.; Aloe, C.; Paulin, L.; Williams, D.A.; Diette, G.;Breysse, P. In-home air pollution is linked to respiratory morbidity in former smokers with COPD. Am. J.Respir. Crit. Care Med. 2013, 187. [CrossRef]
57. Belanger, K.; Holford, T.R.; Gent, J.F.; Hill, M.E.; Kezik, J.M.; Leaderer, B.P. Household levels of nitrogendioxide and pediatric asthma severity. Epidemiology 2013, 24, 320–330. [CrossRef]
58. Kornartit, C.; Sokhi, R.S.; Burton, M.A.; Ravindra, K. Activity pattern and personal exposure to nitrogendioxide in indoor and outdoor microenvironments. Environ. Int. 2010, 36, 36–45. [CrossRef]
59. Cyrys, J.; Heinrich, J.; Richter, K.; Wölke, G.; Wichmann, H.E. Sources and concentrations of indoor nitrogendioxide in Hamburg (west Germany) and Erfurt (east Germany). Sci. Total Environ. 2000, 250, 51–62. [CrossRef]
60. Mullen, N.A.; Li, J.; Russell, M.L.; Spears, M.; Less, B.D.; Singer, B.C. Results of the California Healthy HomesIndoor Air Quality Study of 2011–2013: Impact of natural gas appliances on air pollutant concentrations.Indoor Air 2016, 26, 231–245. [CrossRef]
61. Cibella, F.; Cuttitta, G.; Della Maggiore, R.; Ruggieri, S.; Panunzi, S.; De Gaetano, A.; Bucchieri, S.; Drago, G.;Melis, M.R.; La Grutta, S.; et al. Effect of indoor nitrogen dioxide on lung function in urban environment.Environ. Res. 2015, 138, 8–16. [CrossRef]
62. Zipprich, J.L.; Harris, S.A.; Fox, J.C.; Borzelleca, J.F. An analysis of factors that influence personal exposureto nitrogen oxides in residents of Richmond, Virginia. J. Expo. Anal. Environ. Epidemiol. 2002, 12, 273–285.[CrossRef]
63. Belanger, K.; Gent, J.F.; Triche, E.W.; Bracken, M.B.; Leaderer, B.P. Association of indoor nitrogen dioxideexposure with respiratory symptoms in children with asthma. Am. J. Respir. Crit. Care Med. 2006, 173,297–303. [CrossRef]
64. Hansel, N.; Breysse, P.; McCormack, M.; Matsui, E.; Curtin-Brosnan, J.; Williams, D.A.; Moss, J.; Cuhran, J.;Diette, G. A Longitudinal Study of Indoor Nitrogen Dioxide Levels and Respiratory Symptoms in Inner-CityChildren with Asthma. Environ. Health Perspect. 2008, 116, 1428–1432. [CrossRef]
65. Kattan, M.; Gergen, P.; Eggleston, P.; Visness, C.; Mitchell, H. Health effects of indoor nitrogen dioxide andpassive smoking on urban asthmatic children. J. Allergy Clin. Immunol. 2007, 120, 618–624. [CrossRef]
66. Gillespie-Bennett, J.; Pierse, N.; Wickens, K.; Crane, J.; Howden-Chapman, P. The respiratory health effects ofnitrogen dioxide in children with asthma. Eur. Respir. J. 2011, 38, 303–309. [CrossRef]
67. Paulin, L.M.; Williams, D.L.; Peng, R.; Diette, G.B.; McCormack, M.C.; Breysse, P.; Hansel, N.N. 24-h Nitrogendioxide concentration is associated with cooking behaviors and an increase in rescue medication use inchildren with asthma. Environ. Res. 2017, 159, 118–123. [CrossRef]
68. Delgado-Saborit, J.M.; Aquilina, N.J.; Meddings, C.; Baker, S.; Harrison, R.M. Relationship of personalexposure to volatile organic compounds to home, work and fixed site outdoor concentrations. Sci. TotalEnviron. 2011, 409, 478–488. [CrossRef]
69. Tanaka-Kagawa, T.; Uchiyama, S.; Matsushima, E.; Sasaki, A.; Kobayashi, H.; Kobayashi, H.; Yagi, M.;Tsuno, M.; Arao, M.; Ikemoto, K.; et al. Survey of volatile organic compounds found in indoor and outdoorair samples from Japan. Bull. Natl. Inst. Health Sci. 2005, 123, 27–31.
70. Wheeler, A.J.; Wong, S.L.; Khouri, C.; Zhu, J. Predictors of indoor BTEX concentrations in Canadian residences.Health Rep. 2013, 24, 11.
71. Cheng, M.; Galbally, I.E.; Molloy, S.B.; Selleck, P.W.; Keywood, M.D.; Lawson, S.J.; Powell, J.C.; Gillett, R.W.;Dunne, E. Factors controlling volatile organic compounds in dwellings in Melbourne, Australia. Indoor Air2016, 26, 219–230. [CrossRef]

Int. J. Environ. Res. Public Health 2020, 17, 8972 19 of 24
72. Adgate, J.L.; Eberly, L.E.; Stroebel, C.; Pellizzari, E.D.; Sexton, K. Personal, indoor, and outdoor VOCexposures in a probability sample of children. J. Expo. Anal. Environ. Epidemiol. 2004, 14 (Suppl. S1), S4–S13.[CrossRef]
73. Chin, J.Y.; Godwin, C.; Parker, E.; Robins, T.; Lewis, T.; Harbin, P.; Batterman, S. Levels and sources of volatileorganic compounds in homes of children with asthma. Indoor Air 2014, 24, 403–415. [CrossRef]
74. Rumchev, K.; Spickett, J.; Bulsara, M.; Phillips, M.; Stick, S. Association of domestic exposure to volatileorganic compounds with asthma in young children. Thorax 2004, 59, 746–751. [CrossRef]
75. Kliucininkas, L.; Martuzevicius, D.; Krugly, E.; Prasauskas, T.; Kauneliene, V.; Molnar, P.; Strandberg, B.Indoor and outdoor concentrations of fine particles, particle-bound PAHs and volatile organic compoundsin Kaunas, Lithuania. J. Environ. Monit. 2011, 13, 182–191. [CrossRef] [PubMed]
76. Villanueva, F.; Tapia, A.; Amo-Salas, M.; Notario, A.; Cabañas, B.; Martínez, E. Levels and sources of volatileorganic compounds including carbonyls in indoor air of homes of Puertollano, the most industrializedcity in central Iberian Peninsula. Estimation of health risk. Int. J. Hyg. Environ. Health 2015, 218, 522–534.[CrossRef]
77. Alexopoulos, E.C.; Chatzis, C.; Linos, A. An analysis of factors that influence personal exposure to tolueneand xylene in residents of Athens, Greece. BMC Public Health 2006, 6, 50. [CrossRef]
78. Lee, J.H.; Lee, H.S.; Park, M.R.; Lee, S.W.; Kim, E.H.; Cho, J.B.; Kim, J.; Han, Y.; Jung, K.; Cheong, H.K.; et al.Relationship between indoor air pollutant levels and residential environment in children with atopicdermatitis. Allergy Asthma Immunol. Res. 2014, 6, 517–524. [CrossRef]
79. Ferrero, A.; Esplugues, A.; Estarlich, M.; Llop, S.; Cases, A.; Mantilla, E.; Ballester, F.; Iñiguez, C. Infants’indoor and outdoor residential exposure to benzene and respiratory health in a Spanish cohort. Environ. Pollut.2017, 222, 486–494. [CrossRef]
80. Adgate, J.L.; Church, T.R.; Ryan, A.D.; Ramachandran, G.; Fredrickson, A.L.; Stock, T.H.; Morandi, M.T.;Sexton, K. Outdoor, indoor, and personal exposure to VOCs in children. Environ. Health Perspect. 2004, 112,1386–1392. [CrossRef]
81. Phillips, M.L.; Esmen, N.A.; Hall, T.A.; Lynch, R. Determinants of exposure to volatile organic compounds infour Oklahoma cities. J. Expo. Anal. Environ. Epidemiol. 2005, 15, 35–46. [CrossRef]
82. Du, L.; Batterman, S.; Godwin, C.; Rowe, Z.; Chin, J.Y. Air exchange rates and migration of VOCs in basementsand residences. Indoor Air 2015, 25, 598–609. [CrossRef]
83. Saijo, Y.; Kishi, R.; Sata, F.; Katakura, Y.; Urashima, Y.; Hatakeyama, A.; Kobayashi, S.; Jin, K.; Kurahashi, N.;Kondo, T.; et al. Symptoms in relation to chemicals and dampness in newly built dwellings. Int. Arch. Occup.Environ. Health 2004, 77, 461–470. [CrossRef]
84. Harrison, R.M.; Delgado-Saborit, J.M.; Baker, S.J.; Aquilina, N.; Meddings, C.; Harrad, S.; Matthews, I.;Vardoulakis, S.; Anderson, H.R. Measurement and modeling of exposure to selected air toxics for healtheffects studies and verification by biomarkers. Res. Rep. Health Eff. Inst. 2009, 143, 3–100.
85. Saraga, D.E.; Maggos, T.; Helmis, C.G.; Michopoulos, J.; Bartzis, J.G.; Vasilakos, C. PM1 and PM2.5 ioniccomposition and VOCs measurements in two typical apartments in Athens, Greece: Investigation of smokingcontribution to indoor air concentrations. Environ. Monit. Assess. 2010, 167, 321–331. [CrossRef]
86. Schneider, P.; Gebefügi, I.; Richter, K.; Wölke, G.; Schnelle, J.; Wichmann, H.E.; Heinrich, J. Indoor andoutdoor BTX levels in German cities. Sci. Total Environ. 2001, 267, 41–51. [CrossRef]
87. Jurvelin, J.A.; Edwards, R.D.; Vartiainen, M.; Pasanen, P.; Jantunen, M.J. Residential Indoor, Outdoor,and Workplace Concentrations of Carbonyl Compounds: Relationships with Personal ExposureConcentrations and Correlation with Sources. J. Air Waste Manag. Assoc. 2003, 53, 560–573. [CrossRef]
88. Park, J.S.; Ikeda, K. Variations of formaldehyde and VOC levels during 3 years in new and older homes.Indoor Air 2006, 16 2, 129–135. [CrossRef]
89. Guo, H.; Kwok, N.H.; Cheng, H.R.; Lee, S.C.; Hung, W.T.; Li, Y.S. Formaldehyde and volatile organiccompounds in Hong Kong homes: Concentrations and impact factors. Indoor Air 2009, 19, 206–217.[CrossRef]
90. Wang, C.M.; Barratt, B.; Carslaw, N.; Doutsi, A.; Dunmore, R.; Ward, M.; Lewis, A. Unexpectedly highconcentrations of monoterpenes in a study of UK homes. Environ. Sci. Process. Impacts 2017, 19. [CrossRef]
91. Gordian, M.E.; Stewart, A.W.; Morris, S.S. Evaporative gasoline emissions and asthma symptoms. Int. J.Environ. Res. Public Health 2010, 7, 3051–3062. [CrossRef]

Int. J. Environ. Res. Public Health 2020, 17, 8972 20 of 24
92. Singleton, R.; Salkoski, A.J.; Bulkow, L.; Fish, C.; Dobson, J.; Albertson, L.; Skarada, J.; Kovesi, T.; McDonald, C.;Hennessy, T.W.; et al. Housing characteristics and indoor air quality in households of Alaska Native childrenwith chronic lung conditions. Indoor Air 2017, 27, 478–486. [CrossRef]
93. Madureira, J.; Paciência, I.; Cavaleiro-Rufo, J.; Fernandes Ede, O. Indoor air risk factors for schoolchildren’shealth in Portuguese homes: Results from a case-control survey. J. Toxicol. Environ. Health Part A 2016, 79,938–953. [CrossRef]
94. Kwon, J.H.; Kim, E.; Chang, M.H.; Park, E.A.; Hong, Y.C.; Ha, M.; Park, H.; Kim, Y.; Park, C.; Ha, E.H. Indoortotal volatile organic compounds exposure at 6 months followed by atopic dermatitis at 3 years in children.Pediatric Allergy Immunol. 2015, 26, 352–358. [CrossRef]
95. Takeda, M.; Saijo, Y.; Yuasa, M.; Kanazawa, A.; Araki, A.; Kishi, R. Relationship between sick building syndromeand indoor environmental factors in newly built Japanese dwellings. Int. Arch. Occup. Environ. Health 2009,82, 583–593. [CrossRef]
96. Marchand, C.; Bulliot, B.; Le Calvé, S.; Mirabel, P. Aldehyde measurements in indoor environments inStrasbourg (France). Atmos. Environ. 2006, 40, 1336–1345. [CrossRef]
97. Lovreglio, P.; Carrus, A.; Iavicoli, S.; Drago, I.; Persechino, B.; Soleo, L. Indoor formaldehyde and acetaldehydelevels in the province of Bari, South Italy, and estimated health risk. J. Environ. Monit. 2009, 11, 955–961.[CrossRef]
98. Maruo, Y.Y.; Yamada, T.; Nakamura, J.; Izumi, K.; Uchiyama, M. Formaldehyde measurements in residentialindoor air using a developed sensor element in the Kanto area of Japan. Indoor Air 2010, 20, 486–493.[CrossRef]
99. Takigawa, T.; Saijo, Y.; Morimoto, K.; Nakayama, K.; Shibata, E.; Tanaka, M.; Yoshimura, T.; Chikara, H.;Kishi, R. A longitudinal study of aldehydes and volatile organic compounds associated with subjectivesymptoms related to sick building syndrome in new dwellings in Japan. Sci. Total Environ. 2012, 417–418,61–67. [CrossRef]
100. Clarisse, B.; Laurent, A.M.; Seta, N.; Le Moullec, Y.; El Hasnaoui, A.; Momas, I. Indoor aldehydes:Measurement of contamination levels and identification of their determinants in Paris dwellings. Environ. Res.2003, 92, 245–253. [CrossRef]
101. Raw, G.J.; Coward, S.K.; Brown, V.M.; Crump, D.R. Exposure to air pollutants in English homes. J. Expo.Anal. Environ. Epidemiol. 2004, 14 (Suppl. S1), S85–S94. [CrossRef]
102. Gilbert, N.L.; Guay, M.; David Miller, J.; Judek, S.; Chan, C.C.; Dales, R.E. Levels and determinants offormaldehyde, acetaldehyde, and acrolein in residential indoor air in Prince Edward Island, Canada.Environ. Res. 2005, 99, 11–17. [CrossRef]
103. Gilbert, N.L.; Gauvin, D.; Guay, M.; Héroux, M.-È.; Dupuis, G.; Legris, M.; Chan, C.C.; Dietz, R.N.; Lévesque, B.Housing characteristics and indoor concentrations of nitrogen dioxide and formaldehyde in Quebec City,Canada. Environ. Res. 2006, 102, 1–8. [CrossRef]
104. Rovira, J.; Roig, N.; Nadal, M.; Schuhmacher, M.; Domingo, J.L. Human health risks of formaldehyde indoorlevels: An issue of concern. J. Environ. Sci. Health Part A 2016, 51, 357–363. [CrossRef]
105. Rancière, F.; Dassonville, C.; Roda, C.; Laurent, A.M.; Le Moullec, Y.; Momas, I. Contribution of ozone toairborne aldehyde formation in Paris homes. Sci. Total Environ. 2011, 409, 4480–4483. [CrossRef]
106. Herbarth, O.; Fritz, G.J.; Rehwagen, M.; Richter, M.; Röder, S.; Schlink, U. Association between indoorrenovation activities and eczema in early childhood. Int. J. Hyg. Environ. Health 2006, 209, 241–247.[CrossRef]
107. Yeatts, K.B.; El-Sadig, M.; Leith, D.; Kalsbeek, W.; Al-Maskari, F.; Couper, D.; Funk, W.E.; Zoubeidi, T.;Chan, R.L.; Trent, C.B.; et al. Indoor air pollutants and health in the United Arab Emirates. Environ. HealthPerspect. 2012, 120, 687–694. [CrossRef]
108. Takigawa, T.; Wang, B.L.; Saijo, Y.; Morimoto, K.; Nakayama, K.; Tanaka, M.; Shibata, E.; Yoshimura, T.;Chikara, H.; Ogino, K.; et al. Relationship between indoor chemical concentrations and subjective symptomsassociated with sick building syndrome in newly built houses in Japan. Int. Arch. Occup. Environ. Health2010, 83, 225–235. [CrossRef]
109. Kume, K.; Ohura, T.; Noda, T.; Amagai, T.; Fusaya, M. Seasonal and spatial trends of suspended-particleassociated polycyclic aromatic hydrocarbons in urban Shizuoka, Japan. J. Hazard. Mater. 2007, 144, 513–521.[CrossRef]

Int. J. Environ. Res. Public Health 2020, 17, 8972 21 of 24
110. Liu, Y.; Zhu, L.; Shen, X. Polycyclic Aromatic Hydrocarbons (PAHs) in Indoor and Outdoor Air of Hangzhou,China. Environ. Sci. Technol. 2001, 35, 840–844. [CrossRef]
111. Ohura, T.; Sugiyama, T.; Amagai, T.; Fusaya, M.; Matsushita, H. Simultaneous liquid chromatographicdetermination of 39 polycyclic aromatic hydrocarbons in indoor and outdoor air and application to a surveyon indoor air pollution in Fuji, Japan. J. AOAC Int. 2002, 85, 188–202. [CrossRef]
112. Kennedy, K.; Macova, M.; Leusch, F.; Bartkow, M.E.; Hawker, D.W.; Zhao, B.; Denison, M.S.; Mueller, J.F.Assessing indoor air exposures using passive sampling with bioanalytical methods for estrogenicity and arylhydrocarbon receptor activity. Anal. Bioanal. Chem. 2009, 394, 1413–1421. [CrossRef]
113. Lu, H.; Amagai, T.; Ohura, T. Comparison of polycyclic aromatic hydrocarbon pollution in Chinese andJapanese residential air. J. Environ. Sci. 2011, 23, 1512–1517. [CrossRef]
114. Cirillo, T.; Montuori, P.; Mainardi, P.; Russo, I.; Triassi, M.; Amodio-Cocchieri, R. Multipathway PolycyclicAromatic Hydrocarbon and Pyrene Exposure Among Children Living in Campania (Italy). J. Environ. Sci.Health Part A 2006, 41, 2089–2107. [CrossRef]
115. Brender, J.D.; Pichette, J.L.; Suarez, L.; Hendricks, K.A.; Holt, M. Health risks of residential exposure topolycyclic aromatic hydrocarbons. Arch. Environ. Health 2003, 58, 111–118. [CrossRef] [PubMed]
116. Batterman, S.; Chin, J.-Y.; Jia, C.; Godwin, C.; Parker, E.; Robins, T.; Max, P.; Lewis, T. Sources, concentrationsand risks of naphthalene in indoor and outdoor air. Indoor Air 2012, 22, 266–278. [CrossRef]
117. Jia, C.; Batterman, S. A critical review of naphthalene sources and exposures relevant to indoor and outdoorair. Int. J. Environ. Res. Public Health 2010, 7, 2903–2939. [CrossRef]
118. Masih, J.; Masih, A.; Kulshrestha, A.; Singhvi, R.; Taneja, A. Characteristics of polycyclic aromatichydrocarbons in indoor and outdoor atmosphere in the North central part of India. J. Hazard. Mater.2010, 177, 190–198. [CrossRef]
119. Pickett, A.R.; Bell, M.L. Assessment of indoor air pollution in homes with infants. Int. J. Environ. Res.Public Health 2011, 8, 4502–4520. [CrossRef]
120. Lee, K.; Xue, J.; Geyh, A.S.; Ozkaynak, H.; Leaderer, B.P.; Weschler, C.J.; Spengler, J.D. Nitrous acid, nitrogendioxide, and ozone concentrations in residential environments. Environ. Health Perspect. 2002, 110, 145–150.[CrossRef]
121. Héroux, M.E.; Clark, N.; Van Ryswyk, K.; Mallick, R.; Gilbert, N.L.; Harrison, I.; Rispler, K.; Wang, D.;Anastassopoulos, A.; Guay, M.; et al. Predictors of indoor air concentrations in smoking and non-smokingresidences. Int. J. Environ. Res. Public Health 2010, 7, 3080–3099. [CrossRef]
122. Jafta, N.; Barregard, L.; Jeena, P.M.; Naidoo, R.N. Indoor air quality of low and middle income urbanhouseholds in Durban, South Africa. Environ. Res. 2017, 156, 47–56. [CrossRef]
123. Simoni, M.; Scognamiglio, A.; Carrozzi, L.; Baldacci, S.; Angino, A.; Pistelli, F.; Di Pede, F.; Viegi, G. Indoorexposures and acute respiratory effects in two general population samples from a rural and an urban area inItaly. J. Expo. Anal. Environ. Epidemiol. 2004, 14 (Suppl. 1), S144–S152. [CrossRef]
124. Batterman, S.; Jia, C.; Hatzivasilis, G. Migration of volatile organic compounds from attached garages toresidences: A major exposure source. Environ. Res. 2007, 104, 224–240. [CrossRef]
125. Rojas-Bracho, L.; Suh, H.H.; Koutrakis, P. Relationships among personal, indoor, and outdoor fine and coarseparticle concentrations for individuals with COPD. J. Expo. Anal. Environ. Epidemiol. 2000, 10, 294–306.[CrossRef]
126. Abt, E.; Suh, H.H.; Allen, G.; Koutrakis, P. Characterization of indoor particle sources: A study conducted inthe metropolitan Boston area. Environ. Health Perspect. 2000, 108, 35–44. [CrossRef]
127. Klepeis, N.E.; Bellettiere, J.; Hughes, S.C.; Nguyen, B.; Berardi, V.; Liles, S.; Obayashi, S.; Hofstetter, C.R.;Blumberg, E.; Hovell, M.F. Fine particles in homes of predominantly low-income families with children andsmokers: Key physical and behavioral determinants to inform indoor-air-quality interventions. PLoS ONE2017, 12, e0177718. [CrossRef]
128. Gillespie-Bennett, J.; Pierse, N.; Wickens, K.; Crane, J.; Nicholls, S.; Shields, D.; Boulic, M.; Viggers, H.;Baker, M.; Woodward, A.; et al. Sources of nitrogen dioxide (NO2) in New Zealand homes: Findings from acommunity randomized controlled trial of heater substitutions. Indoor Air 2008, 18, 521–528. [CrossRef]
129. Paulin, L.M.; Diette, G.B.; Scott, M.; McCormack, M.C.; Matsui, E.C.; Curtin-Brosnan, J.; Williams, D.L.;Kidd-Taylor, A.; Shea, M.; Breysse, P.N.; et al. Home interventions are effective at decreasing indoor nitrogendioxide concentrations. Indoor Air 2014, 24, 416–424. [CrossRef]

Int. J. Environ. Res. Public Health 2020, 17, 8972 22 of 24
130. Colton, M.D.; MacNaughton, P.; Vallarino, J.; Kane, J.; Bennett-Fripp, M.; Spengler, J.D.; Adamkiewicz, G.Indoor air quality in green vs. conventional multifamily low-income housing. Environ. Sci. Technol. 2014, 48,7833–7841. [CrossRef]
131. Vardoulakis, S.; Dimitroulopoulou, C.; Thornes, J.; Lai, K.M.; Taylor, J.; Myers, I.; Heaviside, C.;Mavrogianni, A.; Shrubsole, C.; Chalabi, Z.; et al. Impact of climate change on the domestic indoorenvironment and associated health risks in the UK. Environ. Int. 2015, 85, 299–313. [CrossRef]
132. Coombs, K.C.; Chew, G.L.; Schaffer, C.; Ryan, P.H.; Brokamp, C.; Grinshpun, S.A.; Adamkiewicz, G.;Chillrud, S.; Hedman, C.; Colton, M.; et al. Indoor air quality in green-renovated vs. non-green low-incomehomes of children living in a temperate region of US (Ohio). Sci. Total Environ. 2016, 554–555, 178–185.[CrossRef]
133. Lung, S.-C.C.; Mao, I.F.; Liu, L.-J.S. Residents’ particle exposures in six different communities in Taiwan.Sci. Total Environ. 2007, 377, 81–92. [CrossRef] [PubMed]
134. McCormack, M.C.; Breysse, P.N.; Hansel, N.N.; Matsui, E.C.; Tonorezos, E.S.; Curtin-Brosnan, J.;Williams, D.L.; Buckley, T.J.; Eggleston, P.A.; Diette, G.B. Common household activities are associatedwith elevated particulate matter concentrations in bedrooms of inner-city Baltimore pre-school children.Environ. Res. 2008, 106, 148–155. [CrossRef]
135. Cortez-Lugo, M.; Moreno-Macias, H.; Holguin-Molina, F.; Chow, J.C.; Watson, J.G.; Gutiérrez-Avedoy, V.;Mandujano, F.; Hernández-Ávila, M.; Romieu, I. Relationship between indoor, outdoor, and personal fineparticle concentrations for individuals with COPD and predictors of indoor-outdoor ratio in Mexico city.J. Expo. Sci. Environ. Epidemiol. 2008, 18, 109–115. [CrossRef] [PubMed]
136. Romagnoli, P.; Balducci, C.; Perilli, M.; Vichi, F.; Imperiali, A.; Cecinato, A. Indoor air quality at life and workenvironments in Rome, Italy. Environ. Sci. Pollut. Res. Int. 2016, 23, 3503–3516. [CrossRef]
137. Byun, H.; Bae, H.; Kim, D.; Shin, H.; Yoon, C. Effects of socioeconomic factors and human activities onchildren’s PM10 exposure in inner-city households in Korea. Int. Arch. Occup. Environ. Health 2010, 83,867–878. [CrossRef] [PubMed]
138. Kovesi, T.; Creery, D.; Gilbert, N.L.; Dales, R.; Fugler, D.; Thompson, B.; Randhawa, N.; Miller, J.D. Indoor airquality risk factors for severe lower respiratory tract infections in Inuit infants in Baffin Region, Nunavut:A pilot study. Indoor Air 2006, 16, 266–275. [CrossRef]
139. Raaschou-Nielsen, O.; Sørensen, M.; Hertel, O.; Chawes, B.L.; Vissing, N.; Bønnelykke, K.; Bisgaard, H.Predictors of indoor fine particulate matter in infants’ bedrooms in Denmark. Environ. Res. 2011, 111, 87–93.[CrossRef]
140. Pavilonis, B.T.; Anthony, T.R.; O’Shaughnessy, P.T.; Humann, M.J.; Merchant, J.A.; Moore, G.; Thorne, P.S.;Weisel, C.P.; Sanderson, W.T. Indoor and outdoor particulate matter and endotoxin concentrations in anintensely agricultural county. J. Expo. Sci. Environ. Epidemiol. 2013, 23, 299–305. [CrossRef]
141. García Algar, O.; Pichini, S.; Basagaña, X.; Puig, C.; Vall, O.; Torrent, M.; Harris, J.; Sunyer, J.; Cullinan, P.Concentrations and determinants of NO2 in homes of Ashford, UK and Barcelona and Menorca, Spain.Indoor Air 2004, 14, 298–304. [CrossRef]
142. Massey, D.; Kulshrestha, A.; Masih, J.; Taneja, A. Seasonal trends of PM10, PM5.0, PM2.5 & PM1.0 in indoorand outdoor environments of residential homes located in North-Central India. Build. Environ. 2012, 47,223–231. [CrossRef]
143. Vanker, A.; Barnett, W.; Nduru, P.M.; Gie, R.P.; Sly, P.D.; Zar, H.J. Home environment and indoor air pollutionexposure in an African birth cohort study. Sci. Total Environ. 2015, 536, 362–367. [CrossRef]
144. Lawrence, A.J.; Masih, A.; Taneja, A. Indoor/outdoor relationships of carbon monoxide and oxides of nitrogenin domestic homes with roadside, urban and rural locations in a central Indian region. Indoor Air 2005, 15,76–82. [CrossRef]
145. Topp, R.; Cyrys, J.; Gebefügi, I.; Schnelle-Kreis, J.; Richter, K.; Wichmann, H.E.; Heinrich, J. Indoor andoutdoor air concentrations of BTEX and NO2: Correlation of repeated measurements. J. Environ. Monit.2004, 6, 807–812. [CrossRef]
146. Khoder, M.; Shakour, A.; Farag, S.A.; Awad, A. Indoor and outdoor formaldehyde concentrations in homesin residential areas in Greater Cairo. J. Environ. Monit. 2000, 2, 123–126. [CrossRef]
147. Su, F.C.; Mukherjee, B.; Batterman, S. Determinants of personal, indoor and outdoor VOC concentrations:An analysis of the RIOPA data. Environ. Res 2013, 126, 192–203. [CrossRef]

Int. J. Environ. Res. Public Health 2020, 17, 8972 23 of 24
148. Brown, K.W.; Sarnat, J.A.; Suh, H.H.; Coull, B.A.; Spengler, J.D.; Koutrakis, P. Ambient site, home outdoorand home indoor particulate concentrations as proxies of personal exposures. J. Environ. Monit. 2008, 10,1041–1051. [CrossRef]
149. Nazariah, S.; Jalaludin, J.; Md Akim, A. Interleukin-6 via Sputum Induction as Biomarker of Inflammationfor Indoor Particulate Matter among Primary School Children in Klang Valley, Malaysia. Glob. J. Health Sci.2013, 5, 93–105. [CrossRef]
150. Brauer, M.; Hrubá, F.; Mihalíková, E.; Fabiánová, E.; Miskovic, P.; Plziková, A.; Lendacká, M.; Vandenberg, J.;Cullen, A. Personal exposure to particles in Banská Bystrica, Slovakia. J. Expo. Anal. Environ. Epidemiol.2000, 10, 478–487. [CrossRef]
151. Simons, E.; Curtin-Brosnan, J.; Buckley, T.; Breysse, P.; Eggleston, P.A. Indoor environmental differencesbetween inner city and suburban homes of children with asthma. J. Urban Health 2007, 84, 577–590. [CrossRef]
152. Hulin, M.; Caillaud, D.; Annesi-Maesano, I. Indoor air pollution and childhood asthma: Variations betweenurban and rural areas. Indoor Air 2010, 20, 502–514. [CrossRef]
153. Chatzis, C.; Alexopoulos, E.C.; Linos, A. Indoor and outdoor personal exposure to benzene in Athens, Greece.Sci. Total Environ. 2005, 349, 72–80. [CrossRef]
154. Jones, J.; Stick, S.; Dingle, P.; Franklin, P. Spatial variability of particulates in homes: Implications for infantexposure. Sci. Total Environ. 2007, 376, 317–323. [CrossRef]
155. Nasir, Z.; Colbeck, I. Particulate pollution in different housing types in a UK suburban location. Sci. TotalEnviron. 2013, 445–446C, 165–176. [CrossRef]
156. Russo, E.T.; Hulse, T.E.; Adamkiewicz, G.; Levy, D.E.; Bethune, L.; Kane, J.; Reid, M.; Shah, S.N. Comparisonof indoor air quality in smoke-permitted and smoke-free multiunit housing: Findings from the BostonHousing Authority. Nicotine Tob. Res. 2015, 17, 316–322. [CrossRef]
157. King, B.A.; Travers, M.J.; Cummings, K.M.; Mahoney, M.C.; Hyland, A.J. Secondhand smoke transfer inmultiunit housing. Nicotine Tob. Res. 2010, 12, 1133–1141. [CrossRef]
158. World Health Organization. Air Quality Guidelines for Europe, 2nd ed.; World Health Organization RegionalOffice for Europe: Copenhagen, Denmark, 2000. Available online: https://www.euro.who.int/__data/assets/pdf_file/0005/74732/E71922.pdf (accessed on 22 November 2020).
159. World Health Organization. Air Quality Guidelines. Global Update 2005; World Health Organization RegionalOffice for Europe: Copenhagen, Denmark, 2006. Available online: https://www.euro.who.int/__data/assets/pdf_file/0005/78638/E90038.pdf (accessed on 22 November 2020).
160. Vardoulakis, S.; Kettle, R.; Cosford, P.; Lincoln, P.; Holgate, S.; Grigg, J.; Kelly, F.; Pencheon, D. Local actionon outdoor air pollution to improve public health. Int. J. Public Health 2018, 63, 557–565. [CrossRef]
161. Baxter, L.K.; Clougherty, J.E.; Laden, F.; Levy, J.I. Predictors of concentrations of nitrogen dioxide, fineparticulate matter, and particle constituents inside of lower socioeconomic status urban homes. J. Expo. Sci.Environ. Epidemiol. 2007, 17, 433–444. [CrossRef]
162. Rotko, T.; Koistinen, K.; HÄNninen, O.; Jantunen, M. Sociodemographic descriptors of personal exposure tofine particles (PM2.5) in EXPOLIS Helsinki. J. Expo. Sci. Environ. Epidemiol. 2000, 10, 385–393. [CrossRef]
163. Shrubsole, C.; Macmillan, A.; Davies, M.; May, N. 100 Unintended consequences of policies to improve theenergy efficiency of the UK housing stock. Indoor Built Environ. 2014, 23, 340–352. [CrossRef]
164. World Health Organization. Health in the Green Economy: Health Co-Benefits of Climate Change Mitigation-HousingSector; World Health Organization: Geneva, Switzerland, 2011; Available online: https://www.who.int/publications/i/item/9789241501712 (accessed on 10 November 2020).
165. Asikainen, A.; Carrer, P.; Kephalopoulos, S.; de Fernandes, E.O.; Wargocki, P.; Hänninen, O. Reducing burdenof disease from residential indoor air exposures in Europe (HEALTHVENT project). Environ. Health 2016,15, S35. [CrossRef]
166. Kelly, F.J.; Fussell, J.C. Improving indoor air quality, health and performance within environments wherepeople live, travel, learn and work. Atmos. Environ. 2019, 200, 90–109. [CrossRef]
167. US EPA. Improving Indoor Air Quality. Indoor Air Quality (IAQ). US Environmental Protection Agency.2020. Available online: https://www.epa.gov/indoor-air-quality-iaq/improving-indoor-air-quality (accessedon 10 November 2020).

Int. J. Environ. Res. Public Health 2020, 17, 8972 24 of 24
168. RCPCH & RCP. The inside story: Health effects of indoor air quality on children and young people. RoyalCollege of Paediatrics and Child Health & Royal College of Physicians. 2020. Available online: https://www.rcpch.ac.uk/resources/inside-story-health-effects-indoor-air-quality-children-young-people (accessed on 10November 2020).
169. Vardoulakis, S.; Crawford, J.; Davis, A.; Steinle, S.; Sleeuwenhoek, A.; Galea, K.; Dixon, K. Indoor Exposureto Selected Air Pollutants and Associated Health Effects–a Global Review; IOM Technical Report; Institute ofOccupational Medicine: Edinburgh, UK, 2019.
Publisher’s Note: MDPI stays neutral with regard to jurisdictional claims in published maps and institutionalaffiliations.
© 2020 by the authors. Licensee MDPI, Basel, Switzerland. This article is an open accessarticle distributed under the terms and conditions of the Creative Commons Attribution(CC BY) license (http://creativecommons.org/licenses/by/4.0/).