Embed Size (px)
Citation preview
Page iii
United States EPA Document# 740-S1-7002 Environmental Protection Agency Office of Chemical Safety and Pollution Prevention
Indoor Exposure Product Testing Protocols
Version 2.0
Indoor Exposure Product Testing Protocols – Version 1.0 September
2017
Page iv
Table of Contents
Introduction .................................................................................................................................................. 1 Contextualizing Information for Product Use ............................................................................................... 4 1. Exposure Testing Protocol 1: Source Characterization .................................................................... 6 2. Exposure Testing Protocol 2: Emission from Water to Air ............................................................ 11 3. Exposure Testing Protocol 3: Short-Term Emission Testing .......................................................... 25 4. Exposure Testing Protocol 4: Long-Term Emission Testing – Partition and Diffusion
Coefficients .................................................................................................................................... 40 5. Exposure Testing Protocol 5: Particulate Matter Formation Due to Mechanical
Forces Applied to Product or Article Surfaces ............................................................................... 47 6. Exposure Testing Protocol 6: Transfer of Chemicals from Source to Settled Dust ........................ 56 7. Exposure Testing Protocol 7: Photolysis under Simulated Indoor Lighting Conditions ................. 64 8. Exposure Testing Protocol: Migration to Saliva (Oral Exposure) ................................................... 71 9. Exposure Testing Protocol 9: Migration to Sweat (Dermal Exposure) .......................................... 77 10. Exposure Testing Protocol 10: Migration of chemical from solid material to water..................... 84
Tables
Table 1. Indoor Exposure Testing Protocols Names and Metrics……………………………………………………………2 Table 2. Test Matrix for Emissions from Water or Aqueous Solutions to Indoor Air………………………………16 Table 3. Commonly used environmental chambers for testing of chemical emissions from products and articles…………………………………………………………………………………………………………………………………………………..25 Table 4. An example of test matrix and temperature settings for micro chamber tests. .......................... 37 Table 5. Methods for experimental determination of partition and diffusion coefficients. ...................... 40 Table 6. Experimental schedule for Transfer of Chemicals from Source to Settled Dust . ......................... 57 Table 7. Operating conditions of small test chambers for testing migration of chemical of
interest from source article to dust. .............................................................................................. 58 Table 8. Example Experimental Schedule for Migration into Water: Liquid to Solid Ratio………………………85 Table 9. EPA Analytical Methods for Various Chemicals…………………………………………………………………………87 Table 10. Example Experimental Schedule for Migration Rate into Water over Time…………………………102 Table 11. Sample Collection Schedule for Migration Rate into Water over Time………………………………….104
Figures
Figure 1. Conceptual Diagram of protocols overlaid with source-to-dose continuum for consumer products and articles. ..................................................................................................... 3
Figure 2. Experimental Set up for Determination of overall mass transfer coefficient for still water or aqueous solution………………………………………………………………………………………………………………………………….11 Figure 3.. Experimental Set up for Determination of overall mass transfer coefficient for
agitated water or aqueous solution ............................................................................................... 12

Page v
Figure 4.Overall liquid phase mass transfer coefficient versus 1/T(K) Data points are hypothetical ................................................................................................................................... 18
Figure 5. Schematic of example 30 m3 full-scale chamber (Liu et al., 2012) ............................................. 25 Figure 6.. Schematic diagram of small-scale VOC emission chamber (Yerramilli et al., 2010) ................... 26 Figure 7. Schematic plot of Field and Laboratory Emission Cell (FLEC) (Kim et al., 2007) .......................... 26 Figure 8.. Photo of micro-chamber/ thermal extractor (µCTE) from Markes International,
Llantrisant, UK (Cleanroom Technology, 2011) ............................................................................. 26 Figure 9. An example of a micro chamber system. Note that the Polyurethane Foam (PUF)
air samplers are directly connected to the chamber air outlet. .................................................... 33 Figure 10.. An example of area-specific emission rate (E) as a function of temperature based
on data from micro chamber tests. ............................................................................................... 34 Figure 11.. An example of the relationship between the inlet air flow rate and air pressure at
the gas tank regulator. Note that the calibration curves at different temperatures may be slightly different ................................................................................................................ 36
Figure 12.. Schematic plot of the microbalance test system (Cox et al., 2001) .......................................... 39 Figure 13.. Schematic plot of the dynamic-static chamber (He et al., 2010) ............................................. 40 Figure 14.. Schematic plot of the diffusion metric method (Bodalal et al., 2001) ...................................... 40 Figure 15.. Schematic plot of the dual-chamber method (Xiong et al., 2009)............................................ 41 Figure 16. Schematic plot of the dual chamber method (Liu et al., 2014). ................................................ 42 Figure 17. Schematic plot of the cup method (Blondeau et al., 2003). ...................................................... 42 Figure 18. Schematic of the test facility for particle generation due to abrasion. ..................................... 46 Figure 19. Expected particle count profile during an abrasion test. The data collected after
the abraser stops is used to estimate the deposition rate constant ............................................ 52 Figure 20. Semi-log plot for particle count versus time during the decay phase (i.e. flushing
the chamber).................................................................................................................................. 53 Figure 21. Collecting dust from test panels by placing the panel on the 4-mil-thick aluminum
foil vertically (left) and then tilt it further towards the dust-laden side to form an approximately 80⁰ angle with the aluminum foil. Use the spatula rod to tap the back of the panel in both positions. ....................................................................................................... 60
Figure 22.The dust particles form a line after the aluminum sheet is folded into the U shape. The unfolded panel shown in this picture is a thin aluminum plate instead of 4-mil aluminum foil . ............................................................................................................................... 60
Figure 23. Dust sample is transferred from folded aluminum sheet to the scintillation vial……………………60 Figure 24. Graphic example of generic procedure for photolysis without dust……………………………………..66 Figure 25. Graphic example of generic procedure for photolysis with dust……………………………………………67 Figure 26. Graphic example of procedure for analyzing migraiton from product or article surface to saliva……………………………………………………………………………………………………………………………………………………..73 Figure 27. Graphic example of small-scale procedure for analyzing migration from product or article surface to sweat……………………………………………………………………………………………………………………………………80 Figure 28. Diagram of Relationships between Components in Leaching Protocol………………………………….83 Figure 29. Retsch cryomill uses liquid Nitrogen to embrittle polymer samples……………………………………..91 Figure 30. Retsch Jet Sieve for Generating Particles of Discrete Size…………………………………………………….91 Figure 31. Micromeritics Gemini V Series BET Surface Area Analyzer…………………………………………………….92 Figure 32. General Migration Rate into Water Test Apparatus………………………………………………………………93

Page vi
CONTRIBUTORS and ACKNOWLEDGEMENTS
This report was developed by the United States Environmental Protection Agency (US EPA), Office of Chemical Safety and Pollution Prevention (OCSPP), Office of Pollution Prevention and Toxics (OPPT). Acknowledgements This document was developed by EPA scientists in the Risk Assessment Division of the Office of Pollution Prevention and Toxics and the National Risk Management Research Laboratory of the Office of Research and Development. The document was reviewed by scientists from EPA’s Office of Pesticide Programs, Office of Research and Development, and the Consumer Product Safety Commission. This document was developed with support from ICF International under EPA Contract # EP-W-12-010.
Disclaimer Mention of trade names of commercial products should not be interpreted as an endorsement by the U.S. Environmental Protection Agency.

Page 1 of 104
Introduction
EPA’s Office of Pollution Prevention and Toxics (OPPT) has developed a set of ten indoor exposure testing protocols intended to provide information on the purpose of the testing, general description of the sampling and analytical procedures, and references for tests that will be used to inform and refine estimates of indoor exposures. The scope of these protocols is limited to testing chemicals in consumer products and articles, including building materials, used in indoor environments. These protocols are intended to address the potential for these chemicals to migrate to indoor exposure media such as air or dust, where exposure may occur.
These protocols are general in nature and will need to be tailored to the specific type of chemical to be analyzed, the particular product or article which is being evaluated, and the data quality objective for the testing. The word “should” is used throughout this document. Each protocol has a modifications section. During modifications, the organization performing testing is expected to revise the generic indoor exposure testing protocol replacing “should” with language such as “shall” “will” or “must.” Most protocols were developed based on existing standard test methods. In the absence of standard methods, the most commonly used methods found in the literature were used.
Multiple protocols may be used to evaluate potential exposures when using products and articles in indoor environments. For example, if the testing objective is to evaluate how much of a particular chemical is emitted during a short-term use of a particular product indoors, the source characterization protocol and the short-term emission test protocol would be appropriate. The protocols would be modified to include the appropriate analytical method for the chemical of interest, the appropriate type of chamber, sample preparation, sampling method, sampling volume, etc.
All of the indoor exposure testing protocols are designed to refine and improve exposure estimates. Experimental results can be used, in combination with other information, to estimate environmental concentrations and doses for human receptors. Lack of experimental data does not prevent estimation of exposure as available exposure models can be used. However, models and estimation approaches that use chemical and scenario specific experimental data rather than generic defaults can provide more refined estimates of exposure. Refined estimates of exposure may be higher or lower than estimates based on generic defaults.
The protocols should be modified using methodologies generally accepted in the relevant scientific community at the time the study is initiated. Before starting to conduct any study that will use a modified version of these protocols, a written test protocol is generally submitted to the Agency for review. The following will be evaluated during the Agency review of the modified protocol:
a. data quality objective(s), b. the sampling process design (experimental design), c. sampling and analytical methods, d. sample handling and custody, e. quality control procedures and activities (including reference samples, duplicates, replicates,
etc.), f. instruments and equipment to be used in conducting the testing, g. data review, verification, and validation, and h. reporting requirements.

Page 2
Additional information on the Agency’s Quality Analysis procedures and programs is available (EPA, 2016). The final report should contain study results and sufficient contextualizing information on testing conditions and analytical approaches to inform study results.
Each study should be conducted in good faith, with due care, and in a scientifically valid manner. The protocols are listed below; they may be updated over time:
Table 1. Indoor Exposure Testing Protocols Names and Metrics
# Name Metrics (Units)
1 Source Characterization Chemical concentration or Weight fraction in product or article (ppm, fraction)
2 Emission from Water and Aqueous Sources to Indoor Air (overall liquid-phase mass transfer coefficient)
Liquid-phase, gas-phase, and overall mass transfer coefficients KL, KG, KOL (m/h)
3 Short-Term Emission Testing Emission rate (mg/hour) Emission factor (mg/m2/hour)
4 Long-Term Emission Testing – Partition and Diffusion Coefficients
Solid-phase diffusion coefficient (m2/h) Material-air partition coefficient (dimensionless) Gas-phase mass transfer coefficient (m/h)
5 Particulate Matter Formation Due to Mechanical Forces Applied to Product or Article Surfaces
Particle generation rate (mg/hour)
6 Migration to Dust (Transfer of Chemicals from Source to Settled Dust by Direct Contact)
Time averaged air, wipe, or dust concentrations (µg/m3, µg/m2, µg/kg)
7 Photolysis under Simulated Indoor Lighting Conditions
Time averaged air, wipe, or dust concentrations (µg/m3, µg/m2, ug/kg)
8 Migration to Saliva (Oral Exposure) Migration Rate into Saliva (mg/cm2/hour)
9 Migration to Skin (Dermal Exposure) Film Thickness (cm) Loading (µg/cm2)
10 Migration of Chemical from Solid Material to Water
Concentration in water (ng/L) Emission rate (mg/hour)
Figure 1 provides an illustration of the types of potential exposures associated with the source (product or article in the indoor environment), and how the exposure data produced from applying the test protocols will be used to inform the potential for exposure. As shown in Figure 1, all of the indoor

Page 3
exposure protocols are designed for the purpose of informing potential exposures to human receptors. The outputs of the protocols can be used along with other information such as receptor and environment specific exposure factors to estimate dose. However, documentation of these pathways and equations is beyond the scope of this document.
Figure 1. Conceptual diagram of protocols overlaid with source-to-dose continuum for consumer products and articles.

Page 4
Contextualizing Information for Product Use
Purpose and Description
For any indoor exposure testing protocol that is conducted, it is important to describe the context of the testing with regard to potential exposures. Information on the conditions of use, potentially exposed populations, properties and characteristics of the product or chemical, and other factors are needed to better understand the relationship between the testing results and potential exposures. OPPT strongly encourages provision of an introductory narrative that contains some or all of the following information:
1. A statement of the agreed upon objectives for product testing including what testing results and contextualizing information will be provided.
2. A description that explains the combination of the product and/or article use category and functional use category for the chemical substance.
3. Intended number and description of individuals (receptors) who use products (industrial workers, commercial workers, high-frequency consumer use, low-frequency consumer use, use by children, etc.).
4. Physical- chemical properties that govern the behavior of the chemical in the indoor environment, including: Henry’s Law constant, octanol-water partition coefficient, octanol-air partition coefficient, material-air partition coefficient, water solubility, and vapor pressure. Properties may need to be measured or adjusted for relevant indoor environment and/or body temperatures reflecting conditions of use. Expected temperatures during use should be reported.
5. Information characterizing the properties of the product. Properties of the consumer product include density, physical form, method of application (spray, brush, roll-on), and whether dilution occurs during routine use.
6. The typical setting for use (e.g., outdoors, indoors, residential, commercial). 7. Typical life expectancy of the article during use, typical or high-end mass of product used per
event, and duration of use per event.
The exposure potential of a chemical used in consumer products including articles is influenced by several parameters. Chemicals that are part of formulated mixtures are generally liquids or semi-solids and are used over time and disposed of. Chemicals that are added to articles or building materials are generally part of solid matrices. The likelihood of a chemical migrating from an article is dependent on the characteristics of the material of which the article is comprised as well as the chemical itself.
For example, polyurethane foam produced for specific purposes may have varying specifications for properties, such as density, rigidity, and structure (closed vs. open cell), along with the thickness of the product and its exposed surface area. These properties influence the likelihood of migration and are thus important in understanding the potential for exposure. The overall impact of one or a combination of these factors that could influence migration and exposure potential is not well characterized.
The objective of collecting this additional contextual information is to help refine exposure scenarios and establish relationships back to source characterization as described in the protocol. Additional contextual information, not described in the list above, may be required from the sponsor depending on the specific chemical and product tested.
Reporting Requirements and Records Retention:

Page 5
There are many existing reporting templates for exposure and use information (OECD 2003;OECD 2016). Use of existing templates may be helpful. OPPT strongly encourages additional exposure and use information provided to be linked with product testing information through a narrative.
Records maintained and submitted to the EPA should include, but are not limited to, the following:
a. The original reference upon which information is based. b. Identification and characterization of the test substance as provided by Sponsor. c. Identification and characterization of the material in question. d. Description of methods employed.
Any changes to exposure information provided within the introduction of test protocol reports shouldbe documented. If it is necessary to make corrections or additions to the final report after it has been accepted, such changes should be made in the form of an amendment issued by the Study Director. The amendment should clearly identify the part of the study that is being amended and the reasons for the alteration. Amendments should be signed and dated by the Study Director and Laboratory Quality Assurance Officer.
References
U.S. EPA (2016). How EPA Manages the Quality of its Environmental Data. https://www.epa.gov/quality OECD (2003). Guidance Document on Reporting Summary Information on Environmental Occupational
and Consumer Exposure. ENV/JM/MONO(2003)16 OECD (2016). OECD Harmonised Templates 301 to 306: Use and Exposure Information.
https://www.oecd.org/ehs/templates/harmonised-templates-use-exposure-information.htm

Page 6
1. Source Characterization
1.1. Purpose:
The objective of this protocol is to determine the concentration (mg/kg, with at least three significant figures) of the chemicals of interest present within the consumer product or article.
1.2. Modifications:
This protocol is general, and it is anticipated that during protocol development and finalization, additional modifications will be made to tailor the sampling parameters or analytical techniques to the specific chemical and product tested, as well as to Agency recommendations specific to particular products, chemicals, or exposure scenarios of interest.
1.3. Description:
The methods described here are generally described in OCSPP test guidelines 830.1000 and 830.1550. While these guidelines are tailored to pesticide formulations, considerations are similar for non-pesticide product testing (EPA 1996) (EPA 1998). Additional information based on Cox et al. (2001) and Guo et al. (2009) and Health Canada is provided for context. This protocol is organized around testing protocols for liquid-based consumer products and testing of solid-articles.
The Sponsor should provide information regarding product or article formulation, including the state of the chemical (e.g., as an additive or chemically bound to the substrate) and its functionality, method of application, as well as a list of consumer articles containing said chemical(s).
The Sponsor should work with their processing customers to provide information characterizing the type and properties of the consumer product or article itself. Properties of the consumer product or article that should be reported, if applicable, include polymer identity, physical form, density, rigidity, porosity, surface area, thickness, typical setting for consumer product use (outdoors, indoors, residential, commercial), and typical life expectancy of article in consumer use (See Contextualizing Information for Product Use section above).
1.4. Experimental Design:
To determine the concentration of chemicals within a product or article, sample preparation and analysis should be tailored to the chemical and the product or article properties. Following are example methods of sample preparation for liquid and solid samples. The methods presented are generally applicable to semi-volatile organic compound (SVOC) additives. More volatile additives, such as VOCs used in spray-applied products, may require different sample preparation methods to prevent losses and these steps should be documented.
1.4.1. Screening for the Chemicals of Interest If the chemical of interest contains elements able to be analyzed through X-ray Fluorescence (XRF) or otherwise detected via screening methods, these may be employed to show the presence or absence of the chemical of interest prior to more detailed testing. If screening tests are not available or show the potential presence of the chemical of interest, the sponsor should test for the concentration of that chemical using one of the methods described in the following sections or another method appropriate to the chemical and product or article combination.

Page 7
1.4.2. Preparation of Liquid Test Specimens for Consumer Products This methodology (Guo et al., 2009) is recommended for consumer products that exist in a liquid state. Samples should be prepared in duplicate.
• Accurately weigh 1.5 mL of liquid sample into the sample vial and add recovery check standard for checking the extraction efficiency.
• Dilute each sample with 25 mL of appropriate solvent (e.g., dichloromethane, methanol, etc.) • Seal the vial, and sonicate the samples for 10 minutes. • Filter the diluted sample with a 50-mL tube-top filter with a 0.22-µm pore size. • Transfer 10 mL of the filtered liquid to a 10-mL volumetric flask with a 0.1-µm pore size syringe
filter to further remove high molecular weight polymers or other suspended particles that are suspected to remain present.
• Add the internal standard to each sample. • Cap the flask and sonicate the sample for 10 minutes.
Note that, if the extracts contain high concentrations of target chemicals, a serial dilution is needed to reduce concentrations to within the calibration range and to prevent instrument contamination. Note that, if spray-applied products are considered, modifications to preparation of sample may be required and preparation and analysis methods should prevent loss of volatile components of interest. Other examples of protocols that measure concentration of chemicals in liquid products are test methods from Health Canada’s Product Safety Laboratory (Health Canada 2014) (Health Canada 2015a)
1.4.3. Preparation of Solid Samples for Consumer Products Containing SVOC Additives To analyze chemicals in solid articles that are applied to the surface of an article (e.g., PFC telomers or polymers applied to fabrics) and articles that can be easily cut into fine, thin pieces (e.g., caulking material), sample coupons can be used. For chemicals found within solid, polymeric articles, ground samples or cut coupons can be created as described in this section. Wipe samples have been used to measure chemicals available on the surface of an article for oral or dermal transfer but are not believed to be accurate for measuring the concentration of a target chemical. As such, collection of wipe samples is not recommended under this protocol.
If using coupons, sample coupons should be cut from the article and sonicated. Additional sample preparation details for cut coupons are detailed in test methods from Health Canada’s Product Safety Laboratory and are summarized here. Cut samples into small 2-3 cm2 pieces, weigh 0.1 grams of sample, add toluene or another appropriate solvent to a flask and secure with a stopper, shake the sample with a wrist-action shaker at speed 4 for 1 hour, remove samples from the shaker and transfer to a scintillation vial, take aliquots for extraction and analysis as detailed in the following section (Health Canada 2015b). Additional details are also available in (Guo et al. 2009).
If using ground samples, two samples should be selected from the article. Article samples should be ground in a cryogenic grinder, such as a Retsch CryoMill, to reduce the heterogeneity of test materials and increase chemical recovery from the article. An article sample of the size appropriate to fill the grinding jar approximately 1/3 full should be placed in a closed metal grinding jar that is continually cooled with liquid nitrogen before and during the grinding process to maintain the temperature of -140 °C (Cox et al., 2001).

Page 8
After grinding, the desired size fraction of particles (less than 200 microns in diameter from each article) should be obtained using an air jet sieving machine that is suitable for sieving low density materials, which tend to agglomerate, to particle sizes in the low to sub millimeter size range. Use a spatula to transfer the ground polymer into the scintillation vial. After grinding, the appropriate size fraction of particle should be collected from the air jet sieving machine in a fume hood with a low air speed. Avoid using strong air drafts; a gentle flow is needed to prevent sample loss during collection.
• The scintillation vials used for collecting samples should be stored in a desiccator for at least 8 hours.
• Place a 30 cm by 30 cm sheet aluminum foil on the table of the fume hood. • Fold the aluminum foil to form a U shape; transfer the sample from the air sieve collector to
allow the particles to settle on the bottom of the U-shaped aluminum foil. • Place the folded aluminum sheet aside inside the fume hood; place a new piece of aluminum foil
(roughly 30 cm × 30 cm) on the table. • Place a centrifuge tube holder on the aluminum foil. • Place a 20-mL scintillation vial in the tube holder. • To transfer the ground polymer into the scintillation vial, tilt the folded aluminum foil to about
45˚ to allow the ground materials to “flow” into the scintillation vial; tap gently with a spatula if necessary (see Figure 23).
1.4.4. Analytical Methods for use with Sample Coupons or Ground Samples Selection of the analytical methods for extracted samples depends on the properties of the chemicals of interest and the type of sampling media. Instrumentation that may be utilized include, but is not limited to liquid chromatography–mass spectrometry (LC-MS), gas chromatography-mass spectrometry (GC-MS), liquid chromatography with tandem mass spectrometry (LC/MS/MS), gas chromatography with tandem mass spectrometry (GC/MS/MS), or high performance liquid chromatography with tandem mass spectrometry (HPLC-LC/MS/MS). For example, for Brominated Phthalate Flame Retardant and decaBDE, chromatography or mass spectrometry in electron capture negative ionization mode (GC/MS-ECNI) has been used (Stapleton et al., 2008).
1.5. Records Retention and Reporting of Results
1.5.1. Records to be Maintained Records submitted to the EPA should include, but are not limited to, the following:
a. The original signed protocol and any amendments. b. Identification and characterization of the test substance as provided by Sponsor. c. Identification and characterization of the material in question. d. Experiment initiation and termination dates. e. Laboratory log books (e.g., stock solution concentration calculations and solution preparation,
calibration, and QC data). f. Instrument (e.g., GC/ECNI) data files. g. Spreadsheet files for data processing. h. Chain of custody documentation, including sample storage and handling information.

Page 9
i. Copy of final report.
1.5.2. Final Report A final report of the results of the study should be prepared and submitted to the EPA. The final report should include, but is not limited to the following, when applicable:
a. Name and address of facility performing the study. b. Dates on which the study was initiated and completed. c. Objectives and procedures stated in the approved protocol, including any changes in the original
protocol. d. Identification and characterization of the test substance as provided by sponsor. e. A summary and analysis of the data and a statement of the conclusions drawn from the analysis. f. A description of the transformations and calculations performed on the data. g. A description of the methods used and reference to any standard method employed. h. A description of the instrumentation utilized. i. A description of the preparation of the test coupon, the test conditions, the testing
concentrations, and the duration of the test. j. A description of sampling and analytical methods, including level of detection, level of
quantification, calibration information, and references. k. A description of test specimens and test matrix. l. A description of the test results including measured values for individual chemicals of interest
for each matrix. m. A description of all circumstances that may affect the quality or integrity of the data. n. The name of the study director, the names of other scientists or professionals, and the names of
all supervisory personnel involved in the study. o. The signed and dated reports of each of the individual scientists or other professionals involved
in the study, if applicable. p. The location where the raw data and final report are to be stored. q. A statement prepared by the Quality Assurance Unit listing the types of inspections, the dates
that the study inspections were made, a description of the quality assurance and quality control process, and the findings reported to the Study Director and Management.
r. A copy of all raw data including but not limited to instrumentation output, lab notebooks, and data sheets, etc.
1.5.3. Changes to the Final Report If it is necessary to make corrections or additions to the final report after it has been accepted, such changes should be made in the form of an amendment issued by the Study Director. The amendment should clearly identify the part of the study that is being amended and the reasons for the alteration. Amendments should be signed and dated by the Study Director and Laboratory Quality Assurance Officer.

Page 10
1.5.4. Changes to the Protocol Planned changes to the protocol should be in the form of written amendments signed by the Study Director and approved by the sponsor’s representative and submitted to EPA using procedures in 40 CFR 790.50. Amendments should be considered as part of the protocol and should be attached to the final protocol. Any other changes should be in the form of written deviations signed by the Study Director and filed with the raw data. All changes to the protocol should be indicated in the final report. Changes to the test standard require prior approval from EPA using procedures in 40 CFR 790.55.
1.6. References
EPA (1996). OCSPP Guideline 830.1550. Product Identity and Composition. EPA (1998). OCSPP Guideline 830.1000. Background for Product Properties Test Guidelines Cox, S. S., Hodgson, A. T. and Little, J. C. (2001), Measuring Concentrations of Volatile Organic
Compounds in Vinyl Flooring, Journal Air & Waste Management Association, Vol. 51, pp. 1195-1201 Guo, Z., Liu, X., Krebs, K. A., Roache, F. N. (2009). Perfluorocarboxylic Acid Content in 116 Articles of
Commerce, U.S. EPA, National Risk Management Research Laboratory, Research Triangle Park, NC, Report No. EPA/600/R-09/033, 52 pp. http://www.epa.gov/nrmrl/pubs/600r09033/600r09033.html
Health Canada (2014). Product Safety Laboratory Reference Manual. Method C-11.2. Determination of Ethylene Glycol and Di-Ethylene Glycol in Consumer Products by GC/MS. Health Canada (2015a). Product Safety Laboratory Reference Manual. Method C-11.1. Determination of alpha- pinene, D-limonene, and alpha-terpineol in Consumer Products by Gas Chromatography- Mass Spectrometry (GC-MS) Using Solid Phase Extraction (SPE). Health Canada (2015b). Product Safety Laboratory Reference Manual. Method C47. Sample Preparataion Technique for the Determiniation of Flame Retardants in Textile, Foam, and Other Similar Consumer Products.

Page 11
2. Emissions from Water and Aqueous Solutions to Indoor Air
2.1. Purpose:
The objective of this protocol is to collect information on chemical emissions from contaminated water or commercial aqueous solutions into air through chamber testing. A key parameter to be determined is the overall mass transfer coefficient.
2.2. Modifications:
This protocol is general, and it is anticipated that during protocol development and finalization, additional modifications will be made to tailor the sampling parameters or analytical techniques to the specific chemical and product tested, as well as to Agency recommendations specific to particular products, chemicals, or exposure scenarios of interest. The overall mass transfer coefficients obtained from this protocol are for chemical emissions from water pools. The results may not be applicable to water jets and droplets, such as in the case of showering.
2.3. Description:
2.3.1. Approach Contaminated tap water and water-based household products can be sources of a wide range of hazardous chemicals, including elements (e.g., chlorine and radon), inorganic compounds (e.g., ammonia, hydrogen chloride, and chlorine dioxide), formaldehyde, chlorinated organic solvents (e.g., chloroform and trichloroethylene), and common VOCs (e.g., benzene, toluene, and xylene). Chemical concentrations in indoor air are needed to assessinhalation exposure to the chemicals emitted from water and aqueous solutions. Indoor air concentrations can be obtained from either measurements or mathematical modeling. The key parameters that control the source strength are:
• Content of the target chemical in the liquid phase; • Source area; • Water temperature; • Henry’s law constant; and • Overall mass transfer coefficient.
The content of the target chemical in the liquid phase is usually obtained from source characterization or product formulation. The Henry’s law constant can be obtained from the literature (e.g., Sanders, 2015; NIST, 2016), quantitative structure-activity relationship (QSAR) models, or experimental measurement. The exposed area and temperature of the source is relatively easy to determine or estimate in most cases. Thus, determination of the overall mass transfer coefficient is essential in predicting air concentrations. This protocol describes an experimental method for determination of the overall and liquid-phase mass transfer coefficients that are associated with water use and applications of water-based household products under simulated indoor conditions. The experimental method described below is based on the studies by Guo & Roache (2003) and Liu, et al. (2015). The general experimental procedure is as follows:
• Prepare an aqueous solution with known concentration of the target chemical; • Set the small-scale environmental chamber at desired temperature, air change rate, and air
speed;

Page 12
• Place a petri dish on the chamber floor; • Pour the aqueous solution into the petri dish, flush with the rim; • Close the chamber lid and start the test; • During the test, collect air samples periodically and record the air change rate, relative humidity,
air temperature and liquid temperature; • Conduct a separate chamber test with pure water under the same experimental conditions.
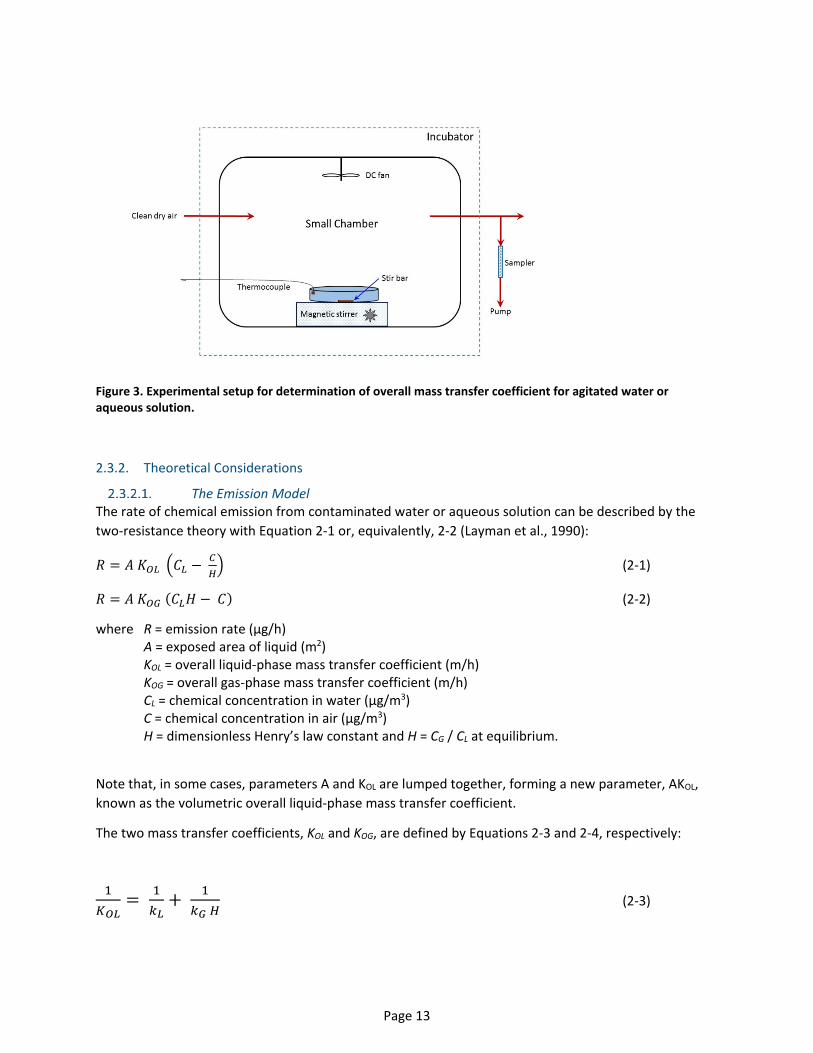
The results of liquid sample test are used to estimate the overall liquid-phase mass transfer coefficient for the target chemical. The results of water evaporation test are used to estimate the gas-phase mass transfer coefficient for water vapor, which is needed to estimate the liquid-phase mass transfer coefficient for the target chemical. A schematic of the experimental setup is shown in Figure 1. The procedure for testing agitated liquid is similar except that the petri dish is placed on a magnetic stirrer (Figure 2). The experimental results are analyzed by using a statistical routine that can handle mathematical models in the form of ordinary differential equations and a routine that solves a nonlinear equation. Many commonly used statistics software, such as MATLAB, SAS, SPSS, and data-fitting software, such as SCIENTIST, have such capabilities.
Figure 2. Experimental setup for determination of overall mass transfer coefficient for still water or aqueous solution.
Page 13
Figure 3. Experimental setup for determination of overall mass transfer coefficient for agitated water or aqueous solution.
2.3.2. Theoretical Considerations
The Emission Model The rate of chemical emission from contaminated water or aqueous solution can be described by the two-resistance theory with Equation 2-1 or, equivalently, 2-2 (Layman et al., 1990):
𝑅𝑅 = 𝐴𝐴 𝐾𝐾𝑂𝑂𝑂𝑂 �𝐶𝐶𝑂𝑂 − 𝐶𝐶𝐻𝐻� (2-1)
𝑅𝑅 = 𝐴𝐴 𝐾𝐾𝑂𝑂𝑂𝑂 (𝐶𝐶𝑂𝑂𝐻𝐻 − 𝐶𝐶) (2-2)
where R = emission rate (µg/h) A = exposed area of liquid (m2) KOL = overall liquid-phase mass transfer coefficient (m/h) KOG = overall gas-phase mass transfer coefficient (m/h) CL = chemical concentration in water (µg/m3) C = chemical concentration in air (µg/m3) H = dimensionless Henry’s law constant and H = CG / CL at equilibrium.
Note that, in some cases, parameters A and KOL are lumped together, forming a new parameter, AKOL, known as the volumetric overall liquid-phase mass transfer coefficient.
The two mass transfer coefficients, KOL and KOG, are defined by Equations 2-3 and 2-4, respectively:
1𝐾𝐾𝑂𝑂𝑂𝑂
= 1𝑘𝑘𝑂𝑂
+ 1𝑘𝑘𝐺𝐺 𝐻𝐻
(2-3)

Page 14
1𝐾𝐾𝑂𝑂𝐺𝐺
= 𝐻𝐻𝑘𝑘𝑂𝑂
+ 1𝑘𝑘𝐺𝐺
(2-4)
where kL = liquid-phase mass transfer coefficient (m/h) kG = gas-phase mass transfer coefficient (m/h).
KOL or KOG can be determined experimentally or estimated from kL, kG, and H. The method described below allows for determinations KOL or KOG, from which kL and kG can also be estimated.
The Chamber Model for the Target Chemical When a small liquid pool is placed in an environmental chamber, the chemical concentrations in air and liquid are determined by Equations 2-5 and 2-6, respectively.
𝑉𝑉 𝑑𝑑𝐶𝐶𝑑𝑑𝑑𝑑
= 𝐴𝐴 𝐾𝐾𝑂𝑂𝑂𝑂 �𝐶𝐶𝑂𝑂 − 𝐶𝐶𝐻𝐻� − 𝑄𝑄 𝐶𝐶 (2-5)
𝑑𝑑𝑊𝑊𝑂𝑂𝑑𝑑𝑑𝑑
= −𝐴𝐴 𝐾𝐾𝑂𝑂𝑂𝑂 �𝐶𝐶𝑂𝑂 − 𝐶𝐶𝐻𝐻� (2-6)
where V = chamber volume (m3)
C = chemical concentration in chamber air (µg/m3) t = elapsed time (h) Q = air change flow rate (m3/h) CL = chemical concentration in liquid, from Equation 2-7 (µg /m3)
WL = amount of target chemical remaining in the liquid (µg). 𝐶𝐶𝑂𝑂 = 𝑊𝑊𝑂𝑂
𝑉𝑉𝑂𝑂0− 𝑉𝑉𝑤𝑤 (2-7)
where WL = amount of target chemical remaining in liquid (µg)
VL0 = initial volume of liquid (m3) Vw = volume of water evaporated at time t, from Equation 2-8, (m3).
𝑉𝑉𝑤𝑤 = 𝑟𝑟𝑤𝑤 𝑑𝑑
𝜌𝜌𝑤𝑤 (2-8)
where rw = water evaporation rate, determined experimentally (g/h) ρw =density of water (g/m3). Equations 2-5 and 2-6 can be solved numerically with a set of initial conditions, such as t = 0, C = 0, and WL = VL0 × CL0, where VL0 is initial liquid volume (m3) and CL0 is the pre-determined initial chemical concentration in the liquid µg /m3). Because the air concentration is determined experimentally and other parameters (V, Q, A, H, and CL0) are known, KOL is the only unknown parameter in Equations 2-5 and 2-6 and can be estimated by fitting the experimental data to the model.

Page 15
The Chamber Model for Water Evaporation The overall mass transfer coefficient (KOL or KOG) determined by this protocol is specific to the test conditions. To make the results applicable to other conditions, it is desirable to break KOL or KOG into three components as shown in Equations 2-3 and 2-4: the gas-phase mass transfer coefficient (kG), the liquid-phase mass transfer coefficient (kL), and the dimensionless Henry’s law constant (H). This can be achieved by experimental determination of the gas-phase mass transfer coefficient for water (kGw), from which the gas-phase mass transfer coefficient for the target chemical, kG, can be estimated.
When a small pool filled with pure water is placed in an environmental chamber, the moisture content in air is determined by Equation 2-9.
𝑉𝑉 𝑑𝑑𝐶𝐶𝑤𝑤𝑑𝑑𝑑𝑑
= 𝐴𝐴 𝑘𝑘𝑂𝑂𝑊𝑊 (𝐶𝐶𝑣𝑣 − 𝐶𝐶𝑤𝑤) − 𝑄𝑄 (𝐶𝐶𝑖𝑖𝑖𝑖 − 𝐶𝐶𝑤𝑤) (9) where Cw = water vapor concentration in air (g/m3) kGW = gas-phase mass transfer coefficient for water evaporation (m/h)
Cv = saturated water vapor concentration at a given temperature (g/m3) Cin = water vapor concentration in inlet air; Cin = 0 for dry air (g/m3). If dry air is used in the test (i.e., Cin = 0) and if the initial condition is t = 0 and Cw = 0, the exact solution to Equation 2-9 is: 𝐶𝐶𝑤𝑤 = 𝑂𝑂 𝑘𝑘𝐺𝐺𝐺𝐺 𝐶𝐶𝑣𝑣
𝑂𝑂 𝑘𝑘𝐺𝐺𝐺𝐺+𝑁𝑁 �1 − 𝑒𝑒−(𝑂𝑂 𝑘𝑘𝐺𝐺𝐺𝐺+𝑁𝑁) 𝑑𝑑� (2-10)
The total amount of water evaporated during the test period (τ) can be determined by integrating Equation 2-10:
𝑤𝑤𝑑𝑑𝑡𝑡𝑑𝑑 = 𝑄𝑄 𝑂𝑂 𝑘𝑘𝐺𝐺𝐺𝐺 𝐶𝐶𝑣𝑣𝑂𝑂 𝑘𝑘𝐺𝐺𝐺𝐺+𝑁𝑁
�𝜏𝜏 − 1− 𝑒𝑒−�𝑂𝑂 𝑘𝑘𝐺𝐺𝐺𝐺+𝑁𝑁� 𝜏𝜏
𝑂𝑂 𝑘𝑘𝐺𝐺𝐺𝐺+𝑁𝑁� + 𝑉𝑉 𝑂𝑂𝑘𝑘𝐺𝐺𝐺𝐺 𝐶𝐶𝑣𝑣
𝑂𝑂𝑘𝑘𝐺𝐺𝐺𝐺+𝑄𝑄[1 − 𝑒𝑒−(𝑂𝑂 𝑘𝑘𝐺𝐺𝐺𝐺+𝑁𝑁) 𝜏𝜏]
(2-11) where Wtot = total amount of water evaporated during the test period (g)
N = air change rate and N = Q/V (h-1). The complete derivation of Equation 2-11 is provided in Appendix 2-A. Under the steady-state condition, it becomes: 𝑤𝑤𝑡𝑡𝑡𝑡𝑡𝑡 = 𝐿𝐿 𝑘𝑘𝐺𝐺𝐺𝐺 𝐶𝐶𝑣𝑣
𝐿𝐿 𝑘𝑘𝐺𝐺𝐺𝐺+𝑁𝑁 �𝑄𝑄 �𝜏𝜏 − 1𝐿𝐿 𝑘𝑘𝐺𝐺𝐺𝐺+𝑁𝑁� + 𝑉𝑉� (2-12)
Page 16
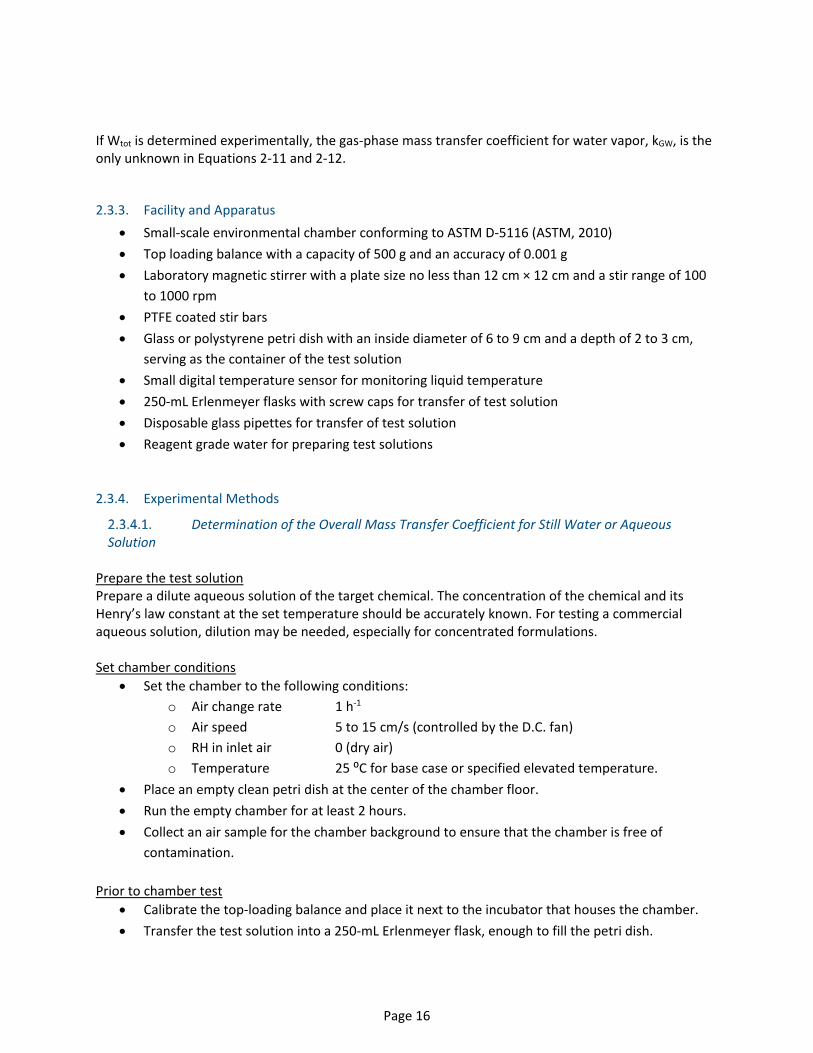
If Wtot is determined experimentally, the gas-phase mass transfer coefficient for water vapor, kGW, is the only unknown in Equations 2-11 and 2-12.
2.3.3. Facility and Apparatus • Small-scale environmental chamber conforming to ASTM D-5116 (ASTM, 2010) • Top loading balance with a capacity of 500 g and an accuracy of 0.001 g • Laboratory magnetic stirrer with a plate size no less than 12 cm × 12 cm and a stir range of 100
to 1000 rpm • PTFE coated stir bars • Glass or polystyrene petri dish with an inside diameter of 6 to 9 cm and a depth of 2 to 3 cm,
serving as the container of the test solution • Small digital temperature sensor for monitoring liquid temperature • 250-mL Erlenmeyer flasks with screw caps for transfer of test solution • Disposable glass pipettes for transfer of test solution • Reagent grade water for preparing test solutions
2.3.4. Experimental Methods
Determination of the Overall Mass Transfer Coefficient for Still Water or Aqueous Solution
Prepare the test solution Prepare a dilute aqueous solution of the target chemical. The concentration of the chemical and its Henry’s law constant at the set temperature should be accurately known. For testing a commercial aqueous solution, dilution may be needed, especially for concentrated formulations. Set chamber conditions
• Set the chamber to the following conditions: o Air change rate 1 h-1 o Air speed 5 to 15 cm/s (controlled by the D.C. fan) o RH in inlet air 0 (dry air) o Temperature 25 ⁰C for base case or specified elevated temperature.
• Place an empty clean petri dish at the center of the chamber floor. • Run the empty chamber for at least 2 hours. • Collect an air sample for the chamber background to ensure that the chamber is free of
contamination. Prior to chamber test
• Calibrate the top-loading balance and place it next to the incubator that houses the chamber. • Transfer the test solution into a 250-mL Erlenmeyer flask, enough to fill the petri dish.

Page 17
• Place the capped flask in an incubator set at the test temperature for at least 2 hours • Open chamber lid. • Weight the empty petri dish and place it back to the chamber. • Remove the Erlenmeyer flask with solution from the incubator and weigh it. • Carefully pour the solution in the flask into the petri dish to nearly full. • Use a disposable pipette to transfer more solution to the petri dish until the liquid level is flush
with the rim of the dish. • Weigh the capped flask again. • Place the digital thermocouple temperature sensor into the solution. The probe should be
submerged and close to the surface of the liquid. • Close the chamber lid and record the test start time.
Air sampling during test Take at least 10 air samples (excluding duplicate samples) over an 8-hour test period. A typical sampling schedule is at 0.5, 1, 1.5, 2, 3, 4, 5, 6, 7, and 8 elapsed hours. At least 10% of samples should be taken in duplicate, including the first and last samples. After chamber test
• Open the chamber lid and record the test end time. • Remove the petri dish with solution and weigh it.
Determination of the Overall Mass Transfer Coefficient for Agitated Water or Aqueous Solution
The experimental setup and procedure for testing emissions from agitated water or aqueous solutions are similar to those for testing still liquid except that a magnetic stirrer is used (see Figure 2 above). According to Liu et al. (2015), the magnitude of the overall liquid-phase mass transfer coefficient (KOL) is greater for agitated liquid than for still liquid. However, the difference in KOL between different levels of agitation is rather small. Therefore, this protocol suggests the solution be tested at a single agitation level. The criterion of selecting the sir bar size and speed setting is such that the magnetic stirrer provides adequate agitation but without producing errant movement or spillage of the solution (Liu et al., 2015).
Determination of the Gas-Phase Mass Transfer Coefficient for Water Evaporation The procedure for water evaporation tests is similar to that for testing the target chemical except that air sampling is not needed.
2.3.5. Test Matrix
Tests at a Single Temperature For a given chemical and a given temperature, four tests are required (Table 2).
Page 18
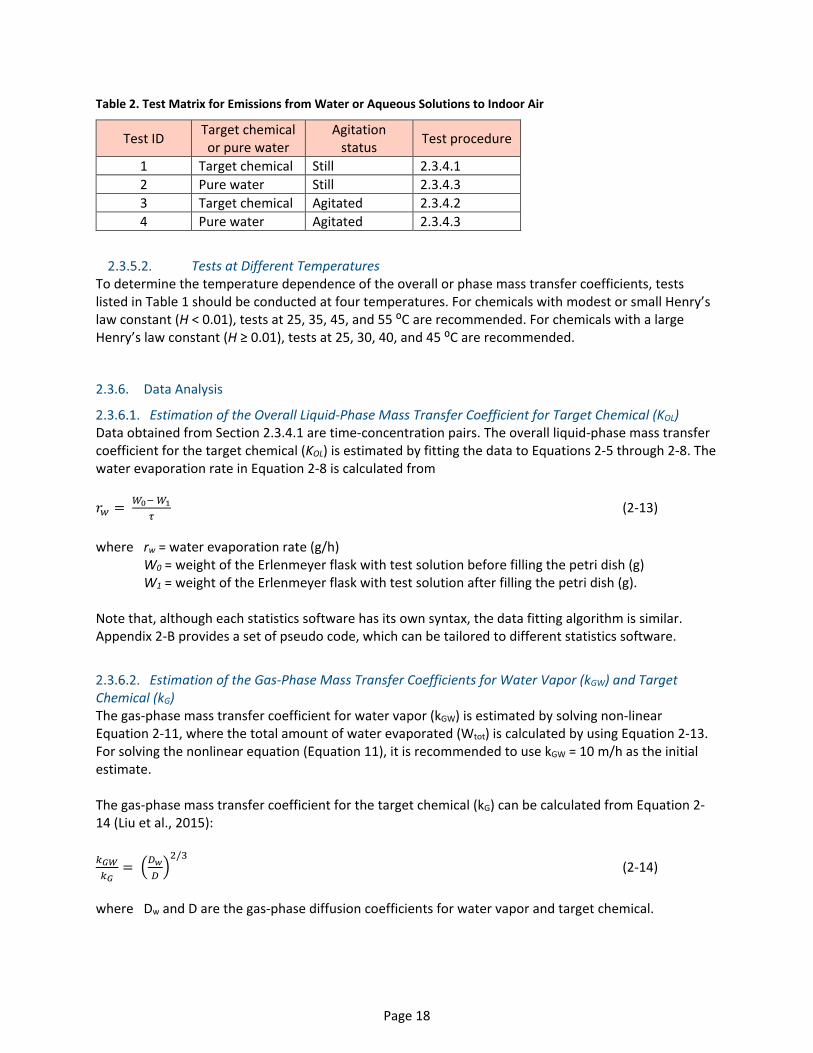
Table 2. Test Matrix for Emissions from Water or Aqueous Solutions to Indoor Air
Test ID Target chemical or pure water
Agitation status Test procedure
1 Target chemical Still 2.3.4.1 2 Pure water Still 2.3.4.3 3 Target chemical Agitated 2.3.4.2 4 Pure water Agitated 2.3.4.3
Tests at Different Temperatures To determine the temperature dependence of the overall or phase mass transfer coefficients, tests listed in Table 1 should be conducted at four temperatures. For chemicals with modest or small Henry’s law constant (H < 0.01), tests at 25, 35, 45, and 55 ⁰C are recommended. For chemicals with a large Henry’s law constant (H ≥ 0.01), tests at 25, 30, 40, and 45 ⁰C are recommended.
2.3.6. Data Analysis
Estimation of the Overall Liquid-Phase Mass Transfer Coefficient for Target Chemical (KOL) Data obtained from Section 2.3.4.1 are time-concentration pairs. The overall liquid-phase mass transfer coefficient for the target chemical (KOL) is estimated by fitting the data to Equations 2-5 through 2-8. The water evaporation rate in Equation 2-8 is calculated from 𝑟𝑟𝑤𝑤 = 𝑊𝑊0− 𝑊𝑊1
𝜏𝜏 (2-13)
where rw = water evaporation rate (g/h) W0 = weight of the Erlenmeyer flask with test solution before filling the petri dish (g) W1 = weight of the Erlenmeyer flask with test solution after filling the petri dish (g). Note that, although each statistics software has its own syntax, the data fitting algorithm is similar. Appendix 2-B provides a set of pseudo code, which can be tailored to different statistics software.
Estimation of the Gas-Phase Mass Transfer Coefficients for Water Vapor (kGW) and Target Chemical (kG) The gas-phase mass transfer coefficient for water vapor (kGW) is estimated by solving non-linear Equation 2-11, where the total amount of water evaporated (Wtot) is calculated by using Equation 2-13. For solving the nonlinear equation (Equation 11), it is recommended to use kGW = 10 m/h as the initial estimate. The gas-phase mass transfer coefficient for the target chemical (kG) can be calculated from Equation 2-14 (Liu et al., 2015): 𝑘𝑘𝐺𝐺𝐺𝐺𝑘𝑘𝐺𝐺
= �𝐷𝐷𝑤𝑤𝐷𝐷�2/3
(2-14)
where Dw and D are the gas-phase diffusion coefficients for water vapor and target chemical.

Page 19
Estimation of the Liquid-Phase Mass Transfer Coefficient for the Target Chemical (kL) Equation 2-3 can be rewritten as 𝑘𝑘𝑂𝑂 = 𝐾𝐾𝑂𝑂𝑂𝑂 𝑘𝑘𝐺𝐺 𝐻𝐻
𝑘𝑘𝐺𝐺 𝐻𝐻 − 𝐾𝐾𝑂𝑂𝑂𝑂 (2-15)
where KOL, kG, and H are all known.
Temperature dependence of the overall mass transfer coefficient The overall mass transfer coefficient obtained at different temperatures can be analyzed by plotting KOL versus the reciprocal of the absolute temperature, 1/T(K), on a semi-log scale. See Figure 4 as an example. Linear regression for ln(KOL) versus 1/T yields the following relationship: ln(𝐾𝐾𝑂𝑂𝑂𝑂) = 𝑎𝑎 + 𝑏𝑏
𝑇𝑇 (2-16)
where constant a is the intercept of the regression line and b the slope.
Figure 4. Overall liquid-phase mass transfer coefficient versus 1/T(K). Data points are hypothetical.
The method described above is also applicable to the liquid-phase mass transfer coefficient.
2.4. Records Retention and Reporting Results:
2.4.1. Records to be Maintained Records submitted to the EPA should include, but are not limited to, the following:
a. The original signed protocol and any amendments. b. Identification and characterization of the test substance as provided by Sponsor. c. Identification and characterization of the material in question.
1.00E-05
1.00E-04
1.00E-03
0.003 0.00305 0.0031 0.00315 0.0032 0.00325 0.0033 0.00335 0.0034
K OL
(m/h
)
1/T (K)
ln KOL = 2.29 - 3730 / T

Page 20
d. Experiment initiation and termination dates. e. Laboratory log books (e.g., stock solution concentration calculations and solution preparation,
calibration, and QC data). f. Instrument (e.g., small chamber system and analytical instrument) data files. g. Spreadsheet files for data processing. h. Environmental data acquired by the data acquisition system of the test chambers (e.g.,
temperature, air flow and inlet air moisture content). i. Chain of custody documentation, including sample storage and handling information. j. Copy of final report.
2.4.2. Final Report A final report of the results of the study should be prepared and submitted to the EPA. The final report should include, but is not limited to the following, when applicable:
a. Name and address of facility performing the study. b. Dates on which the study was initiated and completed. c. Objectives and procedures stated in the approved protocol, including any changes in the original
protocol. d. Identification and characterization of the test substance as provided by Sponsor. e. A summary and analysis of the data and a statement of the conclusions drawn from the analysis. f. A description of the transformations and calculations performed on the data. g. A description of the methods used and reference to any standard method employed. h. A description of the instrumentation utilized. i. A description of the preparation of the test solutions, the test conditions, the testing
concentrations, and the duration of the test. j. A description of sampling and analytical methods, including level of detection, level of
quantification, and references. k. A description of test specimens and test matrix. l. A description of the test results including measured values for individual chemicals of interest
for each matrix. m. A description of all circumstances that may affect the quality or integrity of the data. n. The name of the study director, the names of other scientists or professionals, and the names of
all supervisory personnel involved in the study. o. The signed and dated reports of each of the individual scientists or other professionals involved
in the study, if applicable. p. The location where the raw data and final report are to be stored. q. A statement prepared by the Quality Assurance Unit listing the types of inspections, the dates
that the study inspections were made, a description of quality assurance and quality control process, and the findings reported to the Study Director and Management.
r. A copy of all raw data including but not limited to instrumentation output, lab notebooks, and data sheets, etc.

Page 21
2.4.3. Changes to the Final Report If it is necessary to make corrections or additions to the final report after it has been accepted, such changes should be made in the form of an amendment issued by the Study Director. The amendment should clearly identify the part of the study that is being amended and the reasons for the alteration. Amendments should be signed and dated by the Study Director and Laboratory Quality Assurance Officer.
2.4.4. Changes to the Protocol Planned changes to the protocol should be in the form of written amendments signed by the Study Director and approved by the sponsor’s representative and submitted to EPA using procedures in 40 CFR 790.50. Amendments should be considered as part of the protocol and should be attached to the final protocol. Any other changes should be in the form of written deviations signed by the Study Director and filed with the raw data. All changes to the protocol should be indicated in the final report. Changes to the test standard require prior approval from EPA using procedures in 40 CFR 790.55 (U.S. Code, 1999).
2.5. References:
ASTM (2010). D5116-10 Standard Guide for Small-Scale Environmental Chamber Determinations of Organic Emissions from Indoor Materials/Products. West Conshohocken, PA: ASTM International. http://www.astm.org/Standards/D5116.htm. Guo, Z. and Roache, N. F. (2003). Overall Mass Transfer Coefficient for Pollutant Emissions from Small Water Pools under Simulated Indoor Environmental Conditions, The Annals of Occupational Hygiene, 47: 279-286. Lyman, W. L., Reehl, W. F., Rosenblatt, D. H. (1990). Handbook of chemical property estimation methods: environmental behavior of organic compounds. American Chemical Society, Washington, DC. Liu, X., Guo, Z., Roache, N. F., Mocka, C. A., Allen, M. R., and Mason, M. A. (2015). Henry’s Law Constant and Overall Mass Transfer Coefficient for Formaldehyde Emission from Small Water Pools under Simulated Indoor Environmental Conditions. Environmental Science & Technology, 49: 1603−1610. NIST (2016). NIST Standard Reference Database Number 69. http://webbook.nist.gov/chemistry/ Sander, R. (2015). Compilation of Henry’s Law Constants for Water as Solvent (Version 4.0), Atmospheric Chemistry and Physics, 15: 4399–4981.
Appendix 2-A. Derivation of Equation 2-11 for Water Evaporation
2-A.1 Mass balance for the Amount of Water Evaporated During the water evaporation test, the total mass of water evaporated from the pool can be calculated from mass balance equation 2-A1: 𝐺𝐺𝑑𝑑𝑡𝑡𝑑𝑑 = 𝐺𝐺𝑡𝑡𝑜𝑜𝑑𝑑 + 𝐺𝐺𝑐𝑐(𝜏𝜏) − 𝐺𝐺𝑐𝑐(0) (2-A1) where Wtot = total amount of water evaporated during the test duration (g)

Page 22
Wout = amount of water vapor leaving the chamber (g) Wc(τ) = amount of water remaining in the chamber at time τ (g) Wc(0) = amount of water in the chamber at time = 0 (g).
If dry air is used for the test (i.e., Wc(0) = 0), Equation 2-A1 becomes: 𝐺𝐺𝑑𝑑𝑡𝑡𝑑𝑑 = 𝐺𝐺𝑡𝑡𝑜𝑜𝑑𝑑 + 𝐺𝐺𝑐𝑐 (2-A2) where Wtot = total amount of water evaporated during the test duration (g)
Wout = amount of water vapor leaving the chamber (g) Wc = amount of water remaining in the chamber at the end of test (g).
2-A.2 Calculating water vapor concentration in the chamber (Cw) For the dynamic process of water evaporation from a pool, the mass balance can be expressed by Equation 2-A3: 𝑉𝑉 𝑑𝑑𝐶𝐶𝑤𝑤
𝑑𝑑𝑑𝑑= 𝐴𝐴 𝑘𝑘𝑂𝑂𝑊𝑊 (𝐶𝐶𝑉𝑉 − 𝐶𝐶𝑤𝑤) − 𝑄𝑄 (𝐶𝐶𝑖𝑖𝑖𝑖 − 𝐶𝐶𝑤𝑤) (2-A3)
where V = chamber volume (m3)
Cw = water vapor concentration in chamber air (g/m3) t = time (h) A = source area (m2)
kGW = gas-phase mass transfer coefficient for water evaporation (m/h) Cv = saturated water vapor concentration at the chamber temperature (g/m3)
Q = chamber air flow rate (m3/h). Cin = water vapor concentration in inlet air (g/m3).
If dry air is used for the tests (Cin = 0), Equation 2-A3 becomes: 𝑉𝑉 𝑑𝑑𝐶𝐶𝑤𝑤
𝑑𝑑𝑑𝑑= 𝐴𝐴 𝑘𝑘𝑂𝑂𝑊𝑊 (𝐶𝐶𝑉𝑉 − 𝐶𝐶𝑤𝑤) − 𝑄𝑄 𝐶𝐶𝑤𝑤 (2-A4)
Given the initial conditions: t = 0 and Cw = 0, Equation 2-A4 can be solved to give: 𝐶𝐶𝑤𝑤 = 𝑂𝑂 𝑘𝑘𝐺𝐺𝐺𝐺 𝐶𝐶𝑣𝑣
𝑂𝑂 𝑘𝑘𝐺𝐺𝐺𝐺+𝑁𝑁 �1 − 𝑒𝑒−(𝑂𝑂 𝑘𝑘𝐺𝐺+𝑁𝑁) 𝑑𝑑� (2-A5)
where L = loading factor and L = A/V (m-1) N = air change rate and N = Q/V (h-1).
2-A.3 Calculating the amount of water vapor leaving the chamber (Wout) From Equation 2-A5, the average concentration of water vapor over the test period (τ) is given by 𝐶𝐶𝑤𝑤���� = 1
𝜏𝜏 ∫ 𝐶𝐶𝑤𝑤 𝑑𝑑𝑡𝑡𝜏𝜏0 = 1
𝜏𝜏 ∫𝑂𝑂 𝑘𝑘𝐺𝐺𝐺𝐺 𝐶𝐶𝑣𝑣𝑂𝑂 𝑘𝑘𝐺𝐺𝐺𝐺+𝑁𝑁
�1 − 𝑒𝑒−(𝑂𝑂 𝑘𝑘𝐺𝐺𝐺𝐺+𝑁𝑁) 𝑑𝑑� 𝑑𝑑𝑡𝑡𝜏𝜏0 (2-A6)

Page 23
which yields:
𝐶𝐶𝑤𝑤���� = 1𝜏𝜏𝐿𝐿 𝑘𝑘𝐺𝐺𝐺𝐺 𝐶𝐶𝑣𝑣𝐿𝐿 𝑘𝑘𝐺𝐺𝐺𝐺+𝑁𝑁 �𝜏𝜏 − 1− 𝑒𝑒−�𝐿𝐿 𝑘𝑘𝐺𝐺𝐺𝐺+𝑁𝑁� 𝜏𝜏
𝐿𝐿 𝑘𝑘𝐺𝐺𝐺𝐺+𝑁𝑁 � (2-A7)
Thus, the amount of water vapor leaving the chamber by the end of test can be calculated from
𝐺𝐺𝑡𝑡𝑜𝑜𝑑𝑑 = 𝑄𝑄 𝐶𝐶𝑤𝑤��� 𝜏𝜏 = 𝑄𝑄 𝐿𝐿 𝑘𝑘𝐺𝐺𝐺𝐺 𝐶𝐶𝑣𝑣𝐿𝐿 𝑘𝑘𝐺𝐺𝐺𝐺+𝑁𝑁 �𝜏𝜏 − 1− 𝑒𝑒−�𝐿𝐿 𝑘𝑘𝐺𝐺𝐺𝐺+𝑁𝑁� 𝜏𝜏
𝐿𝐿 𝑘𝑘𝐺𝐺𝐺𝐺+𝑁𝑁 � (2-A8)
2-A.4 Calculation of the amount of water remaining in the chamber (Wc) The amount of water vapor remaining in the chamber at time τ can be calculated from 𝐺𝐺𝑐𝑐(𝜏𝜏) = 𝑉𝑉 𝐶𝐶𝑤𝑤(𝜏𝜏) (2-A9) where Cw(τ) = water vapor concentration at the end of test (i.e., t = τ). Substituting Equation 2-A5 into 2-A9 yields: 𝐺𝐺𝑐𝑐(𝜏𝜏) = 𝑉𝑉 𝐿𝐿 𝑘𝑘𝐺𝐺𝐺𝐺 𝐶𝐶𝑣𝑣
𝐿𝐿 𝑘𝑘𝐺𝐺𝐺𝐺+𝑁𝑁 �1 − 𝑒𝑒−(𝐿𝐿 𝑘𝑘𝐺𝐺𝐺𝐺+𝑁𝑁) 𝜏𝜏� (2-A10)
2-A.5 Calculating the total amount of water evaporated during the test (Wtot) Substituting Equations 2-A8 and 2-A10 into 2-A2 gives
𝑤𝑤𝑑𝑑𝑡𝑡𝑑𝑑 = 𝑄𝑄 𝑂𝑂 𝑘𝑘𝐺𝐺𝐺𝐺 𝐶𝐶𝑣𝑣𝑂𝑂 𝑘𝑘𝐺𝐺𝐺𝐺+𝑁𝑁
�𝜏𝜏 − 1− 𝑒𝑒−�𝑂𝑂 𝑘𝑘𝐺𝐺𝐺𝐺+𝑁𝑁� 𝜏𝜏
𝑂𝑂 𝑘𝑘𝐺𝐺𝐺𝐺+𝑁𝑁� + 𝑉𝑉 𝑂𝑂 𝑘𝑘𝐺𝐺𝐺𝐺 𝐶𝐶𝑣𝑣
𝑂𝑂 𝑘𝑘𝐺𝐺𝐺𝐺+𝑁𝑁�1 − 𝑒𝑒−(𝑂𝑂 𝑘𝑘𝐺𝐺𝐺𝐺+𝑁𝑁) 𝜏𝜏� (2-A11)
which can be simplified to:
𝑤𝑤𝑑𝑑𝑡𝑡𝑑𝑑 = 𝑂𝑂 𝑘𝑘𝐺𝐺𝐺𝐺 𝐶𝐶𝑣𝑣𝑂𝑂 𝑘𝑘𝐺𝐺𝐺𝐺+𝑁𝑁
�𝑄𝑄𝜏𝜏 + �𝑉𝑉 − 𝑄𝑄𝑂𝑂 𝑘𝑘𝐺𝐺𝐺𝐺+𝑁𝑁
� �1 − 𝑒𝑒−(𝑂𝑂 𝑘𝑘𝐺𝐺𝐺𝐺+𝑁𝑁) 𝜏𝜏�� (2-A12) Under the steady state condition, which is usually reached in less than one hour for water evaporation in the test chamber, the exponential term in the equation approaches zero. Thus, Equation 2-A12 can be further simplified to:
𝑤𝑤𝑑𝑑𝑡𝑡𝑑𝑑 = 𝑂𝑂 𝑘𝑘𝐺𝐺𝐺𝐺 𝐶𝐶𝑣𝑣𝑂𝑂 𝑘𝑘𝐺𝐺𝐺𝐺+𝑁𝑁
�𝑄𝑄 �𝜏𝜏 − 1𝑂𝑂 𝑘𝑘𝐺𝐺𝐺𝐺+𝑁𝑁
� + 𝑉𝑉� (2-A13) Because Wtot is experimentally determined, kGW is the only unknown in Equation 2-A13.

Page 24
Appendix B. Pseudo Code for Estimating the Overall Liquid-Phase Mass Transfer Coefficient from Experimental Data
As described in Section 2.3.5.1, the overall liquid-phase mass transfer coefficient is estimated by fitting the time-concentration data to Equations 2-5 through 2-8 by means of nonlinear regression. In this Appendix, a set of pseudo code is provided, which can be tailored to different statistics software. Note that the text after the double slash (//) are comments; they are not part of the code. Dependent variables C // chemical concentration in chamber air (µg/m3) WL // amount of target chemical remaining in liquid (µg) Independent variable t // elapsed time (h) Unknown parameter KOL // overall liquid-phase mass transfer coefficient (m/h) Known parameters V // chamber volume (m3) Q // air change flow rate (m3/h) A // source area (m2) VL0 // initial volume of liquid (m3)
CL0 // initial concentration in liquid phase (µg/m3) H // dimensionless Henry’s law constant rw // water evaporation rate (g/h) rou // density of liquid water; rou = 1E6 (g/m3) Model equations
ER = A * KOL * (CL – C/H) // ER = chemical emission rate (µg/h) C’ = (ER – Q * C) / V // C’ = dC/dt WL’ = - ER // WL= chemical mass in liquid; WL’ = dWL/dt CL = WL / (VL0 – rw * t / rou) // chemical concentration in liquid phase (µg/m3)
Initial conditions
t = 0 C = 0 WL = VL0 * CL0
Initial estimate for value of KOL
KOL = 0.001

Page 25
3. Short-Term Emission Testing
3.1. Purpose:
The objective of this protocol is to collect information on chemical emission rates from products or articles through chamber testing.
3.2. Modifications:
This protocol is general, and it is anticipated that during protocol development and finalization, additional modifications will be made to tailor the sampling parameters or analytical techniques to the specific chemical and product tested, as well as to Agency recommendations specific to particular products, chemicals, or exposure scenarios of interest.
3.3. Description:
3.3.1. Approach Chemical emissions from products and articles are most commonly tested in environmental chambers, which are designed based on continuous stirred tank reactors (CSTR). Thus, many principals of the CSTR are applicable to test chambers, including mixing, residence time, steady state, and the assumption that the chemical concentration in the outlet air is representative of the chemical concentration inside the chamber. A conventional chamber system consists of the chamber itself, clean air supply, air flow control, air sampling ports, temperature and humidity sensors and controls, and a data acquisition system. An electric fan is often installed in conventional small and large chambers to improve air mixing and maintain certain air speed. Typical test conditions are 23°C, 50% relative humidity and 0.1 m/s air speed. The air change rate varies depending on chamber type. Over time, progress has been made to standardize testing for certain kinds of materials in certain kinds of chambers. The major chamber types are summarized in Table . Additional standard methods based on the standards listed in Table 3 include California Department of Public Health/Environmental Health Laboratory Branch (CDPH/EHLB) standard method for California Specification 01350 (CDPH/EHLB, 2010), ASTM D6007, ANSI/BIFMA M7.1 and ANSI/BIFMA x7.1.
Table 3. Commonly Used Environmental Chambers for Testing of Chemical Emissions from Products and Articlesa
Chamber Type
Typical Size
Typical Air Change Rate (h-1)
Commercially Available References
Full-scale chamber 30 m3 1 No ISO 16000-9
ASTM D6670
Small-scale chamber 50 L 1 Yes ISO 16000-9
ASTM D5116
Micro chamber 0.05-0.25 L >100 Yes ISO 16000-25
ASTM D7706
Field and Laboratory Emission Cells 0.035 L >100 Yes ISO 16000-10
ASTM D7143 aMid-scale chambers, typically 1 to 10 m3 in size, are also available but less commonly used.

Page 26
3.3.2. Selection of Test Chambers Selecting a chamber suitable for testing a given chemical in a given product or article depends on several factors, including the properties of the chemical of interest and those of the substrate. A general guideline is provided below.
Full Scale Chamber The full-scale chamber is most suitable for testing volatile organic compound (VOC) emissions from article assemblies, such as furniture, computers, TV sets, portable air cleaning devices, home electronics, and office equipment. The full-scale chamber is costlier to operate than other types of chambers and can accommodate testing of large items.
The full-scale chamber would also be appropriate for estimating VOC emissions from spray-applied products. Additional sampling equipment may be desired to size aerosols. These include an aerodynamic particle sizer (APS) or scanning mobility particle sizer (SMPS).
Figure 5. Schematic of example 30 m3 full-scale chamber (Liu et al., 2012).
Small Scale Chamber The small-scale chamber is suitable for VOC emissions from a large variety of products and articles as long as they can be cut into coupons or panels that fit the chamber size. It has limited capability for testing SVOC emissions.
Page 27
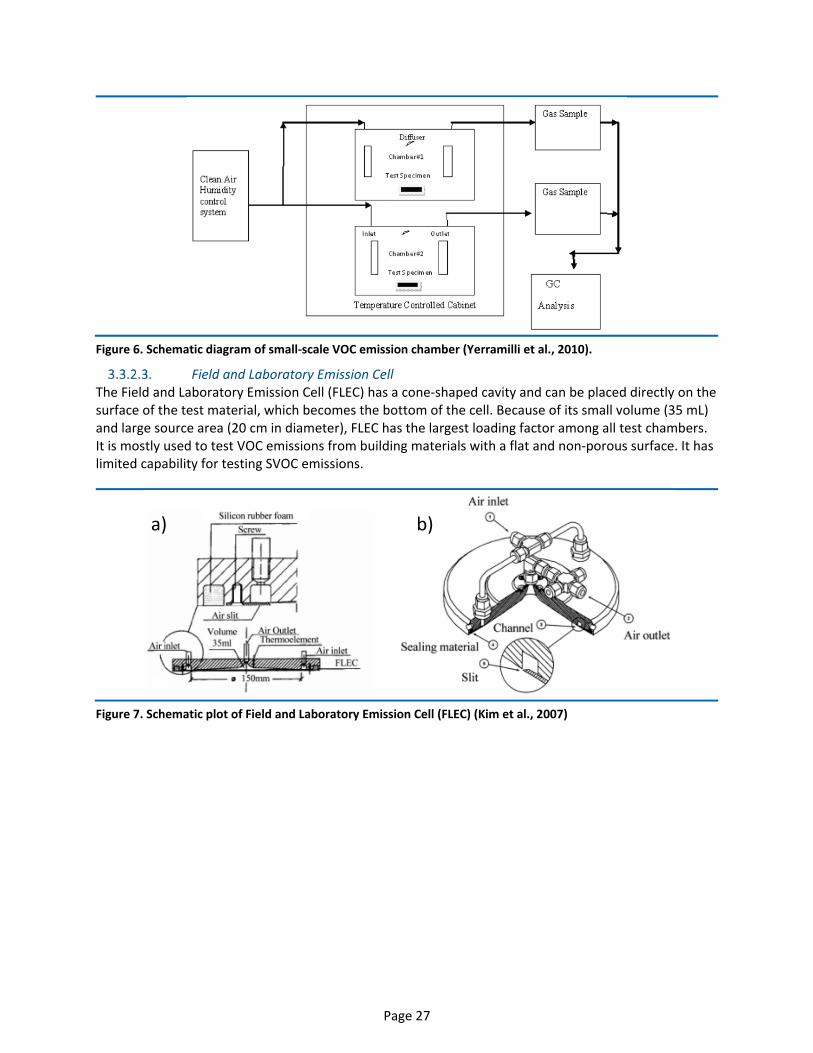
Figure 6. Schematic diagram of small-scale VOC emission chamber (Yerramilli et al., 2010).
Field and Laboratory Emission Cell The Field and Laboratory Emission Cell (FLEC) has a cone-shaped cavity and can be placed directly on the surface of the test material, which becomes the bottom of the cell. Because of its small volume (35 mL) and large source area (20 cm in diameter), FLEC has the largest loading factor among all test chambers. It is mostly used to test VOC emissions from building materials with a flat and non-porous surface. It has limited capability for testing SVOC emissions.
Figure 7. Schematic plot of Field and Laboratory Emission Cell (FLEC) (Kim et al., 2007)
a) b)

Page 28
Micro Chamber Micro chambers are small cells operated at a high air exchange rate. These chambers are suitable for rapid screening of material emissions and have been used for both VOCs and SVOCs.
Micro chambers have a wider range of temperature control than other types of chambers and, thus, are more convenient for testing emissions at elevated temperatures.
Testing of SVOC emissions is more challenging than testing VOCs because the interior surfaces of the test chamber can adsorb a significant amount of SVOCs from air. In conventional test chambers and FLEC, most SVOCs emitted from the source are adsorbed by interior surfaces (Clausen et al., 2004). This problem can be somewhat alleviated by using micro chambers, which have a high air change rate and relatively small surface area. An alternative is to use a specially-designed chamber that is modified to minimize the sink effect (Xu et al., 2012).
When the SVOC emissions cannot be detected at room temperature, testing at elevated temperatures can be considered. In order to extrapolate the test results to normal temperature, tests should be conducted at a minimum of three temperatures (see Appendix 3A).
3.3.3. Sample Preparation, Transport, Storage, and Conditioning Most standards, including those shown in Table contain a section for sample preparation, transportation, storage, and conditioning. The California standard method (CDPH/EHLB, 2010) contains more details about this subject. There are also stand-alone standards for sample handling (e.g., ISO 16000-11). Appropriate procedures should be used to prevent samples from being contaminated by exposure to contaminated air or materials and to prevent chemical loss due to exposure to light, excessive moisture, and/or elevated temperature.
To prepare test specimens, flat products/articles are cut into coupons (or panels). The size of the test specimen is often expressed as a loading factor (the exposed surface area divided by the volume of the test chamber, in (m2/m3)). For the same test specimen, a large loading factor means higher concentrations in chamber air, though this relationship may not be linear.
3.3.4. Generic Test Procedure a. Prior to a test, clean the chamber according to the standard cleaning procedure for the selected
chamber. b. Check the chamber for air leakage. c. Flush the chamber with clean air at the specified air flow rate, temperature, and humidity; take
a background air sample to ensure that the chamber is free of contamination. d. Open the lid (or door) of the chamber to place the test specimen(s) into the chamber (Note that
in conventional chambers, the test specimen is often placed in the center of the chamber floor. If chambers are of sufficient size, test specimens can also be placed vertically by using a rack to increase the loading factor.
Figure 8. Photo of micro-chamber/ thermal extractor (µCTE) from Schripp et al (2007)

Page 29
e. Close and tighten the chamber lid (or door) and record the test start time. f. Collect air samples according the sampling plan (see Sampling Methods section for more
details).
The test duration depends on the source type and data needs. To determine emission trends (constant versus decaying emissions), a minimum of one week is recommended, during which at least six samples should be taken at different elapsed time.
To calculate emission rates or emission factors for non-constant sources, more samples (e.g., a dozen) are often needed. A greater sampling frequency is needed in the early hours of testing to capture rapidly changing chamber concentrations. This is especially important for conventional test chambers.
3.3.5. Sampling Methods Selection of the sampling method requires consideration of several factors, including collection efficiency, specificity, capacity (potential breakthrough), and compatibility with the analytical methods. Many general-purpose sampling methods have been developed for collecting VOCs and SVOCs from chamber air, including sorbent tubes (Tenax, XAD resins, charcoal, silica gel etc.), impingers, filters, and polyurethane foam (PUF) cartridges. There are also chemical specific sampling media. For example, 2,4 dinitrophenylhydrazine (DNPH) cartridges are commonly used for sampling aldehydes (ASTM D6803).
3.3.6. Sampling Volume Successful collection of chemicals of interest in emission samples depends on the sensitivity of the analytical methods and sample volume. A low sample volume may result in no detection of the chemical of interest. Thus, it is important to roughly determine the proper sampling volume before commencing testing. This is often achieved in two ways: (1) trial and error, which is done by conducting a pilot or scouting test; and (2) estimating the order-of-magnitude of the air concentration based on existing mass transfer models, from which a proper sample volume can be determined when the method quantification limit is known. The latter method requires knowledge of mass transfer source models and parameter estimation methods.
3.3.7. Sample Extraction and Analysis Sample extraction protocols will vary based on the target compound of interest and air sampler used. In general, Soxhlet extraction, sonication, solvent exchange, and sample concentration using nitrogen may be required. Many standard methods can be used to analyze the air samples collected from chamber testing (e.g., EPA Methods TO-01, TO-17, 8260B and 8270D; ASTM D 7339 and D 5197; ISO 16000-3 and ISO 16000-6). Selection of appropriate analytical methods depends on the properties of the chemicals of interest and the type of sampling media. Gas chromatography (GC) with different detectors (e.g., flame ionization, electron capture, and mass spectrometry detectors) are most commonly used for VOC and SVOC analysis. High performance liquid chromatography (HPLC) is often used for aldehydes and some SVOCs. Commonly used detectors include UV, fluorescence, and tandem mass spectrometry.
3.4. Records Retention and Reporting Results:
3.4.1. Records to be Maintained Records submitted to the EPA should include, but are not limited to, the following:
a. The original signed protocol and any amendments.

Page 30
b. Identification and characterization of the test substance as provided by Sponsor. c. Identification and characterization of the material in question d. Experiment initiation and termination dates. e. Laboratory log books (e.g., stock solution concentration calculations and solution preparation,
calibration, and QC data). f. Instrument (e.g., GC/ECNI) data files. g. Spreadsheet files for data processing. h. Environmental data acquired by the data acquisition system of the test chambers (e.g.,
temperature, air flow and inlet air moisture content). i. Chain of custody documentation, including sample storage and handling information. j. Copy of final report.
3.4.2. Final Report A final report of the results of the study should be prepared and submitted to the EPA. The final report should include, but is not limited to the following, when applicable:
a. Name and address of facility performing the study. b. Dates on which the study was initiated and completed. c. Objectives and procedures stated in the approved protocol, including any changes in the original
protocol. d. Identification and characterization of the test substance as provided by Sponsor. e. A summary and analysis of the data and a statement of the conclusions drawn from the analysis. f. A description of the transformations and calculations performed on the data. g. A description of the methods used and reference to any standard method employed. h. A description of the instrumentation utilized. i. A description of the preparation of the test solutions, the test conditions, the testing
concentrations, and the duration of the test. j. A description of sampling and analytical methods, including level of detection, level of
quantification, and references. k. A description of test specimens and test matrix. l. A description of the test results including measured values for individual chemicals of interest
for each matrix. m. A description of all circumstances that may affect the quality or integrity of the data. n. The name of the study director, the names of other scientists or professionals, and the names of
all supervisory personnel involved in the study. o. The signed and dated reports of each of the individual scientists or other professionals involved
in the study, if applicable. p. The location where the raw data and final report are to be stored. q. A statement prepared by the Quality Assurance Unit listing the types of inspections, the dates
that the study inspections were made, a description of quality assurance and quality control process, and the findings reported to the Study Director and Management.
Page 31
r. A copy of all raw data including but not limited to instrumentation output, lab notebooks, and data sheets, etc.
3.4.3. Changes to the Final Report If it is necessary to make corrections or additions to the final report after it has been accepted, such changes should be made in the form of an amendment issued by the Study Director. The amendment should clearly identify the part of the study that is being amended and the reasons for the alteration. Amendments should be signed and dated by the Study Director and Laboratory Quality Assurance Officer.
3.4.4. Changes to the Protocol Planned changes to the protocol should be in the form of written amendments signed by the Study Director and approved by the sponsor’s representative and submitted to EPA using procedures in 40 CFR 790.50. Amendments should be considered as part of the protocol and should be attached to the final protocol. Any other changes should be in the form of written deviations signed by the Study Director and filed with the raw data. All changes to the protocol should be indicated in the final report. Changes to the test standard require prior approval from EPA using procedures in 40 CFR 790.55 (U.S. Code, 1999).
3.5. References:
ANSI/BIFMA M7.1-2011: Standard Test Method for determining VOC Emissions from Office Furniture Systems, Components and Seating, available at: https://www.bifma.org/store/ViewProduct.aspx?id=1375383
ANSI/BIFMA X7.1-2011 Standard for Formaldehyde and TVOC Emissions of Low-emitting Office Furniture and Seating, available at https://www.bifma.org/store/ViewProduct.aspx?id=1375803
ASTM (2009). D5197 - 09e1 Standard Test Method for Determination of Formaldehyde and Other Carbonyl Compounds in Air (Active Sampler Methodology) ASTM (2010). D5116-10 Standard Guide for Small-Scale Environmental Chamber Determinations of
Organic Emissions from Indoor Materials/Products, available at http://compass.astm.org/EDIT/html_annot.cgi?D5116+10
ASTM (2011a). D7143 - 11 Standard Practice for Emission Cells for the Determination of Volatile Organic Emissions from Indoor Materials/Products, available at http://www.astm.org/Standards/D7143.htm
ASTM (2011b). D7706-11 Standard Practice for Rapid Screening of VOC Emissions from Products Using Micro-Scale Chambers, available at http://www.astm.org/Standards/D7706.htm
ASTM (1012). D7339 - 12 Standard Test Method for Determination of Volatile Organic Compounds Emitted from Carpet using a Specific Sorbent Tube and Thermal Desorption / Gas Chromatography. https://www.astm.org/Standards/D7339.htm ASTM (2013). 6670-13 Standard Practice for Full-Scale Chamber Determination of Volatile Organic
Emissions from Indoor Materials/Products, available at http://www.astm.org/Standards/D6670.htm ASTM (2013). ASTM D6803-13 Standard Practice for Testing and Sampling of Volatile Organic
Compounds (Including Carbonyl Compounds) Emitted from Paint Using Small Environmental Chambers, available at http://www.astm.org/Standards/D6803.htm
ASTM (2014). D6007-14 Standard Test Method for Determining Formaldehyde Concentrations in Air from Wood Products Using a Small-Scale Chamber, available at http://www.astm.org/Standards/D6007.htm

Page 32
CDPH/EHLB (2010). Standard Method V1.1, Standard method for the testing and evaluation of volatile organic chemical emissions from indoor sources using environmental chambers, Version 1.1, available at https://www.scsglobalservices.com/files/standards/CDPH_EHLB_StandardMethod_V1_1_2010.pdf
Clausen, P., Hansen, V., Gunnarsen, L., Afshari, A., Wolkoff, P. (2004). Emission of di-2-ethylhexyl phthalate from PVC Flooring into Air and Uptake in Dust: Emission and Sorption Experiments in FLEC and CLIMPAQ. Environmental Science & Technologies, 38, 2531-2537.
Cleanroom Technology (2011). VOC emissions test method, available at http://www.cleanroomtechnology.com/ technical/article_page/VOC_emissions_testULmethod/58849
EPA (2011). Quality Management Tools - QA Project Plans. http://www.epa.gov/QUALITY/qapps.html ISO (2006a). ISO 16000-9: Indoor Air−Part 9: Determination of the Emission of Volatile Organic
Compounds from Building Products and Furnishing−Emission Test Chamber Method, available at http://www.iso.org/iso/catalogue_detail.htm?csnumber=38203
ISO (2006b). ISO 16000-10:2006 -- Indoor air -- Part 10: Determination of the Emission of Volatile Organic Compounds from Building Products and Furnishing -- Emission test cell method, available at http://www.iso.org/iso/iso_catalogue/catalogue_tc/catalogue_detail.htm?csnumber=38204
ISO (2006c). ISO 16000-11:2006 Indoor air -- Part 11: Determination of the Emission of Volatile Organic Compounds from Building Products and Furnishing -- Sampling, storage of samples and Preparation of Test Specimens. http://www.iso.org/iso/catalogue_detail.htm?csnumber=38205
ISO (2011a). ISO 16000-3:2011 Indoor air -- Part 3: Determination of Formaldehyde and other Carbonyl Compounds in Indoor Air and Test Chamber Air -- Active sampling method. http://www.iso.org/iso/catalogue_detail.htm?csnumber=51812
ISO (2011b). ISO 16000-6:2011 Indoor air - Part 6: Determination of Volatile Organic Compounds in Indoor and Test Chamber Air by Active Sampling on Tenax TA sorbent, thermal desorption and gas chromatography using MS or MS-FID. http://www.iso.org/iso/catalogue_detail.htm?csnumber=52213
ISO (2011c). 16000-25, Indoor Air−Part 25: Determination of the Emission of Semi-Volatile Organic Compounds by Building Products –Micro-chamber method. http://www.iso.org/iso/catalogue_detail.htm?csnumber=44892
Kim S, Kim J, and Kim H (2007). Application of Field and Laboratory Emission Cell (FLEC) to Determine Formaldehyde and VOCs Emissions from Wood-Based Composites. Mokchae Konghak 35(5): 24−37.
Liu W, Zhang Y, and Yao Y (2012). Labeling of Volatile Organic Compounds Emissions from Chinese Furniture: Consideration and practice. Chinese Science Bulletin, 58: 3499−3506
Liu, X, Guo, Z., Krebs, K.A., Stinson, R.A., Nardin, J.A., Pope, R.H., Roache, N.F., (2015) Chamber study of PCB Emissions from Caulking Materials and Light Ballasts, Chemosphere, 137, 115-121. (Figure in SI)
Schripp, T., et al. (2007) "A Microscale Device for Measuring Emissions from Materials for Indoor Use." Analytical and bioanalytical chemistry 387.5: 1907-1919.
U.S. Code (1999). 40 CFR 790.55 - Modification of Test Standards or Schedules During Conduct of Test. https://www.gpo.gov/fdsys/granule/cfr-1999-title40-vol24/cfr-1999-title40-vol24-sec790-55/content-detail.html
US EPA (1984). Method TO-01 — Method for the Determination of Volatile Organic Compounds in Ambient Air using Tenax® Adsorption and Gas Chromatography/Mass Spectrometry (GC/MS). https://www3.epa.gov/ttnamti1/files/ambient/airtox/to-1.pdf

Page 33
US EPA (1996). Method 8260B Volatile Organic Compounds by Gas Chromatography/Mass Spectrometry (GC/MS). https://www.epa.gov/sites/production/files/2015-12/documents/8260b.pdf
US EPA (1999). Compendium Method TO-10A -- Determination Of Pesticides And Polychlorinated Biphenyls In Ambient Air Using Low Volume Polyurethane Foam (PUF) Sampling Followed By Gas Chromatographic/Multi-Detector Detection (GC/MD). https://www3.epa.gov/ttnamti1/files/ambient/airtox/to-10ar.pdf
US EPA (2014) Method 8270D: Semi volatile Organic Compounds by Gas Chromatography/Mass Spectrometry (GC/MS), available at http://www3.epa.gov/epawaste/hazard/testmethods/sw846/pdfs/8270d.pdf
Xu Y, Liu Z, Park J, Clausen PA, Benning JL, and Little JC (2012). Measuring and Predicting the Emission Rate of Phthalate Plasticizer from Vinyl Flooring in a Specially-Designed Chamber. Environmental Science and Technology, 46: 12534−12541.
Yerramilli S, Schiller R, Downie R, and Garnys V (2010). Measurement of Chemical Emissions from Building Products. The Australian Building Services Journal, 1: 41-44.

Page 34
Appendix 3-A. Micro Chamber Method
3-A.1 General Method Description This protocol uses a modified micro chamber method to characterize emissions of chemicals of interest from articles or products at modestly elevated temperatures. The test results will be used to estimate the emission rates at a given temperature, including room temperature. Micro chambers are made of stainless steel, often with the interior surfaces coated with an inert material. The size of the micro chamber may vary, typically from 44 to 250 mL. Chemicals emitted from the test specimen are carried out of the chamber by well characterized air flow and captured by a sampler at the chamber’s outlet port. The general steps for testing the chemical of interest emissions from articles are as follows:
a) Prepare test specimens by cutting the article into circular disks, where size is determined by the inside diameter of the micro chamber body;
b) Prepare the micro chamber system, including air flow calibration, relative humidity, temperature, and pressure settings;
c) Conduct chamber testing while collecting air samples directly from the chamber outlet at different elapsed times; the results are used to calculate WA in Equation 3-A3;
d) After the last air sample is taken, take rinse/wipe samples from the interior surfaces of the chamber to determine WC in Equation 3-A2;
e) Calculate the time-averaged area-specific emission rate using Equation 3-A2.
3A.2 Micro Chamber System A micro chamber system consists of the following components:
a) Several identical micro chambers. b) A clean air supply, usually clean air generator or zero air stored in a compressed cylinder
with a gas tank regulator that is capable of sustaining 60 psi of pressure. c) An air humidifier (optional). d) An air flow distribution system that maintains a constant flow of air through each chamber,
independent of sorbent tube impedance and whether or not a sorbent tube is attached. e) A temperature control system, which allows tests to be conducted at room or modestly
elevated temperatures. f) An air sampling port, which allows the air sampler to be inserted directly into the air outlet

Page 35
Figure 9. An example of a micro chamber system. Note that the Polyurethane Foam (PUF) air samplers are directly connected to the chamber air outlet (Liu et al 2015).
For the purpose of calculating the area-specific emission rate, the exact area of the exposed surface of the test specimen should be known. This can be done by placing a special type of sample holder, such as a sample spacer with a circle plate on top, inside the chamber to raise the test specimens to the top of the chamber so only the emissions from the top surface of the test specimen are collected by the air sampler. Operating the micro chamber in this manner is known as the “cell mode” (ASTM, 2011b).
3-A.3 Calculations
Under the steady-state condition, the area-specific emission rate for VOCs is calculated from Equation 3A-1.
𝐸𝐸 = 𝑄𝑄 × 𝐶𝐶
𝐴𝐴 (3A-1)
where E = area-specific emission rate (µg/m2/h), Q = air change flow rate (m3/h), C = chemical concentration in chamber air (µg/m3), A = exposed area of the test specimen (m2).
However, Equation 3A-1 is not applicable to testing SVOCs because the interior surfaces of the chamber may adsorb significant amount of chemicals, which should be considered when calculating the emission rate. To resolve this problem, the existing test method requires a second step to characterize the adsorption after emission testing is complete (ISO, 2011), which complicates emissions testing. The current protocol simplifies the existing protocol by collecting rinse and wipe samples from chamber walls at the end of the emission test, as described in Section 3A.4.3.4 of this Appendix. With the experimental data for air concentrations and adsorption by chamber walls, the time-averaged area-specific emission rate can be calculated from Equation 2:
𝐸𝐸� = 𝑊𝑊𝐴𝐴 + 𝑊𝑊𝑐𝑐
𝐴𝐴 × 𝑑𝑑 (3A-2)
where 𝐸𝐸� = time-averaged area-specific emission rate over the test duration (µg/m2/h),
WA = amount of chemical of interest leaving the micro chamber, from Equation 3 (µg), Wc = amount of chemical of interest adsorbed by chamber walls, which is experimentally determined (see Section A.4.3.4 of this Appendix) (µg),
A = source area (m2), t = test duration (h). According to ASTM D5116, (ASTM, 2010), WA can be calculated from Equation 3A-3, which is applicable to both VOCs and SVOCs:
𝐺𝐺𝐴𝐴 = 𝑄𝑄∑ (𝐶𝐶𝑖𝑖+1+ 𝐶𝐶𝑖𝑖) × (𝑑𝑑𝑖𝑖+1− 𝑑𝑑𝑖𝑖)
2𝑖𝑖−1𝑖𝑖=0 (3A-3)
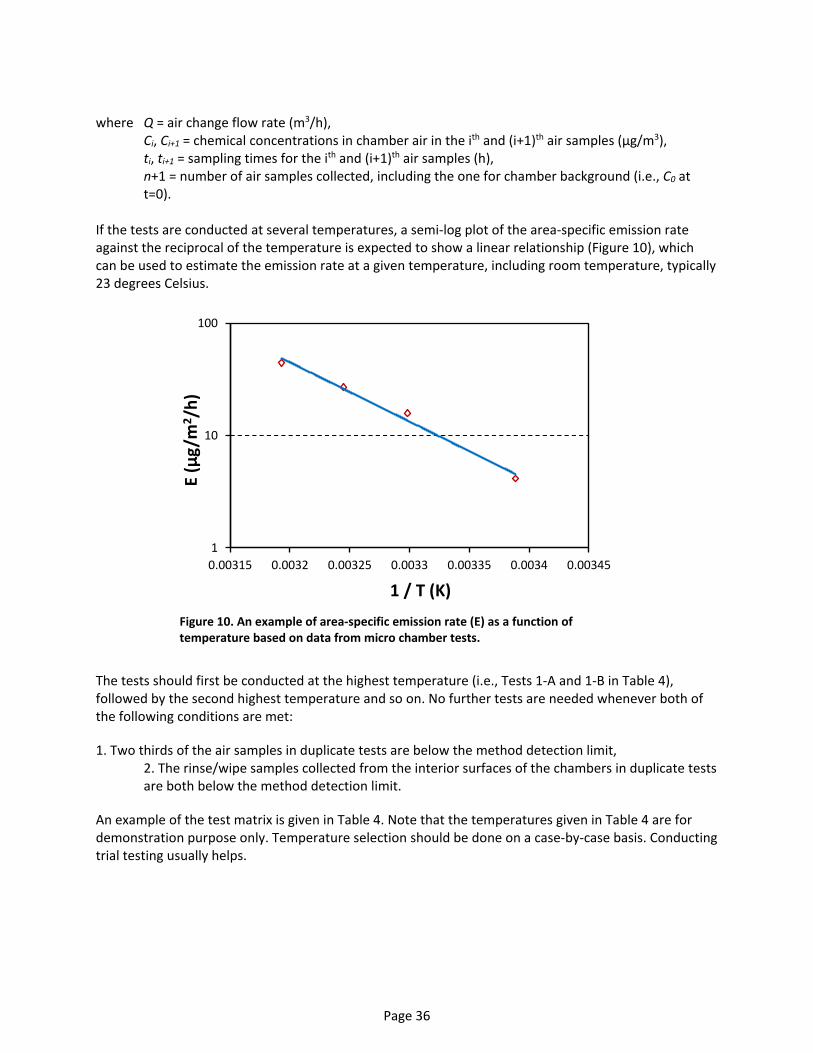
Page 36
where Q = air change flow rate (m3/h),
Ci, Ci+1 = chemical concentrations in chamber air in the ith and (i+1)th air samples (µg/m3), ti, ti+1 = sampling times for the ith and (i+1)th air samples (h),
n+1 = number of air samples collected, including the one for chamber background (i.e., C0 at t=0).
If the tests are conducted at several temperatures, a semi-log plot of the area-specific emission rate against the reciprocal of the temperature is expected to show a linear relationship (Figure 10), which can be used to estimate the emission rate at a given temperature, including room temperature, typically 23 degrees Celsius.
Figure 10. An example of area-specific emission rate (E) as a function of temperature based on data from micro chamber tests.
The tests should first be conducted at the highest temperature (i.e., Tests 1-A and 1-B in Table 4), followed by the second highest temperature and so on. No further tests are needed whenever both of the following conditions are met:
1. Two thirds of the air samples in duplicate tests are below the method detection limit, 2. The rinse/wipe samples collected from the interior surfaces of the chambers in duplicate tests are both below the method detection limit.
An example of the test matrix is given in Table 4. Note that the temperatures given in Table 4 are for demonstration purpose only. Temperature selection should be done on a case-by-case basis. Conducting trial testing usually helps.
1
10
100
0.00315 0.0032 0.00325 0.0033 0.00335 0.0034 0.00345
E (µ
g/m
2 /h)
1 / T (K)

Page 37
Other conditions, such as chamber air flow rate, relative humidity, sample volume, number of samples, and sample duration, will be determined for target compounds.
3A.4 General Test Procedure: 3A.4.1 Preparation of the Micro Chamber System
a. The micro chambers should be cleaned prior to each test by washing all of the interior surfaces with de-ionized water and detergent, then rinsing the interior surfaces with solvent such as acetone followed by hexane.
b. The micro chamber unit can be operated in a ventilated fume hood.
c. Make certain the gas cylinder is turned off and the power switch of the micro chamber unit is off.
d. Connect the air supply line to the air inlet of the micro chamber unit.
e. Switch power of the micro chamber unit to on position. f. Turn on the air supply gas at the tank. g. Set the oven temperature to the desired temperature (e.g., 35 ⁰C in Table 4). h. Set the gas tank regulator to desired pressure and then use the air flow calibrator to measure
the air flow at the inlet and then outlet points for each micro chamber to be used. The outlet gas flow rate should be no less than 90% of the inlet gas flow rate measured at the same temperature and humidity conditions.
i. To calibrate the air flow at other temperatures (e.g., 45, 55 and 65 ⁰C in Table 4), repeat the above two steps.
j. Create a chart by plotting the air flow again the gas pressure (Figure 11). The gas tank pressure can be used in subsequent tests to set chamber air flow. This can be done by plotting air flow vs gas pressure for the desired flow range.
k. Connect an air sampler to the chamber outlet port. The sampler should be suitable to collect air samples for the given target compounds and at the test temperature.
l. Check the air flows at the inlet and outlet points for each chamber.
Table 4. An Example of Test Matrix and Temperature Settings for Micro Chamber Tests.
Test ID Temperature (⁰C)
1-A 65
1-B 65
2-A 55
2-B 55
3-A 45
3-B 45
4-A 35
4-B 35

Page 38
Figure 11. An example of the relationship between the inlet air flow rate and air pressure at the gas tank regulator. Note that the calibration curves at different temperatures may be slightly different.
3A.4.2 Air Sampling Method Air samples are collected by connecting an appropriate air sampler (such as PUF) directly to the chamber outlet (Figure 9). Thus, the sampling air flow is equal to the outlet air flow. This data allows for calculation of the amount of chemical leaving the chamber (Equation 3A-3).
3A.4.3 Conducting Chamber Tests 3A.4.3.1 Set test conditions:
a. Place a pre-cleaned sample spacer into the chamber if needed. b. Close the chamber lid. c. Set the pressure to reach the desired air flow rate and temperature as determined during
preparation of the micro chamber system. d. Check the air flow at the chamber outlet. e. Flush the chambers with clean air for an appropriate time period based on the objective of the
test.
3A.4.3.2 Collect Background Air Sample Background air samples are collected by placing the same type of sampler as used for the test on the outlet port of the empty chamber. Background air samples are to collected for the same sampling duration and sample volume as for a test sample.
3A.4.3.3 Test Chemical of Interest Emissions from Test Specimens a) Open chamber lid and place a test specimen on the bottom of the chamber or sample
spacer. b) Close chamber lid. c) Record test start time (Note, The test start time is the time the chamber is sealed, but the
sampling start time can be any time after that, for example, immediately after the chamber is sealed, after 1 hour or 24 hours or longer).
0
20
40
60
80
100
0 10 20 30 40 50 60
Flow
Rat
e (m
L/m
in)
Pressure (psi)
Page 39
d) Leave the chamber operating for an appropriate time period based on the objective of the test.
e) Connect an appropriate air sampler to the outlet port of the chamber. f) Record the sampling start time. g) Collect air sample. h) Disconnect the air sampler. i) Record the sampling end time, the sampling time is the mid-point of the sampling duration. j) Seal the sampler with proper fittings, if supplied, wrap the PUF sampler with two layers of
aluminum foil and store the sample in a refrigerator at 4 ⁰C until extraction. k) Collect additional air samples according the sampling schedule. Samples should be collected
at intervals throughout the sampling duration to effectively characterize changes in emissions over time based on chemical and product of interest.
l) Record test end time.
3A.4.3.4 Collecting Rinse/Wipe Samples from Chamber’s Interior Surfaces a) Remove the micro chamber from the system. b) Use a disposable glass pipette to transfer approximately 3 mL hexane (or appropriate
solvent, depending on the target chemical) into the chamber. c) Use the pipette to draw the hexane solvent from the chamber to rinse the interior walls and
the sample spacer. d) Use the pipette to transfer the rinse solvent to a 50-mL scintillation vial. e) Repeat steps for rinsing the walls and transferring the rinse solvent two more times. f) Use disposable forceps to fold and then hold a half-sized gauze wipe pad. g) Wet the gauze wipe pad with 3-mL appropriate solvent. h) Wipe the chamber lid thoroughly. i) Place the wipe into the vial for storing the rinse liquid. j) Repeat steps for wiping with the solvent-soaked (3-mL) gauze one more time. k) Add 20 mL solvent to the vial. l) Add 50 ng recovery standard to the vial and close the cap tightly. m) If the sample is not extracted immediately, store it in a refrigerator at 4 ⁰C. Appropriate
length of storage time and temperature will vary and should be documented.

Page 40
4. Long-Term Emission Testing – Partition and Diffusion Coefficients
4.1. Purpose:
The objective of this protocol is to collect information on physical/chemical properties that influence migration rates of VOCs and SVOCs into the indoor environment.
4.2. Modifications:
This protocol is general, and it is anticipated that during protocol development and finalization, additional modifications will be made to tailor the sampling parameters or analytical techniques to the specific chemical and product tested, as well as to Agency recommendations specific to particular products, chemicals, or exposure scenarios of interest.
4.3. Description:
4.3.1. Basics of Partition and Diffusion coefficients VOCs and SVOCs emitted from solid surfaces (e.g., building materials, consumer products) can affect indoor air quality (Cox et al., 2001). Because testing long-term emissions is costly and time-consuming, mass transfer models have been developed to predict the emission and transport of chemicals. Initial concentration in the source (C0), the solid-phase diffusion coefficient (Dm), material-air partition coefficient (Kma), and gas-phase mass transfer coefficient (h) are key parameters that impact the emissions. For new products and articles, C0 should be reported using Protocol 1: Source Characterization. Parameter h is often estimated with empirical models. The partition and diffusion coefficients are key to understanding the long-term effect of chemical emission from products and articles.
Theoretically, the diffusion transport of molecules is related to the properties of the chemical, such as molecular weight, molecular size (volume or area), molecular polarity, the properties of the substrate, and environmental conditions, such as temperature, air velocity, and relative humidity. The material-air partition coefficient is often correlated with the volatility of the chemical and properties of the substrate. While there are many methods for experimental determination of Dm and Kma, standard methods are lacking. No single method is suitable for testing all materials and chemicals. Most existing methods are suitable for VOCs only.
4.3.2. Methods to Estimate Partition and Diffusion Coefficients Table summarizes eight experimental methods for measuring the partition and diffusion coefficients for solid materials. Details associated with each method are described below.
Table 5. Methods for Experimental Determination of Partition and Diffusion Coefficients.
Method K D Applicability Reference
Microbalance Yes Yes VOCs Cox et al., 2001
Zhao et al., 2004
Dynamic-static chamber No Yes VOCs Meininghaus et al., 2002
Yes Yes VOCs He et al., 2010

Page 41
Method K D Applicability Reference
Static diffusion metric method Yes Yes VOCs Bodalal et al., 2001
Twin dynamic chamber methods Yes Yes VOCs
Xiong et al., 2009; Xu et al., 2012
Meininghaus et al., 2000 Meininghaus et al., 2002
Dual chamber in series Yes Yes SVOCs Liu et al., 2014a, 2016
Variable volume loading Yes No VOCs Xiong et al., 2011
Cup method No Yes VOCs Kirchner et al., 1999
Porosity-based method No Yes VOCs Blondeau et al., 2003
4.3.3. Microbalance Method The microbalance method can be used to estimate the partition and diffusion coefficients by placing the test specimen on a microbalance located in a dynamic chamber with temperature and humidity control, as shown in Figure (Cox et al., 2001; Zhao et al., 2004). In the beginning of the test, the sample weight is first stabilized by passing clean air through the chamber until an equilibrium is obtained. The sorption process begins by introducing an air stream with a constant and known concentration of VOC into the chamber. The mass gain of the test specimen due to VOC sorption over time is monitored. The monitoring continues for a period of time after the equilibrium is reached. During the desorption process, the chamber is purged with clean air and the weight loss of the test specimen is monitored until an equilibrium is re-established. This is a gravimetric method. With the sorption and desorption data measured by the microbalance, the partition coefficient is determined by the ratio of the solid- and gas-phase concentrations and the diffusion coefficient by non-linear regression.
Figure 12. Schematic plot of the microbalance test system (Cox et al., 2001).

Page 42
4.3.4. Dynamic-static Chamber Method The system of the dynamic-static chamber method is composed of a FLEC, a static chamber (test chamber), and a measurement device. One example of a measurement device is a proton transfer reaction-mass spectrometer (PTR-MS) (Meininghaus et al., 2002; He et al., 2010). The static chamber serves as a limited reservoir for gaseous VOCs. The test material, as a thin plate with uniform thickness, is placed between the FLEC and the static chamber. During the test, clean gas (VOC free) from a compressed air cylinder passes through the FLEC at a controlled rate (Figure 2), and VOC is introduced to the static chamber at a certain concentration. The VOC in the static chamber will diffuse to the FLEC through the test material driven by the concentration gradient. The real-time VOC concentration in the outlet air of the FLEC is sampled and analyzed by an appropriate method. The concentration data is used to estimate the partition and diffusion coefficients.
Figure 23. Schematic plot of the dynamic-static chamber (He et al., 2010).
4.3.5. Static Diffusion Metric Method The static diffusion metric method uses a twin static diffusion chamber system to determine the diffusion coefficient (Bodalal et al., 2001). The testing material is installed between two chambers, and a fan is installed in each chamber to mix the air (Figure 3). During the test, the VOC compound under investigation is introduced into one chamber, while the initial concentration of the other chamber is zero. Partition and diffusion coefficients are estimated based on a comparison of the measured gas-phase concentrations in the two chambers.
Figure 34. Schematic plot of the diffusion metric method (Bodalal et al., 2001).
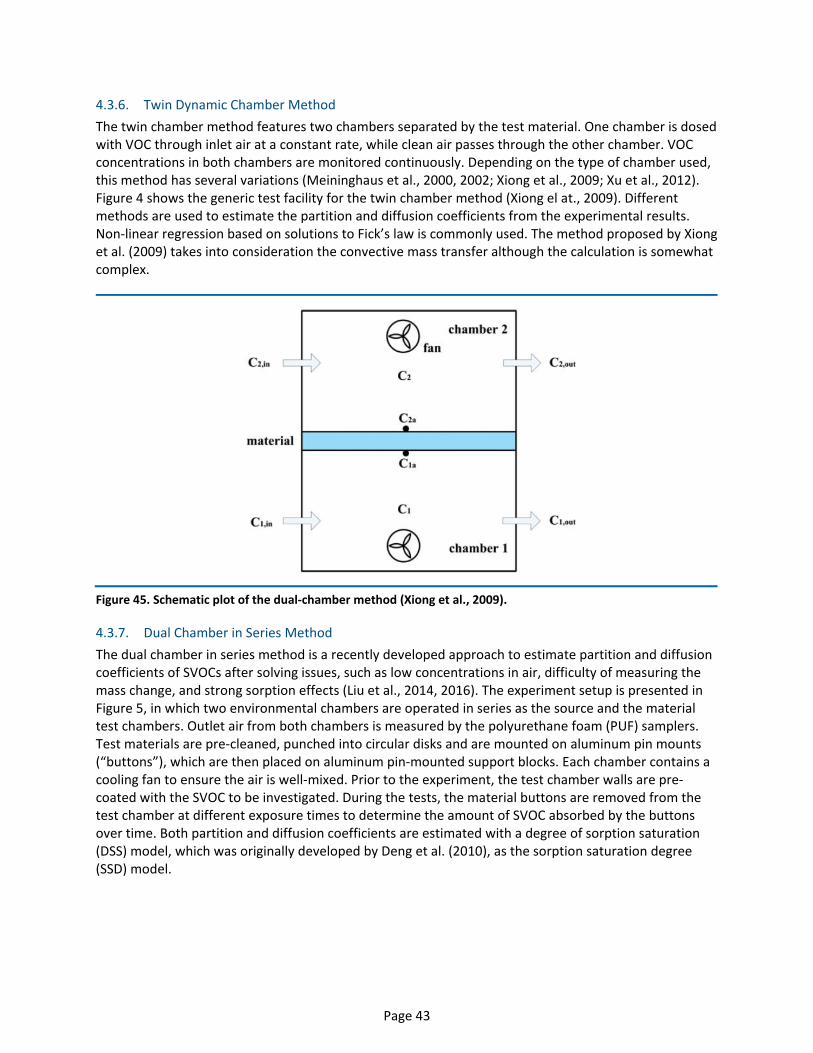
Page 43
4.3.6. Twin Dynamic Chamber Method The twin chamber method features two chambers separated by the test material. One chamber is dosed with VOC through inlet air at a constant rate, while clean air passes through the other chamber. VOC concentrations in both chambers are monitored continuously. Depending on the type of chamber used, this method has several variations (Meininghaus et al., 2000, 2002; Xiong et al., 2009; Xu et al., 2012). Figure 4 shows the generic test facility for the twin chamber method (Xiong el at., 2009). Different methods are used to estimate the partition and diffusion coefficients from the experimental results. Non-linear regression based on solutions to Fick’s law is commonly used. The method proposed by Xiong et al. (2009) takes into consideration the convective mass transfer although the calculation is somewhat complex.
Figure 45. Schematic plot of the dual-chamber method (Xiong et al., 2009).
4.3.7. Dual Chamber in Series Method The dual chamber in series method is a recently developed approach to estimate partition and diffusion coefficients of SVOCs after solving issues, such as low concentrations in air, difficulty of measuring the mass change, and strong sorption effects (Liu et al., 2014, 2016). The experiment setup is presented in Figure 5, in which two environmental chambers are operated in series as the source and the material test chambers. Outlet air from both chambers is measured by the polyurethane foam (PUF) samplers. Test materials are pre-cleaned, punched into circular disks and are mounted on aluminum pin mounts (“buttons”), which are then placed on aluminum pin-mounted support blocks. Each chamber contains a cooling fan to ensure the air is well-mixed. Prior to the experiment, the test chamber walls are pre-coated with the SVOC to be investigated. During the tests, the material buttons are removed from the test chamber at different exposure times to determine the amount of SVOC absorbed by the buttons over time. Both partition and diffusion coefficients are estimated with a degree of sorption saturation (DSS) model, which was originally developed by Deng et al. (2010), as the sorption saturation degree (SSD) model.

Page 44
Figure 56. Schematic plot of the dual chamber method (Liu et al., 2014).
4.3.8. Variable Volume Loading The variable volume loading method (Xiong et al., 2011) uses a closed stainless steel chamber or a sealable jar. The test specimen with known surface area and volume is placed in the chamber. Once the equilibrium condition is reached, gas-phase concentration in the chamber is determined. The same experimental procedure is repeated several times by changing the volume of the test specimen so the loading factor is different from test to test. The initial concentration of the chemical in the test specimen and material-air partition coefficient is estimated by plotting the equilibrium concentration versus the ratio of the air volume over the volume of the test specimen.
4.3.9. Cup Method This method determines the solid-phase diffusion coefficient only. Based on an ISO 12572 on water vapor diffusion (ISO, 2001), the cup method involves a cup of liquid VOC at saturation in headspace. The top of the cup is covered by a test specimen (Figure 6, Kirchner et al., 1999; Blondeau et al., 2003). The system is placed in a temperature and humidity-controlled environment, and the diffusion coefficient of the tested specimen is estimated by weighing the diffusion loss of VOC using a microbalance.
4.3.10. Porosity-based Method Diffusion coefficients can be estimated by the porosity-based method through mercury intrusion porosimetry tests (Blondeau et al., 2003). The first step is to conduct mercury intrusion porosimetry (MIP) tests to characterize the porous structure of the materials of interest, followed by applying Carniglia’s mathematical model to estimate the effective diffusivities of any gaseous species in these materials. Porosity-based method can be applied to uniform, isotropic materials (properties are the same in all directions within the material).
4.4. Records Retention and Reporting Results:
4.4.1. Records to be Maintained Records submitted to the EPA should include, but are not limited to, the following:
Figure 67. Schematic plot of the cup method (Blondeau et al., 2003).

Page 45
a. The original signed protocol and any amendments. b. Identification and characterization of the test substance as provided by Sponsor. c. Identification and characterization of the material in question d. Experiment initiation and termination dates. e. Laboratory log books (e.g., stock solution concentration calculations and solution preparation,
calibration, and QC data). f. Instrument (e.g., GC/ECNI) data files. g. Spreadsheet files for data processing. h. Environmental data acquired by the data acquisition system of the test chambers (e.g.,
temperature, air flow and inlet air moisture content). i. Chain of custody documentation, including sample storage and handling information. j. Copy of final report.
4.4.2. Final Report A final report of the results of the study should be prepared and submitted to the EPA. The final report should include, but is not limited to the following, when applicable:
a. Name and address of facility performing the study. b. Dates on which the study was initiated and completed. c. Objectives and procedures stated in the approved protocol, including any changes in the original
protocol. d. Identification and characterization of the test substance as provided by Sponsor. e. A summary and analysis of the data and a statement of the conclusions drawn from the analysis. f. A description of the transformations and calculations performed on the data. g. A description of the methods used and reference to any standard method employed. h. A description of the instrumentation utilized. i. A description of the preparation of the test solutions, the test conditions, the testing
concentrations, and the duration of the test. j. A description of sampling and analytical methods, including level of detection, level of
quantification, and references. k. A description of test specimens and test matrix. l. A description of the test results including measured values for individual chemicals of interest
for each matrix. m. A description of all circumstances that may affect the quality or integrity of the data. n. The name of the study director, the names of other scientists or professionals, and the names of
all supervisory personnel involved in the study. o. The signed and dated reports of each of the individual scientists or other professionals involved
in the study, if applicable. p. The location where the raw data and final report are to be stored. q. A statement prepared by the Quality Assurance Unit listing the types of inspections, the dates
that the study inspections were made, a description of quality assurance and quality control process, and the findings reported to the Study Director and Management.

Page 46
r. A copy of all raw data including but not limited to instrumentation output, lab notebooks, and data sheets, etc.
4.5. References:
Blondeau, P., A. Tiffonnet, A. Damian, O. Amiri and J. Molina (2003). Assessment of Contaminant
Diffusivities in Building Materials from Porosimetry Tests. Indoor Air 13(3): 310-318. Bodalal, A., Plett, E.G., Zhang, J.S., and C. Y. Shaw, C. Y. (2001). Correlations Between the Internal
Diffusion and Equilibrium Partition Coefficients of Volatile Organic Compounds (VOCs) in Building Materials and the VOC Properties. ASHRAE Transactions, 107, (Part 1):789-800.
Cox, S. S., D. Zhao and J. C. Little (2001). Measuring Partition and Diffusion Coefficients for Volatile Organic Compounds in Vinyl Flooring. Atmospheric Environment, 35(22): 3823-3830.
Deng, Q., X. Yang and J. S. Zhang (2010). New Indices to Evaluate Volatile Organic Compound Sorption Capacity of Building Materials (Rp-1321). HVAC&R Research, 16(1): 95-105.
He, Z., W. Wei and Y. Zhang (2010). Dynamic—Static Chamber Method for Simultaneous Measurement of the Diffusion and Partition Coefficients of VOCs in Barrier Layers of Building Materials. Indoor and Built Environment, 19(4): 465-475.
ISO (2001). BS EN ISO 12572: 2001, Hygrothermal Performance of Building Materials and Products. Determination of Water Vapor Transmission Properties,”
Kirchner, S., J. Badey, H. N. Knudsen, R. Meininghaus, D. Quenard, H. Sallee and A. Saarinen (1999). Sorption Capacities and Diffusion Coefficients of Indoor Surface Materials Exposed to VOCs. Proposal of New Test Procedures. Indoor Air 99.
Liu, X., Z. Guo and N. F. Roache (2014). Experimental Method Development for Estimating Solid-Phase Diffusion Coefficients and Material/Air Partition Coefficients of SVOCs. Atmospheric Environment, 89: 76-84.
Liu, X., Allen, M. R., Roache, N. F. (2016). Characterization of Organophosphorus Flame Retardants’ Sorption on Building Materials and Consumer Products. Atmospheric Environment, 140: 333-341.
Meininghaus, R., L. Gunnarsen and H. N. Knudsen (2000). Diffusion and Sorption of Volatile Organic Compounds in Building Materials-Impact on Indoor Air Quality. Environmental Science & Technology, 34(15): 3101-3108.
Meininghaus, R. and E. Uhde (2002). Diffusion Studies of VOC Mixtures in a Building Material. Indoor Air, 12(4): 215-222.
Xiong, J., Y. Zhang, W. Yan and Z. He (2009). An Improvement for Dynamic Twin Chamber Method to Measure VOC Diffusion Coefficient and Partition Coefficient. ASHRAE Transactions 115(2).
Xiong, J., W. Yan and Y. Zhang (2011). Variable Volume Loading Method: A Convenient and Rapid Method for Measuring the Initial Emittable Concentration and Partition Coefficient of Formaldehyde and Other Aldehydes in Building Materials. Environmental Science & Technology, 45(23): 10111-10116.
Xu, J., J. S. Zhang, X. Liu and Z. Gao (2012). Determination of Partition and Diffusion Coefficients of Formaldehyde in Selected Building Materials and Impact of Relative Humidity. Journal of the Air & Waste Management Association, 62(6): 671-679.
Zhao, D., J. C. Little and S. S. Cox (2004). Characterizing Polyurethane Foam as a Sink for or Source of Volatile Organic Compounds in Indoor Air. Journal of Environmental Engineering, 130(9): 983-989.

Page 47
5. Particulate Matter Formation Due to Mechanical Forces Applied to Product or Article Surfaces
5.1. Purpose:
The objective of this protocol is to determine how much particulate matter is formed due to mechanical forces (abrasion) applied to the surface of a product or article under simulated conditions designed to mimic routine use over the lifecycle of a product.
5.2. Modifications:
This protocol is general, and it is anticipated that during protocol development and finalization, additional modifications will be made to tailor the sampling parameters or analytical techniques to the specific chemical and product tested, as well as to Agency recommendations specific to particular products, chemicals, or exposure scenarios of interest.
5.3. Description:
5.3.1. Approach Particulate matter (PM), suspended or settled, plays an important role in human exposure to chemicals in the indoor environment. There are three major mechanisms by which chemicals in products or articles may transfer to particles: particle/air partitioning (sorption of vapor), particle/solid material partitioning (migration by direct contact), and particle formation due to weathering or mechanical forces, such as abrasion applied to the source (e.g., flaking and chalking). This document describes a generic protocol for testing particle formation due to abrasion. The design concept of this method is based on ISO 9073-10 (ISO, 2003), ASTM G195-13a (ASTM, 2013) and Morgeneyer et al. (2015). The abrasion test is conducted using a rotary platform abraser placed in a flow-through test chamber. Particle concentration in the chamber is monitored continuously using a particle counter capable of measuring particles in the range of 0.3 to 25 µm in diameter. The test results are used to calculate the particle generation rate and abrasion index. In addition, large particles and debris that fall to the floor from the abraser are collected with a micro-vacuum dust sampler. The mass of collected dust is quantified for two size fractions: fine dust (diameter ≤ 50 µm) and coarse dust (diameter > 50 µm).
5.3.2. Test Facility and Apparatus
The test facility, as shown in Figure 18, is based on the principles described in ISO 9073-10 (ISO, 2004) and Morgeneyer et al. (2015) with modifications. It consists of the rotary platform abraser, test chamber system, and particle counter.

Page 48
Figure 78. Schematic of the test facility for particle generation due to abrasion.
Abrasion Apparatus Many standard abrasion test methods are available. In this generic protocol, the rotary platform abrasion method described in ASTM G195 (ASTM, 2013), also known as the Taber abrasion method, is chosen because it can be applied to a wide range of products/articles. There are over 100 standard methods for Taber abrasion tests alone. Selection of a proper method depends on the type of material to be tested although the basic principles are the same.
Test Chamber The test chamber is an air-tight enclosure with air flow, temperature, and humidity controls. It is used to house the abrasion apparatus and provide a well-mixed air space from which air samples can be drawn for particle counting. Typical operating conditions of the chamber are 0.5 to 1 air change per hour, 23 to 25 °C, 50% relative humidity, and approximately 0.1 m/s air speed. Although several types of enclosures can serve as the test chamber for testing particle generation, large stainless steel chambers (ASTM D6670) are preferred as they can meet all the aforementioned requirements. A chamber with a volume of roughly 10 m3 is ideal.
Particle Counters Particle counters are used to determine the number concentration and size distribution of airborne particles. In this protocol, the particle counter should have at least 8 size bins (channels) that must cover the range of aerodynamic diameters from 0.3 to 25 μm. If a single particle counter cannot cover this range, two particle counters with different size ranges can be used. Furthermore, the particle counter should have a sampling frequency of at least once per minute.
Micro Vacuum Dust Sampler The floor dust sampler is used to collect large particles and debris from the chamber floor generated by abrasion. It should meet the specifications of either ASTM 5438 (ASTM, 2011) or ASTM 7144 (ASTM, 2016).

Page 49
Other Equipment and Devices A micro balance with a readability of 0.1 mg or better is needed for weighing the dust samples collected by the micro vacuum dust sampler. A stainless steel mesh sieve with a diameter of 8 in. (20.3 cm) and U.S. mesh size 270 is needed for dividing the dust into fine and coarse fractions.
5.3.3. Preparations
Preparation of the Test Articles The test article should have a flat surface and be clean. Typical article size is 100 mm × 100 mm square with a 6.5 mm hole at the center. Flexible materials are typically cut into 100 mm-diameter disk with a 6.5 mm hole at the center. The thickness of the test specimens should be no greater than 6.35 mm. A mounting card may be needed for certain flexible specimens that may wrinkle or shift during testing. For each material to be tested, a minimum of five disks should be prepared.
To determine the background emissions of particles due to the operation of the abraser without test articles, polished stainless steel disks should be prepared according to the dimensions mentioned above.
Preparation of the Test Chamber Before testing, the chamber floor, ceiling and walls should be cleaned with a vacuum cleaner equipped with a HEPA filter and then wiped cleaned with wet cloth.
Preparation of the Abrading Wheel Many types of abrasive wheels are commercially available. To standardize the test condition and maximize the comparability of the test results, Taber abrading wheel type CS-10W (http://www.taberindustries.com/taber-abrading-wheels) or equivalent should be used. This type of wheel provides mild to medium abrading action depending on the abrading wheel loading.
Abrading Wheel Loading Selection of abrading wheel loading in conventional abrasion tests is aimed to permit a minimum number of abrasion cycles (e.g., 150). A mass of 500 or 1000 g per wheel is recommended for durable materials and 250 or 500 g per wheel for less durable materials. Because this protocol requires longer abrasion durations (at least 30 min) for particle sampling purposes, an abrading wheel loading of 250 g per wheel is recommended for all materials. Tests should use the same type of abrading wheel and wheel loading to allow for direct comparison of test results.
Suction System Commercially available rotary platform abraders are equipped with a vacuum suction system for removing debris and abrading particles during testing. The exhaust of this suction system should be pointed at the center of the chamber at a roughly 45⁰ angle of elevation to allow the particles to disperse in the chamber.
5.3.4. Generic Test Procedure
Background Tests Operating the abraser itself may generate a small amount of particles from the motor (Morgeneyer et al., 2015). This background test allows characterization of the background particle emissions. The test results are used to calculate the background particle generation rate, which will be excluded from the test results for the test article. The test procedure is as follows.

Page 50
a. Set chamber temperature at 25⁰ C, relative humidity at 50%, and ventilation rate at 0.5 air change per hour. Turn on the mixing fan. Allow the chamber conditions to stabilize.
b. Turn on the particle counter. c. Continue to monitor the particle concentrations in the chamber for 1 hour. The particle
concentrations measured represent the chamber background without the operation of the abraser.
d. Mount the CS-10F abrasive wheels; select the abrading wheel loading (250 g); set the turntable speed at 60 rpm.
e. Mount the polished stainless steel disk on the turntable. f. Secure test specimen according to ASTM G195-13a, Sections 11.3.1 and 11.3.2 (ASTM, 2013). g. Turn on the abraser and run the test for 1 hour. The particle concentrations measured represent
the chamber background with the operation of the abraser. h. Turn off the abraser; record abrasion test stop time. i. Continue to monitor the particle concentrations in the chamber for at least 30 more min. j. Turn off the particle counter; record the test finish time.
Sample Abrasion Test The procedure for testing material samples is the same as that for the background test except that the polished stainless steel disks are replaced by the test article disk. If the sample abrasion is conducted immediately after the background test, there is no need to determine the chamber background without an operating rotary platform abraser. Note that, for articles with different materials on each side (e.g. wood panel with one side laminated), the side exposed to air and thus, the consumer, in the product/article should be tested.
Floor Dust Collection This step is needed only if the abrasion test generates large particles and debris that fall on the chamber floor.
a. Open the chamber door after sample abrasion test is complete. b. Use the micro vacuum dust sampler to collect dust and debris from chamber floor according to
ASTM 5438 (ASTM, 2011) or ASTM 7144 (ASTM, 2016). c. After dust collection, divide the dust collected from the bag into two fractions with the No. 270
sieve. d. Transfer each of the two fractions into a pre-weighed weigh boat to determine the dust weight.
5.3.5. Calculations
Aerosol Particle Generation Rate Use the first hour data to calculate the aerosol particle generation rate. Equation 5-1 is applicable to the particle generation rate for both background and abrasion tests.
𝐺𝐺𝑖𝑖 = 𝑁𝑁𝑜𝑜𝑜𝑜𝑜𝑜𝑖𝑖 + 𝑁𝑁𝑜𝑜
𝑖𝑖+ 𝑁𝑁𝑑𝑑𝑖𝑖
𝑑𝑑 (5-1)
where 𝐺𝐺𝑖𝑖 = particle generation rate for the ith size bin (particles/h)
𝑁𝑁𝑡𝑡𝑜𝑜𝑑𝑑𝑖𝑖 = number of particles in the ith size bin that leaves the chamber, calculated from Equation 5-2

Page 51
𝑁𝑁𝑑𝑑𝑖𝑖 = number of particles in the ith size bin remaining in the chamber by the end of test duration, calculated from Equation 5-3
𝑁𝑁𝑑𝑑𝑖𝑖 = number of particles in the ith size bin deposited onto chamber walls during the test duration, calculated from Equation 5-4
t = test duration, in hours 𝑁𝑁𝑡𝑡𝑜𝑜𝑑𝑑𝑖𝑖 = 𝑄𝑄 𝑐𝑐𝑖𝑖 𝑡𝑡 (5-2) 𝑁𝑁𝑑𝑑𝑖𝑖 = 𝑉𝑉 𝑐𝑐𝑑𝑑𝑖𝑖 (5-3) 𝑁𝑁𝑑𝑑𝑖𝑖 = 𝑉𝑉 𝑘𝑘𝑑𝑑𝑖𝑖 𝑐𝑐𝑖𝑖 𝑡𝑡 (5-4) where Q = ventilation flow rate of the chamber (m3/h)
𝑐𝑐𝑖𝑖 = average particle number concentration in the ith size bin during the test duration while the abraser is on (particles/m3)
V = chamber volume (m3) 𝑐𝑐𝑑𝑑𝑖𝑖 = particle number concentration in the ith size bin at the end of test duration while the
abraser is on (particles/m3) 𝑘𝑘𝑑𝑑𝑖𝑖 = first-order deposition rate constant for particles in the ith size bin (h-1) Note that the first-order deposition rate constants are size dependent. They can be determined by the experimental data (see the Appendix 5-A). If they cannot be determined experimentally (e.g., the particle counts are too close to the chamber background levels), use 𝑘𝑘𝑑𝑑𝑖𝑖 = 0.6 (h-1) for all size bins.
Particle Generation Rate due to Abrasion of Test Specimen The particle generation rate due to abrasion of test specimen is calculated from Equation 5-5:
𝐺𝐺𝐴𝐴𝑖𝑖 = 𝐺𝐺𝑆𝑆𝑖𝑖 − 𝐺𝐺𝐵𝐵𝑖𝑖 (5-5) Where 𝐺𝐺𝐴𝐴𝑖𝑖 = particle generation rate for the ith size bin due to abrasion (particles/h)
𝐺𝐺𝑆𝑆𝑖𝑖 = particle generation rate for the ith size bin determined by abrasion test and Equation 5-1 (particles/h)
𝐺𝐺𝐵𝐵𝑖𝑖 = particle generation rate for the ith size bin determined by background test and Equation 5-1 (particles/h)
Abrasion Index The abrasion index is defined by Equation 9, which is similar to the coefficient of linting as defined in BS EN ISO 9073-10 (ISO, 2003).
𝐼𝐼𝐴𝐴 𝑖𝑖 = log (𝐺𝐺𝐴𝐴𝑖𝑖 ) (5-6)

Page 52
Where 𝐼𝐼𝐴𝐴 𝑖𝑖 = abrasion index for particles in the ith size bin.
5.3.6. Replicate Tests For a given material, five tests should be conducted with five separate disks. The test results (i.e., particle generation rate and abrasion index) should be reported as mean ± standard deviation.
5.3.7. Safety Issue It is highly recommended the abrasion apparatus be operated remotely outside the test chamber. If the operator should be inside the chamber during the test, a safety and health plan should be developed and implemented.
5.4. Records Retention and Reporting Results:
5.4.1. Records to be Maintained Records submitted to the EPA should include, but are not limited to, the following:
a. The original signed protocol and any amendments. b. Identification and characterization of the test substance as provided by Sponsor. c. Identification and characterization of the material in question d. Experiment initiation and termination dates. e. Laboratory log books (e.g., stock solution concentration calculations and solution preparation,
calibration, and QC data). f. Instrument (e.g., GC/ECNI) data files. g. Spreadsheet files for data processing. h. Environmental data acquired by the data acquisition system of the test chambers (e.g.,
temperature, air flow and inlet air moisture content). i. Chain of custody documentation, including sample storage and handling information. j. Copy of final report.
5.4.2 Final Report A final report should be prepared, and records should be retained in accordance with 40 CFR 792, Subpart J – Records and Reports. For example, the following key information should be included in the report:
a. Test material: material name, intended use, uniformity (homogeneous, layered, spray application, coating, etc.), and dimensions of test specimens. If the two sides of the material are different, indicate which side is tested.
b. Abrasion apparatus: abrader brand and model number, abrading type (abrasive characteristics of the wheel), and operating parameters.
c. Test chamber: chamber brand and model number, volume, dimensions, and interior surface material.
d. Environmental conditions: chamber air flow rate, temperature, relative humidity, and air speed expressed in arithmetic mean and standard deviation.

Page 53
e. Particle counters: particle counter type, brand, and model number. f. Test procedure: description or citation, including deviation from standard procedure. g. Test results: particle counts vs time for each size bin and sampling air flow; gravimetric data for
fine and coarse fractions of dust and debris. h. Calculated results: particle-size specific generation rates (from Equation 8) and abrasion indices
(from Equation 9) for individual tests plus mean and standard deviation for replicate tests.
5.5. References:
ASTM 6670-01 (2007) Standard Practice for Full-Scale Chamber Determination of Volatile Organic Emissions from Indoor Materials/Products, available at http://www.astm.org/Standards/D6670.htm
ASTM D5438 - 11 (2011) Standard Practice for Collection of Floor Dust for Chemical Analysis. https://www.astm.org/Standards/D5438.htm
ASTM (2013). G195 - 13a Standard Guide for Conducting Wear Tests Using a Rotary Platform Abraser ASTM (2016). D7144–05 — Standard Practice for Collection of Surface Dust by Micro-vacuum Sampling
for Subsequent Metals Determination. https://www.astm.org/Standards/D7144.htm ISO (2003).BS EN ISO 9073-10. Lint and other particles generation in the dry state. Available at
http://shop.bsigroup.com/ProductDetail/?pid=000000000030099719 Morgeneyer, M., Shandilya, N., Chen, Y.M., Bihan, O.L. (2015). Use of a Modified Taber Abrasion
Apparatus for Investigating the Complete Stress State during Abrasion and in-process Wear Particle Aerosol Generation, Chemical Engineering Research and Design, 93:251–256.

Page 54
Appendix 5A. Estimation of the First-Order Deposition Rate Constant using Experimental Data If the particle generation rate due to abrasion is roughly constant, the measured particle number concentration profile is expected to resemble that in Figure 19.
Figure 19. Expected particle count profile during an abrasion test. The data collected after the abraser stops is used to estimate the deposition rate constant.
Using the decay data (i.e., the data between 1 and 1.5 elapsed hours in Figure 19), the first-order deposition rate constant can be estimated as follows:
i. Plot the number concentration decay data on a semi-log scale (Figure 20). j. Calculate the slope of the line from the plot k. Calculate the first-order deposition rate constant from Equation 5A-1.
𝑘𝑘𝑑𝑑𝑖𝑖 = �𝑆𝑆𝑖𝑖� − 𝑁𝑁𝑣𝑣 (5A-1) Where 𝑘𝑘𝑑𝑑𝑖𝑖 = the first-order deposition rate constant for the ith size bin (h-1)
�𝑆𝑆𝑖𝑖� = absolute value of the slope obtained from the the plot (h-1) 𝑁𝑁𝑣𝑣 = chamber ventilation rate (h-1).

Page 55
Figure 20. Semi-log plot for particle count versus time during the decay phase (i.e., flushing the chamber).
100
1000
1 1.1 1.2 1.3 1.4 1.5
Part
icle
Cou
nt
Elapsed Time (h)

Page 56
6. Direct Transfer of Chemicals from Source to Settled Dust
6.1. Purpose:
The objective of this protocol is to characterize the rate of chemical migration from a product or article to settled dust that is in direct contact with product or article, and to semi-quantitatively or qualitatively determine if gas-phase transfer plays a role in chemical transfer from consumer articles to settled dust.
6.2. Modifications:
This protocol is general, and it is anticipated that during protocol development and finalization, additional modifications will be made to tailor the sampling parameters or analytical techniques to the specific chemical and product tested, as well as to Agency recommendations specific to particular products, chemicals, or exposure scenarios of interest.
6.3. Description:
Tests should be conducted in standard environmental chambers where indoor conditions (temperature, humidity, etc.) can be simulated in a controlled manner. Similar tests involving chemical transfer to house dust particles have been conducted in FLEC (Jeon et al., 2016; Clausen et al., 2004), micro chambers (Liagkouridis et al. 2017), small chambers (Clausen et al., 2004), and large chambers (Liu et al., 2016). Small or mid-sized chambers are recommended for this protocol because of their availability, cost-effectiveness, and ease of cleaning.
The general steps of the protocol for a mid-sized or large chamber are as follows:
a) Cut panels from the consumer article (article panel) to be tested. b) Prepare stainless steel plates or aluminum foil sheets which will be used to determine
whether vapor phase transfer plays a role in migration of the chemical of interest from source to settled dust.
c) Apply National Institute of Standards and Technology (NIST) Standard house dust, free of chemical of interest, evenly to the surface of each article panel or stainless steel plate.
d) Conduct tests at four dust loading levels to investigate the effect of dust loading on transfer rate.
e) Place the dust laden article panels and stainless steel plates or aluminum foil sheets into the environmental chambers for the aging test under typical indoor environmental conditions.
f) Place polyurethane foam (PUF) passive air samplers inside the chamber to collect integrated air samples for vapor-phase chemicals of interest.
g) Remove the dust laden article panels and stainless steel plates or aluminum foil sheets from the chambers at different elapsed times over the sampling period as specified by the experimental schedule (Table 6).
h) Collect dust samples from the article panels and stainless steel plates or aluminum foil sheets, extract and analyze dust samples for chemicals of interest.
i) Collect PUF air samples, extract and analyze for chemicals of interest. Note, the air sampling portions of this protocol may be waived if the measured vapor pressure of the chemical of interest is shown to be below the method detection limit.
Four tests should be conducted for each article according to Table 6.

Page 57
Table 6. Example Experimental Schedule.
Test ID Dust loading (g/m2) Dust panel type Number of
panelsa Panel removal schedule
(elapsed days)
1 40 Article panel 12 1, 5, 10, 15, 20, 30
Stainless steel plate 6 3, 15, 30
2 10 Article panel 12 1, 5, 10, 15, 20, 30
Stainless steel plate 6 3, 15, 30
3 20 Article panel 12 1, 5, 10, 15, 20, 30
Stainless steel plate 6 3, 15, 30
4 60 Article panel 12 1, 5, 10, 15, 20, 30
Stainless steel plate 6 3, 15, 30
a: the number of panels is related to the size of the chamber and can vary
6.3.1. Materials and Equipment The following procedure should be followed for preparing test specimens for consumer articles containing the chemical of interest:
a) For the test results to be meaningful, the initial concentration of the chemical of interest in the article should be reported (for example, see Protocol 1: Source Characterization.)
b) Cut the test specimens into 22 cm by 20 cm or other appropriately sized panels. The bottom of the test chamber should be able to accommodate at least two panels.
c) The thickness of the article panel depends on the article type and should be easy to handle. In general, a thickness of 5 mm is adequate for most articles except fabrics and other thin materials, which should be tested with their original thicknesses. Foam articles can be thicker.
d) Clean the article panels on all exposed sides with a hand-held vacuum cleaner to remove debris and particles formed during the cutting process, minimizing interference with test results.
e) Prepare a total of 14 Article panels, including 2 as back-ups, for each test. Wrap the prepared article panels in two layers of aluminum foil and store at room temperature.
NIST house dust standard reference material SRM 2585 (NIST house dust), free of target compounds, is recommended for this test method (NIST, 2014). The key properties of the dust that should be reported include:
• Dust density, • Organic carbon (OC) content, and • Aerodynamic particle size distribution (e.g., geometric mean and geometric standard
deviation). The standard dust should be extracted and analyzed for background chemical of interest contents prior to product testing, according to the best analytical methods available.
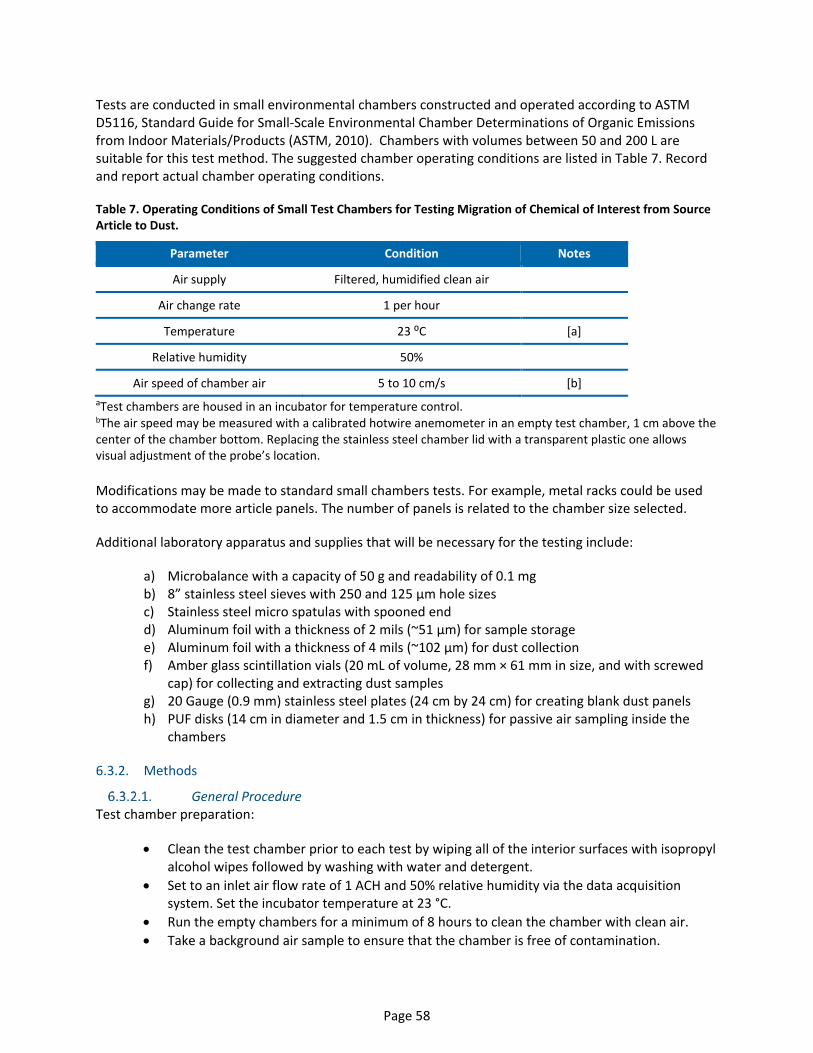
Page 58
Tests are conducted in small environmental chambers constructed and operated according to ASTM D5116, Standard Guide for Small-Scale Environmental Chamber Determinations of Organic Emissions from Indoor Materials/Products (ASTM, 2010). Chambers with volumes between 50 and 200 L are suitable for this test method. The suggested chamber operating conditions are listed in Table 7. Record and report actual chamber operating conditions.
Table 7. Operating Conditions of Small Test Chambers for Testing Migration of Chemical of Interest from Source Article to Dust.
Parameter Condition Notes
Air supply Filtered, humidified clean air
Air change rate 1 per hour
Temperature 23 ⁰C [a]
Relative humidity 50%
Air speed of chamber air 5 to 10 cm/s [b] aTest chambers are housed in an incubator for temperature control. bThe air speed may be measured with a calibrated hotwire anemometer in an empty test chamber, 1 cm above the center of the chamber bottom. Replacing the stainless steel chamber lid with a transparent plastic one allows visual adjustment of the probe’s location. Modifications may be made to standard small chambers tests. For example, metal racks could be used to accommodate more article panels. The number of panels is related to the chamber size selected.
Additional laboratory apparatus and supplies that will be necessary for the testing include:
a) Microbalance with a capacity of 50 g and readability of 0.1 mg b) 8” stainless steel sieves with 250 and 125 µm hole sizes c) Stainless steel micro spatulas with spooned end d) Aluminum foil with a thickness of 2 mils (~51 µm) for sample storage e) Aluminum foil with a thickness of 4 mils (~102 µm) for dust collection f) Amber glass scintillation vials (20 mL of volume, 28 mm × 61 mm in size, and with screwed
cap) for collecting and extracting dust samples g) 20 Gauge (0.9 mm) stainless steel plates (24 cm by 24 cm) for creating blank dust panels h) PUF disks (14 cm in diameter and 1.5 cm in thickness) for passive air sampling inside the
chambers
6.3.2. Methods
General Procedure Test chamber preparation:
• Clean the test chamber prior to each test by wiping all of the interior surfaces with isopropyl alcohol wipes followed by washing with water and detergent.
• Set to an inlet air flow rate of 1 ACH and 50% relative humidity via the data acquisition system. Set the incubator temperature at 23 °C.
• Run the empty chambers for a minimum of 8 hours to clean the chamber with clean air. • Take a background air sample to ensure that the chamber is free of contamination.
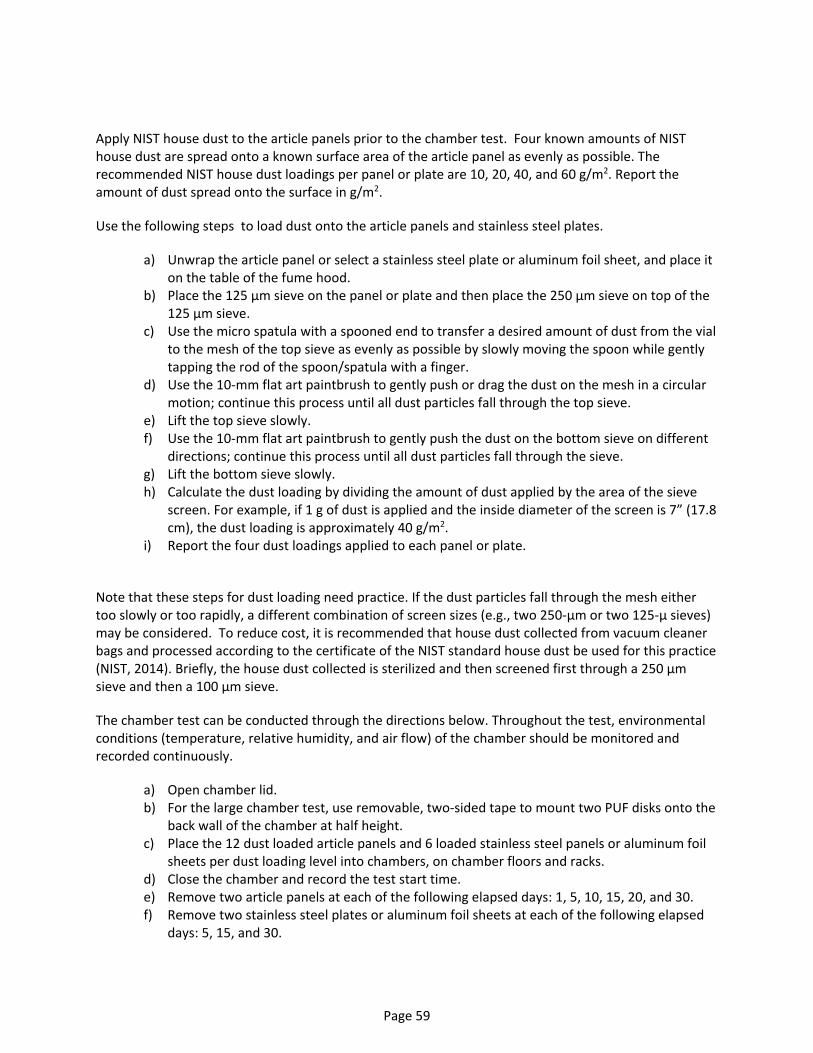
Page 59
Apply NIST house dust to the article panels prior to the chamber test. Four known amounts of NIST house dust are spread onto a known surface area of the article panel as evenly as possible. The recommended NIST house dust loadings per panel or plate are 10, 20, 40, and 60 g/m2. Report the amount of dust spread onto the surface in g/m2.
Use the following steps to load dust onto the article panels and stainless steel plates.
a) Unwrap the article panel or select a stainless steel plate or aluminum foil sheet, and place it on the table of the fume hood.
b) Place the 125 µm sieve on the panel or plate and then place the 250 µm sieve on top of the 125 µm sieve.
c) Use the micro spatula with a spooned end to transfer a desired amount of dust from the vial to the mesh of the top sieve as evenly as possible by slowly moving the spoon while gently tapping the rod of the spoon/spatula with a finger.
d) Use the 10-mm flat art paintbrush to gently push or drag the dust on the mesh in a circular motion; continue this process until all dust particles fall through the top sieve.
e) Lift the top sieve slowly. f) Use the 10-mm flat art paintbrush to gently push the dust on the bottom sieve on different
directions; continue this process until all dust particles fall through the sieve. g) Lift the bottom sieve slowly. h) Calculate the dust loading by dividing the amount of dust applied by the area of the sieve
screen. For example, if 1 g of dust is applied and the inside diameter of the screen is 7” (17.8 cm), the dust loading is approximately 40 g/m2.
i) Report the four dust loadings applied to each panel or plate.
Note that these steps for dust loading need practice. If the dust particles fall through the mesh either too slowly or too rapidly, a different combination of screen sizes (e.g., two 250-µm or two 125-µ sieves) may be considered. To reduce cost, it is recommended that house dust collected from vacuum cleaner bags and processed according to the certificate of the NIST standard house dust be used for this practice (NIST, 2014). Briefly, the house dust collected is sterilized and then screened first through a 250 µm sieve and then a 100 µm sieve.
The chamber test can be conducted through the directions below. Throughout the test, environmental conditions (temperature, relative humidity, and air flow) of the chamber should be monitored and recorded continuously.
a) Open chamber lid. b) For the large chamber test, use removable, two-sided tape to mount two PUF disks onto the
back wall of the chamber at half height. c) Place the 12 dust loaded article panels and 6 loaded stainless steel panels or aluminum foil
sheets per dust loading level into chambers, on chamber floors and racks. d) Close the chamber and record the test start time. e) Remove two article panels at each of the following elapsed days: 1, 5, 10, 15, 20, and 30. f) Remove two stainless steel plates or aluminum foil sheets at each of the following elapsed
days: 5, 15, and 30.
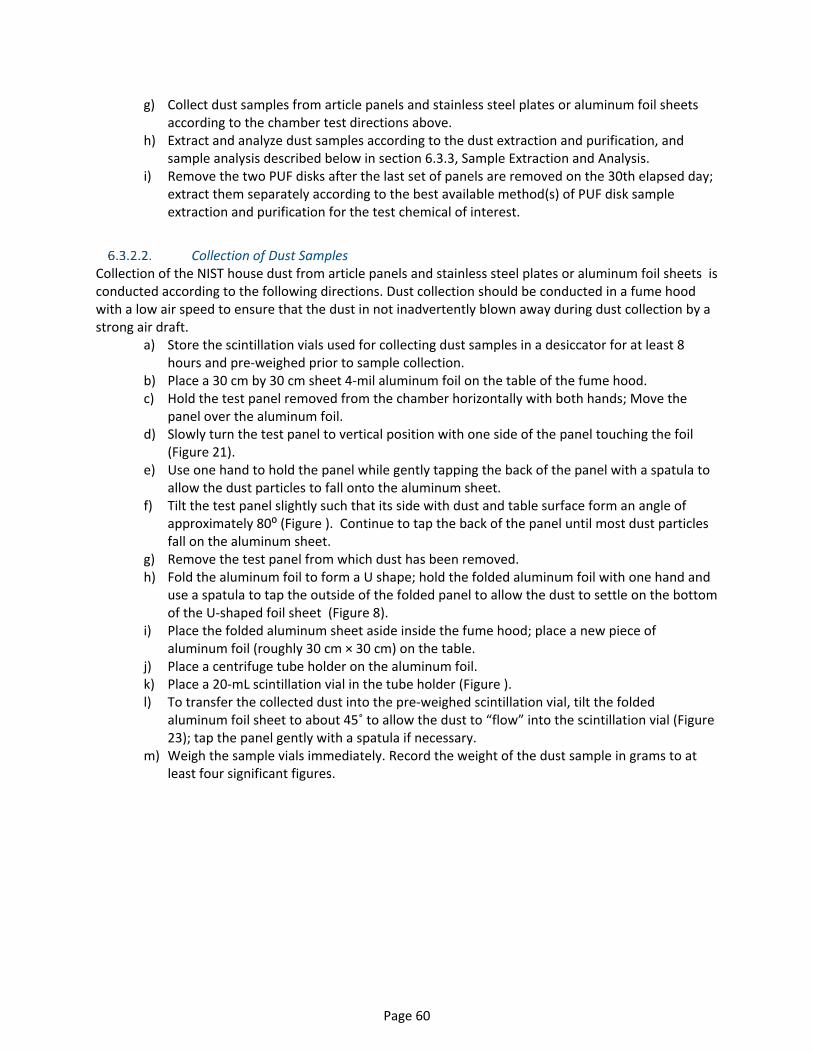
Page 60
g) Collect dust samples from article panels and stainless steel plates or aluminum foil sheets according to the chamber test directions above.
h) Extract and analyze dust samples according to the dust extraction and purification, and sample analysis described below in section 6.3.3, Sample Extraction and Analysis.
i) Remove the two PUF disks after the last set of panels are removed on the 30th elapsed day; extract them separately according to the best available method(s) of PUF disk sample extraction and purification for the test chemical of interest.
Collection of Dust Samples Collection of the NIST house dust from article panels and stainless steel plates or aluminum foil sheets is conducted according to the following directions. Dust collection should be conducted in a fume hood with a low air speed to ensure that the dust in not inadvertently blown away during dust collection by a strong air draft.
a) Store the scintillation vials used for collecting dust samples in a desiccator for at least 8 hours and pre-weighed prior to sample collection.
b) Place a 30 cm by 30 cm sheet 4-mil aluminum foil on the table of the fume hood. c) Hold the test panel removed from the chamber horizontally with both hands; Move the
panel over the aluminum foil. d) Slowly turn the test panel to vertical position with one side of the panel touching the foil
(Figure 21). e) Use one hand to hold the panel while gently tapping the back of the panel with a spatula to
allow the dust particles to fall onto the aluminum sheet. f) Tilt the test panel slightly such that its side with dust and table surface form an angle of
approximately 80⁰ (Figure ). Continue to tap the back of the panel until most dust particles fall on the aluminum sheet.
g) Remove the test panel from which dust has been removed. h) Fold the aluminum foil to form a U shape; hold the folded aluminum foil with one hand and
use a spatula to tap the outside of the folded panel to allow the dust to settle on the bottom of the U-shaped foil sheet (Figure 8).
i) Place the folded aluminum sheet aside inside the fume hood; place a new piece of aluminum foil (roughly 30 cm × 30 cm) on the table.
j) Place a centrifuge tube holder on the aluminum foil. k) Place a 20-mL scintillation vial in the tube holder (Figure ). l) To transfer the collected dust into the pre-weighed scintillation vial, tilt the folded
aluminum foil sheet to about 45˚ to allow the dust to “flow” into the scintillation vial (Figure 23); tap the panel gently with a spatula if necessary.
m) Weigh the sample vials immediately. Record the weight of the dust sample in grams to at least four significant figures.

Page 61
Figure 21. Collecting dust from test panels by placing the panel on the 4-mil-thick aluminum foil vertically (left) and then tilt it further towards the dust-laden side to form an approximately 80⁰ angle with the aluminum foil. Use the spatula rod to tap the back of the panel in both positions.
Figure 82. The dust particles form a line after the aluminum sheet is folded into the U shape. The unfolded panel shown in this picture is a thin aluminum plate instead of 4-mil aluminum foil.
Figure 23. Dust sample is transferred from folded aluminum sheet to the scintillation vial.
Page 62
Note that it is not required to collect 100% of the dust from the test panels because the chemical content in the dust is determined on a weight per weight basis (e.g., µg chemical/g dust). Dust collection efficiency should be in the range of at least 50% of dust transferred to scintillation vial.
6.3.3. Sample Extraction and Analysis
See Section 3.3.7 Sample Extraction and Analysis under Protocol 3.
6.4. Records Retention and Reporting Results:
6.4.1. Records to be Maintained Records submitted to the EPA should include, but are not limited to, the following:
a. The original signed protocol and any amendments. b. Identification and characterization of the test substance as provided by Sponsor. c. Identification and characterization of the material in question d. Experiment initiation and termination dates. e. Laboratory log books (e.g., stock solution concentration calculations and solution preparation,
calibration, and QC data). f. Instrument (e.g., GC/ECNI) data files. g. Spreadsheet files for data processing. h. Environmental data acquired by the data acquisition system of the test chambers (e.g.,
temperature, air flow and inlet air moisture content). i. Chain of custody documentation, including sample storage and handling information. j. Copy of final report.
6.4.2. Final Report A final report should be prepared, and records should be retained in accordance with 40 CFR 792, Subpart J – Records and Reports.
The standard test methods mentioned above contain sections for reporting. For example, key information to be reported includes:
a. Test material: material name, intended use, uniformity (homogeneous, layered, spray application, coating, etc.), dimensions of test specimens, exposed area, treatment of sample edges (sealed or exposed) and information about sample creation, transport, and storage (See Contextualizing Information for Product Use).
b. Target chemical(s) and their basic properties: CAS number, molecular formula, vapor pressure, chemical reactivity, concentration in material, etc. (See Contextualizing Information for Product Use).
c. Test chamber: chamber type, model name, volume, dimensions, and interior surface material. d. Test procedure: description or citation, including deviation from standard procedure. e. Sampling methods for air and dust samples and analytical methods ― description or citation,
including deviation from standard procedure. Description of accuracy and precision

Page 63
f. Analytical methods: description or citation, including deviation from standard procedure. g. Environmental conditions: chamber temperature (expressed in arithmetic mean and standard
deviation) and moisture content in cooling air. h. Test results: chromatograms of air and dust samples, identification of peaks, time-averaged
concentrations in chamber air from static air sampler and dust samples. i. QA/QC data: accuracy and precision of measurements, calibrations, daily calibration checks,
background samples, blank samples.
6.5. References:
ASTM. (2010). D5116-10 — Standard Guide for Small-scale Environmental Chamber Determinations of
Organic Emissions from Indoor Materials/Products. http://www.astm.org/Standards/D5116.htm. Clausen, P; Hansen, V; Gunnarsen, L; Afshari, A; Wolkoff, P. (2004). Emission of Di-2-ethylhexyl phthalate
from PVC Flooring into Air and Uptake in Dust: Emission and Sorption Experiments in FLEC and CLIMPAQ. Environmental Science & Technology, 38: 2531-2537. http://www.ncbi.nlm.nih.gov/pubmed/15180047.
Jeon, S; Kim, KT; Choi, K. (2016). Migration of DEHP and DINP into Dust from PVC Flooring Products at Different Surface Temperature. The Science of the Total Environment, 547: 441-446. http://www.ncbi.nlm.nih.gov/pubmed/26824397.
Liagkouridis, I., Lazarov, B., Giovanoulis, G., & Cousins, I. T. (2017). Mass transfer of an organophosphate flame retardant between product source and dust in direct contact. Emerging Contaminants. http://www.sciencedirect.com/science/article/pii/S2405665017300173
Liu, X; Guo, Z; Krebs, KA; Greenwell, DJ; Roache, NF; Stinson, RA; Nardin, JA; Pope, RH. (2016). Laboratory Study of PCB Transport from Primary Sources to Settled Dust. Chemosphere, 149: 62-69. http://www.ncbi.nlm.nih.gov/pubmed/26849196.
NIST (2014). Certificate of Analysis — Standard Reference Material #2585 (pp. 1-13). (SRM 2585). Gaithersburg, MD: National Institute of Standards & Technology. https://www-s.nist.gov/srmors/certificates/2585.pdf?CFID=43597555&CFTOKEN=bd713ff0f9f0b105-7D32F184-0FD5-F338-8C2F0D7ECCA435D2.

Page 64 of 104
7. Photolysis under Simulated Indoor Lighting Conditions
7.1. Purpose:
The objective of this protocol is to determine whether a chemical in a product or article is subject to photolytic degradation under simulated indoor lighting conditions and what the major degradation products are. If the chemical was found in appreciable concentrations in house dust from Protocol 6, then this protocol should be followed.
7.2. Modifications:
This protocol is general, and it is anticipated that during protocol development and finalization, additional modifications will be made to tailor the sampling parameters or analytical techniques to the specific chemical and product tested, as well as to Agency recommendations specific to particular products, chemicals, or exposure scenarios of interest
7.3. Description:
7.3.1. Approach Photolysis, or photolytic degradation, is a chemical reaction by which the compound is broken down by light (photons). This process is relevant to indoor environmental quality and human exposure due to the potential formation of hazardous photo-degradation products. Chemicals are more frequently tested for photolysis under natural sunlight, leading to uncertainties in the extent and rate of indoor photolysis reactions, particularly for chemicals contained in consumer articles and products.
In this protocol, a generic method is described to test the indoor photolysis potential of a chemical contained within a consumer article or product. Test material is exposed to simulated sunlight, through windows, in an accelerated weathering chamber. Potential photolysis products are detected from air (by static air sampling), the surface of the test specimens (by wipe sampling), and settled dust (by dust sampling).
7.3.2. Facility and Apparatus
Test Chamber Photolysis tests are conducted in an accelerated weathering chamber, which includes an ultraviolet (UV) irradiation source and temperature and humidity controls. Two types of weathering chambers are commercially available (ASTM G154 and ASTM G155). Those that conform to ASTM G155 are recommended for this protocol.
To simulate indoor lighting conditions, the system should have optical filters that generate sunlight through window glass. This protocol has been developed for chamber systems conforming to ASTM D 4459-06 (Standard Practice for Xenon-Arc Exposure of Plastics Intended for Indoor Applications), which provides spectral irradiance of approximately 0.3 (W/m2/nm) at 340 nm when operated in the continuous light-on mode without water spray. This light source satisfies the light intensity requirement of 5 W/m2 over the test specimens. For testing settled dust, the chamber model should allow the panels to be placed on a horizontal (or nearly horizontal) tray.
Page 65
Note that the standard methods for accelerated aging tests under UV irradiation are intended to measure changes in physical properties. To detect photolysis products, this test procedure requires several modifications and additional steps, as described below.
Passive Air Sampler Passive air samplers may be used to capture chemical vapors emitted from test specimens during accelerated weathering. This method determines time-averaged concentrations by using polyurethane foam (PUF) disks as the sampling media (Harrad & Abdallah, 2008). The PUF sampler is mounted onto the chamber wall prior to a weathering test. The PUF sampler is removed from the chamber upon test completion, is chemically extracted with solvents, and analyzed for potential photolysis products. The analytical procedure should be optimized to the properties of the target chemicals.
7.3.3. Test Specimens The product or article to be tested is cut into panels. Panel size may differ depending on the selected chamber, but panel length and width should be uniform across all products or articles for a given chamber. In general, it is recommended that panels for wipe sampling be at least 100 cm2 in size and those for testing settled dust at least 500 cm2. For a given product or article, 12 panels are needed for wipe sampling and 12 panels for testing settled dust.
7.3.4. Wipe Sampling Wipe samples are collected to determine if photolysis products are present on the exposed surface of the test specimens.
Wipe Sampling on Solid Surfaces ASTM D 6661-10, Standard Practice for Field Collection of Organic Compounds from Surfaces Using Wipe Sampling, or an equivalent method, is recommended for surface sampling on solid panels. The wipe samples are subsequently extracted and analyzed for potential photolysis products.
Surface Sampling on Fabric Swatches This method is based on the California roller method (Ross et al., 1991; Fuller et al., 2001) with modifications. Use 3 in. by 6 in. heavy filter paper, instead of cotton gauze pads; place the fabric swatch on a pre-cleaned, non-porous, flat surface (such as a rigid metal plate or polished granite block); place the heptane-wetted filter paper on the fabric swatch; place a 3 in. by 6 in. stainless steel (or aluminum) plate on the paper filter; add additional weights on the plate such that the total weight is 2 pounds (lb); wait for 5 minutes; remove plate and weights; remove and extract the paper filter.
7.3.5. Dust Sampling Photolysis may be difficult to detect on product or article surfaces by wipe sampling, and tests with settled dust are recommended. Dust sampling should be conducted according to Protocol 6 (Transfer of Chemicals from Source to Settled Dust) if there is a potential for chemical transfer to dust.
House Dust or Surrogate Dust National Institute of Standards and Technology (NIST) house dust standard reference material SRM 2585 (NIST house dust), free of the chemical of interest, is recommended for this test method. The standard house dust should be extracted and analyzed for chemical of interest background concentration prior to product testing.

Page 66
The key properties of the dust to be reported include: dust density, organic carbon (OC) content, and aerodynamic particle size distribution (e.g., geometric mean and geometric standard, 10-μm mean diameter is recommended).
Dust Application Test specimens are cut into panels at least 6 in. by 6 in. (15 cm by 15 cm), for tests with settled dust. Test panels, besides fabrics, should be at least 5 mm thick. Apply an adequate amount of dust on the test panels to achieve a target dust loading between 3.0 to 4.3 mg/cm2, which is roughly equivalent to 0.7 to 0.9 g dust per panel (See Protocol 6 for dust loading protocol).
7.3.6. Dust Collection from Test Panels The procedure to collect dust samples from test panels is described in Protocol 6
7.3.7. Analytical Methods Selection of the analytical methods for air, wipe, and dust samples depends on the properties of the chemicals of interest and the type of sampling media. For example, for photolysis of decaBDE, chromatography or mass spectrometry in electron capture negative ionization mode (GC/MS-ECNI) has been used (Stapleton et al., 2008). Identification and quantification of photolysis products in the samples are sometimes challenging because of the dominance of the chemical of interest (i.e., the parent compound) in the chromatograms. This issue can be resolved by using a highly sensitive instrument and by adopting a pre-separation method, such as preparative chromatography.

Page 67
7.3.8. Procedure for Photolysis Article Test without Dust
a. Prepare 12 article panels measuring 3 in. by 6 in. (7.6 cm × 15.2 cm)
b. Collect wipe samples from 3 control article panels prior to aging and UV irradiation, to represent initial surface conditions of the test panels. Dispose of these three panels. Store wipe samples, wrapped in foil, at 4°C until ready for extraction and analytical quantification.
c. Clean the interior surfaces of the test chamber, and sample tray by washing with soap and water, wiping with toluene, and wiping with methanol.
d. Collect two wipe samples, each covering 100 cm2 of the chamber walls. Store wrapped in aluminum foil, at 4°C until ready for extraction and analytical quantification but before the expiration date.
e. Place three passive air samplers (PUF disks) on the supporting cradle at half chamber height. Sample height adjustments may be needed, depending on the chemical of interest (consider vapor density).
f. Place the remaining 9 panels on the sample tray. g. Close the chamber door, set the temperature at
35 °C and relative humidity at 30% (The moisture content is roughly equivalent to that of 50% RH at 25 °C).
h. Turn on the UV light to start the test. i. On day 4, turn off the UV light, open the chamber door, and perform the following steps:
o Remove three panels from the chamber and collect panel wipe samples. o Remove one PUF disk for determination of time-integrated air concentrations of the target chemical and potential photolysis products.
j. Close the chamber door and turn on the UV light to restart the test. k. On day 15 and day 30, repeat the steps given for day 4. l. After all panels have been removed, collect two wipe samples, each covering 100 cm2 of the
chamber walls.
Figure 24. Graphic example of generic procedure for photolysis without dust.

Page 68
7.3.9. Procedure for Photolysis Article Test with Dust a. Prepare 12 article panels measuring 6 in. by 6 in.
(15,2 cm × 15.2 cm) b. Collect wipe samples from 3 article panels prior
to aging and UV irradiation, to represent initial (control) conditions. Store wipe samples, wrapped in foil, at 4°C until ready for extraction and analytical quantification
c. Clean the interior surfaces of the test chamber, and sample tray by washing with soap and water, wiping with toluene, and wiping with methanol.
d. Collect two wipe samples, each covering 100 cm2 of the chamber walls. Store wrapped in aluminum foil, at 4°C until ready for extraction and analytical quantification.
e. Place three passive air samplers (PUF disks) on the supporting cradle at half chamber height. Sample height adjustments may be needed, depending on the chemical of interest (consider vapor density).
f. Apply test dust onto panels according to the method described in Protocol (6) Section 6.2.3.1.
g. Place the remaining 9 dust-loaded panels on the sample tray.
h. Close the chamber door, set the temperature at 55 °C.
i. Do not use water spray for humidity control because water droplets falling onto dust-loaded test specimens may complicate the interpretation of test results.
j. Turn on the UV light to start the test. k. On day 4, turn off the UV light, open the chamber door, and perform the following steps:
o Remove three panels from the chamber. o Remove one PUF disk for determination of time-integrated air concentrations of the target chemical and potential photolysis products.
l. Close the chamber door and turn on the UV light to restart the test. m. On day 15 and day 30, repeat the steps on day 4. n. After all panels have been removed, collect two wipe samples, each covering 100 cm2 of the
chamber walls.
7.3.10. General Procedure for Tests without UV-light If the test results from Sections 7.3.8 and 7.3.9 suggest the presence of photolysis products in air, surface or dust samples, it is recommended to conduct a test without the UV-light (i.e., dark cycle). This is done by following the steps in Sections 7.3.8 and 7.3.9 with the UV light switched off.
Figure 25. Graphic example of generic procedure for photolysis with dust.

Page 69
7.4. Records Retention and Reporting Results:
7.4.1. Records to be Maintained Records submitted to the EPA should include, but are not limited to, the following:
a. The original signed protocol and any amendments. b. Identification and characterization of the test substance as provided by Sponsor. c. Identification and characterization of the material in question d. Experiment initiation and termination dates. e. Laboratory log books (e.g., stock solution concentration calculations and solution
preparation, calibration, and QC data). f. Instrument (e.g., GC/ECNI) data files. g. Spreadsheet files for data processing. h. Environmental data acquired by the data acquisition system of the test chambers (e.g.,
temperature, air flow and inlet air moisture content). i. Chain of custody documentation, including sample storage and handling information. j. Copy of final report.
7.4.2. Final Report A final report should be prepared, and records should be retained in accordance with 40 CFR 792, Subpart J – Records and Reports.
The standard test methods mentioned above contain sections for reporting. For example, key information to be reported includes:
a. Test material: material name, intended use, uniformity (homogeneous, layered, spray application, coating, etc.), dimensions of test specimens, exposed area, treatment of sample edges (sealed or exposed) and information about sample creation, transport, and storage (See Contextualizing Information for Product Use).
b. Target chemical(s) and their basic properties: CAS number, molecular formula, vapor pressure, chemical reactivity, concentration in material, etc. (See Contextualizing Information for Product Use).
c. Test chamber: chamber type, model name, volume, dimensions, and interior surface material. d. Test procedure: description or citation, including deviation from standard procedure. e. Sampling methods for air, wipe, and dust samples and analytical methods ― description or
citation, including deviation from standard procedure. Description of accuracy and precision f. Analytical methods: description or citation, including deviation from standard procedure. g. Environmental conditions: lighting conditions (lamps, optical filter, light spectrum and intensity),
chamber temperature (expressed in arithmetic mean and standard deviation), and moisture content in cooling air.
h. Test results: chromatograms of air, wipe and dust samples, identification of peaks, time-averaged concentrations in chamber air from static air sampler, concentrations in wipe and dust samples.
i. QA/QC data: accuracy and precision of measurements, calibrations, daily calibration checks, background samples, blank samples.

Page 70
7.5. References:
Ashley, K., Applegate, G.T., Wise, T.J., Fernback, J.E., and Goldcamp, M.J. (2007). Evaluation of a Standardized micro-vacuum Sampling method for Collection of Surface Dust. Journal of Occupational and Environnemental Hygiene. 4: 215-223.
ASTM (2010). D6661-10 — Standard Practice for Field Collection of Organic Compounds from Surfaces Using Wipe Sampling. http://www.astm.org/Standards/D6661.htm ASTM (2012). D4459-12 — Standard Practice for Xenon-Arc Exposure of Plastics Intended for Indoor Applications. http://www.astm.org/Standards/D4459.htm ASTM (2012). G154-12a — Standard Practice for Operating Fluorescent Ultraviolet (UV) Lamp Apparatus
for Exposure of Nonmetallic Materials http://www.astm.org/search/fullsite-search.html?query=g154&
ASTM (2013). G155-13 — Standard Practice for Operating Xenon Arc Light Apparatus for Exposure of Non-Metallic Materials. http://www.astm.org/search/fullsite-search.html?query=g155&
Fuller, R., Klonne, D., Rosenheck, L., Eberhart, D., Worgan, J., and Ross, J. (2001). Modified California Roller for Measuring Transferable Residues on Treated Turfgrass, Bulletin of Environmental Contamination and Toxicology, 67: 787–794.
Harrad, S. and Abdallah, M.A. (2008). Calibration of Two Passive Air Sampler Configurations for Monitoring Concentrations of Hexabromocyclododecanes in Indoor Air. Journal of Environmental Monitoring, 10(4): 527-31.
Ross, J., Fong, H., Thongsinthusak, T., Margetich, S., and Krieger, R. (1991). Measuring Potential Dermal Transfer of Surface Pesticide Residue Generated from Indoor Fogger Use: Using the CDFA Roller Method Interim Report II. Chemosphere, 22: 975-984.
Stapleton, H.M. and Dodder, N.G. (2008). Photodegradation of Decabromodiphenyl Ether in House Dust by Natural Sunlight. Environmental Toxicology and Chemistry, 27: 306-312.

Page 71
8. Migration to Saliva (Oral Exposure)
8.1. Purpose:
The objective of this protocol is to characterize chemical migration from an article or material into simulated saliva over time.
8.2. Modifications:
This protocol is general, and it is anticipated that during protocol development and finalization, additional modifications will be made to tailor the sampling parameters or analytical techniques to the specific chemical and product tested, as well as to Agency recommendations specific to particular products, chemicals, or exposure scenarios of interest.
8.3. Description:
8.3.1. Approach The methods for measuring migration from articles into simulated saliva have been described by the European Commission Joint Research Centre (JRC) (Simoneau et al., 2001). The method was developed and validated to estimate phthalate exposure from mouthing of soft plastic articles by children. The method was validated by comparing the results with in vivo results from panels of adult volunteers who mouthed articles or samples and collected their saliva. Several other studies have also used this approach to estimate migration rates of chemicals into saliva (Bouma and Schakel 2001) (Bouma et al 2002) (Corea-Tellez et al 2008) (Earls et al 2003) (Masuck et al 2011) (Niino et al 2001) (Niino et al 2002) (Niino et al 2003) (Ozer and Gucer 2011) (Simoneau et al 2009) (TNO Nutrition and Food Research 2001) (Ionas et al 2016). The U.S. Consumer Product Safety Commission (CPSC) recently characterized exposure of phthalates, including mouthing, using migration rates measured using the head over heels (HOH) approach (Babich, 2002) (Chen, 2002) (Babich et al., 2004). The method has also been applied to characterize migration of flame retardants (Ghanem, 2015a) (Ghanem, 2015b). The HOH approach, also referred to as aggressive agitation, measures the amount of chemical that migrates from an article into simulated saliva. This migration is typically reported in µg/10 cm2/hour. Migration rates quantify the rate at which a chemical that is a part of the article itself migrates from an article over time. Additional information that characterizes the duration of the experiment and expected conditions of use, such as duration of mouthing time for the article or material, is also needed to estimate exposure.
An alternate approach that quantified ingestion of dust settled on an article or the floor measures transfer efficiency. “Hand to mouth” and “object to mouth” transfer efficiencies vary based on a number of factors. A recently published transfer efficiency database contains all publicly available transfer efficiency values and includes a discussion of methods for measuring oral saliva transfer efficiency . (Gorman NG et al. 2012). However, the migration rate of chemicals that are components of articles into saliva rather than the transfer of chemicals from the surface of an article to saliva is the focus of this protocol. However, transfer efficiency measurements could also be used to inform exposure estimates.
8.3.2. Preparation of Saliva There are various approaches to prepare artificial saliva. It is recommended that saliva is prepared at a representative temperature and pH and contain relevant enzymes and salts in concentrations likely to be present within the human mouth. The composition of the saliva as well as the testing conditions of

Page 72
the saliva within the HOH testing apparatus should be transparent and well documented. An in vitro model was developed to estimate extraction via saliva (Brandon et al 2006). That paper references a composition of saliva from Versantvoort et al (2005), which is presented below. Another recent paper (Marques et al 2011), provides five different approaches to simulate saliva. Ionas et al 2016 is the most recent paper to present an approach to developing simulated saliva.
Versantvoort et al 2005 a. Inorganic Solution: 10 mL of 89.6 g/L KCl solution,
10 mL of 20 g/L KSCN solution, 10 mL of 88.8 g/L NaH2PO4 solution, 1.7 mL of 175.3 g/L NaCl solution, and 20 mL of 84.7 g/L NaHCO3
b. Organic Solution: 8 mL of 25 g/L urea solution c. Mix Inorganic and Organic Solutions:290 mg alpha-amylase,
15 mg uric acid, and 25 mg mucin
d. Adjust pH to pH 6.8 +/- 0.2
Marques et al 2011 a. Simulated Saliva 1: 0.72 g/L KCl,
0.22 g/L calcium chloride dihydrate, 0.6 g/L NaCl, 0.68 g/L potassium phosphate monobasic, 0.866 g/L sodium phosphate dibasic (dodecahydrate), 1.5 g/L potassium bicarbonate, 0.06 g/L potassium thiocyanate, and 0.03 g/L citric acid with pH 6.5
b. Simulated Saliva 2: 0.72 g/L KCl, 0.22 g/L calcium chloride dihydrate, 0.6 g/L NaCl, 0.68 g/L potassium phosphate monobasic, 0.866 g/L sodium phosphate dibasic (dodecahydrate), 1.5 g/L potassium bicarbonate, 0.06 g/L potassium thiocyanate, and 0.03 g/L citric acid with pH 7.4
c. Simulated Saliva 3: 0.228 g/L calcium chloride dihydrate, 1.017 g/L NaCl, 0.204 g/L sodium phosphate dibasic (heptahydrate), 0.061 g/L magnesium chloride hexahydrate, 0.603 g/L potassium carbonate hemihydrate, 0.273 g/L sodium phosphate monobasic monohydrate, 1 g/L submaxillary mucin, and 2 g/L alpha-amylase
d. Simulated Saliva 4: 0.149 g/L KCl, 0.117 g/L NaCl, 2.1 g/L sodium bicarbonate, 2 g/L alpha-amylase, and 1 g/L mucin gastric

Page 73
e. Simulated Saliva 5: 8.0 g/L NaCl, 0.19 g/L potassium phosphate monobasic, and 2.38 g/L sodium phosphate dibasic (pH 6.8)
Ionas et al 2016 a. Simulated Saliva: 4.5 g/L NaCl,
0.3 g/L KCl, 0.3 g/L Na2SO4, 0.4 g/L NH4Cl, 0.2 g/L urea, and 3.0 g/L lactic acid with pH 6.8
8.3.3. Preparation of Samples, Extraction, and Analysis To prepare samples, discs, coupons, or circular samples are cut from the surface of the test article. The diameter of the samples should be approximately 2 inches.
Note, for each extraction, 50 mL of simulated saliva is typically used. The weight and the volume of the simulated saliva should be reported. Many test procedures and ASTM F963 require a 50:1 ratio of solvent to sample for this type of extraction. Two extraction approaches are available. The ASTM F963 method requires that the samples be extracted four times each in 50 mL of simulated saliva in a 250 mL Schott Duran (or similar) bottle for 30 minutes. Rotate the bottle head over heels (HOH) at 60 rpms for the duration of the experiment at a vertical diameter of 2 feet (Figure 26).
The liquid simulated saliva extract is removed after each extraction and saved for analysis. A fresh 25 mL of simulated saliva is added to the bottle containing the sample, and the bottle is shaken as above for 30 minutes. The replicate simulated saliva extract is then removed and also saved for analysis. The HOH procedure is then repeated a third time. Each separate solution obtained from these shakings is analyzed for the chemical of interest.
The second methodology, put forth in Ionas et al 2016, requires that the sample and artificial saliva be added to the specimen tube that is subsequently capped and placed on an incubating orbital shaker for 60 minutes at a rotation speed of 250 rpm and temperature of 37°C (Niino et al., 2002).
Figure 96. Graphic example of procedure for analyzing migration from product or article surface to saliva.

Page 74
For chemical analysis, 10 mL of the simulated saliva is placed in a test tube. One mL of xylene (or suitable solvent, such as a 50:50 mix of dichloromethane and hexane) is added to the test tube and the tube is sonicated for one minute. If concentration of the sample is required, the sample volume can be reduced under nitrogen. Analyze the supernatant solvent for chemical content by a suitable quantification method. A variety of analytical methods can be used depending on the chemical(s) present. For example, GC/MS, inductively coupled plasma atomic emission spectroscopy (ICP) or HPLC. Record the instrumentation conditions for whichever analytical technique is used. Combine the results for the threeextractions, if using the HOH method.
8.4. Calculation of Migration Rate
The migration rate is a measure of the mass of chemical transferred from the article to the saliva, normalized by the surface area of the article in contact with the saliva and the time of contact, as shown in Equation 8-1.
𝑀𝑀𝑅𝑅 = 𝑀𝑀𝑀𝑀𝑀𝑀𝑀𝑀𝑆𝑆𝐴𝐴×𝑇𝑇𝑖𝑖𝑇𝑇𝑒𝑒
(8-1) Where: MR = Migration rate of chemical into saliva in mg/cm2/hr Mass = Mass of chemical measured in the saliva sample, mg SA = Surface area of article in contact with the saliva, typically 10 cm2
Time = Contact time between article and saliva, 1 hr
8.5. Records Retention and Reporting Results:
A final report should be prepared, and records should be retained in accordance with 40 CFR 792, Subpart J – Records and Reports.
8.5.1. Records to be Maintained Records submitted to the EPA should include, but are not limited to, the following:
a. The original signed protocol and any amendments. b. Identification and characterization of the test substance as provided by Sponsor. c. Identification and characterization of the material in question d. Experiment initiation and termination dates. e. Laboratory log books (e.g., stock solution concentration calculations and solution preparation,
calibration, and QC data). f. Instrument (e.g., GC/ECNI) data files. g. Spreadsheet files for data processing. h. Chain of custody documentation, including sample storage and handling information. i. Copy of final report.
8.5.2. Final Report A final report should be prepared, and records should be retained in accordance with 40 CFR 792, Subpart J – Records and Reports. For example, the following key information should be included in the report:

Page 75
a. Test material: material name, intended use, uniformity (homogeneous, layered, spray application, coating, etc.), and dimensions of test specimens. If the two sides of the material are different, indicate which side is tested (See Contextualizing Information for Product Use).
b. Extraction solution: preparation, chemical makeup, testing c. Test procedure: description or citation, including deviation from standard procedure. d. Analytical methods: description or citation, including deviation from standard procedure. e. Test results: mass migrated and concentrated in extraction solution. f. Calculated results: migration rate. g. QA/QC data: accuracy and precision of measurements, calibrations, daily calibration checks,
background samples, blank samples.
8.6. References:
Chen, S-B. (2002) Screening of toys for PVC and phthalates migration. June 20, 2002. In: CPSC: Response to Petition HP 99-1. Request to ban PVC in toys and other products intended for children five years of age and younger. U.S. Consumer Product Safety Commission, Bethesda, MD. August 13, 2002. See TAB I, pp. 244-261. https://www.cpsc.gov/s3fs-public/pdfs/foia_fiveyearpt4.pdf
Babich, M.A. (2002) Updated risk assessment of oral exposure to diisononyl phthalate (DINP) in children’s products. August 26, 2006. In: CPSC: Response to Petition HP 99-1. Request to ban PVC in toys and other products intended for children five years of age and younger. U.S. Consumer Product Safety Commission, Bethesda, MD. August 13, 2002. See TAB L, pp. 299-419. https://www.cpsc.gov/s3fs-public/pdfs/foia_fiveyearpt5.pdf, https://www.cpsc.gov/s3fs-public/pdfs/foia_fiveyearpt6.pdf, and https://www.cpsc.gov/s3fs-public/pdfs/foia_fiveyearpt7.pdf.
Babich MA, Greene MA, Chen S, Porter WK, Kiss CT, Smith TP, Wind ML (2004) Risk assessment of oral exposure to diisononyl phthalate from children’s products. Regulatory Toxicology and Pharmacology 40: 151-167.
Bouma K and Schakel D.J., 2001. Plasticisers in Soft PVC Toys. Report number: NDTOY002/01, available at https://www.nvwa.nl/txmpub/files/?p_file_id=10485
Bouma, K., & Schakel, D. J. (2002). Migration of phthalates from PVC toys into saliva simulant by dynamic extraction. Food Additives & Contaminants, 19(6), 602-610., available at http://www.tandfonline.com/doi/abs/10.1080/02652030210125137#.VgqkTJe2q8R
Brandon, E. F., Oomen, A. G., Rompelberg, C. J., Versantvoort, C. H., van Engelen, J. G., & Sips, A. J. (2006). Consumer product in vitro digestion model: Bioaccessibility of contaminants and its application in risk assessment. Regulatory Toxicology and Pharmacology, 44(2), 161-171.
Corea-Tellez, K. S., Bustamante-Montes, P., Garcia-Fabila, M., Hernández-Valero, M. A., & Vazquez-Moreno, F. (2008). Estimated Risks of Water and Saliva Contamination by Phthalate Diffusion from Plasticized Polyvinyl Chloride. Journal of Environmental Health, 71(3), 34-9., available at http://europepmc.org/abstract/med/18990931
Earls, A. O., Axford, I. P., & Braybrook, J. H. (2003). Gas chromatography–mass spectrometry determination of the migration of phthalate plasticisers from polyvinyl chloride toys and childcare articles. Journal of chromatography A, 983(1), 237-246., available at http://www.sciencedirect.com/science/article/pii/S0021967302017363
Ghanem, R. A. (2015a). Kinetics of thermal and photo-initiated release of tris (1,3-dichloro-2-propyl) phosphate (TDCP) flame retardant from polyurethane foam materials. Journal of Environmental Science and Health, Part A: Toxic/Hazardous Substances and Environmental Engineering, 50(8), 855-865.

Page 76
Ghanem, R. A. (2015b). Kinetics of thermal and photo-initiated release of tris(1-chloro-2-propyl) phosphate (TCPP) from polyurethane foam materials. Jordan Journal of Chemistry, 10(1), 20-33.
Ionas, AC; Ulevicus, J; Gómez, AB; Brandsma, SH; Leonards, PEG; van de Bor, M; Covaci, A. (2016). Children's exposure to polybrominated diphenyl ethers (PBDEs) through mouthing toys. Environment International. 87: 101-107. http://www.sciencedirect.com/science/article/pii/S0160412015301021.
Masuck, I., Hutzler, C., & Luch, A. (2011). Estimation of dermal and oral exposure of Children to scented toys: Analysis of the migration of fragrance allergens by dynamic headspace GC–MS. Journal of separation science, 34(19), 2686-2696., available at http://onlinelibrary.wiley.com/doi/10.1002/jssc.201100360/abstract;jsessionid=CD01BF2ED5C27F03C6AC1E405B78E4D6.f03t04?deniedAccessCustomisedMessage=&userIsAuthenticated=false
Marques, M. R., Loebenberg, R., & Almukainzi, M. (2011). Simulated biological fluids with possible application in dissolution testing. Dissolution Technol, 18(3), 15-28 (Table 10).
Ng, M. G., Semple, S., Cherrie, J. W., Christopher, Y., Northage, C., Tielemans, E., Veroughstraete, V., & Van Tongeren, M. (2012). The relationship between inadvertent ingestion and dermal exposure pathways: A new integrated conceptual model and a database of dermal and oral transfer efficiencies. Annals of Occupational Hygiene. 56(9): 1000-1012.
Niino T, Ishibashi T, Itho T, Sakai S, Ishiwata H, Yamada T, and Onodera S , 2001. Monoester formation by hydrolysis of dialkyl phthalate migrating from PVC products in human saliva. Journal of Health Science, 47(3):318-322., available at http://jhs.pharm.or.jp/data/47%283%29/47%283%29p318.pdf
Niino T, Ishibashi T, Itho T, Sakai S, Ishiwata H, Yamada T, Onodera S, 2002. Comparison of Diisonoyl Phthalate Migration from Polyvinyl chloride products into human saliva in Vivo and into saliva simulant In vitro. Journal of Health Science, 48(3):227-281., available at http://jhs.pharm.or.jp/data/48%283%29/48_277.pdf?origin=publication_detail
Niino T, Asakura T, Ishibashi T, Itho T, Sakai S, Ishiwata H, Yamada T, Onodera S, 2003. A Simple and Reproducible Testing Method for Dialkyl Phthalate Migration from Polyvinyl Chloride Products into Saliva Simulant . J. Food Hyg. Soc. Japan 44, 1: (13-18), available at https://www.jstage.jst.go.jp/article/shokueishi/44/1/44_1_13/_pdf
Özer, E. T., & Güçer, Ş. (2011). Determination of some phthalate acid esters in artificial saliva by gas chromatography–mass spectrometry after activated carbon enrichment. Talanta, 84(2), 362-367., available at http://www.sciencedirect.com/science/article/pii/S003991401100035X
Simoneau, C., Hannaert, P., and Sarigiannis, D. E. 2009. Effect of the nature and concentration of phthalates on their migration from PVC materials under dynamic simulated conditions of mouthing. EUR 23813 EN; pp. 20.,available at http://publications.jrc.ec.europa.eu/repository/bitstream/JRC51604/reqno_jrc51604_chemtest_part2-phthalates_release_toys_cs02009_05_26.pdf%5B1%5D.pdf
TNO Nutrition and Food Research, 2001. Migration of phthalate plasticizers from soft PVC toys and childcare articles –Final report. Netherlands Organization for Applied Scientific Research, available at http://ec.europa.eu/enterprise/sectors/chemicals/files/studies/phthalates2_en.pdf
Versantvoort, C. H., Oomen, A. G., Van de Kamp, E., Rompelberg, C. J., & Sips, A. J. (2005). Applicability of an in vitro digestion model in assessing the bioaccessibility of mycotoxins from food. Food and Chemical Toxicology, 43(1), 31-40.

Page 77
9. Migration to Skin (Dermal Exposure)
9.1. Purpose:
The objective of this protocol is to determine chemical loading on the surface of the skin due to direct contact with an article or product (solid or liquid), contact with chemical laden dust or soil, and vapor-to skin exposure, and to quantify potential availability for dermal exposure.
9.2. Modifications:
This protocol is general, and it is anticipated that during protocol development and finalization, additional modifications will be made to tailor the sampling parameters or analytical techniques to the specific chemical and product tested, as well as to Agency recommendations specific to particular products, chemicals, or exposure scenarios of interest.
9.3. Description:
For this protocol, actual skin (i.e. animal skin, cadaver skin, human subject skin, where proper ethical and scientific research requirements have been met, etc.) or a skin surrogate, such as filter paper, may be used to estimate chemical load present on the surface of the skin. If human subjects are used for the testing, ensure that all requirements related to issues associated with scientific and ethical aspects of human subject research are followed. There are four primary mechanisms for chemical loading on to the surface of the skin:
a. Contact through application of liquid or semi-solid products or products b. Contact with surface of article or building material and migration into simulated sweat and/or
skin lipids (oil). c. Contact with dust and or soil and migration into simulated sweat and/or skin lipids (oil). d. Transfer of chemicals from vapor-phase chemical concentrations in the air to the skin.
The first mechanism applies primarily to products; the second to articles; the third to dust and soil which may be present on the surface of articles, on the floor, or the ground. The fourth mechanism can occur as a result of product use or article exposure if individuals are exposed to elevated air concentrations for a long enough duration for transfer to occur. This exposure pathway may also be significant depending on the chemical, product, and environment of interest for the exposure scenario. Methods, such as those presented by Weschler et al, 2015 and Gong et al, 2014, show promise, and information from studies like this could inform an expanded basis for protocols characterizing the dermal pathway in the future.
Note, potential dermal exposure is described here. There are approaches available to estimate absorbed dose if dermal exposure is expected to be an important exposure pathway but this is outside the scope of this protocol. In vivo measurements, in vitro measurements and/or measured permeability coefficients could be used to estimate absorbed dose. The flux of a chemical across the skin membrane, whether an infinite or finite dose is assumed, exposure duration, and comparison of different approaches can be considered (OECD 2004a) (OECD 2004b) (Buist et al 2010) (Frasch et al 2014).

Page 78
9.3.1. Approach for Determination of Skin Loading through Direct Wipe sampling or measurement of Film Thickness from Application of Liquids or Semi-solid Product Direct contact exposure from products may result from either direct application to skin, or via direct contact with a product not intentionally applied to the skin. The thickness of the product film that remains on the skin after contact is used to characterize the mass of product on the skin. The film thickness can be measured in up to five use scenarios depending on the intended product use. In all scenarios, the product should be prepared according to use instructions. Because the test is measuring product film thickness on skin as a result of product use, a surrogate test product with similar properties (e.g., volatility, viscosity, etc.) can be used for testing. For example, surrogate test products that are generally regarded as safe and non-toxic should be used if human subjects will be used during testing. Product specific density should be measured and used alongside film thickness measurements to estimate skin loading (mg/cm2).
Skin Wipes and/or manual handwashing can also be used to sample the skin directly. These sampling strategies have been employed for several decades in occupational settings, but are also relevant to indoor exposures associated with products and articles. Chemical substances present on the skin are extracted using these techniques and provide a snapshot of the mass available for exposure at the time the samples were taken. Skin wipes are typically wetted with a combination of water and solvent. The wipe should be applied with the same approach and the number of wipes, surface area of skin, sampling efficiency, and time of sample following exposure should be noted. Hand washes are typically a combination of water, soap, and solvent. The hand wash should be done consistency with the number of washes, surface area of skin, sampling efficiency, and time of sample following exposure noted. Interpretation of wipe samples, particularly for more volatile compounds should be carefully considered as sampling efficiency is typically less than 100% and varies depending on how and when the sample was collected (Brouwer et al 2000).
Primary and Secondary Contact For the initial contact scenario, a cloth saturated with the product should be rubbed over the front and back of both clean, dry hands. For the secondary contact scenario, a cloth saturated with the product should be rubbed over the front and back of both hands for a second time, after as much as possible of the liquid that adhered to skin during the first contact event was removed using a clean cloth. The subject’s hands should then be fully wiped, defined as wiping with a clean dry cloth as thoroughly as possible for 10 seconds. The film thickness is determined by dividing the difference in cloth weight before and after wiping by the surface area of the hand and the density of the prepared product. Four to 6 replicate tests should be conducted and reported.
Immersion To measure the film thickness that results from immersion, the hand should be immersed in the prepared product and then allowed to drip back into the container for 30 seconds. The weight of the container of prepared product should be weighed before and after immersion. The difference in weight of the container divided by the surface area of the hand, normalized by the density of the product is the film thickness. Four to 6 replicate tests should be conducted and reported.
Contact from Handling a Wet Rag To estimate film thickness from handling a wet rag, a cloth saturated with the product should be rubbed over the palms of both hands in a manner simulating handling of a wet cloth. The subject’s hands should then be fully wiped, defined as wiping with a clean dry cloth as thoroughly as possible for 10 seconds. The film thickness is determined by dividing the difference in cloth weight before and after wiping by

Page 79
the surface area of the hand and the density of the prepared product. Four to 6 replicate tests should be conducted and reported.
Contact from Cleaning a Spill A subject should use a clean cloth to wipe up 50 mL of prepared product poured onto a non-porous surface. After cleanup, the subject’s hands should then be fully wiped, defined as wiping with a clean dry cloth as thoroughly as possible for 10 seconds. The film thickness is determined by dividing the difference in cloth weight before and after wiping by the surface area of the hand and the density of the prepared product. Four to 6 replicate tests should be conducted and reported.
9.3.2. Approach for Estimating Migration into Simulated Sweat from Contact with an Article A small or large scale experiment can be used to evaluate sweat facilitated migration from an article onto skin or skin surrogate. The sampling conditions should be varied based on the chemical, article, and scenario of interest. Parameters that should be varied include the:
a. size and thickness of the article, b. amount of surrogate sweat applied, c. amount and timing of pressure (psi) applied, d. size of skin or skin surrogate material used, e. type of surrogate material used (if applicable), and f. additional barrier present or not present between article surface and surrogate skin material of
filter paper.
Preparation of Sweat and/or Simulated Sweat/Sebum Mixture (Skin Lipids) Artificial sweat or perspiration is the reagent extract solution. Typical components of artificial sweat include water, lactate, urea, sodium, potassium, calcium, and magnesium. Saline solution may be used as a starting point. Because the swelling of water-soluble polymers is suppressed by some metal ions, especially calcium, and by low pH, Marques et al. (2011) provide five different approaches to simulate sweat with different concentrations of calcium and different pH.
a. Simulated Sweat 1 (3 milliequivalents of calcium ions): 2.92 mEq/L NaCl, 0.166 mEq/L CaCl2, 0.12 mEq/L MgSO4, and 1.02 mEq/L potassium phosphate monobasic (pH 5.4)
b. Simulated Sweat 2 (60 milliequivalents of calcium ions):5.49 mEq/L NaCl, 3.32 mEq/L CaCl2, 0.24 mEq/L MgSO4, and 1.36 mEq/L potassium phosphate monobasic (pH 4.5)
c. Simulated Sweat 3 (120 milliequivalents of calcium ions): 5.49 mEq/L NaCl, 6.64 mEq/L CaCl2, 0.24 mEq/L MgSO4, and 1.36 mEq/L potassium phosphate monobasic (pH 4.5)
d. Simulated Sweat 4 (240 milliequivalents of calcium ions): 5.49 mEq/L NaCl, 13.28 mEq/L CaCl2, and 0.24 mEq/L MgSO4, 1.36 mEq/L potassium phosphate monobasic (pH 4.5)
e. Simulated Sweat 5: 0.5 % (in mass) NaCl, 0.1 % lactic acid, and 0.1 % urea with the recommended volume of simulated fluid

Page 80
(about 1 mL per cm2 sample area) f. Simulated Sweat/Sebum Mixture 6 (pH 5.3) (Abdallah et al 2016):
Sodium Sulfate- 5.83 x 10⁻² g/L Copper Chloride anhydrous- 1.60 x 10⁻⁴ g/L Ammonium Hydroxide - 1.82 x 10⁻¹ g/L Iron sulfate Heptahydrate - 2.72 x 10⁻³ g/L Sulfur- 7.37 x 10⁻²- g/L Lead- Reference Solution 1000 ppm - 2.49 x 10⁻⁵ g/L Manganese- Reference Solution 1000 ppm - 1.38 x 10⁻⁴ g/L Nickel- Reference Solution 1000 ppm - 2.46 x 10⁻⁵ g/L Zinc - Reference Solution 1000 ppm - 8.5 x 10⁻⁴ g/L Sodium Bicarbonate - 2.52 x 10⁻¹ – g/L Potassium chloride - 4.55 x 10⁻¹ -g/L Magnesium Chloride Hexahydrate - 1.67 x 10⁻²- g/L Sodium Phosphate Anhydrous Monobasic - 4.84 x 10⁻²- g/L Calcium Chloride Dihydrate- 7.65 x 10⁻¹ – g/L Sodium chloride- 5.84 x10⁻² – g/L Acetic Acid 7.81 x 10⁻³- g/L Butyric Acid- 2.11 x 10⁻⁴- g/L D(+) –Glucose- 3.06 x 10⁻²- g/L Lactic Acid- 1.57 x 100- g/L Essential Amino Acid Mix- 2.5 mM each : 17 AA g/L Ammonium Chloride- 9.92 x 10⁻³- g/L Urea- 6.01 x 10⁻¹- g/L Creatinine - 9.50 x 10⁻³- g/L Squalene- 0.5151- g/L Palmityl Palmitate (saturated)- 0.9718- g/L Triolein (Unsaturated)- 0.5345 g/L Cholesteryl Oleate- 0.0972- g/L
9.3.3. Preparation of Samples, Extraction, and Analysis A small-scale experiment can be used to evaluate an article coupon with surface area corresponding to a circle with a diameter of 5.5 cm (Bhooshan and Cobb 2000), as demonstrated in Figure 27. The article sample, potentially containing multiple layers of an article, such as fabric and foam, is placed in a 600 mL beaker and covered with skin or skin surrogate, such as Whatman #2 filter paper, large enough to cover the article sample.
Two to 4 mL of simulated sweat extract is poured onto the skin or skin surrogate. The skin or skin surrogate and article surface are allowed to dry for 6-8 hours, and the skin or skin surrogate is removed. The surface of the article in the beaker is then covered with another skin or skin surrogate and the experiment is repeated with the same simulated sweat solution four times, for a total of 5 skin or skin surrogate samples. It is recommended to consider the application of pressure to the skin or skin surrogate covered article using a range of weights (i.e. one psi weight measuring 2 inches in diameter and weighing 3.4 lbs, or other weights consistent with typical and high-end dermal contact) in a portion of the replicates. If the article being tested contains a barrier material (i.e., textile covering of a couch cushion), this should be considered in the testing; the replicates should consider migration both with and without the presence of such a barrier between the skin or skin surrogate and the article. After

Page 81
collection and drying, the five skin or skin surrogate replicate samples are then extracted and analyzed for the chemical of interest.
Figure 107. Graphic example of small-scale procedure for analyzing migration from product or article surface to sweat.
As an alternative, a large scale experiment could be conducted to evaluate a larger surface area of an article including up to full size (e.g., full couch cushion, pillow, and mattress) (Cobb 2005). The actual surface area and thickness of the article used in the experiment may vary but should be documented. Two skin or skin surrogate pieces should be placed on the entire surface of the article and wetted with 25 mL of simulated sweat. Note, the amount of simulated sweat may vary depending on the physical activity level and age of an individual so a range of simulated sweat amounts can be considered.
One psi weight should be placed on each skin or skin surrogate piece. One weight should be removed after the skin or skin surrogate is thoroughly wetted; the other should be removed six hours after application of the simulated sweat. The first situation mimics intermittent skin contact with the article while the second mimics continuous skin contact with the article. The surface of the article is then covered with two new dry pieces of skin or skin surrogate and the experiment is repeated with the same simulated sweat solution four times, for a total of 5 tests with 10 filter paper samples collected. Five replicate tests are done for each sample. If the article being tested contains a barrier material (i.e., textile covering of a couch cushion), this should be considered in the testing; the replicates should consider migration both with and without the presence of such a barrier between the skin or skin surrogate and the article. The 10 skin surrogate samples are then extracted and analyzed for the chemical of interest.
Barrier materials and/or the surfaces of the articles themselves may or may not be treated with various chemicals, which are intended to promote stain resistance, water repellence, etc. The use of materials with these chemicals added is applicable if representative of the exposure scenario of interest. If a barrier material of any kind is used, the experiments should be repeated five times both with and without the use of the barrier material.
These experiments can be described as surface migration tests that estimate the quantity of chemical that might migrate to the skin from the surface of an article over time under certain conditions of use. Extraction methods and analytical approaches for the skin or skin surrogate, such as filter paper, will vary based on the chemical and exposure scenario of interest.
9.3.4. Approach for Estimating Migration into Simulated Sweat from Contact with an Article

Page 82
9.4. Records Retention and Reporting Results:
A final report should be prepared, and records should be retained in accordance with 40 CFR 792, Subpart J – Records and Reports.
9.4.1. Records to be Maintained Records submitted to the EPA should include, but are not limited to, the following:
a. The original signed protocol and any amendments. b. Identification and characterization of the test substance as provided by Sponsor. c. Identification and characterization of the material in question d. Experiment initiation and termination dates. e. Laboratory log books (e.g., stock solution concentration calculations and solution preparation,
calibration, and QC data). f. Instrument (e.g., GC/ECNI) data files. g. Spreadsheet files for data processing. h. Environmental data acquired by the data acquisition system of the test chambers (e.g.,
temperature, air flow and inlet air moisture content). i. Chain of custody documentation, including sample storage and handling information. j. Copy of final report.
9.4.2. Final report A final report should be prepared, and records should be retained in accordance with 40 CFR 792, Subpart J – Records and Reports. For example, the following key information should be included in the report:
a. Test material: material name, intended use, uniformity (homogeneous, layered, spray application, coating, etc.), and dimensions of test specimens. If the two sides of the material are different, indicate which side is tested (See Contextualizing Information for Product Use).
b. Target chemical(s) and their basic properties: CAS number, molecular formula, vapor pressure, chemical reactivity, concentration in material, etc. (See Contextualizing Information for Product Use).
c. Extraction solution: preparation, chemical makeup, testing. d. Test procedure: description or citation, including deviation from standard procedure. e. Analytical methods: description or citation. f. Test results: mass migrated and concentrated in extraction solution. Calculated results: migration rate
9.5. References:
Bhooshan, B., and Cobb, D. (2000). Migration of Flame Retardant Chemicals from Upholstery Fabrics.
TAB G. Pages 610-638. Brouwer et al (2000). Hand Wash and Manual Skin Wipes. Ann. occup. Hyg., 44, (7):. 501–510.

Page 83
Cobb, D. (2005). Migration of Flame Retardant Chemicals in Mattress Barriers. H. Pages 542-553, available at http://www.cpsc.gov/PageFiles/88231/matttabh.pdf
Buist, H. E., van Burgsteden, J. A., Freidig, A. P., Maas, W. J., & van de Sandt, J. J. (2010). New in Vitro Dermal Absorption Database and the Prediction of Dermal Absorption under Finite Conditions for Risk Assessment Purposes. Regulatory Toxicology and Pharmacology, 57(2): 200-209.
Frasch, H. F., Dotson, G. S., Bunge, A. L., Chen, C. P., Cherrie, J. W., Kasting, G. B., Kissel, J.C., Sahmel J., Semple S. and Wilkinson, S. (2014). Analysis of Finite Dose Dermal Absorption Data: Implications for Dermal Exposure Assessment. Journal of Exposure Science and Environmental Epidemiology, 24(1): 65-73.
Gong, M., Zhang, Y., & Weschler, C.J. (2014). Measurement of Phthalates in Skin Wipes: Estimating Exposure from Dermal Absorption. Environmental Science & Technology, 48: 7428−7435
Marques, M. R., Loebenberg, R., & Almukainzi, M. (2011). Simulated Biological Fluids with Possible Application in Dissolution Testing. Dissolution Technol, 18(3): 15-28 (Table 17).
Organization for Economic Co-operation and Development, (2004a). (Test Guideline 428) Skin Absorption-In vitro Method.
Organization for Economic Co-operation and Development, (2004b). (Section 4-Other Test Guidelines) Guidance Document for the Conduct of Skin Absorption Studies.
Pawar, G., Abdallah, M. A. E., de Sáa, E. V., & Harrad, S. (2017). Dermal bioaccessibility of flame retardants from indoor dust and the influence of topically applied cosmetics. Journal of Exposure Science and Environmental Epidemiology, 27, 100-105.
Weschler, C.J., Bekö, G., Koch, M., Salthammer, T., Schripp, T., Toftum, J. Claesen, G. (2015) Transdermal Uptake of Diethyl Phthalate and Di(n-butyl) Phthalate Directly from Air: Experimental Verification. Environmental Health Perspectives, 123: 928-934. http://dx.doi.org/10.1289/ehp.1409151.

Page 84
10. Migration of Chemical from Solid Material to Water
10.1. Purpose:
The objective of the leaching protocols is to determine the potential for migration of chemicals into water, and the rate of release of chemicals from various solid materials into water. The protocol is divided into two sections: the first section informs understanding of liquid to solid ratio and the potential for migration; the second section informs an understanding of the longer-term migration through derivation of a migration rate. The methods presented are not applicable to volatile compounds, and generally suitable only for testing chemicals with a vapor pressure less than 0.1 torr (~10 Pascal) at 25°C.
10.2. Modifications:
This protocol is general, and it is anticipated that during protocol development and finalization, Agency recommendations will be incorporated to tailor sampling parameters or analytical techniques to the specific product, chemical, and exposure scenario of interest.
10.2.1. Key Definitions Extractant – the solution used to leach a chemical from the solid material. In this protocol the extractant is water. Leachate – the solution after testing which includes the extractant and leachables from the solid material. Leachables – chemical contained within the leachate.
Figure 28. Diagram of relationships between components in leaching protocol.
Chemical C
Solid material
Extractant
Leaching vessel Leachate
Chemical A
Chemical B
Leachables
Page 85
Section 10a: Migration into Water: Liquid to Solid Ratio
10.3. Description:
Section 10a of the protocol is used to determine the liquid-solid partitioning (LSP) of inorganic chemicals (including metals), non-volatile organic compounds (dissolved organic carbon), and semi-volatile organic compounds (SVOCs) at environmentally relevant temperatures as a function of liquid-to-solid ratio (L/S) under conditions close to liquid-solid chemical equilibrium. This method is a modification of EPA Method 1316.
10.3.1. Approach This method consists of five parallel leaching experiments of ground or crumbled solid material in reagent water over a range of L/S values from 0.5 to 10 mL extractant/g dry material. In addition to the five leaching experiments, a method blank without a solid sample is carried through the procedure in order to verify that analyte interferences are not introduced as a consequence of reagent impurities or equipment contamination. In total, six bottles are tumbled in an end-over-end fashion for a specified contact time based on the maximum particle size of the solid. At the end of the contact interval, the liquid and solid phases are roughly separated via settling or centrifugation. Extract pH and specific conductance of the liquid phase are then measured. The bulk of the leachate is clarified by pressure or vacuum filtration in preparation for constituent analysis. Analytical aliquots of the extracts are collected and preserved accordingly based on the determinative methods to be performed. The leachate constituent concentrations are plotted as a function of L/S and compared to QC and assessment limits.
10.3.2. Materials and Equipment Laboratory apparatus and supplies that will be necessary for the testing include:
• ASTM type 2 water (ASTM, 2011) or other types of high purity laboratory water • 0.01 M NaOH and 0.1 M HCL solution • Six wide-mouth bottles of inert material, including five for test samples and one for a method
blank. Bottles made of High Density Polypropylene (HDPP) are recommended for the evaluation of organic and inorganic chemicals. The bottles should be leak-proof and be of sufficient volume for to hold both the solid sample and extractant volume
• Balance with readability of 0.01 gram • Rotary tumbler capable of rotating extraction vessels end-over-end at a constant speed of 28±2
rpm • Filtration apparatus (pressure or vacuum filtration) • Filtration membranes with 0.45 µm pore size • pH meter • Conductivity meter • Oxidization-reduction potential (ORP) meter • Adjustable-volume pipettor • Disposable pipettor tips • Centrifuge (recommended) able to centrifuge extraction vessels at 4000±100 rpm for 10±2 min

Page 86
10.4. Experimental Design:
10.4.1. Sample Preparation Procedure For this procedure, 85% (by weight) of particles should be less than 2.0 mm. Particle size reduction of "as received" sample may be achieved through crushing, milling, or grinding, provided that all equipment surfaces in contact with the test materials are chemically inert. During the reduction process, care should be taken to minimize sample loss, including loss of volatile constituents in the sample. Once particles are of relatively uniform size, sieve the sample and calculate the percentage (by weight) less than the sieve size. Continue particle size reduction until at least 85% of particles pass through the sieve. If the moisture content of the sample is estimated to be >10% then the actual moisture content should be determined prior to testing (see Appendix 10A). Samples should not have preservatives added prior to leaching. Samples may be refrigerated after collection and prior to leaching, unless it will result in irreversible physical change to the sample. Table 8 below is an example experimental schedule that can be used as a guide. Each volume of sample material should be tested in duplicate.
Table 8. Example Experimental Schedule1,2.
A B C D E F Test
position Target LS
(mL extractant/g dry material)
Minimum Dry Mass (g-dry)
Mass of “as tested”
sample (g)
Volume of reagent water (mL)
Recommended bottle size (mL)
T01 10.0 10 11.1 99 150 T02 5.0 20 22.2 98 150 T03 2.0 50 55.5 94.5 250 T04 1.0 100 111.1 89 250 T05 0.5 200 222.2 78 500 B013 QC - - 100 150
TOTAL 422.1 558.5 1This schedule assumes a target liquid of 100mL 2This schedule is based on “as tested” solids contents of 0.90 g-dry/g 3Test position marked B01 is a method blank of reagent water The following calculation can be performed to set up a similar experimental table. Calculate and record the volume of reagent water needed to bring each leaching experiment to the target L/S ratio in Column F of Table 1 using Equation 10-1:
𝑉𝑉𝑅𝑅𝑊𝑊 = 𝑀𝑀𝑑𝑑𝑟𝑟𝑦𝑦 × 𝐿𝐿𝑆𝑆 [10-1] Where:
VRW = volume of reagent water needed to complete L/S (mL) Mdry = mass of dry material (g-dry) LS = liquid-to-dry-solid ratio ( mL/g)

Page 87
The size of the leaching bottle should be sufficient to contain the combined volume of solid material and extractant, ideally with a minimum amount of headspace. The mass of solids (Column D) in an extraction may be scaled to minimize headspace in each leaching vessel. However, the volume of extractant should always be based on the target L/S in Column B of Table 8.
10.4.2. General Leaching Test Procedure This protocol uses a parallel batch procedure to determine the liquid-solid partitioning of a chemical substance from a solid material. The general steps for this procedure are:
• Adjust the reagent water to pH 7 with 0.01 M NaOH or 0.1 M HCL solution. • Measure the pH, specific conductivity, and ORP of the reagent water, and starting concentration
of chemical substance in the solid, prior to test. • Label bottles with test position numbers and method blank bottle according to the experimental
schedule. • Place the dry-mass equivalent of "as-tested" sample as shown in Column D in Table 8 into each
of the five test position leaching vessels. • Add the appropriate volume of reagent water to both the test position and method blank
leaching vessels as specified in Column F of Table 8. • Tighten the leak-proof lid on each bottle and tumble all leaching vessels (i.e., test vessels and
method blanks) in an end-over-end fashion at 28±2 rpm at room temperature (20°C) for 48±2 hours.
• Remove the leaching vessels from the rotary tumbler and clarify the leachates by allowing the bottles to stand or centrifuge the extraction vessels. If after settling or centrifugation, the sample is not fully clarified, the sample may be filtered prior to leachate measurements (pH, conductivity, and oxidization-reduction potential). If this is done, make a note of the deviation in procedure records.
• For each leaching vessel, decant a minimum volume of supernatant into a clean container. • Measure and record the pH, specific conductivity, and ORP of the leachates within 15 minutes of
leachate processing (see EPA Methods 9040, 9045, and 9050). • Separate the solid from the remaining liquid in each leaching vessel by pressure or vacuum
filtration through a clean 0.45-µm pore size membrane. The filtration apparatus may be exchanged for a clean apparatus as often as necessary until all liquid has been filtered.
• Immediately, preserve and store the volume(s) of leachate required for chemical analysis. Preserve all analytical samples in a manner that is consistent with the determinative chemical analyses to be performed (see section below).
• Leachates may be preserved as appropriate based on individual determinative methods for chemicals of concern.
10.4.3. Analytical Procedure
This protocol covers a wide range of chemical substances leaching from samples, which require different analytical methods. Table 9 provides a list of EPA analytical methods for various chemicals.

Page 88
Table 9. EPA Analytical Methods for various chemicals.
Chemical EPA Method Lead 200.8 Methods for the Determination of Metals in
Environmental Samples, Supplement 1 Mercury 200.8 Methods for the Determination of Metals in
Environmental Samples, Supplement 1 245.1 Determination of Mercury in Water by Cold Vapor Atomic Absorption Spectrometry 245.1 Methods for Chemical Analysis of Water and Wastes
Organic contaminants List of EPA methods PCBs 8082A Polychlorinated Biphenyls (PCBs) by Gas
Chromatography SVOCs 8270D Semi-volatile Organic Compounds by Gas
Chromatography/Mass Spectrometry (GC/MS)
10.5. Reporting of Results and Records Retention:
10.5.1. Records to be Maintained Records submitted to the EPA should include, but are not limited to, the following:
a) The original signed protocol and any amendments. b) Identification and characterization of the test substance as provided by Sponsor. c) Identification and characterization of the material in question. d) Batch ID of material used in characterization step and of material used in leaching step. e) Experiment initiation and termination dates. f) Laboratory log books (e.g., stock solution concentration calculations and solution
preparation, calibration, and QC data). g) Instrument (e.g., GC/ECNI) data files. h) Spreadsheet files for data processing. i) Copy of final report.
10.5.2. Final Report A final report of the results of the study should be prepared and submitted to the EPA. The final report should include, but is not limited to the following, when applicable:
a. Name and address of facility performing the study. b. Dates on which the study was initiated and completed. c. Objectives and procedures stated in the approved protocol, including any changes in the
original protocol. d. Identification and characterization of the test substance as provided by sponsor. e. A summary and analysis of the data and a statement of the conclusions drawn from the
analysis. f. A description of the transformations and calculations performed on the data. g. A description of the methods used and reference to any standard method employed.

Page 89
h. A description of the instrumentation utilized. i. A description of the preparation of the test solutions, the testing concentrations, and the
duration of the test. j. A description of sampling and analytical methods, including level of detection, level of
quantification, and references. k. A description of test specimens and test matrix. l. A description of the test results including measured values for individual chemicals of
interest for each matrix. m. A description of all circumstances that may affect the quality or integrity of the data. n. The name of the study director, the names of other scientists or professionals, and the
names of all supervisory personnel involved in the study. o. The signed and dated reports of each of the individual scientists or other professionals
involved in the study, if applicable. p. The location where the raw data and final report are to be stored. q. A statement prepared by the Quality Assurance Unit listing the types of instrumental
inspections, calibration certifications, the dates that the study inspections were made and the findings reported to the Study Director and Management.
r. A copy of all raw data including but not limited to instrumentation output, lab notebooks, and data sheets, etc.
Specific data that should be reported includes:
a. Date and time at the start of the test. b. Name of the solid material. c. Ambient temperature during migration. d. Leaching contact time. e. Concentration of chemical substances (leachables) in the starting material.
The minimum set of data that should be reported for each leachate includes:
a. Leachate sample ID. b. Target L/S (mL/g-dry). c. Mass of "as tested" solid material used (g). d. Moisture content of material used (gH2O/g) (if moisture content of sample >10%). e. Volume of extractant used (mL). f. Measured final leachate pH. g. Measured leachate conductivity (mS/cm). h. Measured ORP (mV) (optional). i. Concentrations of target leachables in leachate. j. Analytical QC qualifiers as appropriate.

Page 90
10.5.3. Changes to the Final Report If it is necessary to make corrections or additions to the final report after it has been accepted, such changes should be made in the form of an amendment issued by the Study Director. The amendment should clearly identify the part of the study that is being amended and the reasons for the alteration. Amendments should be signed and dated by the Study Director and Laboratory Quality Assurance Officer.
10.5.4. Changes to the Protocol Planned changes to the protocol should be in the form of written amendments signed by the Study Director and approved by the sponsor’s representative and submitted to EPA using procedures in 40 CFR 790.50. Amendments should be considered as part of the protocol and should be attached to the final protocol. Any other changes should be in the form of written deviations signed by the Study Director and filed with the raw data. All changes to the protocol should be indicated in the final report. Changes to the test standard require prior approval from EPA using procedures in 40 CFR 790.55.
10.6. References:
U.S. EPA. (2012) Method 1316. Liquid-solid partitioning as a function of liquid-to-solid ratio in solid materials using a parallel batch procedure. https://www.epa.gov/sites/production/files/2015-12/documents/1316.pdf
ASTM (2011). D1193 - 06(2011) — Standard Specification for Reagent Water. https://www.astm.org/Standards/D1193.htm
Section 10b: Migration Rate into Water over Time
10.7. Description:
Section 10b of the protocol is used to determine the rate of migration of inorganic chemicals (including metals), non-volatile organic compounds (dissolved organic carbon), and semi-volatile organic compounds (SVOCs) to environmental waters at environmentally relevant temperatures. This can provide insight into the solid phase diffusion process. This method, which is designed to enhance the leaching of materials found at low concentrations in either the solid or liquid and is a modification of ASTM Method D4874 and EPA Method 1315. EPA may consider updates to protocol 10b in the near future.
10.7.1. Approach Migration of chemicals may be controlled in large part by the distance the additive travels from the interior of the polymer to its surface and is generally considered a partitioning effect based on Fick’s law of diffusion and mass transfer theory. Further, polymers are also fragmented by abrasive and weathering processes during use and after disposal (Barnes et al, 2009; Rauert et al 2014). Such fragmentation increases the polymer’s surface-to-volume ratio. This reduces the distance through the polymer particle that additives travel to reach the surface, and may increase their potential release to the environment.

Page 91
This method consists of sample preparation and characterization, leaching through a HPLC column, and sample analysis.
10.7.2. Materials and Equipment Laboratory apparatus and supplies that will be necessary for the testing include:
• Cryomill for polymer grinding • Jars and stainless still mixing balls for cryomill • Jet Sieve for sieving ground particles • BET surface area analyzer • Glass tubes for BET surface area analyzer • Balance with readability of 0.01 gram • Liquid nitrogen • Nitrogen gas • Methylene chloride or suitable solvent • Quikrete pool filter grade sand; 400-800 µm/20-50 mesh or equivalent • Muffle oven or means of baking at 450 OC • Stainless steel HPLC column (e.g., HPLC column; 250 x 10 mm) with stainless steel frit and
polyether ether ketone (PEEK) fittings to permit column reuse. • Inert HPLC tubing • ASTM type 2 water (ASTM, 2011) or other types of high purity laboratory water • pH meter • 0.01 M NaOH and 0.1 M HCL solution (pH adjustment) • Environmental chamber for maintaining temperature • 1 L glass, pre-cleaned bottles that are either amber or covered with foil • 25 mL glass, pre-cleaned bottles that are either amber or covered with foil • Internal standard(s) • Quantitation standard(s)
10.8. Experimental Design:
10.8.1. Sample Preparation Procedure For reproducible results, polymers should be ground to a standard size range. The particle size range of ground polymers should be recorded. A particle size range of 53 to 300 µm is suggested. This will enhance the surface-to-volume ratio, providing for a more consistent basis for testing different polymers. Most polymers are flexible, making grinding by common techniques impossible. Thus cryogenic grinding (e.g Retsch Cryomill) should be used to reduce polymer sample size prior to testing. Due to the deformability and agglomerization of polymer particles an instrument that uses an air jet to disperse particles (e.g. Retsch Jet Sieve) is recommended for separating particles into the desired size class.
Surface areas of particles should be determined by the BET (Brunauer, Emmett and Teller) approach. This method is based on the amount of adsorbate gas (typically nitrogen) that forms a monomolecular layer on the particle surface at liquid nitrogen temperatures (Bart, 2005; http://www.particletechlabs.com/services/surface-area-and-pore-size-analysis). The specific surface area result is expressed in units of area per mass of sample (m2/g).

Page 92
This protocol uses a Retsch CryoMill (or similar, Figure 29) for sample grinding, followed by sieving for selecting 50 – 300 um particles using a Retsch AS200 air jet sieving machine (or similar) suitable for sieving low density polymers as illustrated in Figure 30.
The general steps for the sample preparation procedure are: a) Measure the starting concentration of chemical substance in the solid, prior to test. b) Grind the sample. Ensure at least 1 gram or more of sample is available. c) Determine the surface area of the particles through the BET approach. d) Repeat the measurement 3 times
More specific example steps for sample preparation are provided as an example below.
a) Measure the starting concentration of chemical substance in the solid, prior to test. b) Grind or cut sample. Ensure at least 1 gram or more of sample is available. c) Tighten the lid on grinding jar and begin the cryogenic grinding, ensuring that liquid nitrogen
at -196 OC is circulating through the system throughout the grinding process. d) Transfer the ground sample from the jar into the air jet sieving machine set to retain 3 the
particle fraction within the size range of 53 to 300 µm. e) Repeat the grinding and sieving process, compositing the grindings into a single aliquot until
0.5 g of sieved sample is retained. f) Place composited samples pre-cleaned tubes overnight and dry/degas at 650C under
nitrogen flow. g) Following the instructions for the BET surface area analyzer, measure the surface area using
a 10-point curve with the relative pressure (of the absorbate to the saturated pressure of the adsorptive) from 0.05 to 0.5.
h) Repeat each measurement 3 times, refilling liquid nitrogen prior to analyzing each sample.
Figure 29. Retsch Cryomill uses liquid nitrogen to embrittle polymer samples.
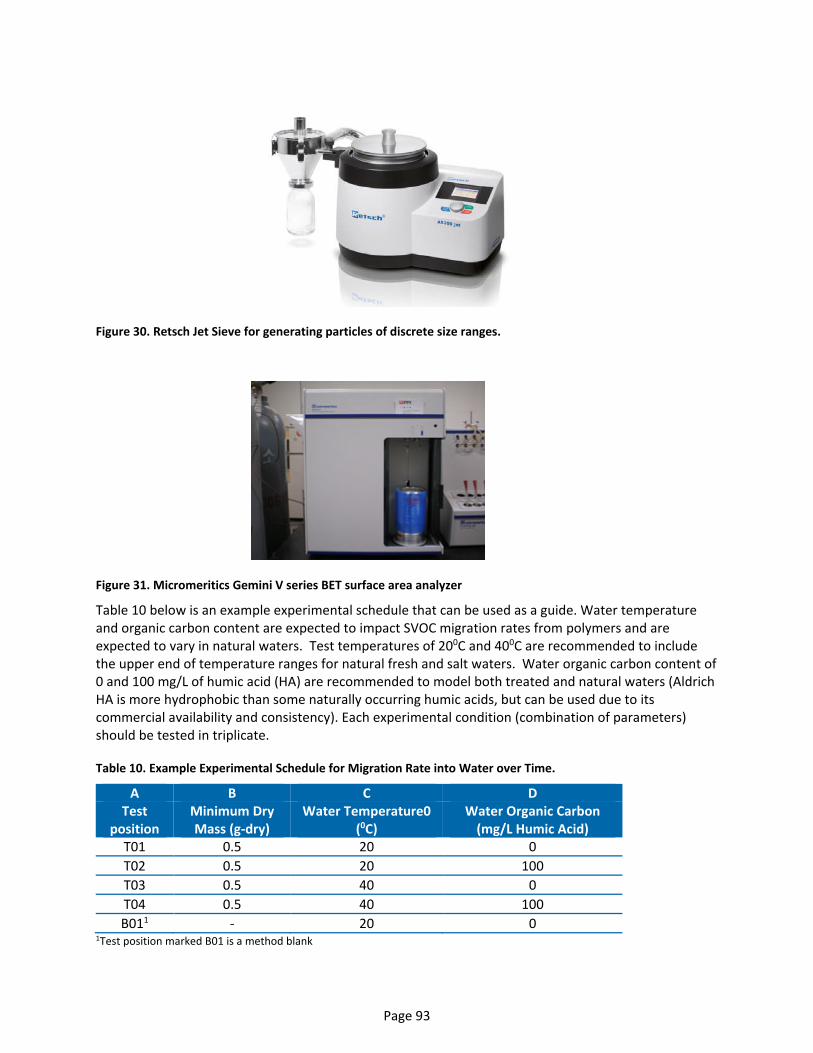
Page 93
Figure 30. Retsch Jet Sieve for generating particles of discrete size ranges.
Figure 31. Micromeritics Gemini V series BET surface area analyzer
Table 10 below is an example experimental schedule that can be used as a guide. Water temperature and organic carbon content are expected to impact SVOC migration rates from polymers and are expected to vary in natural waters. Test temperatures of 200C and 400C are recommended to include the upper end of temperature ranges for natural fresh and salt waters. Water organic carbon content of 0 and 100 mg/L of humic acid (HA) are recommended to model both treated and natural waters (Aldrich HA is more hydrophobic than some naturally occurring humic acids, but can be used due to its commercial availability and consistency). Each experimental condition (combination of parameters) should be tested in triplicate.
Table 10. Example Experimental Schedule for Migration Rate into Water over Time.
A B C D Test
position Minimum Dry Mass (g-dry)
Water Temperature0 (0C)
Water Organic Carbon (mg/L Humic Acid)
T01 0.5 20 0 T02 0.5 20 100 T03 0.5 40 0 T04 0.5 40 100 B011 - 20 0
1Test position marked B01 is a method blank

Page 94
10.8.2. General Leaching Test Procedure A diagram of the equipment and materials to be used in the leachate generation experiments is shown in Figure 32.
Figure 32. General Migration rate into Water test apparatus
The general steps for this procedure are:
a) Bake sand in a muffle oven at 4500C overnight (> 12 hours) to remove moisture and organic matter (Quikrete pool filter grade; 400-800 µm/20-50 mesh or equivalent); further clean sand by extraction with methylene chloride.
b) Mix 1 g of ground polymer with 8 g clean sand. Extremely hydrophobic test chemicals may require the use of greater amounts of polymer per column to generate a detectable chemical concentration in the aqueous effluent. If needed, increase polymer loading in column (while decreasing sand loading) achieve measureable effluent concentrations.
c) Pack stainless steel column (e.g., HPLC column; 250 x 10 mm) with 0.2 g clean sand, followed by the polymer sand mixture and top with 0.2 g clean sand. Use polyether ether ketone (PEEK) fittings to permit column reuse and a stainless steel frit to retain the polymer/sand mixture. The use of this frit is important to prevent particles from escaping the column. The frit should be smaller than the particle size of the prepared ground or cut polymer sample- for example, 2 to 10 µm. Most chemical additives are expected to be present in a polymer at high concentrations relative to the water solubility of the chemical. The range of water solubility values for the chemical should be compiled and considered. A new column frit/filter should be used prior to each experiment.
d) Adjust the pH of the water to 7 with 0.01 M NaOH or 0.1 M HCl.

Page 95
e) Maintain water temperature by placing the column and a loop of stainless steel tubing inside an environmental chamber (e.g. Associated Environmental System LH6) capable of maintaining temperature within +/- 1OC.
f) Connect the pump, column and eluent reservoir with stainless steel tubing. g) Deliver water to the column using a commercially available pump (e.g., Waters 600 HPLC
pump) that possesses an inert fluid pathway. h) Establish a water flow rate. A flow rate of 1.0 mL/min through the HPLC column is
recommended. Report the water flow rate. i) Collect eluent in 1 L glass, pre-cleaned bottles that are either amber or covered with foil to
prevent possible additive photo-oxidation. j) Collect 10 mL samples using a sample collection schedule. A sample collection schedule is
shown in Table 11. Samples are collected by diverting the flow to 25 mL glass, pre-weighed, pre-cleaned bottles that are either amber or covered with foil to prevent possible additive photo-oxidations.
k) Weigh 25 mL bottles after sample collection to the nearest 0.01 g. l) Add surrogate standard to each column eluate sample. m) Extract each sample with methylene chloride or a suitable solvent. n) Reduce each sample to 0.5 mL under a stream of high purity nitrogen. o) Add internal quantitation standard to prepare for analysis.
Table 11. Sample Collection Schedule for Migration Rate into Water over Time.
A B C Sample name Sample collection
start time Sample collection end time
1 hr 55 min 65 min 2 hr 115 min 125 min 5 hr 295 min 305 min
1 day 24hr 24hr 10min 2 day 48 hr 48hr 10min 3 day 72 hr 72hr 10min 4 day 96 hr 96hr 10min 5 day 120 hr 120hr 10min 6 day 144 hr 144hr 10min 7 day 168 hr 168hr 10min
10.8.3. Analytical Procedure This protocol covers a wide range of chemical substances leaching from samples, which require different analytical methods. Depending on the chemical, analyzing both the solid and aqueous phase of the chemical may be of interest. If both phases are analyzed, both phases should be reported. Table 9 provides a list of EPA analytical methods for various chemicals.

Page 96
10.8.4. Calculations of leaching rate and mass migrated
Calculation of Leaching Rate The leaching rate of the chemical of concern at given time t during the test is calculated from Equation 10-2: 𝑅𝑅𝑂𝑂(𝑡𝑡) = 𝑦𝑦(𝑡𝑡) × 𝑄𝑄 (10-2) where RL(t) = leaching rate at elapsed time t (mg/h) y(t) = chemical concentration in water sample collected at time t (mg/L) Q = water flow rate (L/h).
Area-specific Leaching Rate The area-specific leaching rate at elapsed time t is calculated from Equation 10-3:
𝐴𝐴𝑂𝑂(𝑡𝑡) = 𝑅𝑅𝑂𝑂(𝑑𝑑)𝑆𝑆
(10-3) where AL(t) = area-specific leaching rate at elapsed time t (mg/m2/h) S = surface area of solid sample exposed to the eluent (m2).
Cumulative Mass Leached from Solid Sample If n water samples are collected during the leaching test and the results are (t1, y1), (t2, y2), … (tn, yn), the cumulative mass of chemical dissolved between elapsed time zero and t can be calculated from Equation 10-4:
𝐺𝐺(𝑡𝑡) = 𝑄𝑄∑ (𝑦𝑦𝑖𝑖+1+ 𝑦𝑦𝑖𝑖) × (𝑑𝑑𝑖𝑖+1− 𝑑𝑑𝑖𝑖)2
𝑖𝑖−1𝑖𝑖=1 (10-4)
where W(t) = cumulative mass leached from solid sample at elapsed time t (mg) Q = water flow rate (L/h) yi, yi+1 = chemical concentrations in water samples i and i+1 (mg/L) ti, ti+1= sampling times for water samples i and i+1 (h). For example, the cumulative mass dissolved at elapsed time t3 is
𝐺𝐺(𝑡𝑡3) = 𝑄𝑄 (𝑦𝑦2+ 𝑦𝑦1) × (𝑑𝑑2− 𝑑𝑑1) + (𝑦𝑦3+ 𝑦𝑦2) × (𝑑𝑑3− 𝑑𝑑2) 2
(10-5)
Cumulative Mass Release The cumulative mass released of the chemical of concern is the mass of the chemical dissolved in the aqueous phase during the leaching test (EPA method 1315), expressed in (mg chemical/kg dry solid material), as shown in Equation 10-6:
𝑚𝑚(𝑡𝑡) = 𝑊𝑊(𝑑𝑑)𝑊𝑊𝑠𝑠
(10-6)
where m(t) = mass release at elapsed time t (mg/kg)
W(t) = cumulative mass leached from solid sample at elapsed time t (mg), from Equation 3.
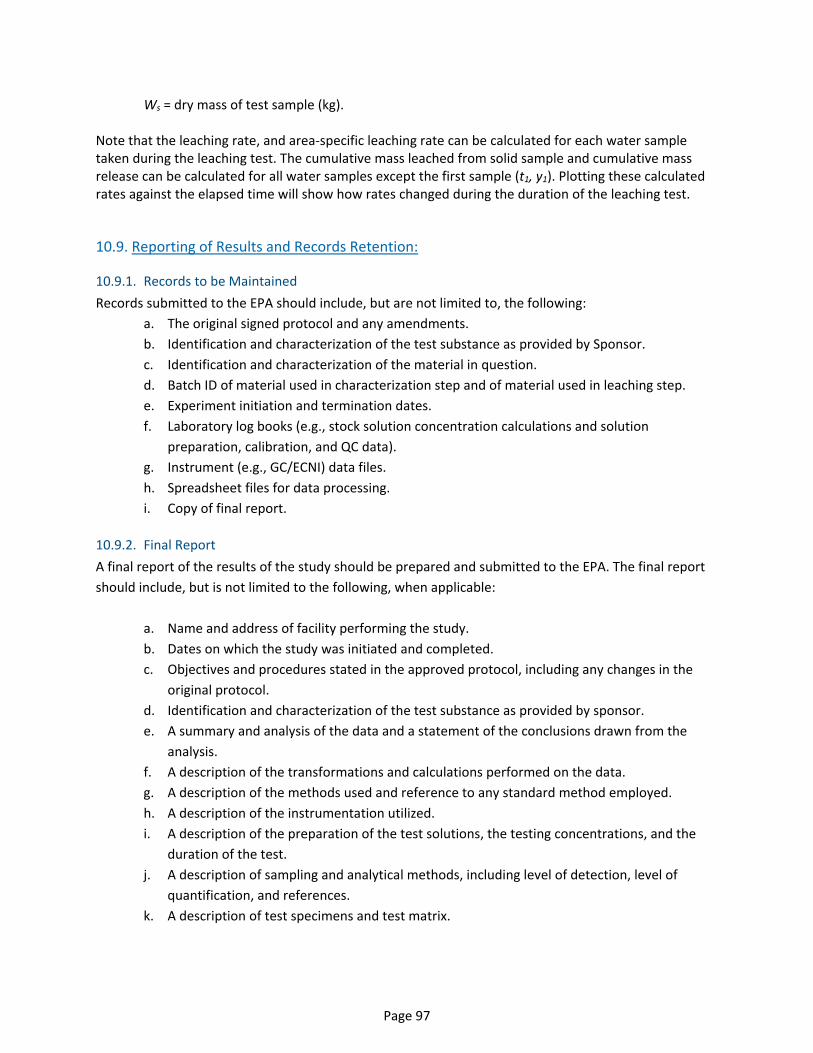
Page 97
Ws = dry mass of test sample (kg). Note that the leaching rate, and area-specific leaching rate can be calculated for each water sample taken during the leaching test. The cumulative mass leached from solid sample and cumulative mass release can be calculated for all water samples except the first sample (t1, y1). Plotting these calculated rates against the elapsed time will show how rates changed during the duration of the leaching test.
10.9. Reporting of Results and Records Retention:
10.9.1. Records to be Maintained Records submitted to the EPA should include, but are not limited to, the following:
a. The original signed protocol and any amendments. b. Identification and characterization of the test substance as provided by Sponsor. c. Identification and characterization of the material in question. d. Batch ID of material used in characterization step and of material used in leaching step. e. Experiment initiation and termination dates. f. Laboratory log books (e.g., stock solution concentration calculations and solution
preparation, calibration, and QC data). g. Instrument (e.g., GC/ECNI) data files. h. Spreadsheet files for data processing. i. Copy of final report.
10.9.2. Final Report A final report of the results of the study should be prepared and submitted to the EPA. The final report should include, but is not limited to the following, when applicable:
a. Name and address of facility performing the study. b. Dates on which the study was initiated and completed. c. Objectives and procedures stated in the approved protocol, including any changes in the
original protocol. d. Identification and characterization of the test substance as provided by sponsor. e. A summary and analysis of the data and a statement of the conclusions drawn from the
analysis. f. A description of the transformations and calculations performed on the data. g. A description of the methods used and reference to any standard method employed. h. A description of the instrumentation utilized. i. A description of the preparation of the test solutions, the testing concentrations, and the
duration of the test. j. A description of sampling and analytical methods, including level of detection, level of
quantification, and references. k. A description of test specimens and test matrix.

Page 98
l. A description of the test results including measured values for individual chemicals of interest for each matrix.
m. A description of all circumstances that may affect the quality or integrity of the data. n. The name of the study director, the names of other scientists or professionals, and the
names of all supervisory personnel involved in the study. o. The signed and dated reports of each of the individual scientists or other professionals
involved in the study, if applicable. p. The location where the raw data and final report are to be stored. q. A statement prepared by the Quality Assurance Unit listing the types of instrumental
inspections, calibration certifications, the dates that the study inspections were made and the findings reported to the Study Director and Management.
r. A copy of all raw data including but not limited to instrumentation output, lab notebooks, and data sheets, etc.
Specific data that should be reported includes:
a. Date and time at the start of the test. b. Name of the solid material. c. Experimental conditions, including water pH and temperature. d. Ambient temperature during migration. e. Concentration of chemical substances (leachables) in each leachate collection. f. Time of each leachate collection. g. Concentration of chemical substances (leachables) in the starting material.
The minimum set of data that should be reported for each leachate includes:
a. Leachate sample ID. b. Target L/S (mL/g-dry). c. Mass of "as tested" solid material used (g). d. Moisture content of material used (gH2O/g) (if moisture content of sample >10%). e. Volume of extractant used (mL). f. Measured final leachate pH. g. Concentrations of target leachables in leachate. h. Time of collection of leachate. i. Analytical QC qualifiers as appropriate.
10.9.3. Changes to the Final Report If it is necessary to make corrections or additions to the final report after it has been accepted, such changes should be made in the form of an amendment issued by the Study Director. The amendment should clearly identify the part of the study that is being amended and the reasons for the alteration. Amendments should be signed and dated by the Study Director and Laboratory Quality Assurance Officer.

Page 99
10.9.4. Changes to the Protocol Planned changes to the protocol should be in the form of written amendments signed by the Study Director and approved by the sponsor’s representative and submitted to EPA using procedures in 40 CFR 790.50. Amendments should be considered as part of the protocol and should be attached to the final protocol. Any other changes should be in the form of written deviations signed by the Study Director and filed with the raw data. All changes to the protocol should be indicated in the final report. Changes to the test standard require prior approval from EPA using procedures in 40 CFR 790.55.
10.10. References:
ASTM (2011). D1193 - 06(2011) — Standard Specification for Reagent Water. https://www.astm.org/Standards/D1193.htm
ASTM. (2014) Method D4874. Standard Test Method for Leaching Solid Material in a Column Apparatus. http://www.astm.org/Standards/D4874
EPA. (2012) Method 1316. Liquid Solid Partitioning as a Function of Liquid-to-Solid Ratio in Solid Materials Using a Parallel Batch Procedure. https://www.epa.gov/sites/production/files/2015-12/documents/1316.pdf
Bart, C.J. 2005. Additives in Polymers: Industrial Analyses and Applications. John Wiley & Sons Ltd. West Essex, England. 819 p.
Appendix 10-A. Migration into Water Liquid to Solid Ratio Samples must be dried if the moisture content of sample is greater than 10%. A drying oven should be used to determine the solids content of the solid material. A small amount of sample (typically 5-10 grams) should be dried at 105±2 ⁰C for at least 24 hours until it is at constant mass. Equation 10A-1 is then used to calculate the solids content:
𝑆𝑆𝐶𝐶 = 𝑀𝑀𝑑𝑑𝑑𝑑𝑑𝑑
𝑀𝑀𝑜𝑜𝑡𝑡𝑠𝑠𝑜𝑜 [10A-1]
Where: SC = solids content of “as-tested” material (g-dry/g) Mdry = mass of dry material specified in the method (g-dry) Mtest = mass of "as-tested" solid equivalent to the dry-material mass (g)
Oven-dried samples should be properly discarded and not used for subsequent steps. The moisture content is then calculated using Equation 10A-2.
𝑀𝑀𝐶𝐶𝑤𝑤𝑒𝑒𝑑𝑑 = 𝑀𝑀𝑜𝑜𝑡𝑡𝑠𝑠𝑜𝑜−𝑀𝑀𝑑𝑑𝑑𝑑𝑑𝑑
𝑀𝑀𝑜𝑜𝑡𝑡𝑠𝑠𝑜𝑜 [10A-2]
Where:
MCwet = moisture content on a wet basis (gH2O/g) Calculate and record the amount of "as-tested" material equivalent to the dry mass in Column D of Table 8 using Equation 10A-3:

Page 100
𝑀𝑀𝑑𝑑𝑒𝑒𝑀𝑀𝑑𝑑 = 𝑀𝑀𝑑𝑑𝑑𝑑𝑑𝑑
𝑆𝑆𝐶𝐶 [10A-3]
Where: SC = solids content of “as-tested” material (g-dry/g)
Calculate and record the volume of moisture contained in the "as tested" sample in Column E of Table 1 using Equation 10A-4 :
𝑉𝑉𝑊𝑊,𝑀𝑀𝑀𝑀𝑇𝑇𝑠𝑠𝑠𝑠𝑒𝑒 = 𝑀𝑀𝑜𝑜𝑡𝑡𝑠𝑠𝑜𝑜 ×(1−𝑆𝑆𝐶𝐶)𝜌𝜌𝑤𝑤
[10A-4]
Where: VW, sample = volume of water in the “as tested” sample (mL) Ρw = density of water (1.0 g/mL at room temperature)
Calculate and record the volume of reagent water needed to bring each leaching experiment to the target L/S in Column F of Table 8 using Equation 10A-5:
𝑉𝑉𝑅𝑅𝑊𝑊 = 𝑀𝑀𝑑𝑑𝑟𝑟𝑦𝑦 × 𝐿𝐿𝑆𝑆 − 𝑉𝑉𝑊𝑊,𝑀𝑀𝑀𝑀𝑇𝑇𝑠𝑠𝑠𝑠𝑒𝑒 [10A-5] Where:
VRW = volume of reagent water needed to complete L/S (mL) LS = liquid-to-dry-solid ratio (mL/g)