Embed Size (px)
Citation preview

Indoor Air Quality in Rural Chinese Kitchens & Village-Scale Clean Energy Interventions
Susan Fischer, Ph.D.California Air Resources Board
31 July 2007

Acknowledgements• USA: Catherine Koshland (UC Berkeley), John Young
(Oregon State), Kathie Hammond (UCB), Kirk Smith (UCB), Bob Spear (UCB); Eric Larson (Princeton), Don Lucas (LBL)
• CHINA: Wang GuangZhi, Zhang ZiLiang
• $: Berkeleyan Graduate Fellowship, Roselyn Lindheim Award, UC Toxics Substances Research and Training Program (TSR&TP), National Institutes of Environmental Health Sciences (NIEHS) Superfund Basic Research Training Core Fellowship, Princeton University, Wood-Calvert Chair (UCB) in Engineering

Outline
• Rural indoor air quality: global perspective
• Field research in Jilin province, China– Use of nephelometer in rural field setting– Characterization of indoor air quality and driving
factors– Case study: three village-scale clean energy
interventions

Indoor air quality: a global perspective
• > 3 billion people exposed to pollution from solid fuel combustion indoors1
• Solid fuel stoves in China 2-3 orders of magnitude dirtier than gas-burning stoves2
• 2-3 orders of magnitude greater inhalation intake per unit emission, indoor vs. outdoor sources3
1. World Health Organization (WHO), “Indoor Air Pollution.” http://www.who.int/indoorair/en/2. J. Zhang et al. (2000), Greenhouse gases and other airborne pollutants from household stoves in China: a
database for emission factors, Atmospheric Environment 34, 4537-4549.3. K. R. Smith (1988), Air pollution: assessing total exposure in developing countries, Environment 30, 17.

Global exposures to PM
Source: Kirk Smith (2006). PH200C Introduction to Environmental Health Sciences, UC Berkeley. “General Concepts” Lecture Slides.
0
10
20
30
40
50
60
70
Urban Rural Urban Rural
Developed Developing
Perc
ent o
f Tot
al
IndoorOutdoor
50.5 1
0.1
21
9
58
5
… most human exposures to particles are inside rural homes

Global health burden from indoor air pollution from solid fuels
• >1.6 million deaths per year
• 2.7% of global disease burden (aggregate measure of morbidity and mortality)
• second largest environmental risk factor
Source: World Health Organization (WHO). The world health report 2002: reducing risks, promoting healthy life. http://www.who.int/whr/2002/en

Jilin Jilin ProvinceProvince

raw bituminous coaltwo solid fuel stoves
(…in the living room: heavy smokers, possibly another stove)
Typical Kitchen in Jilin province, China

Research focus #1Can a portable nephelometer* be used
to measure PM in rural kitchens?
• Time-resolved data needed to characterize exposures and health effects
• Aerosols in rural kitchens highly variable in terms of chemical content, size, relative humidity
• Previous field validations explore relatively low PM concentrations (PM2.5 < ~40µg/m3)
• Previous laboratory validations focus on single-source situations
*Instrument to determine particle concentration via light-scattering
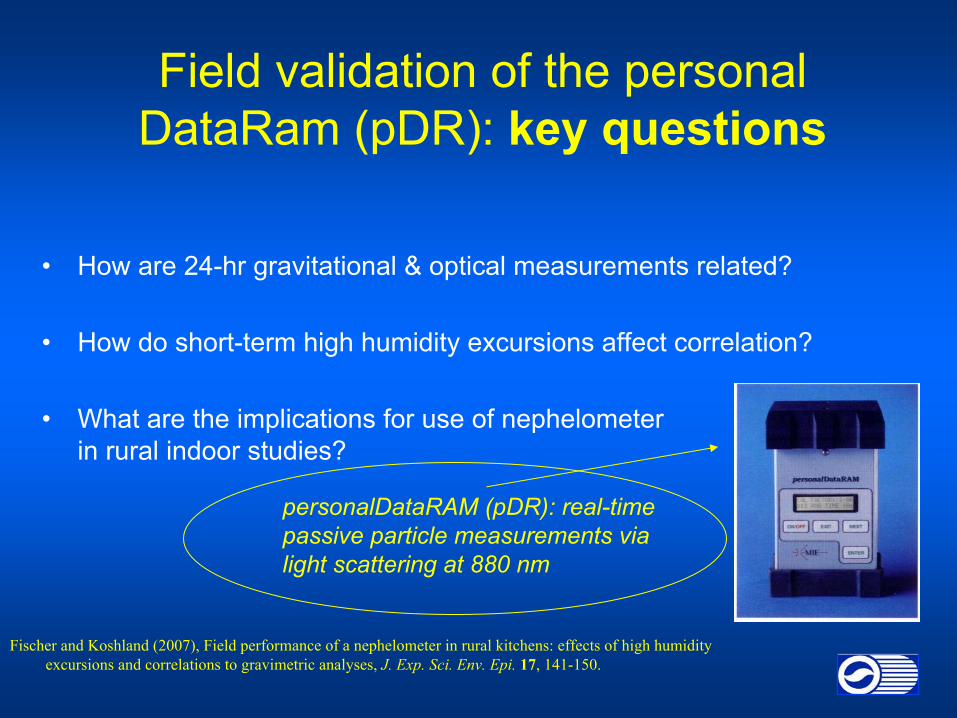
Field validation of the personal DataRam (pDR): key questions
• How are 24-hr gravitational & optical measurements related?
• How do short-term high humidity excursions affect correlation?
• What are the implications for use of nephelometer in rural indoor studies?
personalDataRAM (pDR): real-time passive particle measurements via light scattering at 880 nm
Fischer and Koshland (2007), Field performance of a nephelometer in rural kitchens: effects of high humidity excursions and correlations to gravimetric analyses, J. Exp. Sci. Env. Epi. 17, 141-150.

Sample• 65 household-days nephelometer & RH data
Full range of fuel/stove types, cooking styles, tobacco smoking & heating practices in 224 village homes.
• 23 household-days of gravitational measurements• Opportunistic sampling from indoor environments
dominated by single particle sources:– heavy tobacco smoking (n=4)– coal-burning stove used for boiling water (n=2)– lab-simulated coal-burning fire pit (n=2)– non-smoking room in rural Chinese hotel (n=4)
1 household and 2 heavy smoking samples CENSORED due to power failure and tampering with equipment.

Level n response ratio,
(geometric mean (GSD))
kitchen with RH<95% (1-min. resolution) 16 2.13 (1.47) kitchen with high RH (>95%) excursion 6 7.40 (4.66) village office with heavy smoking (8-hr.) 2 27.1 (1.55) solid-fuel coal stove for boiling water 2 0.78 (1.03) laboratory mock coal fire pit, water boiling, (1.5 hr.) 2 0.91 (1.23) non-smoking hotel room, Yanbian, China 4 2.30 (1.14) whole-model test statistics: (Prob>F) <0.0002, r2=0.59, n=32
Results: Variable optical response ratios between microenvironments
OBSERVED RATIOS OF OPTICAL (factory calibration) TO GRAVITATION-AL PARTICLE READINGS: Means and standard errors of mass concentration ratios of nephelometrically determined PM to gravitational RSP.
highly significant test statistics
samples plagued by condensation

Results: Insignificant correlation between optical & gravitational PM, full dataset
r2=0.12, Prob>F = 0.113, n=22
the best-fit line isvery, very poor…
0
500
1000
1500
2000
2500
3000
3500
4000
0 100 200 300 400 500 600 700 800
gravitational RSP (micro-g/m3)
optic
al P
M (m
icro
-g/m
3 )

… but 6 (of 22) samples experienced high-humidity (>95% RH) excursions!
0
500
1000
1500
2000
2500
3000
3500
4000
0 100 200 300 400 500 600 700 800
gravitational RSP (micro-g/m3)
optic
al P
M (m
icro
-g/m
3 )

0
200
400
600
800
1000
1200
1400
1600
0 100 200 300 400 500 600 700 800
gravitational RSP (micro-g/m3)
optic
al P
M (m
icro
-g/m
3 )Results: Excluding high-humidity
samples reveals a strong correlationexcellent correlation!
r2=0.92, Prob>F < 0.0001, n=16
optical PM = 21 µg/m3 + 2.1 grav-RSP

0
200
400
600
800
1000
1200
1400
1600
0 100 200 300 400 500 600 700 800
gravitational RSP (micro-g/m3)
optic
al P
M (m
icro
-g/m
3 )Results: But factory calibration of the
nephelometer overestimates by factor 2
optical PM = 21 µg/m3 + 2.1 grav-RSP

Results: No correlation between optical & gravitational in condensing environments
r2=0.019, Prob>F = 0.79, n=6
0
500
1000
1500
2000
2500
3000
3500
4000
0 100 200 300 400 500 600 700 800gravitational RSP (micro-g/m3)
optic
al P
M (m
icro
-g/m
3 )

ARITHMETIC GEOMETRIC 24-hour average
PM (mg/m3) 24-hr. median PM (mg/m3)
24-hour average PM (mg/m3)
24-hr. median PM (mg/m3)
censored (n= 43) 0.312 (0.039) 0.164 (0.032) 0.233 (2.2) 0.099 (2.9) uncensored (n=58) 0.521 (0.07) 0.148 (0.024) 0.333 (2.7) 0.096 (2.6) 2-way ANOVA: Prob > F, r2
0.0019, 0.13 0.48, 0.007 0.0011, 0.14 0.88, 0.0003
SUMMARY STATISTICS, CENSORED & UNCENSORED: Summary statistics as arithmetic mean (standard error) and as geometric mean (geometric standard deviation), with ANOVA results for optically determined PM (calibrated to gravimetric RSP). Both arithmetic and geometric means are distorted if samples in which relative humidity exceeds 95% are not censored.
Results: Inclusion of high-humidity samples distorts summary statistics

Conclusion: nephelometers promising, but must be used with caution
• Factory calibration overestimates by factor 2 in this setting
• High-humidity samples or dense, poorly mixed plumes create nonsystematic optical distortion
• Conventional measures of central tendency sensitive to distortion when high-humidity samples are not censored
• Previously published rural field work that does not account for humidity excursions or perform gravimetric calibration should be regarded with caution

Research focus #2Indoor air quality and driving factors
in a rural Chinese village
• Time-resolved CO and PM data enable characterization of peak pollution periods.
• Diversity of fuels within single village facilitate investigation of fuel- and stove-related factors as well as tobacco smoking as determinants of indoor air pollution.
Fischer and Koshland (2007), Daily and Peak 1 h Indoor Air Pollution and Driving Fcactors in a Rural Chinese Village, Environ. Sci. & Tech. 41, 3121-3126.

Results: Kitchen-area particle concentrations
daily average PM 1-h peak PM
PM
(mg/
m3 )
0
2
4
6
8
mean(se)=1.88(0.25), GM(GSD)=1.26 (2.6)median(IQ range)=1.25 (0.546-2.50), n=43
mean(se)=0.312(0.039)GM(GSD)=0.233 (2.2)
median(IQ range)=0.250(0.145-0.386)n=43
China’s 24-h PM10standard: 0.15 mg/m3 Canada’s 1-h indoor PM10
guideline: 0.10 mg/m3
Peak 1-h RSP is six-fold higher than daily average RSP (n=43). Mean daily particle concentration exceeds China’s residential indoor PM10 standard by a factor of two, and peak RSP is nearly twenty times greater than Canada’s 1-h guideline for PM10.
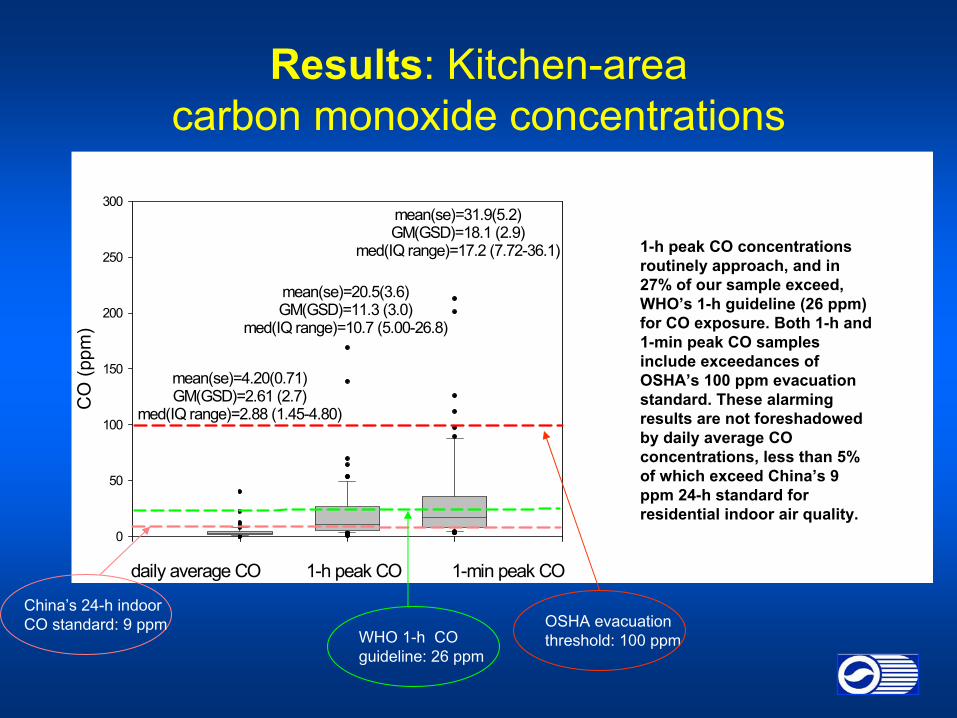
Results: Kitchen-area carbon monoxide concentrations
daily average CO 1-h peak CO 1-min peak CO
CO
(ppm
)
0
50
100
150
200
250
300
mean(se)=20.5(3.6)GM(GSD)=11.3 (3.0)
med(IQ range)=10.7 (5.00-26.8)
mean(se)=4.20(0.71)GM(GSD)=2.61 (2.7)
med(IQ range)=2.88 (1.45-4.80)
mean(se)=31.9(5.2)GM(GSD)=18.1 (2.9)
med(IQ range)=17.2 (7.72-36.1)
WHO 1-h CO guideline: 26 ppm
OSHA evacuationthreshold: 100 ppm
China’s 24-h indoor CO standard: 9 ppm
1-h peak CO concentrations routinely approach, and in 27% of our sample exceed, WHO’s 1-h guideline (26 ppm) for CO exposure. Both 1-h and 1-min peak CO samples include exceedances of OSHA’s 100 ppm evacuation standard. These alarming results are not foreshadowed by daily average CO concentrations, less than 5% of which exceed China’s 9 ppm 24-h standard for residential indoor air quality.

Results: Key factors related to indoor air quality
Ξ Wilcoxin/Kruskall-Wallis test reported in parentheses where different.
Use of solid fuel for cooking is associated with cleaner airin this sample, since villagers use improved fuels as an additional resource rather than as substitute for solid fuels.
Tobacco smoke is a significant predictor
of peak & daily measuresof RSP, but with lesser
effect than choice of cooking fuel.
At this site, heating with wood fuel is associated with significantly higher daily RSP
concentrationsthan heating
with coal.
Statistically Significant Factors (α=0.05)
factor groups (cleanest listed first) IAQ measure differential significance Ξ
24-h PM 0.29 mg/m3 0.04 (<0.0001)
peak 1-h PM 1.9 mg/m3 0.03
24-h CO 5.2 ppm 0.02 (0.07)
primary cooking fuel
solid, improved (electricity, LPG, producer gas)
peak 1-h CO 19 ppm 0.02
24-h PM 0.20 mg/ m3 0.003smoking status no, yes
peak 1-h PM 0.9 mg/ m3 0.04
primary heating fuel coal, wood 24-h PM 0.17 mg/ m3 0.04
(<0.0001)
solid fuel stove in living area yes, no 24-h CO 2.9 ppm 0.02

Results: Key factors for which no statistically significant relationship was supported
Physically, but not Statistically Significant Factors
factor groups¶ IAQ measure differentialsample sizeΨ
α=5%, β=90%
24-h CO 4.2–4.5 ppm 50–60
peak 1-h CO ~ 20 ppm 50–60
radiant hot -water heating or
second solid -fuel stove in kitchen
present,
not present1-h peak PM 1 mg/ m 3 ~40
solid fuel stove in living area yes, no peak 1-h CO 14 ppm ~40
24-h CO 1.3 220smoking status non-smoking,
smoking peak 1-h CO 6.1 240
Ψ Based on observed distribution & assuming numbers equally distributed between groups.

Results: Key factors for which no significant relationship was suggested
Factors for which No Significant Relationship Was Observed
factor comments
kitchen volume No differential when stratified by tobacco-smoking
kitchen fully partitioned
Fully partitioned kitchen and living areas well-mixe.d with respect to daily (r2=0.9, p<0.0001) and 1-h peak (r2=0.9, p<0.0001) CO concentrations.
total heating time mean(se)=11.3(1.3) h, range 1.5–24 h
total cooking time mean(se)=92(6) min, range 40–180 min
Structural characteristics
of kitchen do not predict CO or RSP concentrations in this rural Chinese
village.

Conclusions & implications
• Though 24-h CO well within standards, a substantial fraction (27%) of peak 1-h episodes exceed WHO’s 1-h guideline & outliers surpass OSHA’s evacuation threshold. Short-term resolution is critical for characterizing acute risks posed by CO exposures in rural kitchens.
• Adoption of “improved” cooking fuels does not suffice to reduce indoor air pollution where heating dominates fuel use. Health-oriented interventions limited to provision of improved cooking fuel are insufficient in cold climates.

Conclusions & implications, continued
• Kitchen and living areas were well-mixed. In some rural settings, kitchen partitions do not protect people in the living area from acute CO exposures.
• Heating with wood was associated with significantly more 24-h RSP than heating with coal. The differential (0.17 mg/m3) was nearly as pronounced as that between smoking and non-smoking (0.20 mg/m3) households.

Research focus #3Field investigation of village-scale
clean energy interventions
Jilin Province
Yanji City
Yanji CityLongshan
Hechengli Yongcheng

China: a history of rural energy interventions
“This should be well promoted.” – Chairman Mao, 11 April 1958

Producer gas projects in China
• Chinese agricultural residues could supply cooking fuel for 500-600 million people*
• Hundreds of producer gas§ projects supplying 8,000 households in rural China, year 2000
• 17 village-scale producer gas projects in Jilin
* S. L. Fischer (2001), Biomass-derived liquid cooking fuels for household use in rural China: potential for reducing health costs and mitigating greenhouse gas emissions, Energy for Sustainable Development 5, 23-30.
§ Gas from air-blown gasification of biomass. Approximately 50% N2, 20% CO, 15% H2, 10% CO2, 2% CH4

Hechengli Village合成利村

SI Engine Generator
Gas Clean-up
Gasifier
BiomassStorage
Gas Storage
Households& Factories
Gas distribution forcooking, heating & process heat
Electricity to Households & Factories Electricity
to Grid
Engine Exhaust
Auxiliary Power for CHP plant
GrossOutput
Utility Grid
Blower
The Hechengli Village Energy Project


Longshan Village龙山村


In operation since November 16, 2002.

Yongcheng Village勇成村


Conclusions from site visits• Appropriate siting critical to success of factories
• Local capacity to enforce contracts critical
• Project with local leadership fared better than better-funded remotely managed projects set up as demonstrations
• Occupational health concerns not being addressed locally or recognized by provincial/international coordinators

Summary of results• Nephelometer promising with concurrent relative humidity
data and gravitational calibration
• Short-term CO concentrations can exceed guidelines even when 24-h CO is acceptable
• Heating fuel choice, tobacco use important determinants of indoor air quality
• Clean cooking fuel doesn’t suffice to mitigate indoor air pollution in cold wintertime households
• Sound business plan, adequate funding, and “appropriate”technology do not ensure a successful village energy project

Additional research• To support health risk assessment
– Short-term gravitational sampling concurrent with optical– Survey-based approach to assess frequency of rare but
statistically & physically (death) significant CO poisoning
• To support fuel interventions– Social inquiry regarding household fuel choice, energy-
related behaviors– Feedback from village projects to provincial and national
level administrators and policy-makers