Embed Size (px)
Citation preview

Indonesian GHG Inventory: LUCF Sector
Rizaldi Boer
Bogor Agricultural UniversityINDONESIA
E-mail: [email protected] Group of Expert: Hand on Training Workshop on
GHG Inventory organized by UNFCCCShanghai, 8-12 February 2004

Indonesia GHG Inventory: 1994Indonesia GHG Inventory: 1994
Sources and Sinks CO2
UptakeCO2
ReleaseCH4 CO N2O NOx
Energy 373,609 674 6Industrial Processes 19,120 1 0Agriculture 3,244 331 53 19LUCF 403,846 559,471 367 3,214 3 91Waste 402TOTAL 403,846 952,200 4,687 3,545 61 110BIOMASS ENERGY 124,417INT. BUNKER 1,684
Sources and Sinks CO2
UptakeCO2
ReleaseCH4 CO N2O NOx
Energy 373,609 674 6Industrial Processes 19,120 1 0Agriculture 3,244 331 53 19LUCF 403,846 559,471 367 3,214 3 91Waste 402TOTAL 403,846 952,200 4,687 3,545 61 110BIOMASS ENERGY 124,417INT. BUNKER 1,684

Total Emission by Sector: CO2-eq
LUCF25%
Waste1%
Energy 58%Agric.
13%
Industry3%
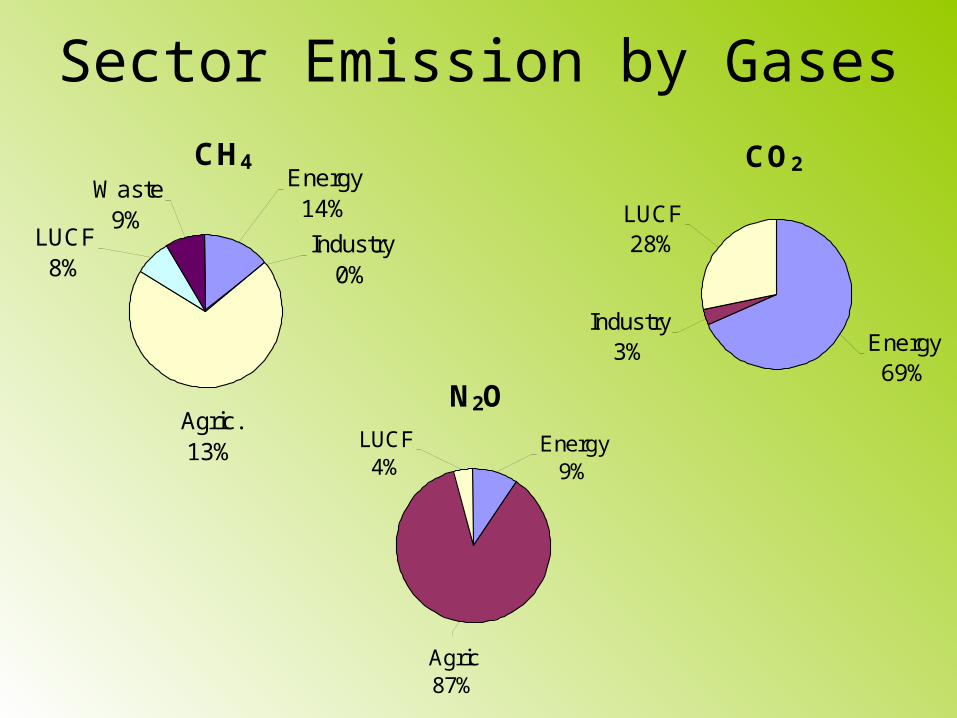
Sector Emission by GasesCO2
Energy69%
LUCF28%
Industry3%
CH4Waste
9%LUCF
8%Industry
0%
Agric. 13%
Energy 14%
N2O
Agric87%
LUCF4%
Energy9%

GHG Inventory: Forestry Sector
0
50000
100000
150000
200000
250000
300000
350000
400000
1985
SEI
1990
US-C
S
1990
ALG
AS
1990
NATC
OM
1991
NATC
OM
1992
NATC
OM
1993
NATC
OM
1994
NATC
OM
1995
NATC
OM
1996
NATC
OM
Ca
rbo
n (
Tg
)Uptake
Release

Main Factors cause the variationsCategory LU Catagories Area
(kha)MAI
(tdm/ha)Plantation Tectona grandis 348 7.70
Acacia spp. 152 14.39Pinus merkusii 352 9.08Swietenia spp. 99 7.97P. falcataria 56 13.56Rimba 235 6.80
Reforestration Pinus mercusii 439 9.08Tectona grandis 199 7.70Acacia spp. 140 14.39Eucalyptus spp. 60 14.00Others 1,157 6.82
Other Forests Production Forest 44,022 0.87Conversion Forest 30,787 0.06Protec./Cons. Forest 48,802 0.00
Afforestration Pinus spp. 1,196 9.08Acacia spp. 1,021 14.39Eucalyptus spp. 758 14.00P. falcataria 1,138 13.56Others 394 6.82
Selection of MAI for the succession forest. Estimated from [(WVVF-WVLOF)* BEF*BD]/30. In Indonesia MAI of LOF varied from 1.2-2.7 tB/ha)
Area of production and conversion forest under succession
Assumption of survival rates of A and R (NAtCOM used 100%)

0
5,000,000
10,000,000
15,000,000
20,000,000
25,000,000
30,000,000
35,000,000
40,000,000
Tahun
Log
Pro
duct
ion
(m3)
0
200,000
400,000
600,000
800,000
1,000,000
1,200,000
1,400,000
1,600,000
Har
vest
ing
(Ha)
Log Production
Harvesting
0
5,000,000
10,000,000
15,000,000
20,000,000
25,000,000
30,000,000
35,000,000
40,000,000
Tahun
Log
Pro
duct
ion
(m3)
0
200,000
400,000
600,000
800,000
1,000,000
1,200,000
1,400,000
1,600,000
Har
vest
ing
(Ha)
Log Production
Harvesting
Log Production & Area of HarvestingLog Production & Area of Harvesting
Area under succession was logged over forest (LOF). If LOF data for a given year is not available, it was estimated from log production
data (the logged area is log production divided by 20 m3)
Log over forest map

Deforestation Rate (000 ha)Deforestation Rate (000 ha)
SourceActivity WB
(1990)FAO
(1990)TAG
(1991)Dick
(1991)MoF
(1992)MoF
(1996)Forest
Database(1998)
Transmigrationdevelopment
300 65 78 300 100-150 146.4
Estate development 250 274 11.5 11 160 200-250Swamp development 85 30.4 30Spont. Transmigration 500 461 156.5 179 300Shifting cultivation 135 200-300 151.0Illegal Logging 80 80 NEa 120 77 27.2Forest Fires 70 113 NEa 70 478b 161.8Agriculture 350 234.8TOTAL 900 1315 262.9 623 1315 900-950 721.2
a. NE : not estimated, b. Fire damage average excluding Kalimantan fire. Transmigration is relocation ofpeople particularly from Java to other islands in Indonesia organized by the government, while spontaneoustransmigration is organized by transmigrants.
Available data only for 1970S, 1980S and 1990s, average G&F conversion for 25 years = (Def70s+Def80s+Def90s)/3 ~ proportion similar to FAO 1990

Fraction of biomass burnt on and off site and decay
Conversion Area Fraction biomass on site
Fraction biomass off site
Fraction left to decay
Trasmigration 0.30 0.20 0.50Agriculture 0.30 0.20 0.50Shifting Cultivation 0.50 0.30 0.20
Conversion Area Fraction biomass on site
Fraction biomass off site
Fraction left to decay
Trasmigration 0.30 0.20 0.50Agriculture 0.30 0.20 0.50Shifting Cultivation 0.50 0.30 0.20

Abandoned Land
• Area being abandoned are three categories:– Area of abandoned land was
• shifting cultivation: 20*mean of SC (1990-1995)• Grassland• Forest fire

Data that need to be improvedData that need to be improved
Priority data domains Importance
Converted forest area per forest type 3
Growth rate of forest and vegetation types (including plantations) 3
Forest typology (biomass-based, floristic, ecology, climatic,administrative)
3
Wood harvest (legal + illegal, half-life time by use) 2.5
Biomass of each forest and vegetation type 2.5
Root biomass per vegetation / land use land cover type 2.2
Wood to biomass expansion factor, allometrics 2.2
Abandoned land: area + growth rate (increment) 1.7
Soil C stock (including organic soils + LU impacts) 1.1
On-site (in situ) burning 0.5

CCFPI (Climate Change, Forest and Peatland in Indonesia)
• Develop software for estimating carbon stock change and GHG emission from peatland– Inventory of EF from Peatland– Development of Land Use change model– Development of software– Estimation of C-stock changes and GHG emission
from peatland under current and projected land use (different project scenarios)
• Collaboration Project between Wetland International-Indonesian Program (WI-IP), Bogor Agricultural University and ARCATE Indonesia (Funded by CIDA): 2001-2005

CO2 and CH4 emission from Peatland of South Kalimantan, Indonesia
(a) Upland Crops
050
100150200250300350400450
Dec
-99
Jan-
00
Feb
-00
Mar
-00
Apr
-00
May
-00
Jun-
00
Jul-0
0
Aug
-00
Nov
-00
CO
2 em
issi
on
(m
gC
/m2/
h)
-0.20.00.20.40.60.81.01.21.41.6
CH
4 emissio
n (m
gC
/m2/h
)
Upland CO2
Upland CH4
(b) Rice Paddy
050
100150200250300350400450
Dec
-99
Jan-
00
Feb
-00
Mar
-00
Apr
-00
May
-00
Jun-
00
Jul-0
0
Aug
-00
Nov
-00
CO
2 em
issi
on
(m
gC
/m2/
h)
-0.20.00.20.40.60.81.01.21.41.6 C
H4 em
ission
(mg
C/m
2/h)
Upland CO2
Upland CH4
(c) Secondary Forest
050
100150200250300350400450
Dec
-99
Jan-
00
Feb
-00
Mar
-00
Apr
-00
May
-00
Jun-
00
Jul-0
0
Aug
-00
Nov
-00
CO
2 em
issi
on
(m
gC
/m2/
h)
-0.20.00.20.40.60.81.01.21.41.6 C
H4 em
ission
(mg
C/m
2/h)
Upland CO2
Upland CH4
Source: Hadi et al., 2002

CH4 emission (mgC m-2 h-1)
-0.2 0.1 0.4 0.7 1 1.3 1.6 1.9 2.2
G1G2G3J4J5B6B7B8M9
A10A11A12
• A12: Sec. Forest (. 2m depth)• A11: 2 years rice paddy (1-2
m depth)• A10: 6 years rice-soybean
rotation (0.2-0.4 m depth)• M9:Sec. Forest (0.2-0.6 m
depth)• B8: Sec. Forest (0.05-0.15 m
depth)• B7:3 years cassava (0.7 m
depth)• B6:3 years paddy (0.4-0.5 m
depth)• J5: Sec. Forest (0.15-0.25 m
depth)• J4:1 year paddy (0.05-0.20 m
depth)• G3: Sec. Forest (1-2 m depth)• G2: Rice paddy-fallow (0.1-0.4
m depth)• G1: Upland-fallow (0.7-1 m
depth)
Source: Hadi et al. 2002)
CO2 emission (mgC m-2 h-1)
0 50 100 150 200 250 300
G1G2G3J4J5B6B7B8M9
A10A11A12
Seq. CH4

Effect of flooding on CH4 emission from herbaceous arctic tundra
0
1
2
3
4
Em
issi
on
(m
g/m
2/h
)
Below Surface At Surface Above Surface
CH4 Emissions
Source: Mornsey et al, 1994

Study Site
• Merang Kepahyangan, South Sumatra
• Climate: bi-modal

Inventory of EF from past
studies
Socio-economic survey
Current and projected LULUCF under the
absence and the presence of C-projects
Project scenario (WBS130, 140, 210, 230, 240, 250) and project boundaryEquations that
relate income and energy consumption Impact of projects on
HH income
Image analysis (Physical
predictors)
Data series of socio-economic
Data of CS and MAI (WBS300)
Database EF, Carbon stock
& MAI
Selection of EF, CS and
MAI
Water table of peat with and without
blocking
Water table observation data
(WBS240), and fire risk
Canal blocking
(WBS120, 130)
Calculation of CS change and
emission within project boundary
Leakage estimation
CarbonBenefit
Leakage quantity
Software or estimating CS change and GHG emissions
Map of peat depth and maturity
Peat depth& maturity