Embed Size (px)
Citation preview

Indonesia
Sustainable urban planning and design for Local Governments
Prepared under the project:
Local Renewables: South-
FINAL DRAFT
Indonesia Solar City Guidebook
rban planning and design for Local Governments
Prepared under the project:
-south cooperation between cities in India, Indonesia
and South Africa
May 2013
Prepared by:
ICLEI – SEA
in partnership with
ICLEI – South Asia
Funded by REEEP
rban planning and design for Local Governments
India, Indonesia

FINAL DRAFT
2013 | INDONESIA SOLAR CITY GUIDEBOOK 2
Disclosure Page
ICLEI – Local Governments for Sustainability
ICLEI - Local Governments for Sustainability is the world's leading association of cities and local
governments dedicated to sustainable development. ICLEI is a powerful movement of 12 mega-
cities, 100 super-cities and urban regions, 450 large cities as well as 450 small and medium-sized
cities and towns in 84 countries. ICLEI provides technical consulting, training, and information
services to build capacity, share knowledge, and support local government in the implementation of
sustainable development at the local level. Our basic premise is that locally designed initiatives can
provide an effective and cost-efficient way to achieve local, national, and global sustainability
objectives.
The ICLEI Southeast Asia Secretariat1 collaborates closely with the global ICLEI network and other
regional offices around the world, in sharing tools, materials, strategies and good practices
specifically designed and implemented at the local level. ICLEI Southeast Asia’s key environmental
work streams within the Secretariat include Energy and Climate Change, Disaster Risk Reduction,
Water and Sanitation, Urban Biodiversity and Integrated Urban Planning.
Renewable Energy and Energy Efficiency Partnership (REEEP)
Renewable Energy and Energy Efficiency Partnership (REEEP) is an active global partnership that
structures policy initiatives for clean energy markets and facilitates financing for sustainable energy
projects. The Partnership was established alongside the 2002 World Summit on Sustainable
Development in Johannesburg. Over its ten-year lifespan, REEEP has established itself as a vocal
champion for clean energy – energy efficiency and renewable energy – punching above its weight in
three ways: by funding innovative projects, by providing internet-based information resources, and
by supporting clean energy stakeholders.The organisation is now comprised of 400 partners
including 45 governments as well as a range of private companies and international organisations.
Some 5200 individuals are also registered as Friends of REEEP.
1http://archive.iclei.org/index.php?id=586

Publisher
The material of this publication is copyrighted. Requests to reproduce the material, in part or in full,
should be in writing to the Southeast Asia
ICLEI encourages the active dissemination and use of this report, and permission to reproduce will
usually be granted promptly without charge if the reproduction is for non
The Manila Observatory Building, Ateneo de Manila University, Loyola Heights, Quezon
http://archive.iclei.org/index.php?id=586
FINAL DRAFT
Acknowledgements:
Publisher: ICLEI Southeast Asia, ICLEI South Asia
Copyright:
All rights reserved © ICLEI e.V. 2013
The material of this publication is copyrighted. Requests to reproduce the material, in part or in full,
Southeast Asia Secretariat of ICLEI – Local Governments for Sustainability.
ICLEI encourages the active dissemination and use of this report, and permission to reproduce will
usually be granted promptly without charge if the reproduction is for non-commercial purposes
Further Information:
ICLEI Southeast Secretariat
The Manila Observatory Building, Ateneo de Manila University, Loyola Heights, Quezon
City 1108 Philippines
http://archive.iclei.org/index.php?id=586
The material of this publication is copyrighted. Requests to reproduce the material, in part or in full,
al Governments for Sustainability.
ICLEI encourages the active dissemination and use of this report, and permission to reproduce will
commercial purposes
The Manila Observatory Building, Ateneo de Manila University, Loyola Heights, Quezon

FINAL DRAFT
2013 | INDONESIA SOLAR CITY GUIDEBOOK 4
Contents Disclosure Page ....................................................................................................................................... 2
ICLEI – Local Governments for Sustainability ...................................................................................... 2
Renewable Energy and Energy Efficiency Partnership (REEEP) .......................................................... 2
Terms, Abbreviations and Acronyms: ..................................................................................................... 7
Preface .................................................................................................................................................. 10
The Local Renewables Initiative and Network .................................................................................. 10
About the project ‘Local Renewables: South-south cooperation between cities in India, Indonesia
and South Africa’ ............................................................................................................................... 10
About the Solar City Guidebook for Indonesia ................................................................................. 11
Executive Summary ............................................................................................................................... 12
Chapter 1: Introduction ........................................................................................................................ 13
International perspective of climate change and energy ................................................................. 14
Indonesia perspective on energy and climate change ..................................................................... 16
Energy ........................................................................................................................................... 19
Indonesia’s Commitment for Climate Change .............................................................................. 20
Indonesia’s Carbon Story .............................................................................................................. 20
Indonesia Energy Sector ................................................................................................................... 22
Chapter 2: National and Sub-national Obligations ............................................................................... 26
The Development of Climate Change Policy in Indonesia ................................................................ 26
Indonesia’s National Action Plan (NAP) to Combat Climate Change ................................................ 27
INDONESIA’s PRIORITY SECTORS FOR GHG EMISSION REDUCTION ................................................. 27
Chapter 3: Evolution of the Solar City Concept .................................................................................... 30
Features of international solar city programs .................................................................................. 31
ICLEI Local Renewables Network ...................................................................................................... 41
Chapter 4: Development and Implementation of a Solar City in Indonesia ......................................... 43
Motivation for ‘Solar City’ Program in Indonesia ............................................................................. 43

Activities towards the development of a So
1. Institutional: ................................
2. Baseline Study and City Energy Profile
3. Policy and Strategy Development
4. Activities to implement at the local level
Indicative measures to be taken by Cities towards the develop of a ‘Solar City’
Chapter 5: Indicative RE and EE solutions
Energy Efficient devices ................................
Home Appliances ................................
Lighting ................................
Water Saving ................................
Water Heating ................................
Renewable Energy devices ................................
Photovoltaic ................................
Lighting ................................
Cooking ................................
Water Heating ................................
Potential Photovoltaic Plants in Indonesia
Chapter 6: International financing mechanisms
International financing options and related mechanisms
1. Green or Clean Energy Bonds and Investment Services
2. Carbon Finance ................................
3. Public Finance Mechanisms
4. Energy Certificates ................................
5. Nationally Appropriate Mitigation Action (NAMA) Facility
References ................................................................
FINAL DRAFT
Activities towards the development of a Solar City ................................................................
................................................................................................
Baseline Study and City Energy Profile ................................................................
Policy and Strategy Development ................................................................
Activities to implement at the local level ................................................................
Indicative measures to be taken by Cities towards the develop of a ‘Solar City’
Chapter 5: Indicative RE and EE solutions ................................................................
................................................................................................
................................................................................................
................................................................................................................................
................................................................................................................................
...............................................................................................................................
................................................................................................
................................................................................................................................
................................................................................................................................
................................................................................................................................
...............................................................................................................................
Potential Photovoltaic Plants in Indonesia ................................................................
Chapter 6: International financing mechanisms ................................................................
International financing options and related mechanisms ................................................................
Green or Clean Energy Bonds and Investment Services ................................
................................................................................................
nce Mechanisms ................................................................................................
................................................................................................
Nationally Appropriate Mitigation Action (NAMA) Facility ................................
................................................................................................
.......................................... 43
.......................................................... 43
................................................. 45
......................................................... 47
............................................. 50
............................. 54
............................................................ 55
.................................................... 55
.......................................................... 55
.......................................... 56
................................. 61
............................... 61
................................................ 63
.................................. 63
.......................................... 64
......................................... 65
............................... 66
................................................... 69
................................................... 73
................................ 73
....................................................... 73
..................................................... 73
.................................. 74
................................................ 74
.................................................. 75
............................................ 76

FINAL DRAFT
2013 | INDONESIA SOLAR CITY GUIDEBOOK 6
List of Tables
Table 1 Allocation of emission reduction target per sector in 2020 (tCO2e) ....................................... 20
List of Figures
Figure 1: World map in proportion to the global distribution of GHG emissions and responsible
geographical areas. ............................................................................................................................... 15
Figure 2: Global distribution of carbon dioxide emitted into the atmosphere. ................................... 15
Figure 3 Map of Indonesia .................................................................................................................... 17
Figure 4: Urban population (% of total) in Indonesia. Source: Trading Economics) ............................. 18
Figure 5 GDP Indonesia 1999 – 2012 .................................................................................................... 19
Figure 6 Indonesia’s emissions profile .................................................................................................. 21
Figure 7 Indonesia’s energy consumption by type in 2011 ................................................................... 21
Figure 8a and 8b geographically illustrates Yogyakarta Province ........................................................ 25
Figure 9 Indonesia Climate Change Development histories ................................................................. 26
Figure 10: Solar city initiatives by Nikola Knezevic ............................................................................... 31
Figure 11: ICLEI's Local Renewables Network consisting of three types of communities: Model,
Resource and Network Communities ................................................................................................... 42
Figure 12: Cycle of the sun in Indonesia in yearly basis ........................................................................ 66
Figure 13: Quota Map of PV Plants in 80 Locations 2013. Source: http://energy-
indonesia.com/03dge/0130913fit.pdf .................................................................................................. 69
Figure 14: Wind Turbines combine with Solar PV located on Pandansimo Baru, Yogjakarta .............. 70
Terms, Abbreviations and Acronyms:
BAU Business As Usual
BAPPENAS Badan Perencaan Pembangunan National (National Development Planning Agency)
BPS Badan Pusat Statistik (Statistics Indonesia)
CH4 Methane
CDM Clean Development Mechanisms
CDP Carbon Disclosure Report
CO2 Carbon Dioxide
COP17 17th Conference of the Parties
CFL Compact Florescent Light
DEPSOS Departemen Sosial (Department of Social Affair)
DFIs Development Finance Institutions
DNPI Dewan Nasional Perubahan Iklim (The National Council for Climate Change)
ECC Energy Efficiency Certificates
EE Energy efficiency
EIB European Investment Bank
ESCo Energy Service Company
eCO2 Equivalent Carbon Dioxide
G-20 The Group of Twenty
GDP Gross Domestic Product
GE General Electric
GEEREF Global Energy Efficiency and Renewable Energy Fund
Gg Giga gram
GHG Greenhouse Gases
GIZ Die Deutsche Gesellschaft für Internationale Zusammenarbeit
GoI Government of Indonesia
GtCO2 Giga-tons of carbon dioxide
GtCO2eq Giga-tons carbon dioxide equivalent
HEAT + Harmonised Energy Analysis Tool Plus
HTF Heat-Transfer Fluid
ICLEI ICLEI – Local Governments for Sustainability
ICLEI AS ICLEI – Local Governments for Sustainability
ICLEI SA ICLEI – Local Governments for Sustainability
ICLEI SEA ICLEI – Local Governments for Sustainability
IDPs Integrated Development Plans
IEA International Energy Agency
IFC International Finance Corporation
IFPRI International Food Policy Research Institute
IMF International Monetary Fund
ICCS Integrated Climate Change Strategy
INCAS Indonesia National Carbon Accounting System
Indef Institute for Development Economics and Finance
FINAL DRAFT
Terms, Abbreviations and Acronyms:
Business As Usual
an Pembangunan National (National Development Planning Agency)
tatistik (Statistics Indonesia)
Clean Development Mechanisms
Carbon Disclosure Report
Conference of the Parties
ompact Florescent Light
Departemen Sosial (Department of Social Affair)
Development Finance Institutions
Dewan Nasional Perubahan Iklim (The National Council for Climate Change)
Energy Efficiency Certificates
Energy efficiency
European Investment Bank
Energy Service Company
Equivalent Carbon Dioxide
The Group of Twenty
Gross Domestic Product
General Electric
Global Energy Efficiency and Renewable Energy Fund
Greenhouse Gases
Gesellschaft für Internationale Zusammenarbeit
Government of Indonesia
tons of carbon dioxide
tons carbon dioxide equivalent
Harmonised Energy Analysis Tool Plus
Fluid
Local Governments for Sustainability
Local Governments for Sustainability – Africa Secretariat
Local Governments for Sustainability – South Asia
Local Governments for Sustainability – South East Asia
Integrated Development Plans
International Energy Agency
International Finance Corporation
International Food Policy Research Institute
International Monetary Fund
Integrated Climate Change Strategy
Indonesia National Carbon Accounting System
Institute for Development Economics and Finance
an Pembangunan National (National Development Planning Agency)
Dewan Nasional Perubahan Iklim (The National Council for Climate Change)

FINAL DRAFT
2013 | INDONESIA SOLAR CITY GUIDEBOOK 8
IPCC Intergovernmental Panel on Climate Change
ISCI First International Solar Cities Initiative
JICA Japan International Cooperation Agency
Kg Kilogram
kL Kilo Litre
kHz Kilo Hertz
km kilometre
km2 kilometre squared
kT/yr Kilo Tonnes per Year
kW Kilo Watts
kWe Kilo Watts Equivalent
kWh Kilo watt-hour
kWp Kilo Watt Peak
L Litre
LGs Local Governments
LED Light Emitting Diode
LNG Liquefied Natural Gas
LR Local Renewables
LRI Local Renewables Initiative
LPG Liquefied Petroleum
LULUCF Land Use, Land Use Change and Forestry
MEMR Ministry of Energy and Mineral Resources
MoF Ministry of Finance
Mt Metric tonnes
Mtoe Million tonnes of oil equivalent
MU million units
MW Mega Watt
MWe Mega Watt Equivalent
MWh Mega Watt-hour
MWP Mega Watt Peak
NAMA Nationally Appropriate Mitigation Action
NAP National Action Plan for Climate Change
NGHGI The National Green House Gas Inventory
NGO Non-governmental Organisation
NO2 Nitrogen Dioxide
PAKLIM Policy Advise for Enviroment and Climate Change
Permen Peraturan Menteri (Ministrial Regulation)
PLN Perusahaan Listrik Negara (Indonesia State Owned Electricity Company)
PNG Piped Natural Gas
PPP Public Private Partnership
PV Photovoltaic
RAN-GRK Rencana Aksi Nasional – Gas Rumah Kaca (National Action Plan for GHG)
R&D Research and Development
RE Renewable Energy
REEEP Renewable Energy and Energy Efficiency Partnership
RPJMN Rencana Pembangunan Jangka Menengah Nasional
SA South Africa
SNI Standar Nasional Indonesia (National Standard of Indonesia)
SWH Solar Water Heater
T/yr Tonnes per year
TAR Third Assessment Report
Te Co2 Tonnes of Equivalent Carbon Dioxide
TNA Technology Needs Assessment
ULBs Urban Local Bodies
UNFCCC United Nations Framework on Climate Change
UU Undang-undang (Law)
W Watt
Wh Watt-hour
WRM Water Resources Management
FINAL DRAFT
Rencana Pembangunan Jangka Menengah Nasional
Standar Nasional Indonesia (National Standard of Indonesia)
Solar Water Heater
Tonnes per year
Third Assessment Report
Tonnes of Equivalent Carbon Dioxide
nology Needs Assessment
Urban Local Bodies
United Nations Framework on Climate Change
undang (Law)
Water Resources Management

FINAL DRAFT
2013 | INDONESIA SOLAR CITY GUIDEBOOK 10
Preface
The Local Renewables Initiative and Network
With the Local Renewables (LR) Initiative, ICLEI – Local Governments for Sustainability supports and
strengthens local governments in their generation and supply of renewable energy (RE) and
implementation of energy efficiency (EE) in the urban activities/services. The focus is on the roles
and responsibilities of local governments as a driving force for innovation and investment in their
communities. The LR initiative consists of a worldwide network of cities.
The aims of the initiative are to:
• increase the sharing of knowledge of locally sustainable energy
• initiate and empower model communities worldwide
• transfer knowledge from cities with recognized expertise
• facilitate networking among local governments internationally
The term ‘Local Renewables’ attempts to bring into focus the symbiotic relationship between energy
efficiency and renewable energy, with an emphasis on local level action.
The LR initiative has received support from cities and organizations around the world to enable the
issue of renewable energy and energy efficiency at the local level to be advanced and to allow cities
to learn from one another.
About the project ‘Local Renewables: South-south cooperation
between cities in India, Indonesia and South Africa’
The current project ‘Local Renewables: South-south cooperation between cities in India, Indonesia
and South Africa’ is funded by the Renewable Energy and Energy Efficiency Partnership (REEEP). The
project aims to develop two model LR communities, one in Ekurhuleni Metropolitan Municipality in
South Africa, and the other in Yogyakarta City in Indonesia while providing both with guidance from
Coimbatore City in India, an advanced LR city through its participation in anLR project from 2008 to
2010, and to facilitate the adoption of similar initiatives in other South African and Indonesian local
governments.
The project, which ran from October 2011 to June 2013, enabled the cities of Ekurhuleni and
Yogyakarta to undergo and implement the LR milestone process (depicted below).

About the Solar City Guidebook for
A landmark achievement of the
of the national level Solar Cities programme in India. This large scale nation
India, helmed by the Indian Ministry of New and Renewable Energy, aims to help develop a targeted
60 ‘solar cities’ in the country. The Solar Cities programme has many components in line with the
Local Renewables programme. Thus, a pr
a total of 60 to date.
Through this present project, ICLEI aims to create such an impetus in the two countries of Indonesia
and South Africa through the preparation of a Solar City Guidebook
developed by ICLEI South Asia for the Indian Solar Cities programme, these country
guidebooks aim to make the case for increasing the number of cities adopting local renewables in
South Africa and Indonesia. In India, the local level programme encouraged the national government
to undertake a countrywide rollout. It is hoped that the
impetus for a similar up-scaling in Indonesia
5. Monitoring and
reporting
4. Implementation
FINAL DRAFT
About the Solar City Guidebook for Indonesia
A landmark achievement of the LR initiative was the input and influence towards the development
of the national level Solar Cities programme in India. This large scale national level programme in
India, helmed by the Indian Ministry of New and Renewable Energy, aims to help develop a targeted
60 ‘solar cities’ in the country. The Solar Cities programme has many components in line with the
Local Renewables programme. Thus, a project that began with 3 cities in India spread its influence to
, ICLEI aims to create such an impetus in the two countries of Indonesia
and South Africa through the preparation of a Solar City Guidebook. Based on a similar guide
developed by ICLEI South Asia for the Indian Solar Cities programme, these country
guidebooks aim to make the case for increasing the number of cities adopting local renewables in
n India, the local level programme encouraged the national government
to undertake a countrywide rollout. It is hoped that the Indonesia guidebook may serve as the first
scaling in Indonesia.
2. Target setting
0. Motivation
1. Assessment
3. Action planning
input and influence towards the development
al level programme in
India, helmed by the Indian Ministry of New and Renewable Energy, aims to help develop a targeted
60 ‘solar cities’ in the country. The Solar Cities programme has many components in line with the
spread its influence to
, ICLEI aims to create such an impetus in the two countries of Indonesia
. Based on a similar guide
developed by ICLEI South Asia for the Indian Solar Cities programme, these country-specific solar city
guidebooks aim to make the case for increasing the number of cities adopting local renewables in
n India, the local level programme encouraged the national government
guidebook may serve as the first
Assessment

FINAL DRAFT
2013 | INDONESIA SOLAR CITY GUIDEBOOK 12
Executive Summary
The Indonesia Solar City Guidebook is intended to serve as an informing document for readers to
learn about the various aspects involved in a Solar City, including relevant international
developments, technical terms and processes. It is intended to serve as a useful resource for
Indonesian local governments when embarking upon a programme to increase the uptake of
renewable energy and energy efficiency at the local level.
Beginning with an overview of the global energy scenario, the introductory section provides the
basic context to the guidebook and illustrates the renewable energy scenarios and energy efficiency
initiatives from a global and Indonesian perspective. Chapter two outlines the obligations pertinent
in Indonesia for local climate action, from national goals to provincial commitments and targets.
Chapter three unfolds and describes the evolution of the solar city concept, international solar city
initiatives and ICLEI’s Local Renewable initiative and network. A section herein, focus on the solar
city programme inIndia, Indonesia and South Africa related to its objectives, targets and guidelines,
making the case for the motivations of developing a solar city programme in Indonesia. The fourth
chapter outlines the key steps of such a programme at the city level. Thissection provides solar cities
case studies and best practices from around the world, examples of similar programmes, and typical
activities conducted through them.
The fifth chapter provides an overview of the various technology, systems and device options which
would aid the uptake of renewable energy and energy efficiency at the local level. The final chapter
concludes by providing information on the local level implementation strategy that would be
required to put in place for a solar city programme and possible international financing options and
mechanisms that could be usedto implement physical projects on the ground.
This guide aims to serve as an introduction to the specific energy reduction strategies in local
government climate change, energy and sustainability strategiesfor:
− City governments and decision makers
− Professional and institutional groups involved in renewable energy and energy efficiency
− Private organizations and companies interested in investing in renewable energy and energy
efficiency projects at the local level

Chapter 1: Introduction
The global climate is controlled by complex interactions b
These interactions generate a variety of climatic variables across different regions and exert
significant influence on day-to-day
is defined by the International Panel for Climate Change (IPCC) as a statistically significant variation
in either the mean state of the climate or in its variability, persisting for an extended period (IPCC
2007). Climate change may be a result of natural internal proces
anthropogenic changes such as increased carbon dioxide (CO
Nations Framework Convention on Climate Change (UNFCCC) makes a clear division between
anthropogenic causes that alter the composition
attributing to climate variability. Climate change, as defined by the UNFCCC, is any ‘change of
climate that is attributed directly or indirectly to human activity that alters the composition of the
global atmosphere and is in addition to natural climate variability over comparable time periods’
(IPCC, 2001) and the IPCC (2007) concur that anthropogenic forcing is a major driver.
Repercussions of climate change are expected to be global and across physical, social,
economic dimensions. While several direct and indirect effects of changing climate are anticipated
globally, their intensities are expected to be greater in the developing world mainly because of the
low level of resilience and preparedness
science of climate change is well
predicting the eventual impacts remains uncertain because of the complexity of earth’s natural
systems. Strong evidence exists to prove that anthropogenic causes have resulted in increased level
of greenhouse gasses in turn resulting in global temperature rise
highly pervasive (IPCC 2007).
As an issue that is interrelated with several other global challenges like urbanization, rising
population and global economic and energy crisis; climate change will have significant influence on
political and social developments challenges in different parts of the world
exception.
Under climate change, Indonesia is predicted to experience temperature increases of approximately
0.8°C by 2030. Moreover, rainfall patterns are predicted to change, with the rainy season ending
earlier and the length of the rainy season becoming shorter. Climate change affects all economic
sectors, but the agricultural sector is generally the hardest hit in terms of the number of poor
affected. (IFPRI 2011)2
Growing energy use has a direct impact on global and local
emissions are the main sources
environmental impacts of increased energy use,
issues in several developed and developing countries.
world to seriously begin to consider
renewable energy resources and implement
2http://www.ifpri.org/sites/default/files/publications/ifpridp01148.pdf
FINAL DRAFT
Introduction
The global climate is controlled by complex interactions between marine and terrestrial systems.
These interactions generate a variety of climatic variables across different regions and exert
day variations at the global, regional and local levels. Climate change
International Panel for Climate Change (IPCC) as a statistically significant variation
in either the mean state of the climate or in its variability, persisting for an extended period (IPCC
2007). Climate change may be a result of natural internal processes, external forc
anthropogenic changes such as increased carbon dioxide (CO2) emissions. However the United
Nations Framework Convention on Climate Change (UNFCCC) makes a clear division between
anthropogenic causes that alter the composition of the atmosphere and the natural causes
attributing to climate variability. Climate change, as defined by the UNFCCC, is any ‘change of
climate that is attributed directly or indirectly to human activity that alters the composition of the
re and is in addition to natural climate variability over comparable time periods’
2001) and the IPCC (2007) concur that anthropogenic forcing is a major driver.
Repercussions of climate change are expected to be global and across physical, social,
economic dimensions. While several direct and indirect effects of changing climate are anticipated
globally, their intensities are expected to be greater in the developing world mainly because of the
low level of resilience and preparedness in these parts of the world, especially Asia
science of climate change is well-founded and scientifically substantiated, the science related to
predicting the eventual impacts remains uncertain because of the complexity of earth’s natural
systems. Strong evidence exists to prove that anthropogenic causes have resulted in increased level
resulting in global temperature rise, consequences of which will be
interrelated with several other global challenges like urbanization, rising
population and global economic and energy crisis; climate change will have significant influence on
political and social developments challenges in different parts of the world
Under climate change, Indonesia is predicted to experience temperature increases of approximately
0.8°C by 2030. Moreover, rainfall patterns are predicted to change, with the rainy season ending
ainy season becoming shorter. Climate change affects all economic
sectors, but the agricultural sector is generally the hardest hit in terms of the number of poor
Growing energy use has a direct impact on global and local environments. Vehicular and industrial
the main sources responsible for deteriorationof air quality in cities. Apart from
environmental impacts of increased energy use, energy security concerns are becoming central
and developing countries. Rapid depletion of fossil fuels has forced the
begin to consider exploring possibilities and alternativesfor
renewable energy resources and implementing energy efficient techniques.
http://www.ifpri.org/sites/default/files/publications/ifpridp01148.pdf
etween marine and terrestrial systems.
These interactions generate a variety of climatic variables across different regions and exert
at the global, regional and local levels. Climate change
International Panel for Climate Change (IPCC) as a statistically significant variation
in either the mean state of the climate or in its variability, persisting for an extended period (IPCC,
ses, external forces or from
) emissions. However the United
Nations Framework Convention on Climate Change (UNFCCC) makes a clear division between
of the atmosphere and the natural causes
attributing to climate variability. Climate change, as defined by the UNFCCC, is any ‘change of
climate that is attributed directly or indirectly to human activity that alters the composition of the
re and is in addition to natural climate variability over comparable time periods’
2001) and the IPCC (2007) concur that anthropogenic forcing is a major driver.
Repercussions of climate change are expected to be global and across physical, social, ecological and
economic dimensions. While several direct and indirect effects of changing climate are anticipated
globally, their intensities are expected to be greater in the developing world mainly because of the
Asia. While the basic
founded and scientifically substantiated, the science related to
predicting the eventual impacts remains uncertain because of the complexity of earth’s natural
systems. Strong evidence exists to prove that anthropogenic causes have resulted in increased level
, consequences of which will be
interrelated with several other global challenges like urbanization, rising
population and global economic and energy crisis; climate change will have significant influence on
and Indonesia is no
Under climate change, Indonesia is predicted to experience temperature increases of approximately
0.8°C by 2030. Moreover, rainfall patterns are predicted to change, with the rainy season ending
ainy season becoming shorter. Climate change affects all economic
sectors, but the agricultural sector is generally the hardest hit in terms of the number of poor
. Vehicular and industrial
air quality in cities. Apart from
ecurity concerns are becoming central
depletion of fossil fuels has forced the
possibilities and alternativesfor harnessing the

FINAL DRAFT
2013 | INDONESIA SOLAR CITY GUIDEBOOK 14
Government policies and regulations play a key role in transforming energy markets towards greater
adoption of renewable energy and energy efficiency. A vast array of proven renewable technologies
is readily availableat a marketable and affordable price. Despite the relative abundance of natural
resources such as sunshine, wind, water and underground thermal heat, these non-diminishing
resources are yet to be fullyexplored.
International perspective of climate change and energy
As urban population, economic activity and wealth increase, urban energy use is projected to grow
rapidly. Currently the world is host to approximately seven billion (2013) people (U.S. Census
Bureau, 2013), more than half of who live in urban centres. It is projected that by 2030, cities will
house 60% of the world’s population – equivalent to the total global population in 1987 (Nigel
Jollands, IEA). According to the 2010 census the total population of Indonesia is 237.5 million people,
about a half whom, or 118 million people, live in urban areas. This implies that urban development
will become a more pressing issue in the country. As the cities grow, development issues will be
raisedsuch as traffic congestion, slums and crime, and also the broader context of socio-economic
and political dynamics, as well as energy and resources.
Annual total greenhouse gas (GHG) emissions arising from the global energy sector continue to
increase. Combustion of fossil fuels continues to dominate a global energy market that is striving to
meet the ever-increasing demand for heat, electricity and transport fuels. GHG emissions from fossil
fuels have increased each year since the IPCC 2001 Third Assessment Report (TAR) (IPCC, 2001),
despite greater deployment of low- and zero-carbon technologies, (particularly those utilizing
renewable energy); the implementation of various policy support mechanisms by many states and
countries; the advent of carbon trading in some regions, and a substantial increase in world energy
commodity prices. Without the near-term introduction of supportive and effective policy actions by
governments, energy-related GHG emissions, mainly from fossil fuel combustion, are projected to
rise by over 50% from 26.1 GtCO2eq (7.1 GtC) in 2004 to 37–40 GtCO2 (10.1–10.9 GtC) by 2030.
Mitigation has therefore become even more challenging (IPCC, 2007) for emerging economies.

Figure 1: World map in proportion to the global distribution of GHG emissions and
Climate change threatens to undermine many of the development objec
rest of the developing world, in particular
order to allow low carbon, resource efficient
developing world, a climate change agreement requires
developedcountries to take ownership and
states that emission reductions by 2100 between 60% to 80% from 1990 levels must be achieved.
The burden sharing between nations of this target is the subject of international negotiations.
Figure 2: Global distribution of car
3 http://upload.wikimedia.org/wikipedia/commons/d/d1/Countries_by_carbon_dioxide_emissions_world_map_deobfuscated.png
FINAL DRAFT
: World map in proportion to the global distribution of GHG emissions and responsible geographical
areas.3
Climate change threatens to undermine many of the development objectives of the countries in
rest of the developing world, in particularly in the areas of water, energy, health and agriculture. In
resource efficient and sustainable economic development in the
developing world, a climate change agreement requires nations from both the
to take ownership and comply with international obligations.
reductions by 2100 between 60% to 80% from 1990 levels must be achieved.
The burden sharing between nations of this target is the subject of international negotiations.
: Global distribution of carbon dioxide emitted into the atmosphere
http://upload.wikimedia.org/wikipedia/commons/d/d1/Countries_by_carbon_dioxide_emissions_world_map_deobfuscated.png
responsible geographical
tives of the countries in the
in the areas of water, energy, health and agriculture. In
development in the
nations from both the developing and
comply with international obligations. Globally the IPCC
reductions by 2100 between 60% to 80% from 1990 levels must be achieved.
The burden sharing between nations of this target is the subject of international negotiations.
bon dioxide emitted into the atmosphere.
http://upload.wikimedia.org/wikipedia/commons/d/d1/Countries_by_carbon_dioxide_emissions_world_map_deobfuscated.png

FINAL DRAFT
2013 | INDONESIA SOLAR CITY GUIDEBOOK 16
A significant proportion of world’s energy is consumed by the ever growing engines of social,
economic and technological advancement called cities. As vital centres of global development and
innovation, cities themselves hold the key to resolution of some of their own problems. Fuelled by
fossils, urban development has attracted unbridled population growth and resource use, resulting in
ever increasing resource constraints for further development and the cumulative population suffers
tremendously.
Indonesia perspective on energy and climate change
Indonesia is located between 6o08’ North and 11o15’ South latitude, and from 94o45’ to 141o05’East
longitude. The country covers 1,910,931 Km2. It has five large islands (Sumatra, Java,Kalimantan,
Sulawesi and Irian Jaya) and about 13,667 small islands, of which over half (56%) ofwhich are
nameless, and only 7% permanently inhabited.Extensive coastal plainsand mountain areas of 1,000
metres above sea level are characteristics of Sumatra, Kalimantanand Irian Jaya. Of the 200 million
ha of land territory, about 50 million ha is devoted to variousagricultural activities. There is nearly 20
million ha of arable land, of which about 40% is wetland(rice fields), 40% is dry land, and 15% is
shifting cultivation. Since 2005, the Republic of Indonesiahas been divided administratively into 33
provinces (Statistic Indonesia - BPS, 2012)

The country’s population is the fourth most populous nation in the world, following China,India and
the United States. The population grew from 119 million in 1971 to 219 million in
growth rate is slowing down from 1.49% (1
that Indonesia’s population will reach 300 million in 2030.
FINAL DRAFT
Figure 3 Map of Indonesia
The country’s population is the fourth most populous nation in the world, following China,India and
the United States. The population grew from 119 million in 1971 to 219 million in
growth rate is slowing down from 1.49% (1990–2000) to become 1.34% (2001–2005), it is projected
that Indonesia’s population will reach 300 million in 2030.
The country’s population is the fourth most populous nation in the world, following China,India and
the United States. The population grew from 119 million in 1971 to 219 million in2005. While the
2005), it is projected

FINAL DRAFT
2013 | INDONESIA SOLAR CITY GUIDEBOOK 18
Figure 4: Urban population (% of total) in Indonesia. Source: Trading Economics4)
Poverty remains a challenge, while unemployment and underemployment are still relatively high. In
the Mid-Term National Development Plan (RPJMN5) 2004–2009, it was targeted that poverty and
unemployment would be about 5.1% and 8.2% respectively. Recent report from Statistic Indonesia
(BPS) stated that the number of unemployment by February 2008 reached 8.46% or about 9.43
million people. However, based on the projection of the Institute for Development Economics and
Finance (Indef), due to current economic crisis the number of poor and unemployed in 2008 may
increase to 9.5% and 16.3% respectively (Depsos6, 2009).
Indonesia’s GDP is approximately US$ 175 billion in 2008, in which trade (16.7%), manufacturing
(28%), agriculture (15.4%), and services (10.17%) are the main contributors. Earnings from exports
were about US$ 69 billion (primarily oil and gas, textiles, appliances, coal, copper), while imports
accounted for about US$ 44.8 billions (primarily food, chemicals, capitals and consumer goods). GDP
growth has increased steadily since 1998, reaching 6.3% in 2007 thus bringing per capita GDP to
around US$ 2,000, which is considerably higher than the pre-crisis level (around US$1,000). The role
of non-oil and gas sectors has become more significant since the Asian Financial Crisis (AFC); the oil
and gas sectors’ contribution to the economy decreased, as indicated by the negative growth rates
for the whole period, except in the year 2000. Among the non-oil and gas sectors, agriculture has
played an important role. It is the sector least aff ected by the AFC and in fact helped the recovery of
Indonesian economy after the crisis. This was due to its role as “the employer of last resort” and its
substantial increases in exports7
4 Trading Economics website as http://www.tradingeconomics.com/indonesia/population, accessed on Dec
16th
2013 5RPJMN stands for “Rencana Pembangunan Jangka Menengah Nasional”
6DEPSOS: Ministry of Social Affair of Indonesia
7 Indonesia Second National Communication Under The United Nations Framework Convention on Climate
Change (UNFCCC)

Energy
Indonesia’s energy demand remains highly dependent on
potential for renewable energy (RE) to play a larger role in the energy mix. Formuch of Indonesia,
with its relatively isolated islands and regions, provision of b
option. The GoI Energy Management
primary energy supply will grow from the 4.3%
increasingly important role, particularly forgeothermal and biofuels.
The GOI is commended for its efforts to shift policy to accelerate the penetrationof RE technologies
into the marketplace and to create jobs and generate income byusing locally available energy
sources. However, the great challenge now is to introducecost
the necessary investments and bringsustainability to the deployment of RE technology. This would
be another task fora Directorate General of Energy Efficiency, Conservation and
inthe Ministry of Energy and Mineral Resources.
Keys to sustainability in the deployment of RE technology are the removal ofsubsidies in fossil fuel
retail pricing and electricity tariffs, and the establishment of aregulatory framework t
incentives and clarity to investors on issue
ongoing taxation and REfeed-in tariffs. This is equally applicable to all REtechnologies and the
incremental costs of these RE systems s
consumer rather than recovered from the governmentbudget.
8 World bank website, GDP Indonesia accessed on Dec 18
http://data.worldbank.org/indicator/NY.GDP.PCAP.CD/countries/ID?page=2&display=9 Ministry of Energy and Mineral website, accessed on Dec 18t 2013, as
http://esdm.go.id/publikasi/lainlain/doc_download/714
0
500
1000
1500
2000
2500
3000
3500
4000
US
D
Indonesia GDP per capita (current US$)
FINAL DRAFT
Figure 5GDP Indonesia8 1999 –2012
Indonesia’s energy demand remains highly dependent on fossil fuels, although there is
potential for renewable energy (RE) to play a larger role in the energy mix. Formuch of Indonesia,
with its relatively isolated islands and regions, provision of basicenergy needs by RE is an appropriate
Management Blueprint9 2005-2025projects that the share of RE in the
primary energy supply will grow from the 4.3% in year 2005 to 17% in 2025, with RE playing an
articularly forgeothermal and biofuels.
The GOI is commended for its efforts to shift policy to accelerate the penetrationof RE technologies
into the marketplace and to create jobs and generate income byusing locally available energy
great challenge now is to introducecost-effective incentives that will attract
the necessary investments and bringsustainability to the deployment of RE technology. This would
be another task fora Directorate General of Energy Efficiency, Conservation and
inthe Ministry of Energy and Mineral Resources.
Keys to sustainability in the deployment of RE technology are the removal ofsubsidies in fossil fuel
retail pricing and electricity tariffs, and the establishment of aregulatory framework t
d clarity to investors on issue related to the bidding procedure for new projects and the
in tariffs. This is equally applicable to all REtechnologies and the
incremental costs of these RE systems should be reflected inthe tariff to the local electricity
consumer rather than recovered from the governmentbudget.
World bank website, GDP Indonesia accessed on Dec 18
th 2013,
http://data.worldbank.org/indicator/NY.GDP.PCAP.CD/countries/ID?page=2&display=default
Ministry of Energy and Mineral website, accessed on Dec 18t 2013, as
http://esdm.go.id/publikasi/lainlain/doc_download/714-blue-print-pengelolaan-energi-nasional
Year
Indonesia GDP per capita (current US$)
fossil fuels, although there is a huge
potential for renewable energy (RE) to play a larger role in the energy mix. Formuch of Indonesia,
asicenergy needs by RE is an appropriate
2025projects that the share of RE in the
to 17% in 2025, with RE playing an
The GOI is commended for its efforts to shift policy to accelerate the penetrationof RE technologies
into the marketplace and to create jobs and generate income byusing locally available energy
effective incentives that will attract
the necessary investments and bringsustainability to the deployment of RE technology. This would
be another task fora Directorate General of Energy Efficiency, Conservation and Renewable Energy
Keys to sustainability in the deployment of RE technology are the removal ofsubsidies in fossil fuel
retail pricing and electricity tariffs, and the establishment of aregulatory framework that will provide
related to the bidding procedure for new projects and the
in tariffs. This is equally applicable to all REtechnologies and the
hould be reflected inthe tariff to the local electricity
default
nasional-pen.html
GDP
(USD)

FINAL DRAFT
2013 | INDONESIA SOLAR CITY GUIDEBOOK 20
Indonesia’s Commitment for Climate Change
At the G-20 meeting in Pittsburgh and at UNFCCC COP15 in Copenhagen in 2009, the President of
the Republic of Indonesia committed to achieve the target of 26% reduction in carbon emissions
from a Business As Usual (BAU) scenario by 2020. Further emissions reductions of up to 41% are
expected to be implemented with international support. These commitments were submitted as
Indonesia’s nationally appropriate mitigationactions to the UNFCCC in January 2010.
This is fully in line with Indonesia’s continued efforts to implement its target under theClimate
Change Convention and contribute to a global mitigation effort in accordancewith the principles and
provision of the Convention. Furthermore, the Government ofIndonesia has developed a national
policy framework and action on climate change. Toadvance and promote the effort nationally, the
Government of Indonesia (GoI) enactedthe Presidential Regulation No. 61 – the National Action Plan
for GHG emission reduction(Rencana Aksi Nasional Penurunan Emisi Gas Rumah Kaca, henceforth
RAN-GRK) on 20September 2011.
Table 1Allocation of emission reduction target per sector in 2020 (tCO2e)
Sectors
Target of Reduction (tCO2e)
26% 41%
Forestry and Peat Land 672,000,000 1,039,000,000
Agriculture 8,000,000 11,000,000
Energy and Transport 36,000,000 56,000,000
Industry 1,000,000 5,000,000
Waste 48,000,000 78,000,000
Total 767,000,000 1,189,000,000
Based on this framework, all 33 provinces in Indonesia was expected to form the local action plan in
accordance with national target.
Indonesia’s Carbon Story
Indonesia is also among the world’s largest emitters of greenhouse gases (GHGs), with land use
change and deforestation the largest contributor to GHG emissions. Energy-related emissions are
dominated by industry, power, and transport sectors and the energy sector is the third largest
source of CO2 emissions.

Figure
Indonesia has abundant primary energy resources that are
export requirements in the form of oil, liquefied natural gas (LNG), and coal. Coal is Indonesia’s
largest fossil fuel resource, with proven reserves of 5,300 million tons of lignite and sub
coal located predominantly in Sumatra and Kalimantan. The Indonesian Government plans to rapidly
expand the domestic use of coal for electricity generation. In the foreseeable future
generation and industrial use will continue to dominate coal
Indonesia also has substantial renewable energy resources. Historically, while the focus has been on
export revenue, since early this decade, there has been a rapid re
Government towards meeting its domestic energy needs.
Figure 7Indonesia’s
10
Clean Technology Fund Investment Plan for Indonesia, 2010
11US Aid, 2008, Indonesia Energy Assessment
12 Handbook of Energy & Economic Statistics of Indonesia, Ministry of Energy and Mineral Resources
(Indonesia) 2012
FINAL DRAFT
Figure 6Indonesia’s emissions profile10
Indonesia has abundant primary energy resources that are utilized to meet domestic demand and
export requirements in the form of oil, liquefied natural gas (LNG), and coal. Coal is Indonesia’s
largest fossil fuel resource, with proven reserves of 5,300 million tons of lignite and sub
y in Sumatra and Kalimantan. The Indonesian Government plans to rapidly
expand the domestic use of coal for electricity generation. In the foreseeable future
generation and industrial use will continue to dominate coal utilization11.
as substantial renewable energy resources. Historically, while the focus has been on
export revenue, since early this decade, there has been a rapid re-orientation by the Indonesian
Government towards meeting its domestic energy needs.
Indonesia’s energy consumption by type in 201112
Clean Technology Fund Investment Plan for Indonesia, 2010
Indonesia Energy Assessment
Handbook of Energy & Economic Statistics of Indonesia, Ministry of Energy and Mineral Resources
to meet domestic demand and
export requirements in the form of oil, liquefied natural gas (LNG), and coal. Coal is Indonesia’s
largest fossil fuel resource, with proven reserves of 5,300 million tons of lignite and sub-bituminous
y in Sumatra and Kalimantan. The Indonesian Government plans to rapidly
expand the domestic use of coal for electricity generation. In the foreseeable future, power
as substantial renewable energy resources. Historically, while the focus has been on
orientation by the Indonesian
Handbook of Energy & Economic Statistics of Indonesia, Ministry of Energy and Mineral Resources

FINAL DRAFT
2013 | INDONESIA SOLAR CITY GUIDEBOOK 22
Since 2007, the climate change development in Indonesia gathered significant momentum when
Indonesia hosted the 13th COP of the UNFCCC in Bali. Indonesiaestablished several institutions and
enacted several policy documents and relatedregulations to address climate change. The National
Council for Climate Change (DewanNasional Perubahan Iklim, henceforth DNPI) was formed in 2008
and acts as the nationalfocal point for climate change issues discussed in international forum.
Subsequently, theGoI mainstreamed climate change activities into the National Medium-Term
DevelopmentPlan 2009-2014 (RPJMN)and established a national trust fund (ICCTF) to finance
climate change activities. At theend of 2009, Indonesia announced its voluntary commitment to
mitigation followed bythe issuance of Presidential Regulation No. 61/2011 on the National Action
Plan to reduceGHG emissions
The National Greenhouse Gases Inventory (NGHGI) was estimated using Tier 1 and Tier 2 of the2006
IPCC Reporting Guidelines and the IPCC GPG for LULUCF. In 2000, total GHG emissions for the four
main greenhouse gases (CO2, CH4, N2O, PFC) without LULUCF (LUCF and peat fires) reached
56,728.78 Gg CO2equivalent. With the inclusion of LULUCF, total net GHG emissions from Indonesia
increase significantly to about 1,377,982.95 Gg CO2e. The GHG emissions (in CO2 equivalent) were
distributed unevenly amongst the three gases recorded, i.e. net CO2 totalled 1,112,878.82 Gg,
representing 80.8% of the National GHG emissions; methane (CH4) totalled 236,617.97 Gg
(CO2equivalent) or 17.2%; and nitrous oxide (N2O) totalled 28,341.02 Gg (CO2equivalent) or 2.0%.
The main contributing sectors were Land Use Change and Forestry, followed by energy, peat fire
related emissions, waste, agricultural and industry.
Table 2 Summary of GHG emissions from 2000-2005 from all sectors (in Gg CO2e)13
Source 2000 2001 2002 2003 2004 2005
Energy 280,937.58 306,774.25 327,910.62 333,950.21 372,123.28 369,799.88
Industrial Process 43,043.52 49,810.15 43,716.26 47,901.63 47,985.20 48,733.38
Agriculture 75,419.73 77,500.80 77,029.94 79,828.80 77,862.54 80,179.31
LUCF 649,254.17 560,546.00 1,287,494.79 345,489.33 617,423.23 674,828.00
Peat Fire 172,000.00 194,000.00 678,000.00 246,000.00 440,000.00 451,000.00
Waste 157,327.96 160,817.76 162,800.37 164,073.89 165,798.82 166,831.32
Total with LUCF
& peat fire
1,377,982.95 1,349,448.96 2,576,951.98 1,217,243.86 1,721,193.07 1,791,371.89
Total without
LUCF & peat fire
556,728.78 594,902.96 611,457.19 625,754.53 663,769.84 665,543.89
Indonesia Energy Sector
Indonesia is endowed with substantial energy resources that include both fossil fuels as well as a
variety of RE resources. From the early days of independence until the late 1990s, Indonesia was a
13
Indonesia Second National Communication Under The United Nations Framework Convention on Climate
Change (UNFCCC)
major crude oil producer and exporter. Given this abundanc
products in the country was heavily subsidized, which also led to the development of the power
generation subsector largely based on diesel and other petroleum
crude oil reserve base was in decline and the Asian Financial Crisis contributed to the cessation of
investments in new exploration as well as increasing the country’s refining capacity. As a result,
Indonesia has become a net oil importer. During this period, Indonesia also began to
energy mix by developing its high quality coal reserves as well as its natural gas resources, which
were being increasingly used for power generation. There was also a modest, yet significant,
expansion of RE that included geothermal and hyd
unable to significantly reduce its dependence on petroleum
continued to grow increasing its utilization of fuel while natural gas for domestic power generation
became scarce since significant amounts were earmarked for exports.
Indonesia was at the epicentre of the Asian Financial Crisis in the late 1990s and its economy was
badly affected and contracted significantly in its aftermath. As a result, there was excess power
generation capacity in the country as the new millennium began. However, Indonesia has seen
steady economic growth since, and the country’s power sector has struggled to keep up with the
high electricity demand growth triggered by the recovery. The financial
power company (PLN), already weakened by the crisis, and further deteriorated due to the dramatic
increase of oil prices on the international market from 2002 to 2008. PLN struggled to invest,
requiring growing subsidies to maintai
petroleum products where declining domestic production was being met with increasing levels of
imports. Private sector investments also came to a halt during this period. Current power supplies
barely keep up with demand which is increasing at around 8 percent per year, and brownouts and
load shedding have become commonplace affecting economic growth and even ordinary consumers.
PLN has estimated that some 2,500 MW of new power generation capacity
order to meet the growing demand. In 2006, the
construction of 10,000 MW of coal
only readily available solution for u
generation units in an affordable manner. This decision, along with existing heavy use of diesel, will
further increase the country’s dependence on fossil fuels, exacerbating local and global
environmental impacts: an additional 10,000 MW of coal
million tons of CO2 per year. Overall, estimates suggest that if this trend were to continue, it would
result in a manifold increase in CO2 emissions from the power
In late 2008 GOI continued to expand its power generation capacity in order to keep up with
demand by launching a Second Fast
which 60 percent will be comprised
hydropower accounting for most of the other RE capacity. Geothermal power is one of the best
options to diversify Indonesia’s energy mix. It is a base load generation technology not subject to the
intermittency and variability of most renewable electricity sources. As an indigenous energy source,
it will also enhance the country’s energy security and serve as a natural hedge against the volatility
of fossil-based commodity prices. As such, geothermal
generation. In addition, hydro power and biomass at various scalesprovide a useful opportunity to
utilize local resources for grid-based power as well as foroff
access that will contribute towardsalleviating poverty and improving people’s quality of living.
FINAL DRAFT
major crude oil producer and exporter. Given this abundance, domestic consumption of petroleum
products in the country was heavily subsidized, which also led to the development of the power
generation subsector largely based on diesel and other petroleum-based fuels. By the 1990s, the
n decline and the Asian Financial Crisis contributed to the cessation of
investments in new exploration as well as increasing the country’s refining capacity. As a result,
Indonesia has become a net oil importer. During this period, Indonesia also began to
energy mix by developing its high quality coal reserves as well as its natural gas resources, which
were being increasingly used for power generation. There was also a modest, yet significant,
expansion of RE that included geothermal and hydro power. Despite this effort, Indonesia was
unable to significantly reduce its dependence on petroleum-based fuels. The transportation sector
continued to grow increasing its utilization of fuel while natural gas for domestic power generation
e since significant amounts were earmarked for exports.
Indonesia was at the epicentre of the Asian Financial Crisis in the late 1990s and its economy was
badly affected and contracted significantly in its aftermath. As a result, there was excess power
eration capacity in the country as the new millennium began. However, Indonesia has seen
steady economic growth since, and the country’s power sector has struggled to keep up with the
high electricity demand growth triggered by the recovery. The financial position of the national
power company (PLN), already weakened by the crisis, and further deteriorated due to the dramatic
increase of oil prices on the international market from 2002 to 2008. PLN struggled to invest,
requiring growing subsidies to maintain operations in a system that was still highly dependent on
petroleum products where declining domestic production was being met with increasing levels of
imports. Private sector investments also came to a halt during this period. Current power supplies
rely keep up with demand which is increasing at around 8 percent per year, and brownouts and
load shedding have become commonplace affecting economic growth and even ordinary consumers.
PLN has estimated that some 2,500 MW of new power generation capacity is required each year in
order to meet the growing demand. In 2006, the GoI devised the first “Fast-Track” program for the
construction of 10,000 MW of coal-based power generation plants by PLN, which was viewed as the
only readily available solution for utilizing abundant domestic coal resources to displace high
generation units in an affordable manner. This decision, along with existing heavy use of diesel, will
further increase the country’s dependence on fossil fuels, exacerbating local and global
environmental impacts: an additional 10,000 MW of coal-fired power will add an estimated 55
million tons of CO2 per year. Overall, estimates suggest that if this trend were to continue, it would
result in a manifold increase in CO2 emissions from the power sector over the next two decades.
In late 2008 GOI continued to expand its power generation capacity in order to keep up with
demand by launching a Second Fast-Track Program to construct another 10,000 MW of capacity in
which 60 percent will be comprised of RE, with geothermal accounting for about 4,800 MW and
hydropower accounting for most of the other RE capacity. Geothermal power is one of the best
options to diversify Indonesia’s energy mix. It is a base load generation technology not subject to the
termittency and variability of most renewable electricity sources. As an indigenous energy source,
it will also enhance the country’s energy security and serve as a natural hedge against the volatility
based commodity prices. As such, geothermal can directly displace coal
generation. In addition, hydro power and biomass at various scalesprovide a useful opportunity to
based power as well as foroff-grid solutions to increase rural electricity
will contribute towardsalleviating poverty and improving people’s quality of living.
e, domestic consumption of petroleum
products in the country was heavily subsidized, which also led to the development of the power
based fuels. By the 1990s, the
n decline and the Asian Financial Crisis contributed to the cessation of
investments in new exploration as well as increasing the country’s refining capacity. As a result,
Indonesia has become a net oil importer. During this period, Indonesia also began to diversify its
energy mix by developing its high quality coal reserves as well as its natural gas resources, which
were being increasingly used for power generation. There was also a modest, yet significant,
ro power. Despite this effort, Indonesia was
based fuels. The transportation sector
continued to grow increasing its utilization of fuel while natural gas for domestic power generation
Indonesia was at the epicentre of the Asian Financial Crisis in the late 1990s and its economy was
badly affected and contracted significantly in its aftermath. As a result, there was excess power
eration capacity in the country as the new millennium began. However, Indonesia has seen
steady economic growth since, and the country’s power sector has struggled to keep up with the
position of the national
power company (PLN), already weakened by the crisis, and further deteriorated due to the dramatic
increase of oil prices on the international market from 2002 to 2008. PLN struggled to invest,
n operations in a system that was still highly dependent on
petroleum products where declining domestic production was being met with increasing levels of
imports. Private sector investments also came to a halt during this period. Current power supplies
rely keep up with demand which is increasing at around 8 percent per year, and brownouts and
load shedding have become commonplace affecting economic growth and even ordinary consumers.
is required each year in
Track” program for the
based power generation plants by PLN, which was viewed as the
tilizing abundant domestic coal resources to displace high-cost
generation units in an affordable manner. This decision, along with existing heavy use of diesel, will
further increase the country’s dependence on fossil fuels, exacerbating local and global
fired power will add an estimated 55
million tons of CO2 per year. Overall, estimates suggest that if this trend were to continue, it would
sector over the next two decades.
In late 2008 GOI continued to expand its power generation capacity in order to keep up with
Track Program to construct another 10,000 MW of capacity in
of RE, with geothermal accounting for about 4,800 MW and
hydropower accounting for most of the other RE capacity. Geothermal power is one of the best
options to diversify Indonesia’s energy mix. It is a base load generation technology not subject to the
termittency and variability of most renewable electricity sources. As an indigenous energy source,
it will also enhance the country’s energy security and serve as a natural hedge against the volatility
can directly displace coal-fired power
generation. In addition, hydro power and biomass at various scalesprovide a useful opportunity to
grid solutions to increase rural electricity
will contribute towardsalleviating poverty and improving people’s quality of living.

FINAL DRAFT
2013 | INDONESIA SOLAR CITY GUIDEBOOK 24
The GOI has been reviewing electricity pricing and subsidy policies, since substantial economic
distortions remain. Although some reforms have taken place, the aim is to further rationalize energy
sector pricing, improving the targeting of subsidies to poor consumers, and promoting reforms
necessary for the long term sustainable development of the energy sector. Energy subsidies still
make up a substantial portion of the state budget. Since PLN continues to rely on petroleum-based
fuels for a large part of their power generation, the increased international oil prices have driven
their cost of supply from about US$0.06/kilowatt-hour (kWh) in 2004 to about US$0.12/kWh by
2008 (JICA 200914) . Since these price increases were not passed through at the retail level to
consumers, PLN required a subsidy of US$6.5 billion in 2008 to cover the resulting losses. Fuel
subsidies represent an even higher cost to the Government budget, although the GOI has eliminated
them for some sectors such as power, industry and specific categories of transport. As a result, the
prospects for EE have improved, and opportunities will continue to get better as prices are further
reformed and distortions are removed. Improved utilization of energy will not only make Indonesia
economically more competitive, but also help reduce the strain on the power sector and reduce the
burden on the national budget. Therefore, further rationalizing fuel pricing and subsidy policies
remain an imperative for improving efficiencies, minimizing price shocks, and ensuring that the
vulnerable are protected.
The GOI has also made strides to improve the policy environment so that reforms can take hold. The
recently enacted Energy Law15 (UU 30/2007) and the Electricity Law16 (UU 30/2009) provide a
renewed legal framework for the overall energy sector, with emphasis on economic sustainability,
energy security, and environmental conservation. The Energy Law places high priority on
development of domestic resources, including RE. The Electricity Law defines the regulatory and
institutional framework for the power sector going forward, and is expected to further encourage RE
and EE. Therefore, the energy sector is at a crossroads where, with continued reforms and
appropriate interventions, it can move towards greater efficiency in a climate friendly manner while
protecting the poor.
14
“Study on Energy Conservation and Efficiency Improvement in The Republic of Indonesia,
Final Report Summary;” August 2009 15
http://esdm.go.id/regulasi/uu/doc_download/4-undang-undang-nomor-30-tahun-2007.html
16http://esdm.go.id/regulasi/uu/doc_download/977-undang-undang-nomor-30-tahun-2009.html

Integrated Climate Change Strategy in Yogyakarta
Yogyakarta, as the capital city of Yogyakarta Special
sectors. In recent times, a spurt in the growth of population and business activities has been witnessed, as
a consequence of Yogyakarta being a cultural and tourism hub for foreign and local tourists, and as a
centre for education city. People from smaller neighbouring cities come to Yogyakarta to study or to make
a living in the city.
The growth of population and development of urban activities needs a commensurate increase in
supporting infrastructure, such as water supply and sanitation systems. Intensive groundwater withdrawal
in this city without sufficient recharge of groundwater affects the groundwater supply balance from time
to time, indicated by a decreasing in groundwater levels (decrease in potential
groundwater supply capacity (decrease in quantity).
Increasing population density and insufficiently treated domestic wastewater coupled with the sandy
nature of the local soil, contribute to deteriorating groundwater quality. T
faecal coliform content in groundwater wells in the urban area.
Figure 8a and 8b geographically illustrates Yogyakarta Province
Yogyakarta province borders on the districts of Sleman and Bantul.
above sea level and is divided into 14 sub
The average annual rainfall reaches 2.012 mm/year, with 119 rainy days, an average temperature of 27
degrees Celsius and an average humidity of
relatively wet air, whereas during dry season, south
16 knots/hour. In 2010, the total population reached 456,915 inhabitants with a population den
14.58 inhabitants per km2 and a population growth of 0.1%. The city’s gross domestic product (GDP)
depends mainly on the secondary and tertiary sectors such as hotels and restaurants (25.06%); services
(21.8%); transportation and communication (18.
processing industry (11.67%).
In 2010, the government of Yogyakarta launched its cooperation with GIZ PAKLIM to develop an
Integrated City Climate Strategy (ICCS). Based on data from 2009, the governmen
approximately 9.490 tCO2e of GHG emissions
government vehicle fleet (15.7%), and energy use in government buildings (2.4%). In comparison, the
community sector generates approxi
(39.6%), followed by transportation (22.2%), the commercial sector (17.7%), waste (17.1%), and the
industrial sector (3.4%). Yogyakarta’s ICCS formulates action plans and strategies that can sup
target of decreasing projected GHG emissions by 15% by 2020.
To counter the impacts of climate change, mitigation and adaptation actions will be targeted at
reducing the risk of dengue fever, twisters (stormy weather), river floods, droughts, and
temperatures (heat waves). All climate change action plans will be formulated along eight strategies to
combat dengue fever, improve the dissemination of climate change information, improve water resource
management (WRM), minimize the negative imp
efficiency of buildings and street lighting as well as in the industrial sector, improve transport management
and integrated waste management.
http://www.paklim.org/about/climate
FINAL DRAFT
Integrated Climate Change Strategy in Yogyakarta
Yogyakarta, as the capital city of Yogyakarta Special Region Province, has developed rapidly in all
sectors. In recent times, a spurt in the growth of population and business activities has been witnessed, as
a consequence of Yogyakarta being a cultural and tourism hub for foreign and local tourists, and as a
centre for education city. People from smaller neighbouring cities come to Yogyakarta to study or to make
The growth of population and development of urban activities needs a commensurate increase in
s water supply and sanitation systems. Intensive groundwater withdrawal
in this city without sufficient recharge of groundwater affects the groundwater supply balance from time
to time, indicated by a decreasing in groundwater levels (decrease in potential energy) and a reduction in
groundwater supply capacity (decrease in quantity).
Increasing population density and insufficiently treated domestic wastewater coupled with the sandy
nature of the local soil, contribute to deteriorating groundwater quality. This is indicated by increasing
faecal coliform content in groundwater wells in the urban area.
a and 8b geographically illustrates Yogyakarta Province
Yogyakarta province borders on the districts of Sleman and Bantul. The city lies approximately 114 m
above sea level and is divided into 14 sub-districts over an area of 32.5 km2.
The average annual rainfall reaches 2.012 mm/year, with 119 rainy days, an average temperature of 27
degrees Celsius and an average humidity of 24%. During rainy season, the south
relatively wet air, whereas during dry season, south-easterly winds bring dry air with a wind velocity of 5
16 knots/hour. In 2010, the total population reached 456,915 inhabitants with a population den
14.58 inhabitants per km2 and a population growth of 0.1%. The city’s gross domestic product (GDP)
depends mainly on the secondary and tertiary sectors such as hotels and restaurants (25.06%); services
(21.8%); transportation and communication (18.32%); financial services and leasing (14.03%) and the
In 2010, the government of Yogyakarta launched its cooperation with GIZ PAKLIM to develop an
Integrated City Climate Strategy (ICCS). Based on data from 2009, the governmen
approximately 9.490 tCO2e of GHG emissions – mainly produced by street lighting (82%), followed by the
government vehicle fleet (15.7%), and energy use in government buildings (2.4%). In comparison, the
community sector generates approximately 927,911 tCO2e of GHG emissions produced by settlements
(39.6%), followed by transportation (22.2%), the commercial sector (17.7%), waste (17.1%), and the
industrial sector (3.4%). Yogyakarta’s ICCS formulates action plans and strategies that can sup
target of decreasing projected GHG emissions by 15% by 2020.
To counter the impacts of climate change, mitigation and adaptation actions will be targeted at
reducing the risk of dengue fever, twisters (stormy weather), river floods, droughts, and
temperatures (heat waves). All climate change action plans will be formulated along eight strategies to
combat dengue fever, improve the dissemination of climate change information, improve water resource
management (WRM), minimize the negative impacts of extreme temperatures, improve the energy
efficiency of buildings and street lighting as well as in the industrial sector, improve transport management
and integrated waste management.
http://www.paklim.org/about/climate-change-strategies-in-cities-2/yogyakarta/#sthash.88OZlDeN.dpuf
Region Province, has developed rapidly in all
sectors. In recent times, a spurt in the growth of population and business activities has been witnessed, as
a consequence of Yogyakarta being a cultural and tourism hub for foreign and local tourists, and as a
centre for education city. People from smaller neighbouring cities come to Yogyakarta to study or to make
The growth of population and development of urban activities needs a commensurate increase in
s water supply and sanitation systems. Intensive groundwater withdrawal
in this city without sufficient recharge of groundwater affects the groundwater supply balance from time
energy) and a reduction in
Increasing population density and insufficiently treated domestic wastewater coupled with the sandy
his is indicated by increasing
The city lies approximately 114 m
The average annual rainfall reaches 2.012 mm/year, with 119 rainy days, an average temperature of 27
24%. During rainy season, the south-west wind brings
easterly winds bring dry air with a wind velocity of 5-
16 knots/hour. In 2010, the total population reached 456,915 inhabitants with a population density of
14.58 inhabitants per km2 and a population growth of 0.1%. The city’s gross domestic product (GDP)
depends mainly on the secondary and tertiary sectors such as hotels and restaurants (25.06%); services
32%); financial services and leasing (14.03%) and the
In 2010, the government of Yogyakarta launched its cooperation with GIZ PAKLIM to develop an
Integrated City Climate Strategy (ICCS). Based on data from 2009, the government sector generates
mainly produced by street lighting (82%), followed by the
government vehicle fleet (15.7%), and energy use in government buildings (2.4%). In comparison, the
mately 927,911 tCO2e of GHG emissions produced by settlements
(39.6%), followed by transportation (22.2%), the commercial sector (17.7%), waste (17.1%), and the
industrial sector (3.4%). Yogyakarta’s ICCS formulates action plans and strategies that can support the
To counter the impacts of climate change, mitigation and adaptation actions will be targeted at
reducing the risk of dengue fever, twisters (stormy weather), river floods, droughts, and extreme
temperatures (heat waves). All climate change action plans will be formulated along eight strategies to
combat dengue fever, improve the dissemination of climate change information, improve water resource
acts of extreme temperatures, improve the energy
efficiency of buildings and street lighting as well as in the industrial sector, improve transport management
2/yogyakarta/#sthash.88OZlDeN.dpuf

2013 | INDONESIA SOLAR CITY GUIDEBOOK
Chapter 2:National and Sub
Indonesia Government plays a major role in climate change mitigation in cities. The policies and
strategies emerging fromthe Indonesia
are vulnerable to the impacts of climate change.
mitigation of 26% below BAU level by 2020 through domestic eff orts and the target of 41%
reduction to be reached with international support
the attainment of these goals as they
cities provides the highest emissions reduction impacts
Provincial and Local governments are encouraged to take
improvement of agriculture practice, introduction of integrated waste management and
conservation of energy.
The following section identifies legislation at the National
should align local efforts with higher level obligations, while the Indonesia nation as a whole can
collaborate on joint efforts to build and work towards a healthier and sustainable future.
The Development of Clima
Indonesia’s National Council on Climate Change, which has 17 Ministers and is chaired by the
President, is in charge of coordinating Indonesia’s climate change policies and international
positions. The Council is supported by
oftechnology.
Indonesia is developing a strategic, multi
growth, as outlined in the National Action Plan for Climate Change (NAP 2007) and the D
Planning Response to Climate Change (2008).
In Indonesia, many of the key initiatives are embodied in decrees rather than legislation, and passed
by Ministries rather than Parliament. In late 2011, President Susilo Bambang Yudhoyono approved a
decree that obligates Indonesia to cut its emissions
and by 41 per cent if the country can secure international funding.
Figure 9 Indonesia Climate Change Development histories
FINAL DRAFT
INDONESIA SOLAR CITY GUIDEBOOK
National and Sub-national Obligations
Government plays a major role in climate change mitigation in cities. The policies and
Indonesiagovernment recognise that cities are major GHG emitters and
are vulnerable to the impacts of climate change. For Indonesia to achieve reducti
mitigation of 26% below BAU level by 2020 through domestic eff orts and the target of 41%
reduction to be reached with international support, there is a need for cities to play a
as they are the hubs of carbon intensive activities and focusing on
cities provides the highest emissions reduction impacts. In way to achieve the reduction target,
Local governments are encouraged to take action in managing land utilization
of agriculture practice, introduction of integrated waste management and
The following section identifies legislation at the National and Provincial levels, from which cities
should align local efforts with higher level obligations, while the Indonesia nation as a whole can
collaborate on joint efforts to build and work towards a healthier and sustainable future.
The Development of Climate Change Policy in Indonesia
Indonesia’s National Council on Climate Change, which has 17 Ministers and is chaired by the
President, is in charge of coordinating Indonesia’s climate change policies and international
positions. The Council is supported by several Working Groups, including on mitigation, and transfer
Indonesia is developing a strategic, multi-year policy and investment program for low
growth, as outlined in the National Action Plan for Climate Change (NAP 2007) and the D
Planning Response to Climate Change (2008).
In Indonesia, many of the key initiatives are embodied in decrees rather than legislation, and passed
by Ministries rather than Parliament. In late 2011, President Susilo Bambang Yudhoyono approved a
ecree that obligates Indonesia to cut its emissions by 26 per cent below unchecked levels by 2020,
41 per cent if the country can secure international funding.
Indonesia Climate Change Development histories
26
Government plays a major role in climate change mitigation in cities. The policies and
ajor GHG emitters and
to achieve reduction targets
mitigation of 26% below BAU level by 2020 through domestic eff orts and the target of 41%
to play a pivotal role in
of carbon intensive activities and focusing on
In way to achieve the reduction target,
action in managing land utilization,
of agriculture practice, introduction of integrated waste management and
and Provincial levels, from which cities
should align local efforts with higher level obligations, while the Indonesia nation as a whole can
collaborate on joint efforts to build and work towards a healthier and sustainable future.
Indonesia’s National Council on Climate Change, which has 17 Ministers and is chaired by the
President, is in charge of coordinating Indonesia’s climate change policies and international
several Working Groups, including on mitigation, and transfer
year policy and investment program for low-carbon
growth, as outlined in the National Action Plan for Climate Change (NAP 2007) and the Development
In Indonesia, many of the key initiatives are embodied in decrees rather than legislation, and passed
by Ministries rather than Parliament. In late 2011, President Susilo Bambang Yudhoyono approved a
26 per cent below unchecked levels by 2020,

Indonesia’s National Action Plan (NAP) to Combat Climate Change
Indonesia does not have any obligation to reduce its greenhouse
demonstrated interests in playing an active role in the global efforts to
NAP, which was released in November 2007, is a dynamic instrument to serve
domestic institutions in carrying out a coordinated and integrated effort to address clima
In the area of mitigation, the NAP identifies energy and land use change and forestry as
where Indonesia will seek international cooperation and funding to support its effort
sector, the NAP establishes an emissions reduction target of 30 percent from BAU
2012–2025, and a 50 percent reduction from BAU during the period 2025
priorities areas of focus are diversification toward renewable energy sources, improving energy
efficiency in industrial sectors, and
adaptation, the NAP aims to target a range of key
manage risk; agricultural intensification and irrigation
improvements; energy and water saving technologies in the
improvements to prevent disease, identi
The NAP also focuses strongly on the need for institutional capacity bui
and revision of the regulatory policy framework for sustainable developme
outlines existing climate change response actions, including ratification of international ag
creation of domestic institutions, passage of l
forestry sectors, and implementing programs to improve energy use, address forest and land fires
combat illegal deforestation, improve management of peat land, address flooding issues and
conduct integrated coastal zone
Indonesia plans to utilize domestic public
develop approaches for techno
support for its development priorities.
INDONESIA’s PRIORITY SECTORS FOR GHG EMISSION REDUCTION
The NAP (2007) provides analyses of GHG emissions and a comprehensiveassessment and program
for both adaptationand mitigation. Mitigation targets for
percent reduction from BAU during the period 2012
during the period 2025–2050. Indonesia’s TNA
assessments and cost estimatesw
technologically feasible by 2025
andexpansion of a combination of a broad spectrum of demand
development of RE systems, development of clean
and storage from fossil-fuel power plants.
Based on technology and cost analyses presented in the 2009 TNA report, GHGreduction priorities
are in industrial EE, EE and RE in the
17
TNA: Technology Needs Assessment onClimate Change Mitigation
FINAL DRAFT
sia’s National Action Plan (NAP) to Combat Climate Change
Indonesia does not have any obligation to reduce its greenhouse gas emissions; however, it has
demonstrated interests in playing an active role in the global efforts to tackle climate change. The
which was released in November 2007, is a dynamic instrument to serve as guidance to various
institutions in carrying out a coordinated and integrated effort to address clima
NAP identifies energy and land use change and forestry as
will seek international cooperation and funding to support its effort
establishes an emissions reduction target of 30 percent from BAU
percent reduction from BAU during the period 2025–2050. The three mai
diversification toward renewable energy sources, improving energy
in industrial sectors, and implementation of cleaner energy technologies. Under
P aims to target a range of key areas, including climate information forecasting to
intensification and irrigation technologies; water resources management
ater saving technologies in the industry sector; and health sector
improvements to prevent disease, identify impacts, and utilize natural medicinal plants.
The NAP also focuses strongly on the need for institutional capacity building and for harm
revision of the regulatory policy framework for sustainable development management. The NAP
existing climate change response actions, including ratification of international ag
domestic institutions, passage of laws and regulations in the energy, mine
implementing programs to improve energy use, address forest and land fires
improve management of peat land, address flooding issues and
coastal zone management. To implement the actions outlined in the NAP,
lans to utilize domestic public finance through new mechanisms and fiscal instruments;
develop approaches for technology transfer from developed countries; and increase inte
support for its development priorities.
INDONESIA’s PRIORITY SECTORS FOR GHG EMISSION REDUCTION
The NAP (2007) provides analyses of GHG emissions and a comprehensiveassessment and program
and mitigation. Mitigation targets for energyrelatedemissions include a 30
percent reduction from BAU during the period 2012–2025,and a 50 percent reduction from BAU
2050. Indonesia’s TNA17report (2009) includes energy modelling
assessments and cost estimateswhich indicate that over 30 percent GHG reductions are
technologically feasible by 2025. Emission reductions would be achieved through acceleration
andexpansion of a combination of a broad spectrum of demand- and supply
systems, development of clean-coal plants, anddeployment of carbon capture
fuel power plants.
Based on technology and cost analyses presented in the 2009 TNA report, GHGreduction priorities
are in industrial EE, EE and RE in the power sector, and cleanertransport. This is also substantiated
Technology Needs Assessment onClimate Change Mitigation (Climate Investment Fund
sia’s National Action Plan (NAP) to Combat Climate Change
gas emissions; however, it has
tackle climate change. The
as guidance to various
institutions in carrying out a coordinated and integrated effort to address climate change.
NAP identifies energy and land use change and forestry as key priorities
will seek international cooperation and funding to support its effort. In the energy
establishes an emissions reduction target of 30 percent from BAU during the period
2050. The three main
diversification toward renewable energy sources, improving energy
n of cleaner energy technologies. Under
areas, including climate information forecasting to
technologies; water resources management
industry sector; and health sector
medicinal plants.
lding and for harmonization
nt management. The NAP
existing climate change response actions, including ratification of international agreements,
aws and regulations in the energy, minerals, and
implementing programs to improve energy use, address forest and land fires,
improve management of peat land, address flooding issues and
management. To implement the actions outlined in the NAP,
finance through new mechanisms and fiscal instruments;
developed countries; and increase international
INDONESIA’s PRIORITY SECTORS FOR GHG EMISSION REDUCTION
The NAP (2007) provides analyses of GHG emissions and a comprehensiveassessment and program
energyrelatedemissions include a 30
2025,and a 50 percent reduction from BAU
modelling, technology
hich indicate that over 30 percent GHG reductions are
Emission reductions would be achieved through acceleration
and supply-side EE,accelerated
coal plants, anddeployment of carbon capture
Based on technology and cost analyses presented in the 2009 TNA report, GHGreduction priorities
power sector, and cleanertransport. This is also substantiated
(Climate Investment Fund – 2010)

FINAL DRAFT
2013 | INDONESIA SOLAR CITY GUIDEBOOK 28
by a recent draft marginal abatement cost curve presented by the National Climate Change
Committee in 2009, in which it highlights the ranking of costs andabatement potentials of mitigation
options in the power sector, as the following: (i) EEand conservation, particularly industrial end-use
efficiency; and (ii) RE,primarilygeothermal, hydropower, and biomass. The third option, which is
proposed for a secondphase investment if Clean Technology Fund funding is forthcoming, (iv)
cleaner transport.
Indonesia’s most recent policy document on climate change is the Second National Communication
under the UNFCCC (November 2009)18. The Communication reports that energy is the largest non-
land use source of emissions, growing from 333,540 Gg CO2 in 2000 to 395,990 Gg CO2 in 2005
which represents a 25 percent increase. The Communication further notes that, with RE and EE
measures, emissions from the energy sector could be reduced by 2020 in a range between 35 and 40
percent compared with the BAU scenario19. Mitigation options include increased power generation
from new/renewable energy sources such as geothermal and increased EE in the transportation,
industry and residential/commercial sectors.
Indonesia has also recently issued its Green Paper on Economic and Fiscal PolicyOptions for Climate
Change Mitigation (Ministry of Finance, November 2009). For theenergy sector, it proposes to: (i)
impose a carbon tax/levy on fossil fuel combustioncoupled with access to international markets,
facilitated by negotiation of a “no-lose”target, and (ii) introduce complementary measures to
incentivize EE and deployment oflow-emission technology, exemplified by a specific geothermal
policy strategy.
The identified GHG reduction priorities are being translated into actions(investments, programs and
policies) through the following vehicles:
• NAP – the NAP (2007) calls for a range of mitigation actions in the energy sector revolving
around energy efficiency and renewable energy. These were translated into a set of initial
investments for 2008-09 by BAPPENAS through the RPJM (2008).
• Climate Change Roadmap – reducing carbon emissions from the energy and forestry sectors
are pillars of the roadmap that seeks to bridge the period between the NAP and the National
Medium-Term Development Program 2010-2014.
• Presidential commitment – the President of Indonesia has recently committed to significant
reductions in future GHG emissions. He has asked that nearly half of these reductions come
from the energy sector and by reducing waste. The Government is currently formulating its
proposals for achieving these targets.
Beyond these specific actions, Indonesia has put forward three consistent development and climate
change messages: (i) climate change cannot be addressed at theexpense of the poor; (ii) climate
investments must be consistent with development goals;and (iii) climate assistance must be on top
of past development assistance commitments.
18
http://unfccc.int/files/national_reports/non-
annex_i_natcom/submitted_natcom/application/pdf/indonesia_snc.pdf
19Average value of historical emission [Year 2000 – 2005]

Indonesia plans to improve emission estimates,
National GHG Inventory. At present, activities undertaken
Agriculture to improve emission estimates from peat lands are the following:
a. The Ministry of Agricultu
Variability and Climate Change) is conducting studies to develop emissions factors from peat
lands under different usage scenarios in Central Kalimantan. The Ministry of Agriculturewill
also expand this study to other provinces and request support from internationalagencies.
Additional surveys to improve data on peat depth (particularly in Papua) are alsobeing
planned. It is expected that the funding allocated for the 3rd National Communicationcan
provide additional support for the studies.
b. The Ministry of Forestry is improving the emission sink factors from forests and
emissionfactors from fi re (both in mineral soils and peat land). The programme is being
undertakenthrough the INCAS (Indonesian Natio
relevantresearch programmes under the MoF and partners.
c. The state Ministry of Environment is conducting a pilot study on Peatland
Management,including calculation of GHG emissions from peat lands in West Kalimantan
and RiauProvince.
d. A detailed analysis commissioned by Indonesia’s National Development Planning
Agency(BAPPENAS) is also commissioning a detail analysis on peat land emission and
projectionas well as mitigation strategies. The analysis is undertaken by a mu
team ofIndonesian scientists, economists and legal specialists.
FINAL DRAFT
Indonesia plans to improve emission estimates, particularly from LULUCF and peat lands in the
National GHG Inventory. At present, activities undertaken by the Ministry of Forestry and
Agriculture to improve emission estimates from peat lands are the following:
The Ministry of Agriculture (through the National Research Consortium for Climate
Variability and Climate Change) is conducting studies to develop emissions factors from peat
erent usage scenarios in Central Kalimantan. The Ministry of Agriculturewill
his study to other provinces and request support from internationalagencies.
Additional surveys to improve data on peat depth (particularly in Papua) are alsobeing
planned. It is expected that the funding allocated for the 3rd National Communicationcan
vide additional support for the studies.
The Ministry of Forestry is improving the emission sink factors from forests and
emissionfactors from fi re (both in mineral soils and peat land). The programme is being
undertakenthrough the INCAS (Indonesian National Carbon Accounting System) and other
relevantresearch programmes under the MoF and partners.
The state Ministry of Environment is conducting a pilot study on Peatland
Management,including calculation of GHG emissions from peat lands in West Kalimantan
A detailed analysis commissioned by Indonesia’s National Development Planning
Agency(BAPPENAS) is also commissioning a detail analysis on peat land emission and
projectionas well as mitigation strategies. The analysis is undertaken by a mu
team ofIndonesian scientists, economists and legal specialists.
om LULUCF and peat lands in the next
by the Ministry of Forestry and Ministry of
re (through the National Research Consortium for Climate
Variability and Climate Change) is conducting studies to develop emissions factors from peat
erent usage scenarios in Central Kalimantan. The Ministry of Agriculturewill
his study to other provinces and request support from internationalagencies.
Additional surveys to improve data on peat depth (particularly in Papua) are alsobeing
planned. It is expected that the funding allocated for the 3rd National Communicationcan
The Ministry of Forestry is improving the emission sink factors from forests and
emissionfactors from fi re (both in mineral soils and peat land). The programme is being
nal Carbon Accounting System) and other
The state Ministry of Environment is conducting a pilot study on Peatland
Management,including calculation of GHG emissions from peat lands in West Kalimantan
A detailed analysis commissioned by Indonesia’s National Development Planning
Agency(BAPPENAS) is also commissioning a detail analysis on peat land emission and
projectionas well as mitigation strategies. The analysis is undertaken by a multi-disciplinary

FINAL DRAFT
2013 | INDONESIA SOLAR CITY GUIDEBOOK 30
Chapter 3: Evolution of the Solar City Concept
With rapid urbanization and concentration of economic
activities in urban areas, cities have emerged as large
consumers of energy and resources. With the coming of age
position taken towards better and greener cities led to the
development of many concepts for sustainable city
development, and one of which was the concept of a Solar
Cities.
Initiatives began in the form of networks made up of cities,
sometimes coordinated by national or regional governments
that worked on creation of policy and enabling market
mechanisms along with strong awareness generation for the
local adoption of renewable energy. Some of the
initialgroups that joined this movement included the
Brundtland City Energy Network formed in 1999, the
European Green Cities Network in 1996, Energie Cites
Association [Energie C].
The First International Solar Cities Initiative (ISCI) World
Congress was held in Daegu, South Korea, November 14-18
2004. At this Congress, 19 cities from around the world
presented their policies and programs for incorporating
renewable energy and other clean energy forms into urban
development.
City solutions range from solar photovoltaic panels to
offshore wind farms, to a concentrating of solar power
towers. Environmental auditing, smart metering and certification are other strategic solutionsthat
are employed in several cities around the world. All of these initiatives are supported in all such
cities by strong awareness raising and promotional activities.
“The term ‘solar (and sustainable)
cities’ is a broad term that can
encapsulatemany different
initiatives, activities, and
technologies. Generally, it implies
renewable energy, energy
efficiency, sustainable transport
options, new urban planning
methods or goals, architectural
innovation, and environmental
health.
Definitions of "solar cities" by the
International Solar Cities Initiative
and the European Solar Cities
Initiative also include a
"climate‐stabilization" aspect,
whereby cities responsibly set
per‐capita targets for future
greenhouse‐gas emissions at levels
consistent with stabilizing future
levels of atmospheric
carbondioxide and other
greenhouse gases.”
Eric Martinot (www.martinot.info)

Figure
Features of international solar city programs
The tables below providenine case studies of international solar city programs, in summary the
Program names are listed below:
1. 100,000 Rooftops Solar Power Program (Germany)
2. Solar Cities (Australia)
3. Development of Solar Cities (India)
4. Solar America Communities (Amer
5. European Solar Cities
6. Freiburg Solar City (Germany)
7. SolarCity Linz (Austria)
8. Solar City Daegu (SCD) 2050 (South Korea)
9. Solar Cities in China (China)
FINAL DRAFT
Figure 10: Solar city initiatives by Nikola Knezevic
Features of international solar city programs
case studies of international solar city programs, in summary the
listed below:
100,000 Rooftops Solar Power Program (Germany)
Development of Solar Cities (India)
Solar America Communities (America)
Freiburg Solar City (Germany)
Solar City Daegu (SCD) 2050 (South Korea)
Solar Cities in China (China)
case studies of international solar city programs, in summary the

FINAL DRAFT
2013 | INDONESIA SOLAR CITY GUIDEBOOK 32
S. no. Particulars Description
1 Name of Program 100,000 Rooftops Solar Power Program (Germany)
2 Instating agency German Federal Government
3 Timeline 1999 to 2004
4 Scope Country-wide initiative to install solar panels on 100,000 rooftops with cumulative
increase over the program duration. Anyone with a south facing and adequate roof
area was eligible for the program
5 Motivation Increasing the renewable energy share in the country’s energy mix and to decrease
dependence on fossil fuels. Emission reduction commitment under Kyoto protocol
was also a factor. Other aims/objectives were to:
• Address energy issues independent of nuclear energy
• Gain experience with solar installations
• Make new housing compatible with renewable electricity generation needs
6 Approach Interested home owners and institutions applied for the loan from the total
funding earmarked by the Federal Government at $500 million. 10-year low
interest loans were sanctioned to the applicants who were to contract solar PV
companies and installers for installation based on their individual home
requirements. The loan precluded any down payments or interest for the first two
years and the installation was subsidized to roughly about 20% of its total value.
7 Impact • Successful installation of solar panels on 100,000 rooftops in the country
• The program significantly increased the share of solar energy use in Germany
with 130 MW installed until 2000 and significant capacity increments
expected thereafter.
• Increase in the mass manufacture capability of German solar panel
manufacturers
• Increased public interest, awareness in solar energy eventually stimulating
consumer usage of solar energy
• Continued and reliable dependence on solar energy in domestic and
industrial sectors continues making 20% of German energy needs renewable
energy dependant
8 Sources http://www.a1solar.co.uk/german_rooftop_program.html
http://thebreakthrough.org/blog/2009/04/soaking_up_the_sun_solar_power.shtm
l

S. no. Particulars Description
1 Name of Program ‘Solar Cities’ (Australia)
2 Instating agency German Federal Government
3 Timeline 2004 and
4 Scope Australian Government in partnership with the community and industry is set
to trail a range
cities across the country.
5 Motivation The government intends to reduce household energy bills and limiting and
deferring upgrade to electricity infrastructure by leveraging solar energy
towa
6 Approach Seven cities Adelaide, Alice Springs, Blacktown, Central Victoria, Moreland,
Perth and Townsville were developed as Solar Cities with financial and
technical assistance from the Government.
The program is aimed at
energy wisely, implement solar technologies and engage in actively reducing
their emissions. The review would entail benefits like tax cuts, higher family
benefits, higher pension and allowances.
7 Impact •
•
•
8 Sources http://www.cleanenergyfuture.gov.au/solar
http://www.cleanenergyfuture.gov.au/more
FINAL DRAFT
Description
‘Solar Cities’ (Australia)
German Federal Government
2004 and on going
Australian Government in partnership with the community and industry is set
to trail a range of products and services under real-world conditions in seven
cities across the country.
The government intends to reduce household energy bills and limiting and
deferring upgrade to electricity infrastructure by leveraging solar energy
rds urban self-sufficiency.
Seven cities Adelaide, Alice Springs, Blacktown, Central Victoria, Moreland,
Perth and Townsville were developed as Solar Cities with financial and
technical assistance from the Government.
The program is aimed at monitoring and rewarding the households that use
energy wisely, implement solar technologies and engage in actively reducing
their emissions. The review would entail benefits like tax cuts, higher family
benefits, higher pension and allowances.
The program ties in with other climate change mitigation and low carbon
initiatives of the Australian government
The success of the ‘Solar Cities’ program has helped instigating the
National Solar Schools Program which is a country
recently added 784 more schools to about 3000 existing ones. The
schools are being given grants of up to $50,000. The program began on
13th Feb 2012 and will last for a year.
Among other achievements some were:
� Two 300 kW PV parks in Bendigo and Ballarat
� Australia’s largest roof-mounted solar system (at the time of
installation)—a 305 kW PV system at Crowne Plaza in Alice Springs
http://www.cleanenergyfuture.gov.au/solar-cities-a-catalyst
http://www.cleanenergyfuture.gov.au/more-schools-
Australian Government in partnership with the community and industry is set
world conditions in seven
The government intends to reduce household energy bills and limiting and
deferring upgrade to electricity infrastructure by leveraging solar energy
Seven cities Adelaide, Alice Springs, Blacktown, Central Victoria, Moreland,
Perth and Townsville were developed as Solar Cities with financial and
monitoring and rewarding the households that use
energy wisely, implement solar technologies and engage in actively reducing
their emissions. The review would entail benefits like tax cuts, higher family
The program ties in with other climate change mitigation and low carbon
The success of the ‘Solar Cities’ program has helped instigating the
National Solar Schools Program which is a country-wide initiative and has
recently added 784 more schools to about 3000 existing ones. The
schools are being given grants of up to $50,000. The program began on
Two 300 kW PV parks in Bendigo and Ballarat
mounted solar system (at the time of
t Crowne Plaza in Alice Springs
catalyst-for-change/
-to-go-solar/

FINAL DRAFT
2013 | INDONESIA SOLAR CITY GUIDEBOOK 34
S. no. Particulars Description
1 Name of Program ‘Development of Solar Cities’ (India)
2 Instating agency Central Government of India, through the Ministry of New and Renewable
Energy (MNRE)
3 Timeline 2008 and on going
4 Scope MNRE is targeting 60 cities to be developed as Solar Cities out of which 31 have
been given in-principle approval for development into solar cities. The program
is administered by Central government designated State-level nodal agencies
and will include a set of activities to be mandatorily undertaken in efforts to
plan for a10% reduction in conventional energy demand over the next 5 years.
5 Motivation Burgeoning cityscapes and rapid urbanization are increasing the energy
demand on already energy-strained Indian cities. As a means of developing
Indian cities as self-sustaining energy hubs, the program aims at introducing
renewable energy and energy efficiency initiatives through comprehensive
planning, implementable activities and increasing local capacity building
6 Approach MNRE undertook a novel approach in implementation of the program:
• The cities are invited to sign-up for the program based on the guidelines
issued by MNRE
• The cities then prepare a Master Plan through MNRE authorized
consultants outlining the activities and plan of action
• Upon approval of the Master Plan, the city Corporations implement the
pilot projects and set the solar city development in motion
• Funding for the program is subsidized by the MNRE and the cities are
developed as pilot cities and model cities for demonstration of success
• Each solar city is directed to establish a dedicated solar city cell which
will serve as the nodal point for all activities taking place under the
program
7 Impact • Solar Cities program has imparted State and local level autonomy to
undertake renewable energy and energy efficiency initiatives which are
best suited to local conditions
• In principle approval has been issued to 48 cities out of which 37 cities
have had their Master Plan sanctioned
• Seven cities have already started executing the Master Plans and out of
Rs. 17.23 crore earmarked for 37 cities, Rs. 2.75 has been released for
utilization to nodal agencies/municipal corporations
• The project will be expanded over the next few years with learning taking
place from its initial phases.
8 Sources mnre.gov.in/file‐manager/UserFiles/solar_city_guidelines.pdf
http://www.mnre.gov.in/schemes/decentralized-systems/solar-cities/

S. no. Particulars Description
1 Name of Program ‘Solar America Communities’ (America)
2 Instating agency Department of Energy, Government of USA
3 Timeline 2007 to 2008; Scaled
4 Scope The program was aimed at increasing the federal
development of feasible solutions in 25 cities in the country. The program also
involved capacity building and training local government staff to facilitate
develo
The program guidance and capacity building initiatives were also scaled
2010 with an aim to be expanded to reach up to 5,000 local governments
supported by a funding of $10 million over 5 years.
5 Motivation The program was aimed at increasing widespread, large
across America by making solar energy systems cost
forms of energy by the end of the decade.
6 Approach Within each of the 25 cities, the following activi
execution:
•
•
•
7 Impact Besides successfully creating jobs and awareness of the program in American
cities, the program has increased the public
DOE's Solar America Initiative of approximately $150 million for 13 solar
technology development projects has been earmarked to advance the
commercial competitiveness of solar electricity and to bring down the costs of
Solar
8 Sources http://solaramericacommunities.energy.gov/
http://www.good.is/post/for
http://www.icleiusa.org/news/press
energy
FINAL DRAFT
Description
‘Solar America Communities’ (America)
Department of Energy, Government of USA
2007 to 2008; Scaled up in 2010
The program was aimed at increasing the federal-local partnerships and
development of feasible solutions in 25 cities in the country. The program also
involved capacity building and training local government staff to facilitate
development of Solar America communities.
The program guidance and capacity building initiatives were also scaled
2010 with an aim to be expanded to reach up to 5,000 local governments
supported by a funding of $10 million over 5 years.
The program was aimed at increasing widespread, large
across America by making solar energy systems cost-competitive with other
forms of energy by the end of the decade.
Within each of the 25 cities, the following activities facilitated the project
execution:
Instatement of a Solar Advisory committee and local solar coordinator.
Preparation of targets based on survey of city inhabitants and
identification of local barriers
Guidance and training of local governments in solar policy and
regulations, financial initiatives and workforce training
Besides successfully creating jobs and awareness of the program in American
cities, the program has increased the public-private partnerships. Funding from
DOE's Solar America Initiative of approximately $150 million for 13 solar
technology development projects has been earmarked to advance the
commercial competitiveness of solar electricity and to bring down the costs of
PV.
http://solaramericacommunities.energy.gov/
http://www.good.is/post/for-more-solar-energy-occupy
http://www.icleiusa.org/news/press-room/press-releases/department
energy-selects-iclei-to-accelerate-solar-adoption
local partnerships and
development of feasible solutions in 25 cities in the country. The program also
involved capacity building and training local government staff to facilitate
The program guidance and capacity building initiatives were also scaled-up in
2010 with an aim to be expanded to reach up to 5,000 local governments
The program was aimed at increasing widespread, large-scale adoption of solar
competitive with other
ties facilitated the project
Instatement of a Solar Advisory committee and local solar coordinator.
Preparation of targets based on survey of city inhabitants and
Guidance and training of local governments in solar policy and
regulations, financial initiatives and workforce training
Besides successfully creating jobs and awareness of the program in American
vate partnerships. Funding from
DOE's Solar America Initiative of approximately $150 million for 13 solar
technology development projects has been earmarked to advance the
commercial competitiveness of solar electricity and to bring down the costs of
occupy-rooftops/
releases/department-of-

FINAL DRAFT
2013 | INDONESIA SOLAR CITY GUIDEBOOK 36
S. no. Particulars Description
1 Name of Program European Solar Cities
2 Instating agency European Union
3 Timeline Non-specific timeframes
4 Scope The European Solar Cities initiative is a diversified mandate committed by the
EU to render financial and organizational support such initiatives across
Europe.
5 Motivation Within a larger aim towards emissions reduction and climate change
mitigation, the European Solar Cities initiative is motivated towards:
� Mobilizing stakeholders
� Increasing communication between cities
� Integrating cities especially from the Eastern Europe in Solar City
development
� Maintaining a repository of information for activities under the Solar
City development mandate
6 Approach European Union under its climate change mitigation framework has committed
to co-fund, support and partly administer projects that leverage solar power
for empowerment of cities to generate renewable energy. Some examples of
the programs supported by the EU are:
� Multiplying Sustainable Energy Communities (MUSEC)
� Concerto Initiative
� European Solar Cities Initiative (ESCi)
� Desertec
7 Impact EU has committed to an independent economy-wide emissions reduction
target of 20% by 2020, compared with 1990 levels. In line with this
commitment, each of the EU member country is increasing the use of solar and
other renewable forms of energy through city level initiatives co-funded by the
EU. Until Dec 2010, the total installed solar PV capacity was 29.32 GWp.
8 Sources http://www.eurobserv-er.org/pdf/baro202.pdf
https://www.ises.org/ises.nsf/f3e5b699aa79d0cfc12568b3002334da/eba26afb
c357097ac1256d73004be5ea?OpenDocument
http://concerto.eu/concerto/about-concerto
http://www.musecenergy.eu/web/project.html

S. no. Particulars Description
1 Name of Program Freiburg Solar City (Germany),
2 Instating agency Freiburg Local Government
3 Timeline Non-specific timeframes
4 Scope Working within their jurisdictional boundaries, Freiburg has introduced
interventions in domestic, commercial, industrial and municipal sectors
through systematic initiatives in the areas of transport, waste
5 Motivation Driven by the city’s energy polic
new technologies and the use of renewable energy sources, the city has
resolved further to reduce emissions through calls for initiatives in the areas of
transport, waste and industrial production, as well as ener
6 Approach In Freiburg, the on
defined by timelines. The approach followed in this case is to introduce
sustainable and eco
ordinances and government orders. Similar
adopted by other European cities like
7 Impact Freiburg has successfully reached a total installed solar PV capacity of 3.2 MW
earlier than most European cities producing 3 million
the grid. In addition, the city has introduced SWH systems and Solar Thermal
systems for use in community swimming pools. Such ordinances and policies
for environmentally conscious development have proved to be an asset for the
city of Freiburg. Furthermore. The city aims to reduce its dependence on
nuclear energy and increase use of renewable forms of energy.
8 Sources http://www.solarregion.freib
FINAL DRAFT
Description
Freiburg Solar City (Germany),
Freiburg Local Government
specific timeframes
Working within their jurisdictional boundaries, Freiburg has introduced
interventions in domestic, commercial, industrial and municipal sectors
through systematic initiatives in the areas of transport, waste
Driven by the city’s energy policy based on energy conservation, the use of
new technologies and the use of renewable energy sources, the city has
resolved further to reduce emissions through calls for initiatives in the areas of
transport, waste and industrial production, as well as ener
In Freiburg, the on-going solar city development is progressive and is not
defined by timelines. The approach followed in this case is to introduce
sustainable and eco-friendly measures (as explained above) through
ordinances and government orders. Similar model of policy direction has been
adopted by other European cities like Madrid, Pamplona, Sevilla, and Co
Freiburg has successfully reached a total installed solar PV capacity of 3.2 MW
earlier than most European cities producing 3 million
the grid. In addition, the city has introduced SWH systems and Solar Thermal
systems for use in community swimming pools. Such ordinances and policies
for environmentally conscious development have proved to be an asset for the
of Freiburg. Furthermore. The city aims to reduce its dependence on
nuclear energy and increase use of renewable forms of energy.
http://www.solarregion.freiburg.de/solarregion/freiburg_solar_city.php
Working within their jurisdictional boundaries, Freiburg has introduced
interventions in domestic, commercial, industrial and municipal sectors
through systematic initiatives in the areas of transport, waste
y based on energy conservation, the use of
new technologies and the use of renewable energy sources, the city has
resolved further to reduce emissions through calls for initiatives in the areas of
transport, waste and industrial production, as well as energy
going solar city development is progressive and is not
defined by timelines. The approach followed in this case is to introduce
friendly measures (as explained above) through
model of policy direction has been
Madrid, Pamplona, Sevilla, and Conil.
Freiburg has successfully reached a total installed solar PV capacity of 3.2 MW
earlier than most European cities producing 3 million kWh per year for use in
the grid. In addition, the city has introduced SWH systems and Solar Thermal
systems for use in community swimming pools. Such ordinances and policies
for environmentally conscious development have proved to be an asset for the
of Freiburg. Furthermore. The city aims to reduce its dependence on
nuclear energy and increase use of renewable forms of energy.
urg.de/solarregion/freiburg_solar_city.php

FINAL DRAFT
2013 | INDONESIA SOLAR CITY GUIDEBOOK 38
S. no. Particulars Description
1 Name of Program SolarCity Linz (Austria)
2 Instating agency EU and Local Government (Linz)
3 Timeline Non-specific timeframes
4 Scope Urban housing design and planning in Linz and the housing policy has been
aligned for sustainable and environmentally conscious development.
5 Motivation Besides the requirement of housing for a large section of city inhabitants, the
program is motivated towards providing energy efficient living arrangements
which stems from avoiding the use of fossil fuels and energy conservation.
6 Approach Linz city government has developed sustainable urban spaces and housing
projects. The project has satiated the rising housing needs of the inhabitants
and also proved beneficial for future urban development projects through
restructuring of outmoded housing policies.
7 Impact The project began in early 90’s and has succeeded in reducing housing
investments through use of district heating systems and SWH etc. In addition,
waste water management and its reuse for agricultural purposes have been
successfully implemented. About 1300 housing apartments were built in the
pilot phase and the urban and infrastructural development policies in Linz have
been since restructured for sustainable urban development.
8 Sources http://www.linz.at/english/life/3199.asp

S. no. Particulars Description
1 Name of Program Solar City Daegu (SCD) 2050 (South Korea)
2 Instating agency Daegu Local Government
3 Timeline Near-
4 Scope The project is intended to develop and promote new and renewable energy
industries within its borders and thereby increase 5% of its renewable energy
use.
5 Motivation The project is intended to increase, besides the share of renewable energy in
the country’s energy mix, community participation, real energy transition and
spread of renewable energy projects in Asia.
6 Approach The Solar City Daegu 2050 is a comprehensi
several initiatives including Green Villages,
Solar Schools and Solar Villages. The project considers urban and peri
development through targeted programs which offer
further project promulgati
7 Impact Until 2006, the renewable energy development driven under the project has
been successful in installing 4,412 at 35 sites and 170kW solar power
generation facilities in 75 general households. The project also covered public
places, precincts and community
stops for solar PV installations.
8 Sources http://www.world
http://www.ceep.udel.edu/publications/sustainabledevelopment/publications
/2006_sd_BSTS_solar_cities_Daegu_2050_project.pdf
FINAL DRAFT
Description
Solar City Daegu (SCD) 2050 (South Korea)
Daegu Local Government
-term project
The project is intended to develop and promote new and renewable energy
industries within its borders and thereby increase 5% of its renewable energy
The project is intended to increase, besides the share of renewable energy in
the country’s energy mix, community participation, real energy transition and
spread of renewable energy projects in Asia.
The Solar City Daegu 2050 is a comprehensive city wide program composed of
several initiatives including Green Villages,
Solar Schools and Solar Villages. The project considers urban and peri
development through targeted programs which offer
further project promulgation.
Until 2006, the renewable energy development driven under the project has
been successful in installing 4,412 at 35 sites and 170kW solar power
generation facilities in 75 general households. The project also covered public
places, precincts and community halls in addition to parking spaces and bus
stops for solar PV installations.
http://www.world-renewable-energy-forum.org/2004/download/Kim.pdf
http://www.ceep.udel.edu/publications/sustainabledevelopment/publications
/2006_sd_BSTS_solar_cities_Daegu_2050_project.pdf
The project is intended to develop and promote new and renewable energy
industries within its borders and thereby increase 5% of its renewable energy
The project is intended to increase, besides the share of renewable energy in
the country’s energy mix, community participation, real energy transition and
ve city wide program composed of
Solar Schools and Solar Villages. The project considers urban and peri-urban
development through targeted programs which offer spill over benefits for
Until 2006, the renewable energy development driven under the project has
been successful in installing 4,412 at 35 sites and 170kW solar power
generation facilities in 75 general households. The project also covered public
halls in addition to parking spaces and bus
forum.org/2004/download/Kim.pdf
http://www.ceep.udel.edu/publications/sustainabledevelopment/publications
/2006_sd_BSTS_solar_cities_Daegu_2050_project.pdf

FINAL DRAFT
2013 | INDONESIA SOLAR CITY GUIDEBOOK 40
S. no. Particulars Description
1 Name of Program Solar Cities in China (China)
2 Instating agency Beijing Municipal Commission of Development and Reform
3 Timeline Non-specific
4 Scope Cities in China are heading towards extensive solar deployment in alignment
with National solar development policy.
5 Motivation Chinese renewable energy investments peaked in 2011 and increasing the
share of renewable energy share in the country’s energy mix, Chinese
government is targeting renewable energy use in cities as a method to abate
the impending energy crisis due to rising fossil fuel costs and its huge
population.
6 Approach The government has instated the development of solar energy through
establishment of 6 major "Golden Sunlight Projects” which include 20,000 kW
rooftop solar photovoltaic (PV) power generation project, a 50,000 kW on-grid
solar power station demonstration project. Several similar such demonstration
projects have been planned across the country and are intended to have a
positive effect on global perception of Chinese clean technologies but also
accelerate the country’s solar development.
7 Impact The project has been touted to increase Chinese share in global renewable
energy percentage with total solar energy power generation capacity at 70
MW. The projections indicate that increase in capacity will even hit 300 MW by
2020. Beijing is thought to be the first solar city in China, heading to the target
of being the largest solar market throughout the world. Beijing’s solar
development policies have been emulated at other cities like Dezhou, Rizhou,
Kunming and others.
8 Sources http://www.chinasolarcity.cn/Html/dezhou/index.html
http://inhabitat.com/rizhao-the-sunshine-city/
http://www.gokunming.com/en/blog/item/295/kunming_named_chinas_solar
_city

ICLEI Local Renewable
With the Local Renewables Initiative
Governments for Sustainability supports and strengthens the role
of local governments that promote the generation and supply of
renewable energy and energy efficiency in the urban
environment. The focus is on the roles and responsibilities
governments as a driving force for innovation and investment in
their communities.
The focus on local government adoption and promotion of
renewable energy and energy efficiency is because local
governments play a key role in promoting
community level. They have a political mandate to govern and guide
their communities, provide services and manage municipal assets.
They have legislative and purchasing power that they can use to
implement change in their own operat
community. Local governments can further play a role as a model
their region or country, showing how policies and local actions can
be shaped to guide communities in the transition to a sustainable energy future.
Leading cities cooperate in the global Local Renewables Network, share their expertise and
experience on Renewable Energy and Energy Efficiency. The Network is open to cities and towns
around the world that have either already shown exemplary activities to strengthen rene
sustainable energy at the local level (LR) and/or are developing themselves into model LR
communities. The network started with cities in Europe, India and Brazil. The initial funders
network are GTZ (Deutsche Gesellschaft für Technische
Opportunity Fund) through the British Embassy in Brazil.
The Network aims to link three types of communities:
Model communities: Local governments that are selected and in the process of becoming sustained
and sound LR Model Communities, benefiting from support through a project.
Resource Communities: Local governments that already have comprehensive integrated strategies
and actions in place addressing sustainable energy, in particular focusing on RE and EE, providing
advice to model communities and benefiting from the exchange.
Network Communities: Local governments that are linked to a current LR project
to promoting the initiative and learn
do not have the full financial benefits of a current project.
FINAL DRAFT
ICLEI Local Renewables Network
With the Local Renewables Initiative (LRI), ICLEI – Local
Governments for Sustainability supports and strengthens the role
of local governments that promote the generation and supply of
renewable energy and energy efficiency in the urban
environment. The focus is on the roles and responsibilities of local
governments as a driving force for innovation and investment in
The focus on local government adoption and promotion of
renewable energy and energy efficiency is because local
governments play a key role in promoting sustainable energy at a
community level. They have a political mandate to govern and guide
their communities, provide services and manage municipal assets.
They have legislative and purchasing power that they can use to
implement change in their own operations and in the wider
ents can further play a role as a model in
their region or country, showing how policies and local actions can
be shaped to guide communities in the transition to a sustainable energy future.
ooperate in the global Local Renewables Network, share their expertise and
experience on Renewable Energy and Energy Efficiency. The Network is open to cities and towns
around the world that have either already shown exemplary activities to strengthen rene
sustainable energy at the local level (LR) and/or are developing themselves into model LR
communities. The network started with cities in Europe, India and Brazil. The initial funders
are GTZ (Deutsche Gesellschaft für Technische Zusammenarbeit) and GOF (UK Global
Opportunity Fund) through the British Embassy in Brazil.
The Network aims to link three types of communities:
Local governments that are selected and in the process of becoming sustained
odel Communities, benefiting from support through a project.
Local governments that already have comprehensive integrated strategies
and actions in place addressing sustainable energy, in particular focusing on RE and EE, providing
dvice to model communities and benefiting from the exchange.
Local governments that are linked to a current LR project
to promoting the initiative and learning from the Model Communities in each country or region but
do not have the full financial benefits of a current project.
be shaped to guide communities in the transition to a sustainable energy future.
ooperate in the global Local Renewables Network, share their expertise and
experience on Renewable Energy and Energy Efficiency. The Network is open to cities and towns
around the world that have either already shown exemplary activities to strengthen renewable and
sustainable energy at the local level (LR) and/or are developing themselves into model LR
communities. The network started with cities in Europe, India and Brazil. The initial funders of this
Zusammenarbeit) and GOF (UK Global
Local governments that are selected and in the process of becoming sustained
Local governments that already have comprehensive integrated strategies
and actions in place addressing sustainable energy, in particular focusing on RE and EE, providing
Local governments that are linked to a current LR project and are committed
from the Model Communities in each country or region but

FINAL DRAFT
2013 | INDONESIA SOLAR CITY GUIDEBOOK 42
Figure 11: ICLEI's Local Renewables Network consisting of three types of communities:Model, Resource and
Network Communities
Växjö
Bonn
Freiburg
Belo Horizonte
Cape Town
Ekurhuleni
Nagpur
Balasore
Betim
Porto Alegre
Salvador
São Paulo
Bhubaneswar
Cuttack
Jabalpur
Gwalior
Madurai
Paradip
PuriTiruchirapalli
VadodaraMilan
Malmö
Delhi
Coimbatore
Yogyakarta
Model Communities Observers
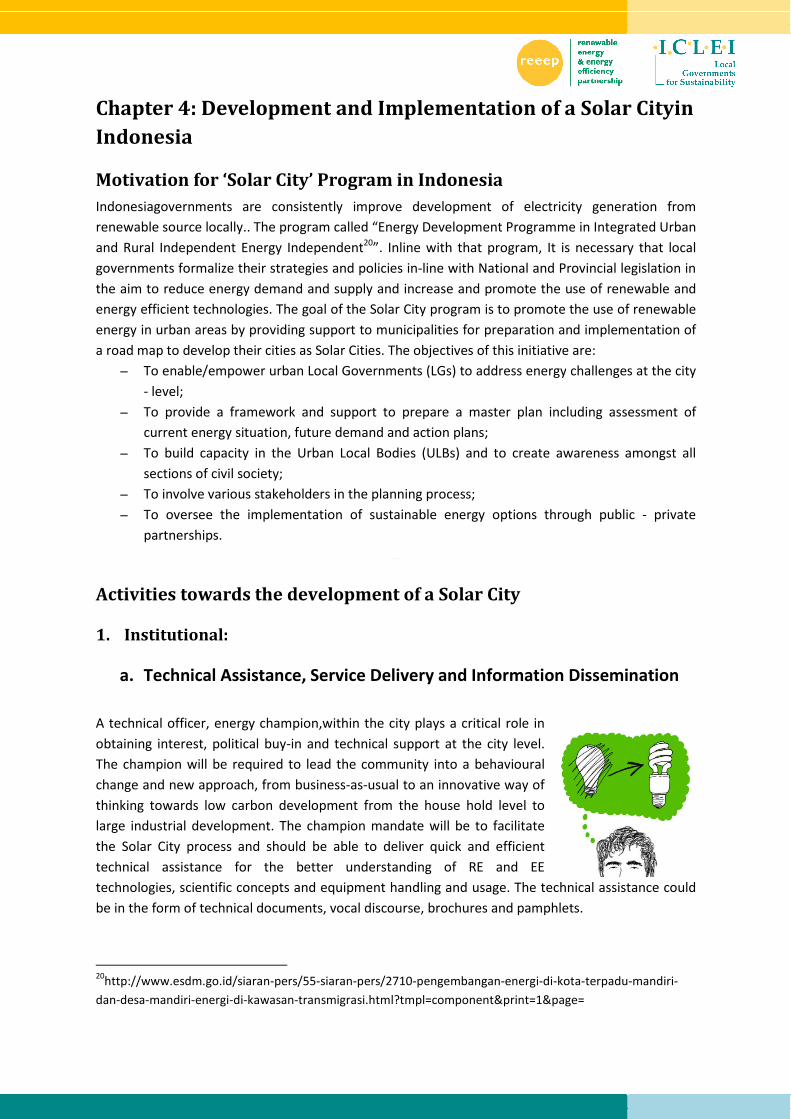
Chapter 4: Development
Indonesia
Motivation for ‘Solar City’ Program in
Indonesiagovernments are consistently improve development of electricity generation from
renewable source locally.. The program called “
and Rural Independent Energy Independent
governments formalize their strategies and policies in
the aim to reduce energy demand and supply and increase and promote the use of renewable and
energy efficient technologies. The goal of the
energy in urban areas by providing support to
a road map to develop their cities as Sola
− To enable/empower urban Local Governments (LGs) to address energy
- level;
− To provide a framework and s
current energy situation, future demand and action plans
− To build capacity in the Urban Local Bodies (ULBs) and to create awareness amongs
sections of civil society;
− To involve various stakehold
− To oversee the implementation of sustainable energy options through public
partnerships.
Activities towards the
1. Institutional:
a. Technical Assistance, Service Delivery and Information
A technical officer, energy champion,within the city plays a critical role in
obtaining interest, political buy
The champion will be required to lead the community into a
change and new approach, from business
thinking towards low carbon development from the house hold level to
large industrial development. The champion man
the Solar City process and should b
technical assistance for the better understanding of RE and EE
technologies, scientific concepts and equipment handling and usage. The technical assistance could
be in the form of technical documents, vocal discourse,
20
http://www.esdm.go.id/siaran-pers/55
dan-desa-mandiri-energi-di-kawasan
FINAL DRAFT
4: Development and Implementation of a
Motivation for ‘Solar City’ Program in Indonesia
consistently improve development of electricity generation from
The program called “Energy Development Programme in Integrated Urban
and Rural Independent Energy Independent20”. Inline with that program, It is necessary that local
governments formalize their strategies and policies in-line with National and Provincial legislation in
demand and supply and increase and promote the use of renewable and
The goal of the Solar City program is to promote the use of renewable
energy in urban areas by providing support to municipalities for preparation and implementation of
a road map to develop their cities as Solar Cities. The objectives of this initiative
nable/empower urban Local Governments (LGs) to address energy challenges at the city
To provide a framework and support to prepare a master plan including assessment of
current energy situation, future demand and action plans;
To build capacity in the Urban Local Bodies (ULBs) and to create awareness amongs
To involve various stakeholders in the planning process;
To oversee the implementation of sustainable energy options through public
towards the development of a Solar City
Technical Assistance, Service Delivery and Information Dissemination
, energy champion,within the city plays a critical role in
obtaining interest, political buy-in and technical support at the city level.
The champion will be required to lead the community into a behavioural
w approach, from business-as-usual to an innovative way of
thinking towards low carbon development from the house hold level to
l development. The champion mandate will be to facilitate
and should be able to deliver quick and efficient
technical assistance for the better understanding of RE and EE
technologies, scientific concepts and equipment handling and usage. The technical assistance could
be in the form of technical documents, vocal discourse, brochures and pamphlets.
pers/55-siaran-pers/2710-pengembangan-energi-di-kot
kawasan-transmigrasi.html?tmpl=component&print=1&page=
and Implementation of a Solar Cityin
consistently improve development of electricity generation from
evelopment Programme in Integrated Urban
It is necessary that local
line with National and Provincial legislation in
demand and supply and increase and promote the use of renewable and
program is to promote the use of renewable
for preparation and implementation of
are:
challenges at the city
upport to prepare a master plan including assessment of
To build capacity in the Urban Local Bodies (ULBs) and to create awareness amongst all
To oversee the implementation of sustainable energy options through public - private
Dissemination
technologies, scientific concepts and equipment handling and usage. The technical assistance could
brochures and pamphlets.
kota-terpadu-mandiri-
transmigrasi.html?tmpl=component&print=1&page=

FINAL DRAFT
2013 | INDONESIA SOLAR CITY GUIDEBOOK 44
Roles and Responsibilities:
• Contact point within local authority for all stakeholderson matters concerning energy and
climate change;
• Keep informed of related international, national and local current affairs;
• Co-ordinate related projects and campaigns;
• Facilitate and mainstream energy and climate change policies and strategies across all local
government department.
b. Establish a Stakeholder Committee
The Solar City Stakeholder Committee is a very integral
component for the development of the Solar City process.
The purpose of establishing an internalstakeholder
committee is to ensure the parallel set up of a local site
for exchange and collection of relevant data for
sustenance, promotion and awareness generation of
renewable energy and energy efficiency at the local level.
The stakeholder committee will be the focal point and a
critical player for implementation of the solar city
development.
The stakeholder committee will be established within the
municipality and will function under the full
administration of the local government. The City Manager
which will be the highest level authorizing personnel with
a senior technical officer at the level of executive
engineer or project manager whom will facilitate the
process, activities and implementation. The officer
in-charge will prepare all strategy and functioning
modalities of the stakeholder committee, facilitate and
support day-to-day activities, documentation, communication and every other activity under
stakeholder committee. The stakeholder committee will provide technical guidance, expertise and
financial analyses of projects for potential investors, individualsand companies.
Roles and responsibilities:
• Provide input and agree upon stakeholder committee terms of reference;
• Commit to terms of reference obligation;
• Be in attendance to all stakeholder committee meetings;
• Actively participate and provide best knowledgeable experience and expertise to agenda
items and assignments;
• Be diligent and punctual on assigned portfolios or duties;
• Support and advocate the stakeholder committee within other networks.
A “Solar City Stakeholders
Committee” will be set up for
advisory support involving
representation from elected
representatives in the municipal
bodies, local research and academic
institutions, resident welfare
associations, industries and
corporate organizations, NGOs,
State Nodal Agencies and other
relevant stakeholder

2. Baseline Study and City Energy P
a. Baseline Study
A baseline study is required to link and incorporate all international, regional and national
conventions, strategies, laws and climate related targets and action plans to the
core service delivery and plans. The city’s planning and decision makers needs to ensure that these
components are well aligned with the city’s short
incorporate all the sectors and strive
management.
b. City Energy Profile
An important component towards the development of a
energy patterns and profile. Before the drafting of a city’s
undertake an energy audit, also known as a GHG inventory.
the Stakeholder Committee established to provide an overview of the energy consumption
consumed by the urban area. The respective Stakeholder Committee members will be able to
identify all relevant energy consumption
that data is collected and assigned to one of two modules
and the community energy consumption.
Based on the collected secondary and primary data, an energy baseline would be prepared for each
municipal sector. The secondary data should be collected for
baseline and illustrates trends to inform more accurate
energy/emissions on current and future
Accurate data is essential for energy planning and
often sources are scattered, it is not easy for the
time period. In order to facilitate data collection, it is advisable that
local governments to schedule and facilitate
departments/institutions at the beginning of the project. In such a meeting the
present on the data requirements and the
would be the appropriate source for respective
City Stakeholder Committee should assist with disseminating appropriate
concerned agencies introducing the project, with a request for providing
Data on energy consumption (electri
from residential, commercial, industrial and local
Water, Water, Electricity and street lighting
residential housing complex, while commercial sector includes all offices, shops, shopping
FINAL DRAFT
City Energy Profile
A baseline study is required to link and incorporate all international, regional and national
conventions, strategies, laws and climate related targets and action plans to the
core service delivery and plans. The city’s planning and decision makers needs to ensure that these
components are well aligned with the city’s short-, medium- and long term plans and strategies to
incorporate all the sectors and strive towards achieving an holistic approach towards city
Profile (GHG Inventory)
towards the development of a Solar City is the understanding of the cities
energy patterns and profile. Before the drafting of a city’s master plan or/and action plan it is vital to
undertake an energy audit, also known as a GHG inventory. For this activity it is important to consult
the Stakeholder Committee established to provide an overview of the energy consumption
consumed by the urban area. The respective Stakeholder Committee members will be able to
all relevant energy consumption sources within the urban jurisdiction.
assigned to one of two modules: the governmental energy consumption
and the community energy consumption.
Based on the collected secondary and primary data, an energy baseline would be prepared for each
secondary data should be collected for thepast 5 years, which
baseline and illustrates trends to inform more accurate projections of total and sectoral
energy/emissions on current and future growth rates.
tial for energy planning and because the pool of data
, it is not easy for the technical officer to collect all the data in a limited
time period. In order to facilitate data collection, it is advisable that the technical officer within the
local governments to schedule and facilitate meetings (or inception workshop) of all concerned
departments/institutions at the beginning of the project. In such a meeting the
ements and the local government can identify the correct agencies that
be the appropriate source for respective data. Local government departments and the Solar
City Stakeholder Committee should assist with disseminating appropriate data request
concerned agencies introducing the project, with a request for providing the respective
Data on energy consumption (electricity, petroleum products, coal and biomass) should be collected
, commercial, industrial and local governmental sectors (Waste, Transport, Waste
and street lighting). Residential sector includes residential households and
while commercial sector includes all offices, shops, shopping
A baseline study is required to link and incorporate all international, regional and national
conventions, strategies, laws and climate related targets and action plans to the local government’s
core service delivery and plans. The city’s planning and decision makers needs to ensure that these
and long term plans and strategies to
towards achieving an holistic approach towards city
Solar City is the understanding of the cities
action plan it is vital to
For this activity it is important to consult
the Stakeholder Committee established to provide an overview of the energy consumption
consumed by the urban area. The respective Stakeholder Committee members will be able to
within the urban jurisdiction. It is recommended
the governmental energy consumption
Based on the collected secondary and primary data, an energy baseline would be prepared for each
5 years, which provides a
projections of total and sectoral
because the pool of data sources is large and
to collect all the data in a limited
technical officer within the
(or inception workshop) of all concerned
departments/institutions at the beginning of the project. In such a meeting the technical officer can
can identify the correct agencies that
departments and the Solar
data request letters to all
the respective data.
) should be collected
(Waste, Transport, Waste
includes residential households and
while commercial sector includes all offices, shops, shopping centres,

FINAL DRAFT
2013 | INDONESIA SOLAR CITY GUIDEBOOK 46
multiplexes, hotels, restaurants, advertisement bill boards and institutional/government buildings
include hospitals, schools, colleges, churches, hostels, jails, government offices, etc.
The major sources of energy for both residential and commercial sector are electricity and Liquid
Petroleum Gas (LPG). In addition, a variety of fossil fuels may be used for power back-up e.g. diesel
generators. In some cases, biomass fuels are also used for cooking and water heating.
The industrial sector includes all industries that fall within the municipal jurisdiction. Other than the
electricity as an energy source, other fuels that are used within the Indonesian context include
petroleum products (diesel, natural gas, naphtha and furnace oil), wood, coal and biomass
Municipal sector includes municipal services (water pumping, street lighting, sewage treatment).
The main source of energy here would also be electricity.
A few steps to undertake to assist with the data collection:
• Assess the city boundary or jurisdiction;
• Identify types of energy used within the city;
• Identify key energy users within the city (i.e. Industry, Commercial, Transport,
Residential);
• Separate the list of energy users into the two modules: Government and
Community;
• Develop a data sheet form of the data required for each module;
• Schedule individual meetings with key stakeholders whom may assist with the data
collection. Provide the data sheet for energy users to complete.
• Gather electronic data systematically and store data within a suitable GHG energy
tool;
• Once all the required data is collected undertake the necessary calculations,
accounting and reporting.

3. Policy and Strategy Development
Once the energy audit and the necessary
the results and outputs to assist with the understanding and prioritizing
for each of the modules and sectors.
A draft Action Plan should be the first step towards the development of the
Energy Master Plan. The Master Plan should provide a
utilization and GHG emissions in the city.
for energy demand and supply for
renewable energy addition and GHG abatement along with the action plan for implementation will
be clearly highlightedwithin the Master Plan.
Potential sources of funding from respective organizations (both public and private) for providing
financial support should be identifi
goals for energy reduction; local reduction targets should be in
targets should be realistic however ambitious in order to achieve beyond long term reduction
recording of energy saving interventions
renewable energy installations should be reported and accounted for annually
HEAT (Harmonised Energy Analysis Tool) Plus
Website:
FINAL DRAFT
Policy and Strategy Development
Once the energy audit and the necessary inventory and city energy profile reports are complete, use
the results and outputs to assist with the understanding and prioritizing of the critic
for each of the modules and sectors.
A draft Action Plan should be the first step towards the development of the C
. The Master Plan should provide a complete sector-wise base-line energy
utilization and GHG emissions in the city. It should further provide total and sector
for energy demand and supply for a required period. Year-wise targets for energy conservation,
ition and GHG abatement along with the action plan for implementation will
in the Master Plan.
Potential sources of funding from respective organizations (both public and private) for providing
be identified. The Master Plan should set clear and realistic targets and
; local reduction targets should be in-line with national targets; annual
targets should be realistic however ambitious in order to achieve beyond long term reduction
interventions from energy efficiency measures and generation from
should be reported and accounted for annually.
HEAT (Harmonised Energy Analysis Tool) Plus
Website:http://heat.iclei.org/heatplusv4/index.aspx
reports are complete, use
the critical energy issues
City Level Renewable
-wise base-line energy
total and sector-wise projections
-wise targets for energy conservation,
ition and GHG abatement along with the action plan for implementation will
Potential sources of funding from respective organizations (both public and private) for providing
should set clear and realistic targets and
line with national targets; annual
targets should be realistic however ambitious in order to achieve beyond long term reduction goals;
from energy efficiency measures and generation from

FINAL DRAFT
2013 | INDONESIA SOLAR CITY GUIDEBOOK 48
Activities to undertake towards the development of a 5-10 year Master Plan
a. Energy Demand Forecasting for next 10 years
This step involves predicting the energy demand for the period of 5-10
years. To estimate the energy demand, the growth in energy use of
different sectors needs to be established. These growth rates are
established based on immediate past trends and future growth plans.
Based on the past time-series data and information on growth plans,
growth rate in energy demand for different sectors can be estimated.
These growth rates are used for making future projection of energy
demand in each sector for the next 5-10 years.
b. Sector wise Renewable Energy Strategies
A renewable energy resource assessment should be undertaken in order
to identify the potential renewable energy sources and opportunities
within the city. This would include assessment of solar radiation, wind
power density and availability, biomass resources and
municipal/industrial wastes. The next step would be listing of all potential
renewable energy technology options. An indicative list of renewable
energy technologies/systems is discussed in the chapter 5.
c. Sector wise Energy Efficiency Strategy
While renewable energy technologies would provide clean energy, EE and
DSM measures would help in reducing the energy demand. An indicative
list of EE and DSM measures that can be introduced in different sectors –
residential, commercial, and industrial and municipal is discussed in
chapter 5. A sector-wise techno-economic analysis of potential energy
efficiency and DSM measures should be carried out.
d. Stakeholders Consultations
Stakeholders’ consultation is a very important step in the preparations and development of the
master plan. Several external stakeholders’ consultations are suggested such 1) as an initial
inception meeting to introduce the project and present the data requirements, 2) one immediately
after the analysis of sector-wise energy audit outputs; and 3) one towards the end to discuss the
draft master plan. The participants can include elected representatives including external experts
from, local research and academic institutions, resident welfare associations, industries and
corporate organizations, ESCos, RE manufacturing industries, NGOs, SNA, etc. Stakeholders
committee formed as part of the Solar City process should be consulted on all developments and
processes.

Recommended outlines of
1. Projection for energy demand and supply for 10 years
− Sector wise
− Total
2. Base line of energy utilization & GHG emissions
− Residential
− Commercial/ Industrial
− Industrial
− Municipal Services
− GHG emission
3. Renewable Energy Strategy
− Renewable Energy Resource
− RE Strategy for Residential Sector
− RE Strategy for Commercial and Institutional Sector
− RE Strategy for Industrial Sector
− RE Strategy for Municipal Sector
4. Energy Efficiency Strategy
− EE Strategy for Residential Sector
− EE Strategy for Commercial and Institutional Sector
− EE Strategy for Industrial Sector
− EE Strategy for Municipal Sector
5. Year-wise goals of savings in conservation energy through demand side management &
side measures based on Renewables.
6. Action Plan for achieving the set goals & expected GHG abatements. This will include capacity
building and awareness generation.
7. Budget estimates and potential sources of funding from respective sources (b
private)
FINAL DRAFT
utlines of a Master Plan
1. Projection for energy demand and supply for 10 years
2. Base line of energy utilization & GHG emissions
Resource Assessment
RE Strategy for Residential Sector
RE Strategy for Commercial and Institutional Sector
RE Strategy for Industrial Sector
RE Strategy for Municipal Sector
E Strategy for Residential Sector
E Strategy for Commercial and Institutional Sector
E Strategy for Industrial Sector
E Strategy for Municipal Sector
-wise goals of savings in conservation energy through demand side management &
side measures based on Renewables.
6. Action Plan for achieving the set goals & expected GHG abatements. This will include capacity
building and awareness generation.
7. Budget estimates and potential sources of funding from respective sources (both public and
-wise goals of savings in conservation energy through demand side management & supply
6. Action Plan for achieving the set goals & expected GHG abatements. This will include capacity
oth public and

FINAL DRAFT
2013 | INDONESIA SOLAR CITY GUIDEBOOK 50
4. Activities to implement at the local level
a. Solar City Resource Centre
One of the on-ground projects that can be easily implemented
is a Solar City Resource Centre. Development of a local
Resource Center is a space within the city’s governmental
buildings, which is easily accessible to the general public and
end users to showcase local initiatives and products informing
the community about RE and EE innovations. The location is of
vital importance as it will be a means to easier and quicker
dissemination of knowledge and information to a wider scale
of audience. Examples of locations are within education and
awareness centres, city libraries or accessible municipal
buildings.
All technological options available under RE and EE should be
displayed within a space to showcase and promote such
technologies; this space is given the proposed name, Solar City
Resource Centre within the Solar City Program.
It is a resource base of information and physical exhibition of
models related to RE and EE techniques.
The information promoted within this space should include:
− Available RE/EE techniques in the region
− Feasibility analysis of each technique
− Technology suitable for a particular client considering
his/her requirements and budget
− Required capital
− Sources of funding
− List of manufacturers of RE/EE equipment in that
region
− List of consultants in that region
− City implementation projects and description of each
− City Energy Plan and related policies and strategies
Connecting People with Energy through the Resource Centre
The target audience for the Solar City Resource Centre is:
− Municipal Corporations/departments
− Local Utilities, Local Business
− Developers of Large Scale Construction projects
− Architects, city planners
− International and local organisations
− City residents and resident welfare associations
Indian Case Study: Capacity Building
within the Solar City Program
Under the Local Renewables Model
Communities Network project funded
by GTZ, ICLEI-SA has conceptualized
and assisted in establishment of the
Renewable Energy & Energy Efficiency
Resource Centreswithin Bhubaneswar,
Nagpur and Coimbatore.Other well
established Resource Centres are
Freiburg, Bonn and Vaxjo(under the
International Network of
EuropeanProgramme); Betim (Brazilian
Solar City Program) cities, which form
part of ICLEI International Training
Centre, ICLEI European Secretariat and
ICLEI US offices respectively.
The Resource Centres are strategically
located in all four of these cities
whereby the general public is able to
view the material as any given time. In
Bhubaneswar, at the entrance lobby of
the Corporation building; in Nagpur, at
the Citizens Facility Centre in the
Corporation premises; and in
Coimbatore, the Resource Centres is
located adjacent to the Citizen’s Service
Centre in the Corporation premises.
RE and EE equipment manufacturers
have shown positive interest and
support towards these Resource
Centres in the respective cities. At
present, Gayatri Solar and Tata BP Solar
have exhibited their equipment and
information materials at the
Bhubaneswar Resource Centre whereas
in Nagpur Tata BP Solar is now
associated with the Resource Centre.
Resource Centres in the cities are
receiving encouraging response (in
terms of number of people visiting)
from the citizens as well as Corporation
officials. These Resource Centres
continuously undergo efforts to update
and include new technologies within
the centres.

− School children and students
Programmes and Activities for the Resource Centre
− Display and demonstration of RE and EE
− Conceptualize various campaigns, workshops, seminars, panel discussions, meetings, and
exhibitions targeting RE and EE promotion awareness generation and voluntary adop
technology measures by individuals, communities, associations, and institutions. These
programmes should ensure the active participation of local residents, private players, ESCos,
local/state RE and EE manufacturing companies, etc
− Provide and produce all resources for promotional and awareness generation activities like
reports, booklets, equipment brochures, pamphlets, posters, banners and related matter
− Maintain all records of activities charted in monthly activity target list. Usage of proper
detailed documentation methodology should be a priority. Monthly and yearly data should
be recorded both in soft and hard copies
− A target list of potential stakeholders, private partners, ESCos or RE and EE manufacturing
companies should be made updated ever
partners/members/funding sources for the sustainability and promotional activities of the
Solar City Resource Centre
b. Communication, Education and Public Awareness
Coimbatore Resource Centre
Established under the Local Renewables Model Community Project, Coimbatore Res
Centre has served as a one-
energy and energy efficiency projects, products and related financing options available.
As a model community, Coimbatore city Corporation has been instrumenta
number of activities in the city with the logistical and organisational support rendered through
the Resource Centre.
As an indicator of success under the project, Coimbatore Resource Centre has and continues to
assume the following roles:
• Comprehensive resource base for information on renewable energy and energy
efficiency projects/products
• Platform for outreach to target audience which include local entrepreneurs, schools,
Corporations of other cities, Architects and urban planners, l
anyone interested in green initiatives
• Administrates the action plans and annual activity plans which fall under the purview of
RE and EE initiatives taking place in the city
• Ensures provision of logistical and organisational s
subsequent monitoring of the projects
FINAL DRAFT
tudents
and Activities for the Resource Centre
Display and demonstration of RE and EE equipment
Conceptualize various campaigns, workshops, seminars, panel discussions, meetings, and
exhibitions targeting RE and EE promotion awareness generation and voluntary adop
technology measures by individuals, communities, associations, and institutions. These
programmes should ensure the active participation of local residents, private players, ESCos,
EE manufacturing companies, etc
uce all resources for promotional and awareness generation activities like
reports, booklets, equipment brochures, pamphlets, posters, banners and related matter
Maintain all records of activities charted in monthly activity target list. Usage of proper
tailed documentation methodology should be a priority. Monthly and yearly data should
be recorded both in soft and hard copies
A target list of potential stakeholders, private partners, ESCos or RE and EE manufacturing
companies should be made updated every two month to involve them as
partners/members/funding sources for the sustainability and promotional activities of the
Solar City Resource Centre
, Education and Public Awareness (CEPA)
Coimbatore Resource Centre
Established under the Local Renewables Model Community Project, Coimbatore Res
-stop outreach, awareness and information provider for renewable
energy and energy efficiency projects, products and related financing options available.
As a model community, Coimbatore city Corporation has been instrumental in execution of a
number of activities in the city with the logistical and organisational support rendered through
As an indicator of success under the project, Coimbatore Resource Centre has and continues to
Comprehensive resource base for information on renewable energy and energy
efficiency projects/products
Platform for outreach to target audience which include local entrepreneurs, schools,
Corporations of other cities, Architects and urban planners, local utilities and generally
anyone interested in green initiatives
Administrates the action plans and annual activity plans which fall under the purview of
RE and EE initiatives taking place in the city
Ensures provision of logistical and organisational support in implementation and
subsequent monitoring of the projects
Conceptualize various campaigns, workshops, seminars, panel discussions, meetings, and
exhibitions targeting RE and EE promotion awareness generation and voluntary adoption of
technology measures by individuals, communities, associations, and institutions. These
programmes should ensure the active participation of local residents, private players, ESCos,
uce all resources for promotional and awareness generation activities like
reports, booklets, equipment brochures, pamphlets, posters, banners and related matter
Maintain all records of activities charted in monthly activity target list. Usage of proper
tailed documentation methodology should be a priority. Monthly and yearly data should
A target list of potential stakeholders, private partners, ESCos or RE and EE manufacturing
y two month to involve them as
partners/members/funding sources for the sustainability and promotional activities of the
(CEPA)
Established under the Local Renewables Model Community Project, Coimbatore Resource
stop outreach, awareness and information provider for renewable
energy and energy efficiency projects, products and related financing options available.
l in execution of a
number of activities in the city with the logistical and organisational support rendered through
As an indicator of success under the project, Coimbatore Resource Centre has and continues to
Comprehensive resource base for information on renewable energy and energy
Platform for outreach to target audience which include local entrepreneurs, schools,
ocal utilities and generally
Administrates the action plans and annual activity plans which fall under the purview of
upport in implementation and

FINAL DRAFT
2013 | INDONESIA SOLAR CITY GUIDEBOOK 52
Awareness, Publicity and Capacity Building
Awareness and Publicity Programmes are encouraged to provide awareness among target audiences
within the city pertaining to the financial benefits and incentive of renewable energy technologies
and devices. Under these programmes, information on technological developments, financial
benefits and cost savings from RE system and EE measures, government initiatives and incentives for
such devices/measures, availability, price should be disseminated through various media platforms.
The following activities are proposed for creation of awareness and publicity.
Publicity through electronic media
− Production and telecast of documentary films, short duration films, TV spots/advertisements
through local TV networks;
− Production and broadcast of radio sponsored programmes, radio spots/jingles and Radio
Talks etc. through local FM channels
i. Print Media/Publication
− Advertisements in colour and black & white in newspapers/magazines/journals etc.
− Printing of booklets, folders, brochures, posters, calendars and newsletters.
− Develop educational programs and workshops on energy efficiency, distributed generation,
and renewable energy systems in buildings for homeowners, businesses, government staff,
and those in the building industries.
ii. Exhibitions, Outdoor Publicity, Campaign
− Use of Exhibitions and Outdoor Publicity activities like hoardings, kiosks, bus panels,
bus-stop shelters, wall paintings, computerized animation display systems, etc. in the city.
− Display and demonstration of RE and EE equipment in the Solar City Resource Centre.
− Organizing runs, debates, seminars, quiz, drawing, model making, poster, essay and slogan
writing competitions among others for school children and others;
− Promotion and publicity of RE and EE by displaying models and posters
and related printed media in different public places,
institutions/organizations, hospitals and bus stands.
− Encourage maximum participation by residents and business owners in
the local authority’s energy efficiency programs through marketing and
education exercises.
− Educate government purchasing agents in each city departments
regarding the benefits of Energy Star rated equipment, including the cost savings to the city.
− Encourage community input on strategies for improving energy efficiency in building.
iii. Workshops and Seminars
It is proposed to organize workshops and seminars on specific technologies for targeted audiences
from residential, commercial, institutional, industrial and municipal sectors.
iv. Training and Education Programs
The key areas of training should be prioritized such as technical, management or general. Crucial
aspects which should be addressed primarily at this stage for the development of the Solar City

Resource Centre to be well suited for a range of activities (training, exhibition, workshops) should be
addressed or undertaken:
− User-needs and resource assessments
− Renewable energy project design including the economical and financial aspects;
− Renewable energy project management;
− Operation, maintenance and monitoring of RE and EE systems
v. Creating a Web Portal
Portals could be created by the
access to RE and EE technologies, and activities occurring in and around the area. Instant access to
technological options available to end
useful information through this mode of knowledge exchange which is a quick and easy
communication mode for generating awareness and sensitizing the general public. Creating an
interactive website exclusively for “Solar City” for awareness campai
support to the users will be a useful tool.
vi. Demonstration projects
The technical feasibility and economic viability of solar technology can be addressed by
implementing a number of demonstration projects, such as solar hot wat
hospitals, hotels and catering services
heat in the drying, food and textile industries. Dissemination activities can be carried out using
information materials such as lea
further provide a wider level of acceptance and better understanding of the technology and
benefits of such devices. The demonstration projects will also
providing first hand experiences for improvements in the training and skills of the stakeholders as
well as increased efforts in research and development activities.
FINAL DRAFT
Resource Centre to be well suited for a range of activities (training, exhibition, workshops) should be
-needs and resource assessments and feasibility studies.
Renewable energy project design including the economical and financial aspects;
Renewable energy project management;
Operation, maintenance and monitoring of RE and EE systems
Portals could be created by the City within the Energy Department website page to provide citizens
technologies, and activities occurring in and around the area. Instant access to
technological options available to end-users, their capital cost, returns on investment
useful information through this mode of knowledge exchange which is a quick and easy
communication mode for generating awareness and sensitizing the general public. Creating an
interactive website exclusively for “Solar City” for awareness campaigns, information sharing and
support to the users will be a useful tool.
Demonstration projects
The technical feasibility and economic viability of solar technology can be addressed by
implementing a number of demonstration projects, such as solar hot water heating system for
hospitals, hotels and catering services could be implemented. Others include solar industrial process
heat in the drying, food and textile industries. Dissemination activities can be carried out using
information materials such as leaflets, posters, videos and media advertisements. These projects will
further provide a wider level of acceptance and better understanding of the technology and
. The demonstration projects will also in paving the way for
providing first hand experiences for improvements in the training and skills of the stakeholders as
well as increased efforts in research and development activities.
Resource Centre to be well suited for a range of activities (training, exhibition, workshops) should be
Renewable energy project design including the economical and financial aspects;
City within the Energy Department website page to provide citizens
technologies, and activities occurring in and around the area. Instant access to
-users, their capital cost, returns on investment and other
useful information through this mode of knowledge exchange which is a quick and easy
communication mode for generating awareness and sensitizing the general public. Creating an
gns, information sharing and
The technical feasibility and economic viability of solar technology can be addressed by
er heating system for
be implemented. Others include solar industrial process
heat in the drying, food and textile industries. Dissemination activities can be carried out using
flets, posters, videos and media advertisements. These projects will
further provide a wider level of acceptance and better understanding of the technology and the
the way forward and
providing first hand experiences for improvements in the training and skills of the stakeholders as

FINAL DRAFT
2013 | INDONESIA SOLAR CITY GUIDEBOOK 54
Indicative measures to be taken by Cities towards the develop of a ‘Solar
City’
Some of the measures that can be adopted by city governments while developing their city/ town as
a solar city are:
� Indonesia Government’s involvement and support for the oversight of implementation of
the strategies in the local authorities’ Master plan during 5-10 years (financial value if any).
The concerned local government is encouraged to send proposals with the budget to
respective provincial, national department as well as to private sectorsto support the project
planning and implementation process.
� Annual Budget from National Government for RE and EE programmes and projects at the
local level.
� Development of “Solar City Stakeholder Committee” for the sustainability of the Solar City
Programme initiatives is encouraged. Solar City Cell consisting of the stakeholder committee
and resource centre (further details can be found in Chapter 4) The solar city cell is an
essential tool for planning, implementation of strategies, raising awareness, capacity
building, involving private partners, and major stakeholders (architects, engineers, builders
& developers, financial institutions, NGOs, technical institutions, manufactures/suppliers).
� Awareness generation: each Province in Indonesia is encouraged to promote RE and EE
through the Solar City Resource Centre, awareness campaigns, publications and through
relevant media channels to capacitate the public on RE and EE innovations that can be
implemented at the local level (such as workshops/ seminars/ training / publications/
awareness campaigns etc.).
� A timely audit of government and public sector shouldbe scheduled and measures taken for
ensuring conservation of energy.
� Local authorities are encouraged to promote energy efficiency within each sector drafting
and developing bye-laws for municipal sectors.
� Government orders can be issued for construction of energy efficient buildings at the most
within government/public sectors, in accordance with any feasible green building codes like
GBCSA)
� Solar water heating could be made a mandatory bye-law for buildings (old/new) within the
municipality jurisdiction, especially in buildings of special category like hotels, hospitals,
hostels etc.
� Compliance with Municipal Solid Waste regulations and efforts to recycle, re-use and reduce
solid waste. Maximum efforts should be taken up to implement waste to energy projects.
� The municipalitiesshould ensure energy conservation in street lights/garden lights, traffic
lights, hoardings and roadside blinkers by replacing old inefficient lights and light fittings
with more energy efficient, EElabelled appliances.
� There is a very urgent need for municipal resource mobilization in terms of manpower,
infrastructure for monitoring, documentation and information sharing towards achieving the
success of implementing the master plan.
� Initiatives and motivation is required to amass funds from private partners, national
governments, international organisations and other funding organizations for
implementation of solar city strategies and action plans.
� The City manager should successfully ensure the implementation progress and achievement
of Solar City targets.

Chapter 5: Indicative RE and EE solutions
This chapter describes different
reduction in consumption of conventional energy. The
are commercially available and are
Energy Efficient devices
Home Appliances
Labelling Appliances
Government of Indonesia through National Standard Agency has introduced
SNI 04-6958-2003 about Utilization of Electricity for Household Appliances
Labelling of Energy Rating based on Australian Standard AS 2575.1
New Zealand Standard NZA 6205.1
So far, Ministry of Energy and Mineral Resources has issued one regulation
which is Permen ESM No. 06 of 2011 that govern labelling procedure for self
labelling for refrigerator and air conditioning is under development.
Energy Star Appliances
Energy Star is an international standard for energy efficient consumer products
originated in the United States of America. Devices carrying the Energy Star
service mark, such as computer products, kitchen appliances, buildings and oth
products, generally use 20%–30% less energy than required by federal standards.
Devices range from home, business and industrial products which can be
purchased in big retailer such us Electronic City, Electronic Solution, Carrefour
FINAL DRAFT
Chapter 5: Indicative RE and EE solutions
This chapter describes different renewable energy devices/systems that can help to bring about
reduction in consumption of conventional energy. Thesefollowing devices described in this section
are commercially available and are useful for urban area application.
Energy Efficient devices
Government of Indonesia through National Standard Agency has introduced
about Utilization of Electricity for Household Appliances –
Labelling of Energy Rating based on Australian Standard AS 2575.1-1989 and
New Zealand Standard NZA 6205.1-1989.
So far, Ministry of Energy and Mineral Resources has issued one regulation
which is Permen ESM No. 06 of 2011 that govern labelling procedure for self-ballasted lamp while
labelling for refrigerator and air conditioning is under development.
Energy Star is an international standard for energy efficient consumer products
originated in the United States of America. Devices carrying the Energy Star
service mark, such as computer products, kitchen appliances, buildings and other
30% less energy than required by federal standards.
Devices range from home, business and industrial products which can be
big retailer such us Electronic City, Electronic Solution, Carrefour
can help to bring about
sefollowing devices described in this section
Government of Indonesia through National Standard Agency has introduced
1989 and
So far, Ministry of Energy and Mineral Resources has issued one regulation
ballasted lamp while
Energy Star is an international standard for energy efficient consumer products
originated in the United States of America. Devices carrying the Energy Star
er
30% less energy than required by federal standards.
Devices range from home, business and industrial products which can be

FINAL DRAFT
2013 | INDONESIA SOLAR CITY GUIDEBOOK 56
Lighting
LED lights
Light-emitting diodes (LEDs) in comparison to incandescent bulbs
are 8 times more efficient and twice as efficient to the florescent
bulbs. LEDs are widely used in many appliances and are
recommended as the household lighting due to the energy efficiency
capacity. The initial cost of the bulbs is higher compared to the
incandescent and florescent light bulbs; however LEDs have a longer
life span, generate very little heat, have low sensitivity levels to
shocks and varying temperatures and generally produce a brighter light.
Cost: Variation in cost subject to make, type, producer and wattage.
Energy Switch
Energy Saving With Changing Behaviour (Energy Switch) is a program supported by Ministry of
Energy and Mineral Resources to help organization saving their energy by change the
behaviour. The saving potential is around 5-12% through energy efficiency behaviour such us
scheduling energy use, setting the right temperature, unplug appliance when not in use and
energy saving campaign
There are 6 steps to implement Energy Switch which are (1) Getting top management
commitment; (2) Energy Situation Audit; (3) Planning; (4) Implementation; (5) Evaluation; (6)
Maintaining Energy Saving Behavoir.
As pilot projects, MEMR in a collaboration with Energy Efficiency and Conservation Clearing
House Indonesia has choosen 10 organizations to participate in Energy Switch program as
follow: (1) Yayasan Indecon; (2) Sampoerna School of Business; (3) Malioboro Mall Yogjakarta;
(4) Ibis Hotel Yogjakarta; (5) PT Nutrifood Indonesia; (6) PT Body Shop Indonesia; (7) PT LEN
Industri (8) Ministry of Teleccomunication and Informatic; (9) PT DHL Indonesia; (10) PT ISBG
Communication

Suppliers: Global producer like Philips, Osram, GE, Panasonic and other companies sell their product
through grocery, electrical shop and supermarket.
information to suit your needs.
Compact Florescent Lights
Compact Florescent Light (CFL) bulbs are electrode tubes containing argon and
mercury vapour which by excitement by the atoms within the tubes creates
light within the ultraviolet range. The CFL bulbs produce less heat to generate
light and therefore are more energy efficient than incandescent bulbs. A 15
watt florescent light bulb produces the same amount of light as a 60
incandescent, therefore saving energy and money. CFL bulbs are safer to
operate and can also reduce energy costs associated with cooling homes and
offices.
Ministry of Energy and Mineral Resources in cooperation with PT Carrefour Indonesia has
established Green Retailer to sell CFL
initiatives is to fasten the replacement of incandescent with more efficient lamp.
Cost: Variation in cost subject to make, type
Suppliers: Global producer like Philips, Osram,
grocery, electrical shop and supermarket.
suit your needs.
Water Dispenser
Water dispenser plays a important roles in the house hold to provide standby hot water
and the demand for this appliances is increasing 30% annually, Generally, water
dispenser designed to accommodate one bottle either in the top or in the bottom
depend on practicality to the user.
Recently, Japanese water dispenser launched new technology with double bottle which
claimed reduce the energy consumption around 30%. The product is accepted by the
market and they are selling around 10, 000 units per month.
Typical product specifications are:
� 30% saving from insulation technology
� Power for heating 320 Watt
� Power for Cooling 70 watt
� 100% stainless steel
21
http://www.ebtke.esdm.go.id/id/energi/konservasi
indonesia.html
FINAL DRAFT
Global producer like Philips, Osram, GE, Panasonic and other companies sell their product
through grocery, electrical shop and supermarket. Please read product packaging for further
Compact Florescent Light (CFL) bulbs are electrode tubes containing argon and
mercury vapour which by excitement by the atoms within the tubes creates
ght within the ultraviolet range. The CFL bulbs produce less heat to generate
light and therefore are more energy efficient than incandescent bulbs. A 15-
watt florescent light bulb produces the same amount of light as a 60-watt
ng energy and money. CFL bulbs are safer to
operate and can also reduce energy costs associated with cooling homes and
Ministry of Energy and Mineral Resources in cooperation with PT Carrefour Indonesia has
established Green Retailer to sell CFL and LED with instalment payment.21 The purpose of
is to fasten the replacement of incandescent with more efficient lamp.
Cost: Variation in cost subject to make, type, producer and wattage.
Global producer like Philips, Osram, GE and other companies sell their product through
grocery, electrical shop and supermarket. Please read product packaging for further information to
plays a important roles in the house hold to provide standby hot water
and the demand for this appliances is increasing 30% annually, Generally, water
dispenser designed to accommodate one bottle either in the top or in the bottom
o the user.
Recently, Japanese water dispenser launched new technology with double bottle which
claimed reduce the energy consumption around 30%. The product is accepted by the
market and they are selling around 10, 000 units per month.
pecifications are:
30% saving from insulation technology
Power for heating 320 Watt
Power for Cooling 70 watt
http://www.ebtke.esdm.go.id/id/energi/konservasi-energi/237-peresmian-green-retail
Global producer like Philips, Osram, GE, Panasonic and other companies sell their product
Please read product packaging for further
Ministry of Energy and Mineral Resources in cooperation with PT Carrefour Indonesia has
The purpose of these
is to fasten the replacement of incandescent with more efficient lamp.
GE and other companies sell their product through
Please read product packaging for further information to
plays a important roles in the house hold to provide standby hot water
and the demand for this appliances is increasing 30% annually, Generally, water
dispenser designed to accommodate one bottle either in the top or in the bottom
Recently, Japanese water dispenser launched new technology with double bottle which
claimed reduce the energy consumption around 30%. The product is accepted by the
retail-pertama-di-

FINAL DRAFT
2013 | INDONESIA SOLAR CITY GUIDEBOOK 58
Cost : IDR 2,000,000 – IDR 2,500,000
Suppliers: Sanken, Denpoo,

Table 3: Average saving that could be used with various energy efficient devices. The table below makes several
versus energy efficient devices and provides potential annual savings.
Electrical
Device
Product
Power (W)
Power
Consumption
(kWh)
Electricity
Tariff =
979per kWh]
(IDR
Normal
Appliance 1000 1
Star Energy
Appliance 750 0.75
Candescent
bulb 60 0.06
CFL bulb 15 0.015
Candescent
bulb 60 0.06
LED bulb 8 0.008
CFL bulb 15 0.015 15
LED bulb 8 0.008
Single Bottle
Dispenser 400 0.04
Double
Bottle
Dispenser 320 0.032
*annual saving per light bulb subject to tariff rates.
** assumed 2 hours of heating and 22 hours of standby
FINAL DRAFT
: Average saving that could be used with various energy efficient devices. The table below makes several comparisons between non
versus energy efficient devices and provides potential annual savings.
Electricity
Tariff =
per kWh]
IDR)
Amount
used per
day
[xhr](hr)
Amount used
per month [xhr
each day for
xdays] Monthly Use
Monthly
Savings
979 24 720 704,880
743 24 720 528,660 176,220
59 4 120 7,049
15 4 120 1,762 5,287
59 4 120 7,049
8 4 120 940 6,109
4 120 1,762
8 4 120 940
392 2 60 23,496
313 2 60 18,797 4,699
** assumed 2 hours of heating and 22 hours of standby
comparisons between non-efficient devices
Monthly
Savings
Amount used
per year
[20*12=240]
Yearly
Savings
8,458,560
176,220 6,343,920 2,114,640
84,586
5,287 21,146 63,439
84,586
6,109 11,278 73,308*
21,146
822 11,278 9,868*
281,952
4,699 8,458,560 56,390**


Water Saving
Heating household water contributes to about 40% of all household electricity consumed. Showering
with a high efficiency showerhead can save more than half of
this energy (and much water) to the advantage of the
householder, the environment and under energy and water
shortage circumstances, of the supplying utility. An energy
and water-saving showerhead typically has a flow rate of less
than 10 litres per minute, compared with a conventional
showerhead which has a flow rate of between 15
per minute. There are two types of showerheads that are
water and energy efficient, Aerators and laminar flow. Aerator showerheads mix air with water,
forming a misty spray while laminar
Cost: IDR 400,000 – IDR 2,500,000
Energy Savings: See the text box for calculations on savings per month and per year.
Water Heating
Geyser thermostat
A Geyser thermostat is a heating el
maintains the water temperature to a pre
Most home geysers are in Indonesia
degrees Celsius, once this temperature is met, the element
switches off. An effective method to reduce elec
and save household energy is by reducing the thermostat
range of 35 – 75 degrees Celsius and by set the temperature
action can reduce electricity consumption by
Cost: no cost, only saving.
Energy Saving: An average household with a 1
278 kWh and IDR 272,906 on cost of energy if a thermostat temperature is reduced from 7
See calculations below in Table 2, for further household sa
Note: Hands on technical tips can be sourced from the internet or your local plumber to assist with
the setting of the geyser thermostat.
22
http://linggojati.com/?ForceFlash=true#/submenu/Electric
Heating household water contributes to about 40% of all household electricity consumed. Showering
with a high efficiency showerhead can save more than half of
energy (and much water) to the advantage of the
householder, the environment and under energy and water
shortage circumstances, of the supplying utility. An energy
saving showerhead typically has a flow rate of less
mpared with a conventional
showerhead which has a flow rate of between 15-25 litres
per minute. There are two types of showerheads that are
water and energy efficient, Aerators and laminar flow. Aerator showerheads mix air with water,
while laminar-flow showerheads form individual streams of water.
IDR 2,500,000
Energy Savings: See the text box for calculations on savings per month and per year.
A Geyser thermostat is a heating element within the geyser that
maintains the water temperature to a pre-set temperature.
in Indonesia set to a temperature of 75
degrees Celsius, once this temperature is met, the element
switches off. An effective method to reduce electricity usage
and save household energy is by reducing the thermostat in a
75 degrees Celsius and by set the temperature to a minimum of 65
action can reduce electricity consumption by 14%. 22.
Energy Saving: An average household with a 100L geyser can achieve a monthly energy saving of
on cost of energy if a thermostat temperature is reduced from 7
See calculations below in Table 2, for further household savings.
Note: Hands on technical tips can be sourced from the internet or your local plumber to assist with
the setting of the geyser thermostat.
http://linggojati.com/?ForceFlash=true#/submenu/Electric-Water-Heater.html
Heating household water contributes to about 40% of all household electricity consumed. Showering
water and energy efficient, Aerators and laminar flow. Aerator showerheads mix air with water,
flow showerheads form individual streams of water.
Energy Savings: See the text box for calculations on savings per month and per year.
5 degrees Celsius this
0L geyser can achieve a monthly energy saving of
on cost of energy if a thermostat temperature is reduced from 75 to 65C..
Note: Hands on technical tips can be sourced from the internet or your local plumber to assist with

2013 | INDONESIA SOLAR CITY GUIDEBOOK 62
Table 4: Energy and Water Saving Calculations
Normal Shower head uses on average 20L per minute.
Efficient Shower Head uses on average 10L per minute, which is half that of a normal shower head.
Geyser Specifications for an average household:
2kW, 100L, thermostat 70C
Savings with an Efficient Showerhead:
Geyser Specifications:
2kW, 100L, thermostat 60C
Savings with a thermostat:
Water has a heat capacity of 4.1813 joules to heat
one gram by one degree C. 1 litre is 1000 grams.
For the purposes of this example, the geyser tank
has a capacity of 100L.
As a hundred litres is 100 000 grams of water, it
takes 4.1813J * 100 000 = 418130 joules to heat
this amount by one degree Celsius. A joule is
equivalent to 1 watt-second, therefore 418130
joules is 418130/3600 = 116.15Wh.
If the thermostat of the household geyser is 75C,
the energy needed to heat 100L of water is
116.15*75 = 8711.25.5Wh
If the voltage of the device is 2000W (2kW), then it
would take 8711.25Wh/2000 = 4.35 hours to heat
the 100L geyser tank to 75C.
The electricity tariff/rate of Indonesia in 2013for
household at 1300 VA installed power is IDR 979
per kWh, therefore the cost to heat 100L tank to
75C is (8711.25/1000)kWh*IDR 979 per kWh = IDR
8528 By using an energy and water saving shower
head a household can save IDR 1,556,360 IDR
8528/2*365) per year on electricity.
Water saving: If a household has four people, each
take a shower twice a day for 10 minutes, by using
a normal shower head, the consumption of water
per month would be as follows:
4people*10minutes*20L/minute*2 a day*30 days
a month = 48000L = 48kL
Water Tariff in Jakarta is on average IDR 7,300 per
kL.
An efficient shower head uses half the amount of
water than a normal showerhead, therefore saving
IDR 175,200 (24kL*IDR 7,300) per month, which is
an annual saving of IDR 2,102,400
Water has a heat capacity of 4.1813 joules to heat
one gram by one degree C. 1 litre is 1000 grams.
For the purposes of this example, the geyser tank
has a capacity of 100L.
4.1813 joules*100 000=418130 joules
A joule is equivalent to 1 watt-second, therefore
418130/3600 = 116.15Wh.
If the thermostat of the household geyser is 65C,
the energy needed to heat 100L of water is
116.15*65 =7550 Wh
The electricity tariff/rate of Indonesia in 2013for
household at 1300 VA installed power isIDR 979
per kWh, therefore (7550/1000)kWh*IDR 979/kWh
= IDR 7391R
By changing the thermostat of the water geyser by
10C, a household can save IDR 1,137 (IDR 8528 –
IDR 7391) per 100L heating to 65C rather 75C. The
annual saving is, assuming a household consumes
only 100L for showering per day, is IDR 415,045
(IDR 1,137*365).
If an efficient shower head is used, water
consumed is:
4people*10minutes*10L/minute*2 a day*30 days
a month = 24000L = 24kL
Savings on heating a tank of 100L is IDR 1,137;
therefore monthly savings on the electricity
consumption on heating 24000L is IDR 272,906
(24000/100*IDR 1,137).
The total amount of water and electricity saving
per month using energy efficient devices amounts
to an estimate of IDR 448,106 (IDR 175,200 + IDR
272,906), which is an annual saving of IDR
5,377,272 per year.

Renewable Energy devices
Photovoltaic
Photovoltaic (PV) is a method of generating electrical power by
converting solar radiation into direct current electricity using
semiconductors that exhibit the photovoltaic effect.
photovoltaic effect is the creation of voltage or electric current in
a material upon exposure to light. Photovoltaic power generation
employs solar panels composed of a number of solar cells
containing a photovoltaic material. Materials presently use
photovoltaic’s include monocrystalline silicon, polycrystalline silicon, amorphous silicon, cadmium
telluride, and copper indium gallium selenite/sulphide. D
- cite_note-jac-0ue to the growi
solar cells and photovoltaic arrays has advanced considerably in recent years (Jacobson, 2009).
Reduce your individual CO2 emissions
Making use of public transports helps the environment considerably. Approximately 20% of the
total carbon dioxide emitted globally is as a direct result of
land transport accounts for 80% (ScienceDaily, 2009). Sustainable transportation solutions can
achieve 30-50% (Litman, 2011)
traffic congestion, accidents and inade
development. By taking advantage of public transport options (train, bus, car sharing) a reduction
in emissions can be as much as 10
For driving tips that will reduce your carbon footprint visit: Green Fleet at
http://www.greenfleet.com.au/Global/Individuals/index.aspx
Renewable Energy devices
) is a method of generating electrical power by
converting solar radiation into direct current electricity using
semiconductors that exhibit the photovoltaic effect. The
photovoltaic effect is the creation of voltage or electric current in
a material upon exposure to light. Photovoltaic power generation
employs solar panels composed of a number of solar cells
containing a photovoltaic material. Materials presently used for
photovoltaic’s include monocrystalline silicon, polycrystalline silicon, amorphous silicon, cadmium
telluride, and copper indium gallium selenite/sulphide. Dhttp://en.wikipedia.org/wiki/Photovoltaics
ue to the growing demand for renewable energy sources, the manufacturing of
solar cells and photovoltaic arrays has advanced considerably in recent years (Jacobson, 2009).
Reduce your individual CO2 emissions – use public transport
Making use of public transports helps the environment considerably. Approximately 20% of the
total carbon dioxide emitted globally is as a direct result of transport (land, air and sea) of which
land transport accounts for 80% (ScienceDaily, 2009). Sustainable transportation solutions can
(Litman, 2011) emission reductions while helping to address
and inadequate mobility for non-drivers, and supporting economic
By taking advantage of public transport options (train, bus, car sharing) a reduction
in emissions can be as much as 10-30% of an individual’s annual carbon footprint (Litman, 20
For driving tips that will reduce your carbon footprint visit: Green Fleet at
http://www.greenfleet.com.au/Global/Individuals/index.aspx
photovoltaic’s include monocrystalline silicon, polycrystalline silicon, amorphous silicon, cadmium
http://en.wikipedia.org/wiki/Photovoltaics
ng demand for renewable energy sources, the manufacturing of
solar cells and photovoltaic arrays has advanced considerably in recent years (Jacobson, 2009).
Making use of public transports helps the environment considerably. Approximately 20% of the
transport (land, air and sea) of which
land transport accounts for 80% (ScienceDaily, 2009). Sustainable transportation solutions can
ctions while helping to address problems such as
and supporting economic
By taking advantage of public transport options (train, bus, car sharing) a reduction
30% of an individual’s annual carbon footprint (Litman, 2011).

2013 | INDONESIA SOLAR CITY GUIDEBOOK 64
Lighting
Solar Bottle Bulb
Solar Bottle Bulbs are an easy and effective lighting solution for low
cost housing in pro-poor areas. The name comes the concept from
which it is made, of which is an empty 1.5 litre plastic bottle. The
content of the bottle includes liquid bleach and purified water. The
Solar Bottle Bulb can be used as an alternative electric powered light
bulb placed within a rooftop that is exposed to sunlight on the outside.
Although this intervention is only useful during daytime, its luminance
is able to produce as much light as a 50W incandescent bulb.
Cost: minimal
Materials needed: plastic bottle, roof sheet material, purified water, chlorine and a rubber sealant.
Portable Solar Light and Charger
There are many solar kits available on the market that offers
a small portable solar panel, LED lamp and a battery for
storing renewable solar energy. The solar energy is sufficient
energy to supply 4 to 6 hours of light to a LED lamp on high
and low settings respectively. The kit also provides cellphone
chargers and adaptors that are suitable for most cellphone
types.
Cost: IDR 200,000 – IDR 300,000
Supplier: PT Sinar Arona Jaya Perkasa, Phone: (021) 619-4277, email: [email protected], website:
http://www.aronastores.com/
Solar Street Light
Solar street lights work on the principle of the photovoltaic cell or solar
cell which absorb energy from the sun during daylight. The solar cell
converts solar energy to electrical energy which is stored within a
battery. The solar lamp draws the current from this battery and
requires no other wiring or energy from alternative sources. Solar
street lights are currently manufactured in Indonesia, the supplier list
can be seen below.
Solar lighting can make use of three types of bulbs; sodium vapour, LED
and induction technology lighting. Additional benefits of using solar
street lighting, other than being low cost and making use of renewable
energy sources, LED solar lighting is long lasting and can be used for

approximately 20 years without replacement, uses a lower voltage to produce a brighter light
the thin-film solar panel is highly durable to high temperatures and hail stones.
Cost: varying on prices, dependent on quantity and type.
Suggested Suppliers:
PT Sinar Arona Jaya Perkasa, Phone:
http://www.aronastores.com/
PT. Adyawinsa Electrical and Power, phone: +62 2189841301, email:
website: http://adyawinsa.com
PT LEN Industri (Persero), Phone: +62225202682, email:
www.len.co.id
PT Surya Perkasa, Phone:
http://www.suryaperkasa.com
PT Active Life, phone:
http://www.solarwerkindo.com
Cooking
Parabolic Cookers
Parabolic cookers are energy efficient devices that require no other
energy resources except solar energy. A parabolic cooker is designed as a
large spherical curvature dish that focuses sunrays inwards which heats
the focus point, such as a pot of water o
able to cook food at the same rate as a conventional oven and boil a litre
of water in 15 minutes. These cookers are considered to be a better
alternative for outdoor cooking and camping as they require no
firewood, gas or electricity.
Cost: IDR250,000 (small) – IDR 3
Energy Saving: (Power output: 500 watts (small)
Solar Box Cooker and Oven
A solar box cooker (similar to the parabolic cooker principles) is a box
with reflective lining material that absorbs and reflects the sun’s rays
and directs it within the box which converts into heat energy. This heat
energy is then able to purify and boil water, cook and bake food and
sterilize various instruments.
approximately 20 years without replacement, uses a lower voltage to produce a brighter light
film solar panel is highly durable to high temperatures and hail stones.
Cost: varying on prices, dependent on quantity and type.
PT Sinar Arona Jaya Perkasa, Phone: +6221619-4277, email: [email protected] , website:
PT. Adyawinsa Electrical and Power, phone: +62 2189841301, email: [email protected]
PT LEN Industri (Persero), Phone: +62225202682, email: [email protected]
PT Surya Perkasa, Phone: +6221629 0801, email: [email protected]
PT Active Life, phone: +6221-54353165, email: [email protected]
Parabolic cookers are energy efficient devices that require no other
energy resources except solar energy. A parabolic cooker is designed as a
large spherical curvature dish that focuses sunrays inwards which heats
the focus point, such as a pot of water or food. The parabolic cooker is
able to cook food at the same rate as a conventional oven and boil a litre
of water in 15 minutes. These cookers are considered to be a better
alternative for outdoor cooking and camping as they require no
3000,000 (large).
Energy Saving: (Power output: 500 watts (small) – 2000watts (large)).
A solar box cooker (similar to the parabolic cooker principles) is a box
material that absorbs and reflects the sun’s rays
and directs it within the box which converts into heat energy. This heat
energy is then able to purify and boil water, cook and bake food and
approximately 20 years without replacement, uses a lower voltage to produce a brighter light and
, email: [email protected] , website:
[email protected], website:
[email protected], website:
[email protected], website:

2013 | INDONESIA SOLAR CITY GUIDEBOOK 66
Box Cookers cook meals with performance varying between half as fast as conventional ovens to
almost the same speed.
Cost: IDR 4,200,000
Supplier: SunFire Solutions, Tele: +27 (0) 11 624 2432; email: [email protected] , website:
www.sunfire.co.za
Water Heating
Solar Water System
Solar water heating systems absorb solar radiation, which then transfers heat directly to an interior
space or storage device and thus distributes the heat. Solar water heating systems are the most
commonly used household water heating alternative.Solar water systems save households 40 - 60%
of their energy bill paying themselves back within 3 years. Indonesia is located in equator (Latitudes
6oN and 11oS)with abundant direct sunlight which makes it feasible to make use of the solar
opportunities for free energy.
Figure 12: Cycle of the sun in Indonesia in yearly basis

Solar Water Systems are available in many designs and makes and are manufactured
Indonesia. There are three main solar water systems available on the market, which are:
1. Thermosyphon SWH systems
The thermosyphon is a simple, efficient, reliable and low
maintenance system in hot and moderate climates, often
referred to as a passive heat exchange. The
costs are minimal and require
devices, however a controller can be used to
water temperature and switch the element on at a pre
programmed time. A collector mounting system and an
insulated storage tank are mounted on a roof (facing north
in the southern hemisphere), the open pipe system allows
hot water to rise through the top of the collector into the
storage tank through the natural convection principal.
2. Split Pressurized SWH systems
The split pressurized SWH system is simiar design
and priciple to that of the thermosyphon system,
the difference is that the collector and tank are
seperated. The storage tank can be located
anywhere in the house and the existing geysors
can be retrofitted to allow for solar water heating
using a conversion kit.The roof mounted collector
is located on a north facing roof allowing optimal radiation and absorbtion.
3. Indirect SWH systems
Indirect or closed systems do not heat the water
directly rather they use fluid with a low
point to absorb radiant energy from the sun.
This system uses heat exchanger that separates
the potable water from the fluid, known as the
‘heat-transfer fluid’ (HTF), that circulates
through the collector. The two most commo
HTFs are water and an antifreeze/water mix that
typically uses non-toxic propylene glycol
the heat exchanger, where th
slightly more expensive the the other two, however indirect systems offer freeze and
overheating protection.
Solar Water Systems are available in many designs and makes and are manufactured
. There are three main solar water systems available on the market, which are:
Thermosyphon SWH systems
is a simple, efficient, reliable and low
maintenance system in hot and moderate climates, often
referred to as a passive heat exchange. The installation
and require no pumps or special control
, however a controller can be used to monitor the
water temperature and switch the element on at a pre-
programmed time. A collector mounting system and an
insulated storage tank are mounted on a roof (facing north
in the southern hemisphere), the open pipe system allows
ugh the top of the collector into the
storage tank through the natural convection principal.
Split Pressurized SWH systems
The split pressurized SWH system is simiar design
and priciple to that of the thermosyphon system,
the difference is that the collector and tank are
seperated. The storage tank can be located
anywhere in the house and the existing geysors
d to allow for solar water heating
using a conversion kit.The roof mounted collector
is located on a north facing roof allowing optimal radiation and absorbtion.
Indirect or closed systems do not heat the water
use fluid with a low-freezing
point to absorb radiant energy from the sun.
heat exchanger that separates
the potable water from the fluid, known as the
transfer fluid’ (HTF), that circulates
through the collector. The two most common
HTFs are water and an antifreeze/water mix that
propylene glycol. After being heated in the panels, the HTF travels to
the heat exchanger, where the heat is transferred to the potable water. This system is
slightly more expensive the the other two, however indirect systems offer freeze and
Solar Water Systems are available in many designs and makes and are manufactured locally in
. There are three main solar water systems available on the market, which are:
is located on a north facing roof allowing optimal radiation and absorbtion.
. After being heated in the panels, the HTF travels to
e heat is transferred to the potable water. This system is
slightly more expensive the the other two, however indirect systems offer freeze and

2013 | INDONESIA SOLAR CITY GUIDEBOOK 68
Cost: Cost of each system is dependent on size, type and make of the solar heating system, therefore
it is recommended that one should apply for a series of quotes with various suppliers, rebates from
Eskom are available and should be considered as a saving option.
Energy Saving:Solar Water Systems save households 40 - 60% of their energy bill paying themselves
back within a 3 year period.
Supplier:
PT Wijaya Karya Intrade Energi, Phone: +6221 85916633, Email: [email protected], Website:
www.wikaenergi.com
PT Inti Sarana Adi Sejahtera, +6221 66607588,email: [email protected], website:
http://www.intisolar.com

Potential Photovoltaic Plants in Indonesia
Ministry of Energy and Mineral Resources has issued ministerial regulation on PV Power Plant
Tariff No. 13 of 2013. As the continuation to these initiatives, MEMR also has released 140 MW
quotas to be tendered in 80 locations.
Figure 13: Quota Map of PV Plants in 80 Locations 2013.
1. Aceh (4MW)
2. North Sumatera (2MW)
3. Riau (8.5MW)
4. West Sumatera (2MW)
5. Bangka Belitung (13MW)
6. Bengkulu (1MW)
7. West Kalimantan (9MW)
8. South Kalimantan (2MW)
9. Central Kalimantan (2MW)
10. East Kalimantan (2.5MW)
11. East Java (4MW)
12. West Nusa Tenggara (17MW)
14. Gorontalo (2MW)
15. Central Sulawesi (2MW)
16. East Sulawesi (1MW)
17. North Sulawesi (4MW)
18. Southeast Sulawesi (14 MW
19. North Maluku (7.5MW)
20. Maluku (10.5MW)
21. Papua (14.5 MW)
22. West Papua (5MW)
Potential Photovoltaic Plants in Indonesia
Ministry of Energy and Mineral Resources has issued ministerial regulation on PV Power Plant
Tariff No. 13 of 2013. As the continuation to these initiatives, MEMR also has released 140 MW
quotas to be tendered in 80 locations.
: Quota Map of PV Plants in 80 Locations 2013. Source: http://energy
indonesia.com/03dge/0130913fit.pdf
West Nusa Tenggara (17MW)13. East Nusa Tenggara (14MW)
14 MW)
Ministry of Energy and Mineral Resources has issued ministerial regulation on PV Power Plant
Tariff No. 13 of 2013. As the continuation to these initiatives, MEMR also has released 140 MW
http://energy-

2013 | INDONESIA SOLAR CITY GUIDEBOOK 70
Wind Energy
Wind power involves converting wind energy into electricity by using wind turbines. A wind turbine
is composed of 3 propellers-like blades called a rotor, which is attached to a tall tower. On average
wind towers are about 20m high to reach the strongest winds.
Indonesia has potential of 9.29 GW and out of it only 0.0006 GW that has been utilized therefore in
the Blue Print of National Energy Management 2006 – 2025 based on Presidential Regulation No. 5
of 2006, the government sets out a vision, policy, goals and objectives for promoting and
implementing renewable energy in the country. In order to meet the long term goals of renewable
energy, government set target to utilize 5% of geothermal and biofuel and also 5% of utilization of
renewable source. Specifically for wind power, government has set the target to utilize 255 MW
power which 25 MW is off grid power and 230 of on grid power.
Both private sector and government institution has measured the potential of wind power in more
than 150 locations and as the result
� There are 19 locations with average wind speed > 5 m/s and power > 150 watt/m2 in 30
meters above ground
� There are 35 locations with average wind speed > 5 m/s and power > 150 watt/m2 in 50
meters above ground
The major challenge to develop these sites remains connection to the national grid and reaching
agreement with the major off-taker with regard to price and general support of the industry.
Figure 14: Wind Turbines combine with Solar PV located on Pandansimo Baru, Yogjakarta

Tidal Energy/ Ocean Current Energy
Tidal energy is the power achieved by capturing the energy
contained in moving water in tides and open ocean currents.
Tidal power is classified as a renewable energy source, because
tides are caused by the orbital mechanics of the solar system
and are considered inexhaustible. Tidal power has great
potential for future power and electricity generation because of
the essentially inexhaustible amount of energy contained in
these rotational systems.
Indonesia as a country has large potential in generating electricity th
offers a large coastline with many bays and lagoons which can be used to generate tidal energy.
There are many large cities that are located on the coast and would benefit greatly from this kind of
power generation.
So far, development of tidal power still in small scale pilot project (10 KW) in Baron Beach or Nusa
Penida Beach which designed by T
students23.
Geothermal energy
Geothermal energy is the heat from t
sustainable. Resources of geothermal energy range from the
shallow ground to hot water and hot rock found a few miles
beneath the Earth's surface, and down even deeper to the
extremely high temperatures of molten rock called magma.
Wells can be drilled into underground reservoirs for the
generation of electricity. Some geothermal power plants use the
steam from a reservoir to power a turbine/generator, while others use the hot water to boil a
working fluid that vaporizes and then tu
used directly for heat. Direct
greenhouses, drying crops, heating water at fish farms, and several industrial processes such as
pasteurizing milk
Indonesia has potential of 219 million Barrel of Oil Equivalent (BOE) or about 27 GW geothermal
energy while is only 1226 MW is utilizing so far.
the government raised the feed-
hour (kWh) to between 10 to 17 cents per kWh.
depending on the availability of infrastructure and potential geothermal reserves where a power
plant operates. For example, the price in Sumatra is 10 cents per kWh, Java 11 cents and Papua 17
cents. Recently, there is new proposal from GoI to adjust the feed in tariff where t
23
http://www.bbc.co.uk/indonesia/majalah/2013/03/130326_iptek_itb_tenagaarus.shtml
/ Ocean Current Energy
is the power achieved by capturing the energy
contained in moving water in tides and open ocean currents.
Tidal power is classified as a renewable energy source, because
tides are caused by the orbital mechanics of the solar system
haustible. Tidal power has great
potential for future power and electricity generation because of
the essentially inexhaustible amount of energy contained in
as a country has large potential in generating electricity through this mechanism as it
offers a large coastline with many bays and lagoons which can be used to generate tidal energy.
There are many large cities that are located on the coast and would benefit greatly from this kind of
development of tidal power still in small scale pilot project (10 KW) in Baron Beach or Nusa
Penida Beach which designed by T-Files research team comprised of Institut Teknologi Bandung
Geothermal energy is the heat from the Earth. It's clean and
sustainable. Resources of geothermal energy range from the
shallow ground to hot water and hot rock found a few miles
beneath the Earth's surface, and down even deeper to the
extremely high temperatures of molten rock called magma.
Wells can be drilled into underground reservoirs for the
generation of electricity. Some geothermal power plants use the
steam from a reservoir to power a turbine/generator, while others use the hot water to boil a
working fluid that vaporizes and then turns a turbine. Hot water near the surface of Earth can be
used directly for heat. Direct-use applications include heating buildings, growing plants in
greenhouses, drying crops, heating water at fish farms, and several industrial processes such as
Indonesia has potential of 219 million Barrel of Oil Equivalent (BOE) or about 27 GW geothermal
energy while is only 1226 MW is utilizing so far. In away to speed up the development, i
-in-tariff for geothermal power plants from 9.7 US cents per kilowatt
hour (kWh) to between 10 to 17 cents per kWh. The prices vary from one region to another,
depending on the availability of infrastructure and potential geothermal reserves where a power
example, the price in Sumatra is 10 cents per kWh, Java 11 cents and Papua 17
Recently, there is new proposal from GoI to adjust the feed in tariff where t
http://www.bbc.co.uk/indonesia/majalah/2013/03/130326_iptek_itb_tenagaarus.shtml
rough this mechanism as it
offers a large coastline with many bays and lagoons which can be used to generate tidal energy.
There are many large cities that are located on the coast and would benefit greatly from this kind of
development of tidal power still in small scale pilot project (10 KW) in Baron Beach or Nusa
Files research team comprised of Institut Teknologi Bandung
steam from a reservoir to power a turbine/generator, while others use the hot water to boil a
rns a turbine. Hot water near the surface of Earth can be
use applications include heating buildings, growing plants in
greenhouses, drying crops, heating water at fish farms, and several industrial processes such as
Indonesia has potential of 219 million Barrel of Oil Equivalent (BOE) or about 27 GW geothermal
In away to speed up the development, in July 2012,
hermal power plants from 9.7 US cents per kilowatt-
prices vary from one region to another,
depending on the availability of infrastructure and potential geothermal reserves where a power
example, the price in Sumatra is 10 cents per kWh, Java 11 cents and Papua 17
Recently, there is new proposal from GoI to adjust the feed in tariff where the new pricing
http://www.bbc.co.uk/indonesia/majalah/2013/03/130326_iptek_itb_tenagaarus.shtml

2013 | INDONESIA SOLAR CITY GUIDEBOOK 72
would be based on a power plant’s capacity and enthalpy, or heat content.In the capacity category,
power plants will be divided into five groups: over 55 MW, between 20-55 MW,between 10-20 MW,
between 5-10 MW and under 5 MW.A power plant with low-medium enthalpy lower than 225
degrees Celsius, depending on the capacity of the power plant, will have a ceiling price range from
17 to 30 US cents per kWh and that of high enthalpy from 11 to 28 cents per kWh.
Hydro power plants
Hydro-power or water power is power derived from the energy of falling
water and running water, which may be harnessed for useful purposes.
Kinetic energy of flowing water (when it moves from higher potential to
lower potential) rotates the blades/propellers of turbine, which rotates
the axle. The axle has a coil which is placed between the magnets. When
the coils rotate in magnetic field it induces them in the coil due to change
in flux. Hence, kinetic energy of flowing water is converted to electrical
energy.
Until September 2013, Indonesia has utilized 5,711 MW of large scale hydro power and around 230
MW of micro/minihidro out of 76.67 GW potential sources. GoI also has introduced feed in tariff for
micro/minihydro based on MEMR Regulation No. 4 of 2012 while the price is vary from one region to
other region. For instance the price in Java and Bali in IDR 656; Sumatera and Sulawesi IDR 787. Since
the regulation is not really attractive to developer then this regulation is on process to be revised24.
24
http://energy-indonesia.com/03dge/0130913fit.pdf
Chapter6: International financing mechanisms
International financing options and related
Leveraging international finance is one of the crucial and decisive steps in accomplishment of sound
and feasible energy conservation and renewable energy generation projects. Based on the activities
to be undertaken in the purview of the projec
technology employed, economic feasibility and the institutional set up in support of the project.
to the fact that renewable energy projects have long gestation periods and the returns are usually
envisioned with long term perspectives, financing these projects require
term investment. In addition to
support comes into play to sustain
International donor organizations
REEEPhave endeavoured to unlock the collaborative funding potential for renewable energy and
energy conservation projects. So
(RE) and energy efficiency (EE) projects are enlisted here along with explanation of their funding
mechanism.
1. Green or Clean Energy
Clean Renewable Energy bonds
in renewable energy projects. Local authorities and implementing agencies issue financial
bonds to the public and receive interest free capital. Bond holders are either compensated
through the payment of interest or tax credits. This mechanism is viable only if the investing
agency is large enough to attract the requisite number of investors.
bonds are issued by globally operative banks
governmental bodies or groups of governments. Bonds offer tax holidays and rebates and
are funded via international capital markets
Green Bond instrument. EIB issues ‘
fields of renewable energy and energy efficiency. Issuance of bonds precedes the acquisition
of a reasonable credit rating for the project through credit agencies like CRISIL, CARE etc.
This requires robust project planning including comprehensive analysis of associated risks
and forecast of financial resources over the course of the project.
International Finance Corporation
of financing products and investment services under its funding portfolio. IFC mainly aims at
promoting sustainable enterprises, encouraging entrepreneurship, and mobilizing resources
that would not otherwise be available. These funds can be leveraged by encouraging
entrepreneurial organizations to invest in renewable energy and energy efficiency projects.
2. Carbon Finance
As one of the popular options for Carbon finance,
offers an international platform for trading Carbon emission reductions through exchange of
Certified Emission Reduction certificates (CERs) between countries
: International financing mechanisms
International financing options and related mechanisms
Leveraging international finance is one of the crucial and decisive steps in accomplishment of sound
and feasible energy conservation and renewable energy generation projects. Based on the activities
to be undertaken in the purview of the project, financing varies in tune with factors like
technology employed, economic feasibility and the institutional set up in support of the project.
renewable energy projects have long gestation periods and the returns are usually
envisioned with long term perspectives, financing these projects require high initial
In addition to private capital markets, international bi-lateral or multi
support comes into play to sustain local renewable energy and energy efficiency
organizations such as United Nations, World Bank, European Commission
to unlock the collaborative funding potential for renewable energy and
energy conservation projects. Some of these international financing options for renewable energy
(RE) and energy efficiency (EE) projects are enlisted here along with explanation of their funding
or Clean Energy Bonds and Investment Services
Clean Renewable Energy bonds are unique lending mechanisms for public entities investing
in renewable energy projects. Local authorities and implementing agencies issue financial
bonds to the public and receive interest free capital. Bond holders are either compensated
yment of interest or tax credits. This mechanism is viable only if the investing
agency is large enough to attract the requisite number of investors. Internationally, these
bonds are issued by globally operative banks such as European Investment Bank (EIB)
governmental bodies or groups of governments. Bonds offer tax holidays and rebates and
are funded via international capital markets, in the case of EIB, additionally through its
Green Bond instrument. EIB issues ‘Climate Awareness Bonds’ to finance projects within the
fields of renewable energy and energy efficiency. Issuance of bonds precedes the acquisition
of a reasonable credit rating for the project through credit agencies like CRISIL, CARE etc.
es robust project planning including comprehensive analysis of associated risks
and forecast of financial resources over the course of the project.
International Finance Corporation (IFC), the financing arm of World Bank also has a number
of financing products and investment services under its funding portfolio. IFC mainly aims at
promoting sustainable enterprises, encouraging entrepreneurship, and mobilizing resources
wise be available. These funds can be leveraged by encouraging
entrepreneurial organizations to invest in renewable energy and energy efficiency projects.
As one of the popular options for Carbon finance,Clean Development Mechanism
offers an international platform for trading Carbon emission reductions through exchange of
Certified Emission Reduction certificates (CERs) between countries. Once registered, the
mechanisms
Leveraging international finance is one of the crucial and decisive steps in accomplishment of sound
and feasible energy conservation and renewable energy generation projects. Based on the activities
t, financing varies in tune with factors like scale,
technology employed, economic feasibility and the institutional set up in support of the project. Due
renewable energy projects have long gestation periods and the returns are usually
initial capital withlong
lateral or multi-lateral
rgy and energy efficiency projects.
United Nations, World Bank, European Commission, and
to unlock the collaborative funding potential for renewable energy and
me of these international financing options for renewable energy
(RE) and energy efficiency (EE) projects are enlisted here along with explanation of their funding
are unique lending mechanisms for public entities investing
in renewable energy projects. Local authorities and implementing agencies issue financial
bonds to the public and receive interest free capital. Bond holders are either compensated
yment of interest or tax credits. This mechanism is viable only if the investing
Internationally, these
European Investment Bank (EIB),
governmental bodies or groups of governments. Bonds offer tax holidays and rebates and
additionally through its
’ to finance projects within the
fields of renewable energy and energy efficiency. Issuance of bonds precedes the acquisition
of a reasonable credit rating for the project through credit agencies like CRISIL, CARE etc.
es robust project planning including comprehensive analysis of associated risks
, the financing arm of World Bank also has a number
of financing products and investment services under its funding portfolio. IFC mainly aims at
promoting sustainable enterprises, encouraging entrepreneurship, and mobilizing resources
wise be available. These funds can be leveraged by encouraging
entrepreneurial organizations to invest in renewable energy and energy efficiency projects.
Clean Development Mechanism (CDM)
offers an international platform for trading Carbon emission reductions through exchange of
Once registered, the

2013 | INDONESIA SOLAR CITY GUIDEBOOK 74
project is monitored for the actual emission reductions annually and CERs generated thereof
are exchanged to receive funding.
ICLEI in partnership with UN Habitat have published a tool in 2012 specifically focusing on
‘Making Carbon Markets Work for Cities: A Guide for Cities in Developing Countries’, which
seeks to enhance the capacity of local government officials to initiate, develop and manage
GHG reduction projects, and to get the carbon financing they need.
3. Public Finance Mechanisms
Some funding bodies like Global Energy Efficiency and Renewable Energy Fund (GEEREF),
which are collaborative multi-lateral investment agencies, focus on renewable energy and
energy efficiency projects and invest in private equity funds specializing in equity finance for
SMEs. Availing these funds entails a track record of RE and EE projects which have not just
been financially but also environmentally sustainable. Direct financing isn’t possible with this
funding option but can be deemed as a sustainable one as it targets financing the local small
and medium RE and EE industry.
Alternatively, leveraging the private capital market through commercial loans is a viable
option and helps the local governments fund projects. . In considering a project for
commercial bank financing, banks assess the local authority’s cash flow and financial
viability. Where the credit worthiness of the local authority is in question, a credit guarantee
may be required, which could be provided either through the state/province or a third party.
A more self-reliant means of funding local projects is through the self-financing model
wherein the local authorities fund renewable energy implementation through granted
municipal funds or taxes collected by the local authority. Special investment funds for
renewable energy projects may also be set up in conjunction with the state/provincial
government. Tax and tariff collections could also be used to self-finance these projects.
Factoring in investment recovery is critical, as failure to recover costs directly impacts utility
earnings and viability of the investment; also sending a discouraging message for further
investments.
4. Energy Certificates
Renewable Energy Certificates (REC) and Energy Efficiency Certificates (EEC) are also a
secure means of availing funding by presenting the energy generation/savings potential of
the projects. Tradable certificates for every basic unit of energy generated (1 MWh) from RE
projects or saved under EE projects can be exchanged for funds in national or international
markets. Basically meant to be an easy method of reducing emissions for countries lacking
RE potential or lacking the infrastructure to do so, the REC and EEC mechanism enables
revenue flow fairly easily by trading the benefits obtained from the projects. Once the REC
or EEC has been sold, it ceases to be accounted as an emission reduction achieved under the
inventory of the entity which has sold the certificate.

Other funding options may by availed through
Development Bank for the Asian and South Asian region), Development Finan
(DFIs) etc.
5. Nationally Appropriate Mitigation Action (NAMA) Facility
During the climate negotiations in Doha, Qatar, the German Federal Ministry for the
Environment, Nature Conservation and Nuclear Safety (BMU) and the Department of Energ
and Climate Change (DECC) of the United Kingdom (UK) launched
called "NAMA Facility" to support partner countries to implement ambitious action against
climate change
The NAMA Facility is designed to support developing countries t
in tackling climate change and want to implement transformational Nationally Appropriate
Mitigating Actions (NAMA). Transformational NAMAs are projects, policies, or programmes
that shift a whole technology or sector in a country
trajectory. Developing countries are preparing NAMAs as part of their national strategies.
However, it is difficult to access finance through existing commercial and public channels to
finance implementation, particularly f
competitive selection process the Facility will improve the value for money and quality of
NAMAs and enable their implementation. It is intended that the Facility will support
investments across a range of countr
finance.
Other funding options may by availed through Regional Development Banks
Development Bank for the Asian and South Asian region), Development Finan
Nationally Appropriate Mitigation Action (NAMA) Facility
the climate negotiations in Doha, Qatar, the German Federal Ministry for the
Environment, Nature Conservation and Nuclear Safety (BMU) and the Department of Energ
and Climate Change (DECC) of the United Kingdom (UK) launched €70 million of funding
"NAMA Facility" to support partner countries to implement ambitious action against
The NAMA Facility is designed to support developing countries that show strong leadership
in tackling climate change and want to implement transformational Nationally Appropriate
Mitigating Actions (NAMA). Transformational NAMAs are projects, policies, or programmes
that shift a whole technology or sector in a country onto a low-carbon development
trajectory. Developing countries are preparing NAMAs as part of their national strategies.
However, it is difficult to access finance through existing commercial and public channels to
finance implementation, particularly for the most innovative NAMAs. By applying a
competitive selection process the Facility will improve the value for money and quality of
NAMAs and enable their implementation. It is intended that the Facility will support
investments across a range of countries and sectors with grant funding as well as loan
Regional Development Banks (like Asian
Development Bank for the Asian and South Asian region), Development Finance Institutions
Nationally Appropriate Mitigation Action (NAMA) Facility
the climate negotiations in Doha, Qatar, the German Federal Ministry for the
Environment, Nature Conservation and Nuclear Safety (BMU) and the Department of Energy
€70 million of funding
"NAMA Facility" to support partner countries to implement ambitious action against
hat show strong leadership
in tackling climate change and want to implement transformational Nationally Appropriate
Mitigating Actions (NAMA). Transformational NAMAs are projects, policies, or programmes
carbon development
trajectory. Developing countries are preparing NAMAs as part of their national strategies.
However, it is difficult to access finance through existing commercial and public channels to
or the most innovative NAMAs. By applying a
competitive selection process the Facility will improve the value for money and quality of
NAMAs and enable their implementation. It is intended that the Facility will support
ies and sectors with grant funding as well as loan

2013 | INDONESIA SOLAR CITY GUIDEBOOK 76
References
BBC, 2013 Development of ocean current power in Indonesia by T-Files Research team, online
available:
http://www.bbc.co.uk/indonesia/majalah/2013/03/130326_iptek_itb_tenagaarus.shtml
Boden, T.A., G. Marland, and R.J. Andres. 2010. Global, Regional, and National Fossil-Fuel CO2
Emissions. Carbon Dioxide Information Analysis Center, Oak Ridge National Laboratory, U.S.
Department of Energy, Oak Ridge, Tenn., U.S.A. doi 10.3334/CDIAC/00001_V2010
Climate Investment Funds, Clean Technology Fund Investment Plan for Indonesia, 2010, online
available:
http://www.climateinvestmentfunds.org/cifnet/sites/default/files/Indonesia%20CTF%20Investm
ent%20Plan%20-%20Endorsed.pdf
Davidson, P.R. Bosch, R. Dave, L.A. Meyer (eds)], Cambridge University Press, Cambridge, United
Kingdom and New York, NY, USA. Online. Available:
http://www.eoearth.org/article/IPCC_Fourth_Assessment_Report,_Working_Group_III:_Chapte
r_4 [25 April 2012].
IEA. 2006. Key World Energy Statistics. Online. Available:
http://www.iea.org/textbase/nppdf/free/2006/key2006.pdf [25 July 2012].
IEA. 2009. Key World Energy Statistics. Online. Available:
http://www.iea.org/textbase/nppdf/free/2009/key_stats_2009.pdf [23 April 2012].
IEA. 2010. Key World Energy Statistics. Online. Available:
http://www.iea.org/textbase/nppdf/free/2010/key_stats_2010.pdf [23 April 2012].
IES. 2010. International Energy Statistics. Online. Available:
http://www.eia.gov/cfapps/ipdbproject/IEDIndex3.cfm?tid=90&pid=44&aid=8 [25 April 2012].
IFPRI.2011. The impact of global climate change on Indonesia economy. Online available:
http://www.ifpri.org/sites/default/files/publications/ifpridp01148.pdf
IMF. 2010. International Monetary Fund: Chapter 2: Country and Regional Perspectives. Online.
Available: http://www.imf.org/external/pubs/ft/weo/2010/02/pdf/c2.pdf [25 July 2012].
Indonesia Second National Communication Under The United Nations Framework Convention on
Climate Change (UNFCCC), online available: http://unfccc.int/files/national_reports/non-
annex_i_natcom/submitted_natcom/application/pdf/indonesia_snc.pdf

IPCC Glossary Climate Change. 2001. The Scientific Basis. Contribution of Working Group I to the
Third Assessment Report of the Intergovernmental Panel on Climate Change. Available. [Online]:
http://www.grida.no/climate/ipcc_tar/wg1/518.htm. [12 July 2010].
IPCC. 2007a. Climate Change 2007: The Science Basis. Contribution of Working Groups I to the
Fourth Assessment Report of the Intergovernmental Panel on Climate Change. In S. Solomon, D.
Qin, M Manning, Z. Chen, M. Marquis, K.B. Averyt, M. Tognor and H.L. Miller, eds Cambridge
University Press.
IPCC. 2007b. Climate Change 2007: Synthesis Report. Contribution
the Fourth Assessment Report of the Intergovernmental Panel on Climate Change (Core Writing
team, Pachauri, R.K and Reisinger, A (eds) IPCC, Geneva, Switzerland.
IPCC .2007c. (Boko, M., I. Niang, A. Nyong, C. Vogel, A.
Tabo and P. Yanda) Africa. Climate Change 2007: Impacts, Adaptation and Vulnerability.
Contribution of Working Group II to the Fourth Assessment Report of the Intergovernmental
Panel on Climate Change, M.L. Parry, O.
Hanson, Eds., Cambridge University Press, Cambridge UK, 433
Jacobson, M.Z. 2009. Review of Solutions to Global Warming, Air Pollution, and Energy Security
JICA, Study on Energy Conservation and Efficiency Improvement in The Republic of Indonesia,
Final Report Summary;” August 2009
Jollands, N. 2008. Chapter 6: Cities and Energy. World Energy Outlook 2008. International Energy
Agency. Online. Available: http://www.oecd.org/dataoecd/54/18/42544964.pdf
Litman, T. A., 2011. Win-Win Transportation Emissions Reduction Strategies. Online. Available:
http://www.vtpi.org/wwclimate.pdf
MEMR, Handbook of Energy & Economic Statistics of Indonesia, Minis
Resources (Indonesia) 2012. Online available:
http://prokum.esdm.go.id/Publikasi/Handbook%20of%20Energy%20&%20Economic%20Statistic
s%20of%20Indonesia%20/Handbook%20of%20Energy%20&%20Economic%20Statistics%20ind%
202012.pdf
MEMR, Inauguration of first green retail in Indonesia, 2013 online available:
http://www.ebtke.esdm.go.id/id/energi/konservasi
pertama-di-indonesia.html
MEMR, updated of renewable energy development in Indonesia, 2013 online available:
http://energy-indonesia.com/03dge/0130913fit.pdf
PAKLIM, Climate Change strategy in the city,
strategies-in-cities-2/yogyakarta/#sthash.88OZlDeN.dpuf
PowerSavings. 2012. Energy Saving Tips. Online. Available:
http://www.savingpower.co.za/index.php?q=con,13,%20Power%2
IPCC Glossary Climate Change. 2001. The Scientific Basis. Contribution of Working Group I to the
essment Report of the Intergovernmental Panel on Climate Change. Available. [Online]:
http://www.grida.no/climate/ipcc_tar/wg1/518.htm. [12 July 2010].
IPCC. 2007a. Climate Change 2007: The Science Basis. Contribution of Working Groups I to the
ssment Report of the Intergovernmental Panel on Climate Change. In S. Solomon, D.
Qin, M Manning, Z. Chen, M. Marquis, K.B. Averyt, M. Tognor and H.L. Miller, eds Cambridge
IPCC. 2007b. Climate Change 2007: Synthesis Report. Contribution of Working Groups I, II and III to
the Fourth Assessment Report of the Intergovernmental Panel on Climate Change (Core Writing
team, Pachauri, R.K and Reisinger, A (eds) IPCC, Geneva, Switzerland.
IPCC .2007c. (Boko, M., I. Niang, A. Nyong, C. Vogel, A. Githeko, M. Medany, B. Osman
Tabo and P. Yanda) Africa. Climate Change 2007: Impacts, Adaptation and Vulnerability.
Contribution of Working Group II to the Fourth Assessment Report of the Intergovernmental
Panel on Climate Change, M.L. Parry, O.F. Canziani, J.P. Palutikof, P.J. van der Linden and C.E.
Hanson, Eds., Cambridge University Press, Cambridge UK, 433-467.
Review of Solutions to Global Warming, Air Pollution, and Energy Security
Study on Energy Conservation and Efficiency Improvement in The Republic of Indonesia,
Final Report Summary;” August 2009
Jollands, N. 2008. Chapter 6: Cities and Energy. World Energy Outlook 2008. International Energy
http://www.oecd.org/dataoecd/54/18/42544964.pdf
Win Transportation Emissions Reduction Strategies. Online. Available:
http://www.vtpi.org/wwclimate.pdf [3 May 2012]
Handbook of Energy & Economic Statistics of Indonesia, Ministry of Energy and Mineral
Resources (Indonesia) 2012. Online available:
http://prokum.esdm.go.id/Publikasi/Handbook%20of%20Energy%20&%20Economic%20Statistic
s%20of%20Indonesia%20/Handbook%20of%20Energy%20&%20Economic%20Statistics%20ind%
MEMR, Inauguration of first green retail in Indonesia, 2013 online available:
http://www.ebtke.esdm.go.id/id/energi/konservasi-energi/237-peresmian-green
ble energy development in Indonesia, 2013 online available:
indonesia.com/03dge/0130913fit.pdf
PAKLIM, Climate Change strategy in the city, http://www.paklim.org/about/climate
2/yogyakarta/#sthash.88OZlDeN.dpuf
PowerSavings. 2012. Energy Saving Tips. Online. Available:
http://www.savingpower.co.za/index.php?q=con,13,%20Power%20Usage [3 May 2012]
IPCC Glossary Climate Change. 2001. The Scientific Basis. Contribution of Working Group I to the
essment Report of the Intergovernmental Panel on Climate Change. Available. [Online]:
IPCC. 2007a. Climate Change 2007: The Science Basis. Contribution of Working Groups I to the
ssment Report of the Intergovernmental Panel on Climate Change. In S. Solomon, D.
Qin, M Manning, Z. Chen, M. Marquis, K.B. Averyt, M. Tognor and H.L. Miller, eds Cambridge
of Working Groups I, II and III to
the Fourth Assessment Report of the Intergovernmental Panel on Climate Change (Core Writing
Githeko, M. Medany, B. Osman-Elasha, R.
Tabo and P. Yanda) Africa. Climate Change 2007: Impacts, Adaptation and Vulnerability.
Contribution of Working Group II to the Fourth Assessment Report of the Intergovernmental
F. Canziani, J.P. Palutikof, P.J. van der Linden and C.E.
Review of Solutions to Global Warming, Air Pollution, and Energy Security p. 4.
Study on Energy Conservation and Efficiency Improvement in The Republic of Indonesia,
Jollands, N. 2008. Chapter 6: Cities and Energy. World Energy Outlook 2008. International Energy
http://www.oecd.org/dataoecd/54/18/42544964.pdf [25 July 2012].
Win Transportation Emissions Reduction Strategies. Online. Available:
try of Energy and Mineral
http://prokum.esdm.go.id/Publikasi/Handbook%20of%20Energy%20&%20Economic%20Statistic
s%20of%20Indonesia%20/Handbook%20of%20Energy%20&%20Economic%20Statistics%20ind%
green-retail-
ble energy development in Indonesia, 2013 online available:
http://www.paklim.org/about/climate-change-
[3 May 2012]

2013 | INDONESIA SOLAR CITY GUIDEBOOK 78
ScienceDaily. 2009. Ways To Reduce Carbon Dioxide Emissions From Transport. Online. Available:
http://www.sciencedaily.com/releases/2009/07/090727080836.htm [3 May 2012].
Trading Economics. 2013. GDP Indonesia Online Available:
http://www.tradingeconomics.com/indonesia/gdp-per-capita[16 December 2013].
Trading Economics. 2013. Urban population (% of total) in Indonesia Online Available:
http://www.tradingeconomics.com/indonesia/population [16 December 2013].
UNFCCC. Indonesia second national communication, 2010 online available:
http://unfccc.int/files/national_reports/non-
annex_i_natcom/submitted_natcom/application/pdf/indonesia_snc.pdf
USAID, Indonesia Energy Assesment, 2008, online available:
http://www.scribd.com/doc/128747479/Indonesia-Energy-Assessment
Wika Karya, temperature setting of geyser thermostat in Indonesia, online available:
http://linggojati.com/?ForceFlash=true#/submenu/Electric-Water-Heater.html
World Bank. 2010. World Bank Population Data Sheet. Online. Available:
http://search.worldbank.org/all?qterm=population%20data [23 April 2012].
Worldstat info, 2011. Online. Available: http://en.worldstat.info/ [27 March 2013]
UN. 2010. "World Population Prospects: The 2010 Revision". Department of Economic and Social
Affairs, population division. United Nations. Online. Available:
http://esa.un.org/unpd/wup/index.htm [23 April 2012].
UN Habitat. 2010. State of the World’s Cities 2010/2011: Bridging the Urban Divide. United Nations
Human Settlements Programme. Online. Available:
http://www.unhabitat.org/documents/SOWC10/R7.pdf [27 March 2013]