Embed Size (px)
DESCRIPTION
The latest Indonesia Economic Quarterly highlights the strengthening of capital flows into Indonesia through 2010 and the effect of recent increases in commodity prices.
Citation preview


i
INDONESIA ECONOMIC QUARTERLY Maximizing opportunities, managing risks
December 2010


i i i
Preface
The Indonesian Economic Quarterly reports on and synthesizes the past three months’ key developments in Indonesia’s economy. It places them in a longer-term and global context, and assesses the implications of these developments and other changes in policy for the outlook for Indonesia’s economic and social welfare. Its coverage ranges from the macroeconomy to financial markets to indicators of human welfare and development. It is intended for a wide audience, including policy makers, business leaders, financial market participants, and the community of analysts and professionals engaged in Indonesia’s evolving economy.
This Indonesian Economic Quarterly was prepared and compiled by the macroeconomic analysis team at the World Bank’s Jakarta office, under the guidance of Lead Economist Shubham Chaudhuri and Senior Country Economist Enrique Blanco Armas: Magda Adriani (rice prices), Andrew Blackman (trade flows, balance of payments), Andrew Carter (government revenues), Andrew Ceber (national accounts), Faya Hayati (prices), Ahya Ihsan (government expenditure and fiscal disbursements), Diva Singh (financial markets, monetary conditions, banking sector, and capital flows). Additional contributions were received from Pandu Harimurti (Jamkesmas), Amri Ilmma (poverty), Jon Jellema (Bantuan Langsung Tunai), Paavo Monkkonen (housing), Jemima Sy (water and sanitation), Victoria A. Beard, Retno Sri Handini, and Anna I. Gueorguieva (Monitoring and Evaluation). Tia Chandra, Kiyoshi Taniguchi and Ashley Taylor shared the editing and production. Enrique Blanco Armas, Jonas Fallov, Hassan Noura, Hari Purnomo, Vijay Ramachandran and Theo Thomas provided detailed comments on earlier drafts.
For more World Bank analysis of Indonesia’s economy:
For information about the World Bank and its activities in Indonesia, please visit www.worldbank.org/id In order to be included on an email distribution list for this Quarterly series and related publications, please contact [email protected]. For questions and comments relating to this publication, please contact [email protected].

Table of contents
Preface iii
Executive Summary: Maximizing opportunities, managing risks viii
A. ECONOMIC AND FISCAL UPDATE 1
1. The global drivers of Indonesia’s external balance have strengthened 1 2. The outlook for domestic growth remains robust for 2011 1 3. On the back of global developments, balance of payments inflows rose further 3 4. Domestic financial markets have been boosted by the capital inflows 4 5. Food price shocks again dominate recent movements in inflation 7 6. Weakness in fiscal expenditures continues and tax revenue growth has slowed 8 7. Near-term risks are predominantly external, but domestic policies will determine the medium-
term growth trajectory 10
B. SOME RECENT DEVELOPMENTS IN INDONESIA’S ECONOMY 12
1. Managing capital inflows: Policy options for Indonesia 12 a. Capital inflows have been on the rise in Indonesia this year, bringing benefits but also risks
that necessitate an appropriate policy response ....................................................................... 12 b. Rising portfolio inflows raise macroeconomic and prudential concerns and heighten the risk
of disruptive outflows ................................................................................................................... 13 c. Medium-term policies should aim to attract more FDI and strengthen the financial system
through macro-prudential regulations ........................................................................................ 14 d. Indonesia has various short-term policy options, of which gradual appreciation and the
sterilized accumulation of reserves may be the two most appropriate .................................... 15 2. Quality of public spending and disbursement profile in Indonesia 16
a. Improving the quality of public spending is a key priority for the Government ...................... 16 b. Budget execution is skewed towards the end of the fiscal year ............................................... 16 c. International comparisons highlight Indonesia’s budget execution challenges ..................... 17 d. Budget under-spending and a skewed disbursement profile can hinder the effectiveness
and efficiency of public spending ................................................................................................ 18 e. Impediments to disbursement and recent policy reforms ......................................................... 19 f. Looking forward ............................................................................................................................ 20
C. INDONESIA 2014 AND BEYOND: A SELECTIVE LOOK 21
1. Assessing the performance of an Indonesian unconditional cash transfer: BLT 23 2. Does JAMKESMAS protect the population from health expenditure shocks? 27 3. Housing and services for low-income households in Indonesia 31 4. Incentivizing local governments to take responsibility for water and sanitation services 34 5. National Monitoring and Evaluation (M&E) in Indonesia 38
a. International shift towards performance-informed policy making, planning and budgeting . 38 b. M&E in Indonesia ........................................................................................................................... 39 c. Moving towards performance-informed budgeting and developing a coordinated M&E
system ............................................................................................................................................ 41
APPENDIX: SNAPSHOT OF THE INDONESIAN ECONOMY 42
LIST OF FIGURES
Figure 1: Rising equity and bond flows to emerging markets .......................................................... 1 Figure 2: Global commodity prices have picked up ........................................................................... 1 Figure 3: Growth weakened slightly in Q3… ...................................................................................... 2 Figure 4: …with agriculture particularly weak .................................................................................... 2 Figure 5: Agricultural exports have picked up ................................................................................... 4 Figure 6: …including Italy and Belgium .............................................................................................. 6 Figure 7: Indonesia’s public debt has fallen and reserves are rising ............................................... 6 Figure 8: Sterilization of reserve accumulation continues ................................................................ 7 Figure 9: Credit growth has been driven by working capital loans .................................................. 7 Figure 10: Inflation has risen over the year but remains below historic averages .......................... 8 Figure 11: Core inflation has increased only steadily while volatile prices (mainly food) have
driven headline inflation ................................................................................................ 8 Figure 12: The rise in net portfolio inflows has dominated the financial account since 2009… .. 13 Figure 13: …with a majority of non-resident portfolio inflows going into domestic government
securities (SUNs) .......................................................................................................... 13 Figure 14: The Rupiah saw a marked appreciation in nominal and real terms in 2009, but more
gradual in 2010 ............................................................................................................. 14 Figure 15: Foreign ownership of domestic assets has increased, but so too have reserves ...... 14 Figure 16: Capital expenditures are heavily skewed ........................................................................ 16 Figure 17: Spending frequently under-shoots Budget levels ......................................................... 16 Figure 18: Indonesia’s skewed disbursement profile stands out amongst regional peers .......... 17 Figure 19: Aggregate poverty is falling ............................................................................................. 21 Figure 20: Provincial disparities in poverty remain ......................................................................... 22 Figure 21: GoI social assistance program coverage, 2008 and 2009 ............................................. 26 Figure 22: BLT incidence and coverage, 2005 and 2008 ................................................................. 26 Figure 23: Jamkesmas health insurance covers almost half the poor population ........................ 27 Figure 24: Individuals with Jamkesmas coverage are more likely to use inpatient services ....... 28 Figure 25: Changes in housing conditions in urban areas, 1988 - 2007 ........................................ 31 Figure 26: Housing materials, infrastructure and land title by expenditure deciles, 2007 ........... 32 Figure 27: Rent-to-income and-expenditure ratios .......................................................................... 32 Figure 28: Declining total access to improved water supply .......................................................... 34 Figure 29: Urban usage of unimproved water supply has risen ..................................................... 34 Figure 30: Quality of access to water supply and household income are highly correlated ....... 35 Figure 31: Depreciation in urban water utilities (PDAMs) can exceed new investment ................ 35 Figure 32: Access to improved sanitation ........................................................................................ 35 Figure 33: Good Governance in Kota Palembang Leads to Better Services ................................. 36
LIST OF APPENDIX FIGURES Figure 1: GDP growth moderates ...................................................................................................... 42 Figure 2: Contributions to GDP expenditures .................................................................................. 42 Figure 3: Contributions to GDP production ...................................................................................... 42 Figure 4: Motor cycle and motor vehicle sales ................................................................................. 42 Figure 5: Consumer indicators .......................................................................................................... 42 Figure 6: Industrial production indicators ........................................................................................ 42 Figure 7: Real trade flows ................................................................................................................... 43 Figure 8: Balance of Payments .......................................................................................................... 43 Figure 9: Trade balance ...................................................................................................................... 43 Figure 10: International reserves and capital inflows ...................................................................... 43 Figure 11: Term of trade and monthly export and import chained Fisher-Price indices .............. 43 Figure 12: Inflation and monetary policy .......................................................................................... 43 Figure 13: Monthly breakdown of CPI ............................................................................................... 44 Figure 14: Inflation amongst neighboring countries ........................................................................ 44 Figure 15: Domestic and international rice price comparison ........................................................ 44 Figure 16: Poverty, employment, and unemployment rate .............................................................. 44 Figure 17: Regional equity indices .................................................................................................... 44 Figure 18: Broad Dollar Index and Rupiah spot ............................................................................... 44 Figure 19: 5 Year local currency bond yields ................................................................................... 45 Figure 20: Sovereign USD Bond EMBI Spreads ............................................................................... 45 Figure 21: International commercial bank lending ........................................................................... 45
Figure 22: Banking sector financial indicators ................................................................................. 45
LIST OF TABLES Table 1: Robust growth to continue through 2011 .......................................................................... viii Table 2: Aggregate GDP projections for 2010 and 2011 are broadly unchanged ............................ 3 Table 3: Record balance of payments inflows expected for 2010..................................................... 4 Table 4: Indonesia’s CDS spreads are well below several investment-grade sovereigns… .......... 5 Table 5: The approved 2011 Budget projects a higher deficit than currently projected for 2010 10 Table 6: Ministry of Health budget allocation and target performance .......................................... 18 Table 7: Summary of BPK audit findings on the road sector .......................................................... 19 Table 8: BLT recipients found jobs at a greater rate ........................................................................ 25 Table 9: BLT households also avoided reductions in school participation and increases in child
labor .............................................................................................................................. 25 Table 10: BLT Deduction Frequencies, Amounts, Actors, and Uses .............................................. 26 Table 11: M & E Systems .................................................................................................................... 39 Table 12: National Level Indicators used by Central Governments ................................................ 39 Table 13: Agencies and M&E Mandates in Indonesia ...................................................................... 40 Table 14: Budget outcomes and estimates ....................................................................................... 46 Table 15: Balance of Payments .......................................................................................................... 46
LIST OF BOXES Box 1: Moody’s puts Indonesian government bonds on review for ratings upgrade ..................... 5 Box 2: Allocation and spending for the Ministry of Health .............................................................. 18 Box 3: Enhancing internal control and supervision can improve quality of spending ................. 19 Box 4: A brief introduction to the Jamkesmas program .................................................................. 28
ABBREVIATIONS AND ACRONYMS APBD Anggaran Pendapatan dan Belanja Daerah
(Sub-national budget) MenPAN Kementerian Pemberdayagunaan
Aparatur Negara (State Ministry of Administrative Reforms)
APBN Anggaran Pendapatan dan Belanja Negara (State Budget)
MoF Ministry of Finance
Askes Asuransi Kesehatan mom month-on-month
BAPEPAM Capital Market and Financial Institution Supervisory Agency
MSME Micro, Small, and Medium Enterprises
BAPPENAS Badan Perencanaan Pembangunan Nasional (National Development Planning Agency)
MTEF Medium-Term Expenditure Framework
BI Bank Indonesia OECD Organization for Economic Co-operation and Development
BKPM Badan Koordinasi Penanaman Modal (Indonesia Investment Coordinating Board)
PAD Pendapatan Asli Daerah (own Source Revenue of sub-national government)
BLI Base-line Indicator PBB Performance Based Budgeting
BoP Balance of Payments PFM Public Financial Management
BLT Bantuan Langsung Tunai (cash transfer) PPP Purchasing Power Parity
BPN National Land Agency PLN Perusahaan Listrik Negara (State Electricity Company)
CDS Credit default swap PMK Peraturan Menteri Keuangan (Minister of Finance Regulation)
CPI Consumer price index PNS Pegawai Negeri Sipil (Civil Servants)
DIPA Daftar Isian Pelaksana Anggaran (Program Budget Authorization Document)
qoq quarter-on-quarter
EMBI Emerging Market Bond Index RPJM Rencana Pembangunan Jangka Menegah (Medium-Term Development Plan)
EME Emerging Market Economies RPJMN Rencana Pembangunan Jangka Menengah National (National Medium Term Development Plan)
FDI Foreign Direct Investment SBI Sertifikat Bank Indonesia (Bank of Indonesia Certificate)
FY Fiscal Year SME Small Medium Enterprise
GDP Gross Domestic Product SOE State-owned Enterprise
GoI Government of Indonesia SUNs Surat Utang Negara (government securities)
IDR Indonesian Rupiah UKP4 Unit Kerja Presiden Bidang Pengawasan dan Pengendalian Pembangunan (The Presidential Working Unit for Supervision and Management of Development)
Keppres Keputusan President (Presidential Decree) USD US dollar
JAMKESMAS Jaminan Kesehatan Masyarakat (Health Insurance Reform Scheme)
WB World Bank
M&E Monitoring and Evaluation yoy year-on-year

Executive Summary: Maximizing opportunities, managing risks
Global drivers of Indonesia’s external balance, including capital inflows, have strengthened
Key global drivers of Indonesia’s external balance, namely capital inflows and commodity prices, have strengthened. The challenge for Indonesia is to maximize the opportunities that this brings, in terms of enhancing future growth and making investments that can improve the welfare of the entire population, while managing the associated risks. Strong capital inflows, particularly portfolio, have been seen across emerging markets, including Indonesia. These inflows are driven by yield differentials and the stronger growth prospects, and improved creditworthiness, of emerging economies relative to heavily-indebted, higher-income economies. Further quantitative easing in the US has provided an additional, cyclical boost to this trend.
Commodity prices have made further gains
Global commodity prices also picked up in recent months. In November, the US dollar price of non-energy commodities rose by 3.4 percent over the month with food and raw material prices up by 4.9 percent and 7.6 percent, respectively. The underlying drivers were strong growth in demand from emerging economies, particularly China, and also supply disruptions in the agriculture sector.
Domestically, growth softened in Q3…
Annual GDP growth weakened in Q3 2010 for the first time since Q2 2009. However, at 5.8 percent year-on-year, Indonesian growth remains relatively strong compared with other countries in the region. Domestic factors played the main role in explaining the weaker Q3 growth. These included weather-related disruptions to agriculture and mining and quarrying, for example. Quarterly growth for retail trade, services, and manufacturing performance was also affected by the Ramadan period. On the expenditure side, a slight weakening in the contribution of private consumption to growth was offset by substantial gains for government consumption and investment, as well as net exports.
… but the growth forecast for 2011 remains at 6.2 percent
Due to the softer third quarter figures, the World Bank’s 2010 growth forecast has beenrevised downward by 0.1 percentage point to 5.9 percent (Table 1). Looking forward, the recent strength of investment is expected to continue. Higher frequency indicators of consumption are also supportive. In terms of external demand, the forecast for real exportgrowth for 2011 has been downgraded slightly due to base effects from the strong performance of 2010 and the downward revision to the forecast for major trading partner growth. The adverse economic impacts of the natural disasters that have hit Indonesia in recent months, such as the Mt. Merapi eruptions, are expected to be localized. Overall, the growth forecast for 2011 remains unchanged from the September IEQ at 6.2 percent. Table 1: Robust growth to continue through 2011
2009 2010 2011
Gross domestic product (Annual percent change) 4.5 5.9 6.2
Consumer price index* (Annual percent change) 2.6 6.2 6.0
Budget balance** (Percent of GDP) -1.6 -1.5 -1.8
Major trading partner growth (Annual per cent change) -0.8 6.6 4.0
Note: * Q4 on Q4 inflation rate. ** Ministry of Finance projection, 2011 figure is approved Budget. Sources: Ministry of Finance, BPS and other national statistical agencies via CEIC, Consensus Forecasts Inc., and World Bank
Movements in volatile food prices continue to affect headline inflation
Rising food prices moved headline CPI inflation up to 6.3 percent year-on-year in November, from 5.7 percent in October. Grain prices (including rice) rose by 25 percent year-on-year, the highest rate since 2006. As the poor consume a greater share of such food items in their consumption bundles, the gap between the headline inflation rate and the World Bank’s poverty basket inflation rate widened further. Core inflation remains subdued (at 4.3 percent year-on-year in November). Even though it is graduallyincreasing, it still remains well below levels seen in 2008. Reflecting the contribution of volatile items to recent inflation developments, Bank Indonesia maintained its policy rate at 6.5 percent in December.

ix
Reflecting global developments, balance of payment inflows have risen
Balance of payment inflows have been boosted by the performance of both the financial account and the trade balance. In the first three quarters of 2010, Indonesia’s financial and capital account net inflows moved well above pre-crisis average levels. Net portfolioinflows accounted for the vast majority of this trend, particularly into government securities. Foreign direct investment inflows are also on an upward trend, but remain lower than elsewhere in the region. Although net non-resident portfolio outflows were observed in November, this was mainly due to a fall in foreign holdings of Bank Indonesia certificates (SBIs), following the suspension of 3-month SBI auctions. In early December further non-resident inflows into government securities and local equities were seen.
Parliament has approved the Budget for 2011
The programs and priorities in the 2011 Budget approved by Parliament are generally in line with the proposed Budget. Much-needed capital expenditures will receive a substantial increase in allocated funds. The overall deficit was increased slightly to 1.8 percent of GDP, compared with 1.7 percent in the proposed Budget. Government revenue growth in the year-to-date has slowed since the September IEQ. In addition, as in recent years, weak disbursement was seen through the first eleven months of 2010. Although some reforms to improve budget execution have been introduced, some long-standing issues constraining timely budget disbursement still persist. Reflecting these two trends in performance over 2010 to date, the World Bank projection for the overall deficit in 2010 is 1.1 percent of GDP. This compares with the earlier Government Semester I Report projection of a deficit of 1.5 percent of GDP.
The near-term risks are mainly external, particularly relating to capital inflows
Rising capital inflows over 2010 have led to policy challenges for many emerging market economies, including Indonesia. In the short-term, Indonesia still remains vulnerable to adverse shocks to investor sentiment. Further measures to shift inflows towards longer-term flows can help to mitigate this risk, particularly policies to enhance incentives for foreign direct investment. Looking to the medium-term outlook, the main domestic risk is whether the policies required to boost growth to 7 percent are adopted and implemented. This risk provides both upside and downside potential around the baseline outlook. Coordinated action will be required to address Indonesia’s infrastructure needs, to address the investment climate-related constraints on growth, to enhance the creation of quality employment, and to ensure that the benefits of growth continue to be shared across the population.
Policies aimed at addressing vulnerability to poverty and improving access to basic services across the population can help to promote further inclusive growth going forward
Different aspects of poverty and service delivery are the focus of the medium-term policy discussion in this IEQ. Social protection programs can help limit the vulnerability of households to poverty. For example, the Government of Indonesia employed a nationwide temporary cash transfer program for poor households, Bantuan Langsung Tunai (BLT), in 2005 and 2008 to limit the impact on household welfare of upward adjustments in fuel prices as subsidies were cut. Providing financial protection from necessary health expenditures is also one of the health development goals in Indonesia. In this area, the tax-financed Jamkesmas health insurance for the poor program plays a key role, accounting for two-thirds of Indonesians with formal health insurance coverage. On access to basic infrastructure services, the Government’s National Medium-Term Development Plan, RPJMN (2010-2014), sets out an ambitious agenda for water and sanitation. National government budgets for the sector are to rise markedly and annual special allocation grants will become available to support local government investments in community-based water and sanitation systems. These are signs that positive steps are being taken to curb the recent downward trend in service levels. Housing conditions in Indonesia are also modestly improving. With ongoing urbanization, government attention on urban housing becomes increasingly important so as to ensure infrastructure provision, protect property rights and mitigate externalities such as congestion and pollution. Finally, monitoring and evaluation (M&E) information can be used to inform assessments of a government’s progress in addressing poverty through the delivery and receipt of public goods. Indonesia is shifting towards a performance-informed budgeting system, an important input to which is M&E information. Future steps in developing coordinated M&E systems will likely include greater information sharing, improving systems and building consensus on indicators, formats and coordination across agencies.


A. ECONOMIC AND FISCAL UPDATE
1. The global drivers of Indonesia’s external balance have strengthened
Global portfolio capital flows to emerging markets have surged in recent quarters
Strong growth in capital inflows has been seen across emerging markets over 2010 (Figure 1). Global flows to emerging markets, covering equity and bond issuance and bank lending, reached USD 403 billion in the first ten months of the year, albeit weakening in October. This compares with a total of USD 353 billion in 2009 as a whole. Inflows have been driven by yield differentials and the stronger growth prospects, and improved credit worthiness, of emerging economies relative to heavily-indebted higher-income economies. Further quantitative easing in the US has provided an additional cyclical boost to this trend. Policymakers throughout emerging economies are grappling with the appropriate policy response to mitigate macro and prudential concerns relating to these inflows (Part B provides a more detailed discussion of these issues).
Commodity prices have made further gains
Global commodity prices have also picked up in recent months (Figure 2). In November, non-energy commodity prices rose by 3.4 percent on the month in US dollar terms, while food prices were up 4.9 percent and raw materials up 7.6 percent. The underlying drivers are the strong growth in demand from emerging economies, particularly China, and also certain supply disruptions, particularly in the agriculture sector. Looking forward, the World Bank US dollar global commodity forecasts have been upgraded for 2010 and 2011 (with the level of the forecast for the non-energy and energy indices in 2011 upgraded by 9.8 percent and 6.7 percent respectively).
Figure 1: Rising equity and bond flows to emerging markets(capital flows to emerging markets, USD billion)
Figure 2: Global commodity prices have picked up (USD global commodity price index, index Jan 2009=100)
Source: World Bank DECPG Source: World Bank
After a strong rebound, the growth of Indonesia’s major trading partners has moderated
Following their strong rebound, growth in many of Indonesia’s major trading partners (MTP) has moderated. The weighted MTP growth reached 7-8 percent in the first half of 2010 but fell to 6 percent in Q3. This normalization of growth rates among MTPs is expected to continue.
2. The outlook for domestic growth remains robust for 2011
Growth in Q3 was slightly lower than expected
GDP growth on a year-on-year basis weakened in Q3 for the first time since Q2 2009 (Figure 3). The performance was slightly lower than expected at 5.8 percent year-on-year (yoy), or 1.2 percent quarter-on-quarter (qoq) seasonally adjusted. Growth was, however, relatively strong compared with other countries in the region. For example, Malaysia and Thailand saw quarterly contractions on a seasonally adjusted basis. While in other regional economies the performance was mainly driven by the manufacturing sector, for Indonesia, domestic temporary factors also played a role. Due to weather-related disruptions, agricultural production was particularly weak in Q3, down 0.1 percent qoq seasonally adjusted. Construction, mining and quarrying activity
0
100
200
300
400
500
0
100
200
300
400
500
2008 2009 2010 Jan-Oct
Banks Equity Bonds
80
100
120
140
160
180
80
100
120
140
160
180
Jan-09 Jul-09 Jan-10 Jul-10
Agriculture
Non-energyEnergy

I n d o n e s i a E c o n o m i c Q u a r t e r l y M a x i m i z i n g o p p o r t u n i t i e s , m a n a g i n g r i s k s
T H E W O R L D B A N K | B A N K D U N I A D e c e m b e r 2 0 1 0 2
was also dampened due to similar factors. However, in terms of contributions to quarterly growth there were also falls for retail trade, services and manufacturing (likely due to Ramadan-related factors). Communication and transport growth held up well (Figure 4).
Figure 3: Growth weakened slightly in Q3… (percentage change in real GDP)
Figure 4: …with agriculture particularly weak (contribution to quarter-on-quarter seasonally adjusted growth, percent)
Note: * Average QoQ growth between Q1 2000 and Q2 2010 Source: BPS, World Bank seasonal adjustment
Note: Contributions may not sum to overall GDP growth due to seasonal adjustment of each individual series Sources: BPS and World Bank staff calculations
Investment growth made a strong contribution on the expenditure side
On the expenditure side, on a quarterly-growth basis, a slight weakening in the contribution of private consumption was offset by substantial gains for government consumption and investment. The rise in investment spending was driven by machinery equipment investment, perhaps due to the strength of the exchange rate lowering investment prices but also expectations of sustained demand for production going forward. Net exports also contributed strongly, although this was offset by the large statistical discrepancy.
Growth of 6.2 percent is forecast for 2011, up on an expected 5.9 percent for 2010
The softer Q3 growth contributed to a small downward revision in the World Bank’s forecast for 2010 to 5.9 percent from 6.0 percent in the September IEQ (Table 2). Looking forward, monthly indicators of consumption and investment remain supportive. For instance, consumer confidence has rebounded following its downturn during the previous mid-year food price spikes. Motor vehicle sales picked up in October following the drop during Ramadan. Growth in real exports has been downgraded slightly for 2011, due to base effects from the strong performance of 2010 and the forecast revision to major trading partner growth. The downward revision for government consumption growth reflects ongoing weakness in disbursement. The real economy impact of the natural disasters which have hit Indonesia in recent months, such as the Mt. Merapi eruptions, is expected to be localized with limited impact on national GDP. The growth forecast for 2011 is unchanged at 6.2 percent. However, moving growth upwards to the RPJM-N (National Medium-Term Development Plan) targets of around 7 percent for 2013 and 2014 will require concerted policy actions over the coming year in areas such as infrastructure and investment climate.
0
2
4
6
8
0
1
2
3
4
Sep-03 Jun-05 Mar-07 Dec-08 Sep-10
Percent Percent
QoQ seas. adjust (LHS)
Year on year (RHS)
Average (LHS)*
-1
0
1
2
-1
0
1
2
Sep-07 Mar-08 Sep-08 Mar-09 Sep-09 Mar-10 Sep-10
Agriculture Mining and constructionManufacturing Com & transRetail trade Other (incl services)GDP*
PercentPercent

I n d o n e s i a E c o n o m i c Q u a r t e r l y M a x i m i z i n g o p p o r t u n i t i e s , m a n a g i n g r i s k s
T H E W O R L D B A N K | B A N K D U N I A D e c e m b e r 2 0 1 0 3
Table 2: Aggregate GDP projections for 2010 and 2011 are broadly unchanged (percentage change, unless otherwise indicated)
Note: Projected trade flows relate to the national accounts, which may overstate the true movement in trade volumes and understate the movement in prices due to differences in price series. Source: MoF, BPS, BI, CEIC and World Bank projections
3. On the back of global developments, balance of payments inflows rose further
Both the trade balance and financial accounts contributed to rising balance of payments inflows
The overall balance of payments surplus for the first three quarters of 2010 of USD 19 billion exceeded the highest annual inflow previously recorded (USD 14.5 billion in 2006). Reserves have risen to USD 93 billion at the end of November. Both the financial and current balances posted strong performance in Q3. On the current account, the trade balance surplus has rebounded strongly from the temporary small deficit of July. In October the balance reached USD 2.1 billion, after a USD 2.6 billion surplus in September. Agricultural exports have picked up strongly, contrasting with the weak performance of agricultural GDP (Figure 5). This reflects the larger share of food crops in agricultural GDP (just under 80 percent for the first three quarters of 2010). Non-food crops, such as vegetable oils, account for most of agricultural exports (67 percent over the same period) and have benefited from rising global commodity prices. Manufacturing export growth faltered in September (although this might reflect Ramadan-related effects). On the import side, capital and intermediate goods continue to be the main drivers of growth, in line with buoyant investment.
2009 2010 2011 2009 2010 2011 2010 2011
1. Main economic indicators
Total Consumption expenditure 6.2 4.4 5.5 5.9 7.0 3.6 -0.8 0.1
Private consumption expenditure 4.9 5.0 5.1 4.0 5.7 4.3 -0.3 -0.2
Government consumption 15.7 1.2 8.6 17.0 13.4 0.4 -4.3 2.2
Gross f ixed capital formation 3.3 8.6 10.0 4.2 9.7 9.6 0.3 0.8
Exports of goods and services -9.7 12.5 10.3 3.7 5.8 11.6 1.0 -0.7
Imports of goods and services -15.0 13.4 10.3 1.6 3.9 13.5 -1.6 -1.3
Gross Domestic Product 4.5 5.9 6.2 5.4 5.8 6.5 -0.1 0.0
Agriculture 4.1 2.3 3.5 4.6 1.0 4.3 -1.2 0.4
Industry 3.5 4.3 5.0 5.1 4.3 5.0 0.0 -0.3
Services 5.7 8.4 8.0 5.9 8.4 8.4 0.2 0.1
2. External indicators
Balance of payments (USD bn) 12.5 23.5 11.2 n/a n/a n/a 4.5 2.4
Current account balance (USD bn) 10.5 6.9 -1.9 n/a n/a n/a 5.1 -0.7
Trade balance (USD bn) 21.0 20.6 10.9 n/a n/a n/a 6.7 0.4
Financial account balance (USD bn) 3.6 18.3 12.8 n/a n/a n/a 1.9 3.1
3. Other economic measures
Consumer price index 4.8 5.1 6.3 2.6 6.2 6.0 0.0 -0.1
Poverty basket Index 5.8 8.4 8.5 2.9 11.1 6.8 0.6 1.1
GDP Deflator 8.5 7.4 10.0 6.6 8.0 9.9 -1.3 -2.2
Nominal GDP 13.4 13.7 16.9 12 14.2 17.1 -1.6 -2.3
4. Economic assumptions
Exchange rate (IDR/USD) 10356 9080 9000 9475 9000 9000 -11.1 0.0
Interest rate (SBI, 1 month) 7.3 6.4 6.5 6.5 6.5 6.5 0.0 0.0
Indonesian crude price (USD/bl) 61.6 76.6 75.3 75.1 75.3 75.3 -0.8 -1.7
Major trading partner grow th -0.8 6.6 4.0 3.4 5.6 4.9 0.1 -0.3
Annual Year to December quarter Revision to Annual

I n d o n e s i a E c o n o m i c Q u a r t e r l y M a x i m i z i n g o p p o r t u n i t i e s , m a n a g i n g r i s k s
T H E W O R L D B A N K | B A N K D U N I A D e c e m b e r 2 0 1 0 4
Financial account inflows were boosted by strong portfolio flows, and rising FDI
The strength of Indonesia’s financial account over 2010 should be viewed in the context of global flows towards emerging markets discussed above. Pull factors are also at play. These factors include Indonesia’s strong economic growth, macro policy management and rising domestic demand. As a result, financial account inflows moved higher in Q3, and the numbers for Q1 and Q2 were also revised upwards. Portfolio flows accounted for the largest share of net financial inflows, and within them purchases of longer-term government securities (USD 5.9 billion of a total USD 12.4 billion of net portfolio inflows in the first three quarters of 2010). However, FDI also appears to be on an upward trend (although it is difficult to strip out from the balance of payments data the contribution of new investment from that of reinvested earnings).
Figure 5: Agricultural exports have picked up (USD billion, 3 month moving average)
Table 3: Record balance of payments inflows expected for 2010(USD billion)
Source: BPS and World Bank staff calculations Sources: BI and World Bank staff projections
The overall balance of payment forecasts have been upgraded for 2010 and 2011
Forecasting Indonesia’s balance of payments in the current global environment is a difficult task. Projections are sensitive to the global outlook for commodity prices and investment sentiment towards emerging markets. However, continuing net capital inflows during the second half of 2010 are expected to support an annual balance of payments surplus in excess of the historic high of USD 14.5 billion in 2006 (Table 3). On the current account, the trend of higher import growth relative to that of exports, reflecting the relativestrength of domestic demand, is expected to lead a gradual move of the current account from surplus to deficit. Higher bond amortizations will also contribute to the contraction in the overall inflows in 2011. The regular fluctuations in public debt issuances and loans drawings and repayments will continue to create volatility in the quarterly balance of payments. In addition to forecasting difficulties due to international factors, statistical features also complicate the picture. In particular, since Q1 2009 there has been a widening divergence between the national accounts trade data, which is the basis of the World Bank trade forecasts, and the balance of payments trade data. The difference is largely related to the valuation of imports of goods; goods imports under the balance of payments were USD 9.1 billion higher over Q1 to Q3 2010 than under the national accounts.
4. Domestic financial markets have been boosted by the capital inflows
The surge in capital inflows has prompted a range of policy proposals to address concerns over vulnerability to outflows and the impact of further
The surge in capital inflows over 2010 has prompted a wide-ranging policy debate within emerging economies. The appropriate response depends on the nature of the flows, country circumstances and the extent of various macroeconomic and prudential concerns and vulnerabilities to a reversal of flows. These issues are discussed in more detail in Part B.
2007 2008 2009 2010 2011
Balance of Payments 12.7 -1.9 12.5 23.5 11.2
Current Account 10.5 0.1 10.7 6.9 -1.9
Trade Balance 20.9 9.9 21.0 20.6 10.9Income Balance -15.5 -15.2 -15.1 -18.6 -18.1Transfers Balance 5.1 5.4 4.9 4.9 5.4
Capital & Financial Accounts 3.6 -1.8 3.5 18.4 13.1
Capital Account 0.5 0.3 0.1 0.1 0.3
Financial Account 3.0 -2.1 3.5 18.3 12.8Direct Investment 2.3 3.4 1.9 7.9 5.4Portfolio Investment 5.6 1.8 10.3 15.9 14.3Other Investment -4.8 -7.3 -8.8 -5.5 -6.8
Foreign Reserves (a) 56.9 51.6 66.1 92.8(a) 2010 value ref lects value at end of November

I n d o n e s i a E c o n o m i c Q u a r t e r l y M a x i m i z i n g o p p o r t u n i t i e s , m a n a g i n g r i s k s
T H E W O R L D B A N K | B A N K D U N I A D e c e m b e r 2 0 1 0 5
exchange rate appreciation
Over the course of 2010, Bank Indonesia (BI) has been pursuing a range of prudential regulatory policy measures to shift flows towards less volatile short-term funds.1 In June a 1-month minimum holding period for BI certificates (SBIs) was announced, applying to both resident and non-resident investors. The 1-month and more recently 3-month auctions of these certificates, which tend to be held by shorter-term investors, have also been suspended. In December BI’s monetary policy decision indicated that it is preparing further measures to “mitigate the negative impact of capital inflows as well as to strengthen banking system resilience”. These relate in part to the regulation on foreign currency statutory reserves and vostro accounts (rupiah demand deposit accounts held by non-residents in domestic banks).
The trend in portfolio capital inflows was however reversed in November, although initial data for December suggest a continuation of inflows. Non-resident investor portfolio outflows of around IDR 18 trillion were seen in November, about 80 percent of which were due to a decline in holdings of Bank Indonesia certificates (SBIs). This followed the suspension in mid November of 3-month SBI sales. In addition these outflows were seen during increased international financial market concern over the Irish debt crisis. Data for December-to-date indicate a return to net portfolio inflows and a rise in non-resident holdings of government securities.
Domestic bond and equity prices have benefited from the capital inflows…
Looking over the course of 2010, equities and bond prices continue to reach record highs.The Jakarta composite equity index has gained 40 percent since the start of 2010, compared with a 5.6 percent rise in the local currency MSCI World index, and is up 190 percent on the lows of March 2009. Local currency sovereign yields are at their lowestlevels ever. One-, five- and ten-year yields are down approximately 180 to 230 basis points over the year-to-date. The spread of Indonesian USD sovereign bonds over US treasuries has returned to pre-crisis 2007 lows, under 200 basis points, and over 100basis points below the global Emerging Market Bond Index spread. In addition to improvements in market indicators of creditworthiness, Moody’s rating agency announced that it was putting Indonesia’s sovereign rating on upgrade watch (Box 1). Box 1: Moody’s puts Indonesian government bonds on review for ratings upgrade On December 1, 2010 Moody’s put Indonesia’s foreign and local currency government bonds on review for a possible ratings upgrade, which would move them from Ba2 to investment grade. Previously in June this year, Moody’s had shifted the outlook for Indonesia’s sovereign rating from stable to positive. Indeed, market indicators currently put Indonesia’s creditworthiness at comparable, or higher, levels than other investment grade sovereigns (Table 4). The main reasons cited for Moody’s December decision included Indonesia’s resilience to the global financial crisis and continued strong macroeconomic fundamentals, the steady improvement in the government’s debt position, and the increase in foreign currency reserves that could provide a cushion against balance of payments shocks.
Table 4: Indonesia’s CDS spreads are well below several investment-grade sovereigns…
CDS spreads (Nov 30 2010)
Ratings
Moody's S&P
Indonesia 147 Ba2 BB
Thailand 105 Baa1 BBB+
Malaysia 85 A3 A-
Korea 110 A1 A
Greece 973 Ba1 BB+
Portugal 532 A1 A-
Ireland 608 Aa2 A
Spain 343 Aa1 AA
Brazil 119 Baa3 BBB-
Belgium 183 Aa1 AA+
Italy 244 Aa2 A+
Sources: Thomson Financial Datastream, Moody’s and S&P Note: 5-year US dollar sovereign CDS spreads
1 For more details on Bank Indonesia’s policy responses see Nanang Hendarsah (2010), ‘Challenges and Policy Options in Managing Portfolio Investment Flows: Bank Indonesia’s Recent Experiences’, Directorate of Economic Research and Policy, Bank Indonesia, November.
I n d o n e s i a E c o n o m i c Q u a r t e r l y M a x i m i z i n g o p p o r t u n i t i e s , m a n a g i n g r i s k s
T H E W O R L D B A N K | B A N K D U N I A D e c e m b e r 2 0 1 0 6
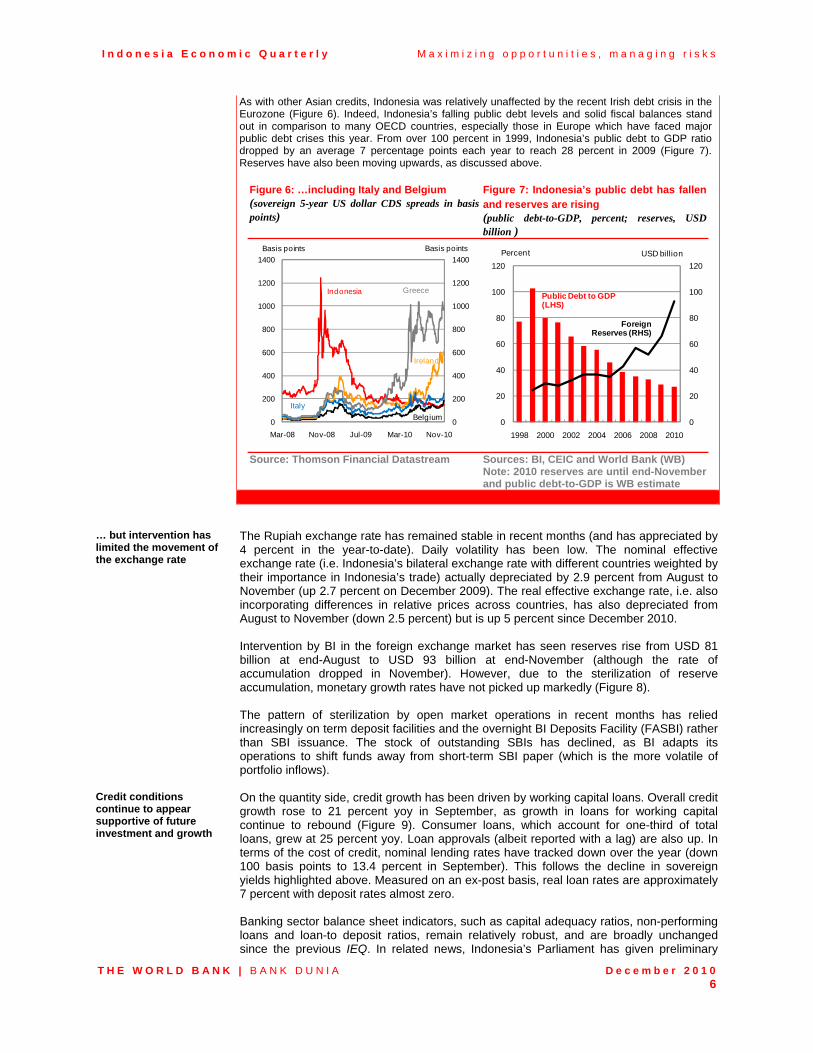
As with other Asian credits, Indonesia was relatively unaffected by the recent Irish debt crisis in the Eurozone (Figure 6). Indeed, Indonesia’s falling public debt levels and solid fiscal balances stand out in comparison to many OECD countries, especially those in Europe which have faced major public debt crises this year. From over 100 percent in 1999, Indonesia’s public debt to GDP ratio dropped by an average 7 percentage points each year to reach 28 percent in 2009 (Figure 7). Reserves have also been moving upwards, as discussed above.
Figure 6: …including Italy and Belgium (sovereign 5-year US dollar CDS spreads in basis points)
Figure 7: Indonesia’s public debt has fallen and reserves are rising (public debt-to-GDP, percent; reserves, USD billion )
Source: Thomson Financial Datastream
Sources: BI, CEIC and World Bank (WB) Note: 2010 reserves are until end-November and public debt-to-GDP is WB estimate
… but intervention has limited the movement of the exchange rate
The Rupiah exchange rate has remained stable in recent months (and has appreciated by 4 percent in the year-to-date). Daily volatility has been low. The nominal effective exchange rate (i.e. Indonesia’s bilateral exchange rate with different countries weighted by their importance in Indonesia’s trade) actually depreciated by 2.9 percent from August to November (up 2.7 percent on December 2009). The real effective exchange rate, i.e. also incorporating differences in relative prices across countries, has also depreciated from August to November (down 2.5 percent) but is up 5 percent since December 2010. Intervention by BI in the foreign exchange market has seen reserves rise from USD 81 billion at end-August to USD 93 billion at end-November (although the rate of accumulation dropped in November). However, due to the sterilization of reserve accumulation, monetary growth rates have not picked up markedly (Figure 8). The pattern of sterilization by open market operations in recent months has relied increasingly on term deposit facilities and the overnight BI Deposits Facility (FASBI) rather than SBI issuance. The stock of outstanding SBIs has declined, as BI adapts its operations to shift funds away from short-term SBI paper (which is the more volatile of portfolio inflows).
Credit conditions continue to appear supportive of future investment and growth
On the quantity side, credit growth has been driven by working capital loans. Overall credit growth rose to 21 percent yoy in September, as growth in loans for working capital continue to rebound (Figure 9). Consumer loans, which account for one-third of total loans, grew at 25 percent yoy. Loan approvals (albeit reported with a lag) are also up. In terms of the cost of credit, nominal lending rates have tracked down over the year (down 100 basis points to 13.4 percent in September). This follows the decline in sovereign yields highlighted above. Measured on an ex-post basis, real loan rates are approximately7 percent with deposit rates almost zero. Banking sector balance sheet indicators, such as capital adequacy ratios, non-performing loans and loan-to deposit ratios, remain relatively robust, and are broadly unchanged since the previous IEQ. In related news, Indonesia’s Parliament has given preliminary
0
200
400
600
800
1000
1200
1400
0
200
400
600
800
1000
1200
1400
Mar-08 Nov-08 Jul-09 Mar-10 Nov-10
Basis points Basis points
Indonesia Greece
Belgium
Ireland
Italy
0
20
40
60
80
100
120
0
20
40
60
80
100
120
1998 2000 2002 2004 2006 2008 2010
Public Debt to GDP (LHS)
Foreign Reserves (RHS)
Percent USD billion

I n d o n e s i a E c o n o m i c Q u a r t e r l y M a x i m i z i n g o p p o r t u n i t i e s , m a n a g i n g r i s k s
T H E W O R L D B A N K | B A N K D U N I A D e c e m b e r 2 0 1 0 7
approval for the creation of a new financial regulator, which will be responsible for monitoring banks, brokers and fund management companies and will take over regulatory functions currently residing with Bank Indonesia and Bapepam (the Capital Market and Financial Institution Supervisory Agency).
Figure 8: Sterilization of reserve accumulation continues (base money and open market operations, OMOs, outstanding IDR trillion; reserves, USD billion)
Figure 9: Credit growth has been driven by working capital loans (M1 and M2 growth in year-on-year percentage change)
Source: BI, CEIC and World Bank Source: BI, CEIC and World Bank
5. Food price shocks again dominate recent movements in inflation
Movements in volatile food prices continue to drive headline inflation
Weather-related disruptions to food prices lifted headline CPI inflation to 6.3 percent yoy in November, up from 5.7 percent in October (Figure 10). In particular, grain prices (which include rice) were up 25 percent yoy, the highest rate since the food crisis in 2006. These price increases hit the poor disproportionately given the weight of such food items in their consumption bundles. The wedge between the World Bank’s poverty basket inflation, which puts greater weight on such food items, and overall CPI inflation has increased above 5 percentage points – the largest gap since the series began in 2002. Domestic rice prices remain around 50 percent higher than the comparable international rice prices (see Box 1 in the September IEQ for further analysis). The Government also announced a series of purchases of rice on the international market to build stocks at the State Procurement Agency (BULOG).
Core inflation, although ticking up gradually, remains relatively subdued
Core inflation remains subdued (at 4.3 percent yoy in November). While gradually increasing, it still remains well below levels seen, for example, in 2008. Reflecting the contribution of volatile items (Figure 11), such as food prices, to recent inflation numbers, and judging core inflation numbers to be manageable, BI maintained its policy rate at 6.5 percent in December.
The divergence between CPI and GDP deflator inflation is narrowing
The growth in economy-wide prices, as measured by the GDP deflator, is converging towards that of the CPI. As highlighted below, this has implications for comparing World Bank and the Government’s fiscal balance projections as the two indices form the different price bases for tax revenue forecasts. In Q3, GDP deflator growth was 7.1 percent yoy, which is only 0.9 percentage points above quarterly CPI inflation. Falling investment and construction price inflation have played a role in this convergence (just as their rise contributed to the gap between the two inflation rates reaching 10 percentage points in Q2 2008).
0
20
40
60
80
100
0
100
200
300
400
500
Jan-08 Dec-08 Nov-09 Oct-10
M0 Base Money (LHS)
Total Reserves (RHS)
Total stock of OMOs to reduce net domestic assets (LHS)
IDR trillion USD billion
0
3
6
9
12
15
18
-10
0
10
20
30
40
50
Jan-07 Mar-08 Jun-09 Sep-10
Investment LoanGrowth (LHS)
Working Capital Loan Growth (LHS)
Percent YOY
Consumer LoanGrowth (LHS)
Lending Rate (RHS)
Percent
Total Loan Growth (LHS)

I n d o n e s i a E c o n o m i c Q u a r t e r l y M a x i m i z i n g o p p o r t u n i t i e s , m a n a g i n g r i s k s
T H E W O R L D B A N K | B A N K D U N I A D e c e m b e r 2 0 1 0 8
Figure 10: Inflation has risen over the year but remains below historic averages (year-on-year percentage change)
Figure 11: Core inflation has increased only steadily while volatile prices (mainly food) have driven headline inflation (contributions to monthly inflation)
Sources: BPS and World Bank Sources: BPS and World Bank
Looking forward there is a balance of upside and downside pressures, both domestic and external, on inflation
The forecast for average inflation in 2010 remains unchanged at 5.1 percent. The forecast for inflation in Q4 has been revised down slightly to 6.2 percent yoy from 6.4 percent, due to the weaker forecast for Q4 GDP growth. The upward revisions to poverty basket inflation forecast reflect the recent supply shocks to food prices and rising global commodity prices. For 2011, upside pressures to prices come from global commodities and potential further supply shocks to food prices. However, neither inflation expectations nor core inflation have picked up markedly in recent months. Major trading partner growth has been revised downwards. Inflation in 2011 Q4 is projected at 6.0 percent yoy. These forecasts do not incorporate any assumed adjustments in administered prices or subsidies in 2011. The outlook for GDP deflator growth has also been downgraded slightly for 2010 and 2011 in line with recent trends. This feeds into a downward revision for nominal GDP, which is key to the fiscal forecasts on the revenue side.
6. Weakness in fiscal expenditures continues and tax revenue growth has slowed
Tax revenue growth in 2010 has slowed
Government revenue growth has slowed since the September IEQ, due to both income tax and VAT performance. Total central government revenues in the first eleven months of 2010 were 18 per cent above the equivalent period in 2009. In contrast, revenues in the first eight months, i.e. at the time that the September IEQ projection was made, were 21 per cent up on the previous year. Both economic activity and policy measures play a role in explaining this trend. First, the growth in nominal economic activity was lower than previously expected. This has lowered 2010 projections for both tax and oil and gas non-tax revenues (with the latter also down on a slightly lower oil price projection). Second, the reduction of the corporate income tax rate in 2010, from 28 percent in 2009 to 25 percent in 2010, may also explain some of the weakness. Policy changes will also affect tax growth in 2011. For example, duties on land and building transfer will no longer be recognized as central government revenue but as regional government revenue. Similarly, from 2011 land and building tax revenues are planned to be progressively devolved from the central government, before they are completely phased out by 2014.
Weak disbursement rates remain an issue, although measures to improve budget execution have been introduced
As in previous years, weak disbursement has also been seen through the first eleven months of 2010. As of end-November, total disbursement was only 73 percent of the revised Budget, below the levels of 76 percent in 2009 and 83 percent in 2008. This was driven mainly by low expenditures on items under capital and others categories, but also on materials and interest payments. As a result, the World Bank’s expenditure projections
0
6
12
18
24
0
6
12
18
24
Nov-07 May-08 Nov-08 May-09 Nov-09 May-10 Nov-10
Poverty Basket Inflation
HeadlineInflation
Food inflation
Per cent Per cent
-0.6
0.0
0.6
1.2
1.8
-0.6
0.0
0.6
1.2
1.8
Nov-08 May-09 Nov-09 May-10 Nov-10
VolatileAdministeredCoreHeadline Inflation
Per cent Per cent

I n d o n e s i a E c o n o m i c Q u a r t e r l y M a x i m i z i n g o p p o r t u n i t i e s , m a n a g i n g r i s k s
T H E W O R L D B A N K | B A N K D U N I A D e c e m b e r 2 0 1 0 9
for 2010 have been revised down slightly. Even though reforms to improve budget execution have been introduced, some long-standing issues constraining timely budget disbursement still persist. Part B examines in more detail recent trends in disbursement rates, their potential impact on the efficiency of public expenditures and associated policy reforms.
The fiscal deficit in 2010 is forecast to be lower than projected in the approved Budget
In light of these trends, the deficit in 2010 is likely to be well below the revised Budget projection of 2.1 percent of GDP or IDR 134 trillion. The Government’s Semester I Reportalready revised down the fiscal deficit projection to 1.5 per cent of GDP or IDR 95.1 trillion. As of November, the government balance for 2010 to date was still running a surplus of IDR 16 trillion. Although, as mentioned above, expenditures are back-loaded into the final months of the year, the performance-to-date contributes to a World Bank projection of a deficit of IDR 69.1 trillion or 1.1 percent of GDP in 2010 (Table 5). This is up by IDR 9.9 trillion (0.2 percentage points of GDP) on the September IEQ projection. The main driver of the difference between the Government and World Bank fiscal projections is the different price indices used for forecasting nominal GDP and hence tax revenues (see June 2010 IEQ for more details). The Government uses the CPI, while the World Bank uses the GDP deflator to reflect the economy-wide base for tax revenues. As growth in the two price indices moves closer together, the divergence in revenue forecastsis likely to be narrowed.
The 2011 Budget was approved in late October
The programs and priorities in the 2011 Budget approved by Parliament are generally in line with the proposed budget. Overall spending increased by 2.3 percent compared with the proposed budget, up 6.7 percent on the 2010 Budget. The assumptions for growth and the strength of the nominal exchange rate against the USD were adjusted upwards slightly. The deficit was increased to 1.8 percent of GDP, compared to 1.7 percent in the proposed Budget. The 2011 Budget involves a substantial increase in the allocation of funds to capital expenditures (up almost 30 percent on the 2010 Revised Budget). On subsidies, the proposal to increase electricity tariffs by 15 percent was dropped by Parliament. Instead, Parliament suggested the Government improve the efficiency of PLN’s (the state electricity company) operation. The Government has recently indicated that it is proposing to limit the use of subsidized gasoline by private vehicles starting in January 2011. In other related news on subsidies, the Ministry of Agriculture is conducting a trial for direct fertilizer subsidies to farmers rather than to fertilizer producers.
Capital inflows are supportive of the Government’s financing position going forward
The fiscal financing position in 2010 has been aided by strong demand from non-resident investors for government securities (SUNs). Net financing in the year to end-November reached IDR 78 trillion with net domestic bond sales contributing IDR 93.5 trillion to this total (and negative net foreign financing to date). The 2011 Budget projects net financing from domestic sources of IDR 125.3 trillion (covering almost all of the IDR 124.7 trillion total net financing required for the projected deficit). Again, domestic net bond sales contribute the main share at IDR 121.6 trillion. A continuation of strong non-resident portfolio demand for SUNs into early 2011 is supportive of the financing position for the year.

I n d o n e s i a E c o n o m i c Q u a r t e r l y M a x i m i z i n g o p p o r t u n i t i e s , m a n a g i n g r i s k s
T H E W O R L D B A N K | B A N K D U N I A D e c e m b e r 2 0 1 0 10
Table 5: The approved 2011 Budget projects a higher deficit than currently projected for 2010 (IDR trillion, unless otherwise indicated)
Note: World Bank revenue forecasts are based on a different methodology to the Government to derive projections for nominal GDP (see Part C of the June 2010 IEQ for a full discussion Source: MoF and World Bank projections
7. Near-term risks are predominantly external, but domestic policies will determine the medium-term growth trajectory
Near-term risks are mainly external, particularly relating to capital inflows
The global drivers of Indonesia’s external position bring both risks and opportunities. The outlook for the drivers of global liquidity and commodity prices, which have recently boosted Indonesia’s external balance, remain susceptible to sudden dislocations. Recent commodity price rises have (For further discussion of the impact of commodity priceshocks to Indonesia’s fiscal position, prices and exports see Part B of the June 2010 IEQ). In relation to capital flows a strong upward revision to the US recovery trajectory, and the consequent adjustment in the QE2 (quantitative easing) policy, could cause a temporary shock to flows to emerging market economies (EMEs). Furthermore, the policy response to exchange rate pressures and capital flows amongst emerging economies is not well coordinated. This can lead to the potential for regulatory arbitrage, with “hot-money” investors switching focus as countries adopt different regulations and policies towards such flows. Set against this, structural factors, such as rebuilding of corporate and household balance sheets in the G7 and high savings in China, combined with the adjustment of relative risk of EMEs versus highly indebted high income economies, point to continuing liquidity flows to EMEs.
2009 2010 2010 (p) 2010 (p) 2011 (p)
ActualRevised Budget
Semester 1 report
WB estimates
Budget
A. State revenues and grants 848.8 992.4 994.7 968.4 1,104.91. Tax revenues 619.9 743.3 738.9 708.9 850.3
o/w natural resources 317.6 362.2 360.9 349.4 420.5 - Oil and gas 50.0 55.4 55.3 52.2 55.6 - Non oil and gas 267.5 306.8 305.6 297.2 364.9
2. Non tax revenues 227.2 247.2 253.9 257.5 250.9o/w natural resources 139.0 164.7 164.7 157.3 163.1
- Oil and gas 125.8 151.7 151.5 141.2 149.3- Non oil and gas 12.8 13.0 13.2 16.2 13.8
B. Expenditure 937.4 1,126.1 1,089.8 1,037.5 1,229.61. Central government 628.8 781.5 742.4 694.6 836.62. Transfers to the regions 308.6 344.6 347.4 342.9 393.0
C. Primary balance 5.2 -28.1 5.7 26.0 -9.4
D. SURPLUS / DEFICIT (88.6) (133.7) (95.1) (69.1) (124.7)Deficit (per cent of GDP) (1.6) (2.1) (1.5) (1.1) (1.8)
Economic assumptions/outcomesGross domestic product (GDP) 5,613 6,254 6,254 6,385 7,020Economic growth (per cent) 4.5 5.8 5.8 5.9 6.4CPI (per cent) 2.8 5.3 5.3 5.1 5.3Exchange rate (IDR/USD) 10,408 9,200 9,200 9,080 9,250Interest rate of SBI (average %) 6.6 6.5 6.5 6.4 6.5Crude oil price (USD/barrel) 61.5 80.0 80.0 76.6 80.0Oil production ('000 barrels/day) 950 965 965 965 970

I n d o n e s i a E c o n o m i c Q u a r t e r l y M a x i m i z i n g o p p o r t u n i t i e s , m a n a g i n g r i s k s
T H E W O R L D B A N K | B A N K D U N I A D e c e m b e r 2 0 1 0 11
In the short-term, Indonesia still remains vulnerable to adverse shocks to investor sentiment. For instance, the Indonesian economy experienced capital flight in May 2010. Market contacts suggest that this vulnerability is diminished for non-resident investors in longer-term government securities. Nevertheless, policies to enhance the incentives for FDI investments can help not only to shift flows towards more stable investments but also to help finance the needed boost in investment in Indonesia is to meet is growth targets.
Domestic risks mainly concern the medium-term policy challenges required to boost growth to an even higher trajectory
Domestically, in the near-term, while the recent uptick in core inflation has been limited, there is the potential upside risk of further food price shocks feeding into core inflation via second round effects and their impact on inflation expectations. On the fiscal side, for 2011 a primary risk remains the timely disbursement of funds, particularly on capital infrastructure projects. For the medium-term outlook, the main challenge is whether the policies required to boost growth to the 7 percent plus growth rates that are possible are adopted and implemented. This risk provides both upside and downside potential around the baseline outlook. In particular, coordinated action will be required to address Indonesia’s infrastructure needs, to address the investment climate constraints on growth, to enhance the creation of quality employment, and to ensure that the benefits of this growth are shared across the population.

I n d o n e s i a E c o n o m i c Q u a r t e r l y M a x i m i z i n g o p p o r t u n i t i e s , m a n a g i n g r i s k s
T H E W O R L D B A N K | B A N K D U N I A D e c e m b e r 2 0 1 0 12
B. SOME RECENT DEVELOPMENTS IN INDONESIA’S ECONOMY
1. Managing capital inflows: Policy options for Indonesia
a. Capital inflows have been on the rise in Indonesia this year, bringing benefits but also risks that necessitate an appropriate policy response
Monetary stimulus in OECD countries together with high yields and strong economic growth in emerging economies will likely sustain capital inflows in the near and medium-term, bringing both benefits and risks to receiving countries
The question of how best to manage growing capital inflows has become an increasingly pressing policy issue over the past 18 months in Indonesia and other emerging markets. Strong economic growth and macroeconomic fundamentals in emerging economies,together with relatively high yields, are drawing in capital from advanced economies where growth remains weak and yields low. In the near-term, the second round of quantitative easing starting in the US provides further support for global liquidity and inflows to emerging markets, such as Indonesia, are likely to continue. In the medium-term, even after monetary stimulus is gradually withdrawn in OECD countries, growth differentials are likely to endure as will the secular rebalancing of real money portfolios towards emerging economies, supporting the outlook for inflows. While capital inflows can significantly reduce the cost of borrowing and increase the availability of financing in receiving countries, large and volatile flows can also raise macroeconomic and prudential concerns and heighten the risk of future disruptive outflows. The balance of these risks and benefits depends crucially on the composition of flows, in particular longer-term foreign direct investment (FDI) versus shorter-term portfolio flows, and the appropriateness of the policy response. The following sections outline the composition of recent capital inflows into Indonesia, associated risks, and potential medium-term and short-term policy responses.
Indonesia has seen net inflows far exceed pre-crisis levels this year, dominated by portfolio flows but also rising FDI
In the first three quarters of 2010, Indonesia’s financial and capital account net inflows rose to USD 15.7 billion, moving well above pre-crisis average levels. Net portfolio inflows of USD 13.3 billion accounted for the vast majority of inflows, followed by net FDI inflows of USD 6.8 billion. By comparison, net portfolio inflows in all of 2007 amounted to USD 7 billion, and to USD 4 billion on average from 2004-2006. Other, mainly banking flows, showed a net outflow of USD 4.4 billion (Figure 12). Within portfolio flows, foreign purchases of local currency government bonds (SUNs) comprised 73 percent of the net inflows in the year-to-November, with net purchases of short-term money market instruments (SBIs) and equities contributing 12 percent and 15percent, respectively (Figure 13). In November, there was some adjustment relative to trend, with net non-resident portfolio outflows, mostly of SBIs. The 3-month SBI auction was suspended during the month and international financial market concerns over the Eurozone debt crisis mounted. The latest data for December indicates inflows returning into government securities and portfolio equities. While net FDI inflows this year have also topped 2007 and 2008 full year totals (USD 2.2 billion and USD 3.4 billion, respectively), they remain lower in absolute, and relative to GDP, than for many regional peers. Portfolio inflows are still the dominant driving force of the financial and capital account surplus. Given the expected narrowing of the current account next year, this heavy reliance of external financing on portfolio inflows, rather than longer-term FDI, remains a source of macroeconomic vulnerability.
Net inflows to GDP in Indonesia are not exceptional, but inflows to reserves are relatively high
Although net inflows to GDP are in the range of historical patterns (albeit rising) and do not stand out versus comparators, Indonesia’s net portfolio inflows to reserves are relatively high (at 16 percent year-to-date compared with 3-4 percent in Thailand and Brazil). The level of foreign reserves deserves particular attention in Indonesia since non-residents own a relatively high share of financial assets, and therefore reserves could playa critical stabilizing role if there were a sudden sell off and large-scale outflows.

I n d o n e s i a E c o n o m i c Q u a r t e r l y M a x i m i z i n g o p p o r t u n i t i e s , m a n a g i n g r i s k s
T H E W O R L D B A N K | B A N K D U N I A D e c e m b e r 2 0 1 0 13
Figure 12: The rise in net portfolio inflows has dominated the financial account since 2009… (net financial account flows, in USD billion)
Figure 13: …with a majority of non-resident portfolio inflows going into domestic government securities (SUNs) (non-resident investor net purchases of equities, SUNs and SBIs in IDR trillion; reserves in USD billion)
Sources: BI Sources: CEIC, BI and MoF
b. Rising portfolio inflows raise macroeconomic and prudential concerns and heighten the risk of disruptive outflows
Currency appreciation as a consequence of capital inflows can impact competitiveness and export performance
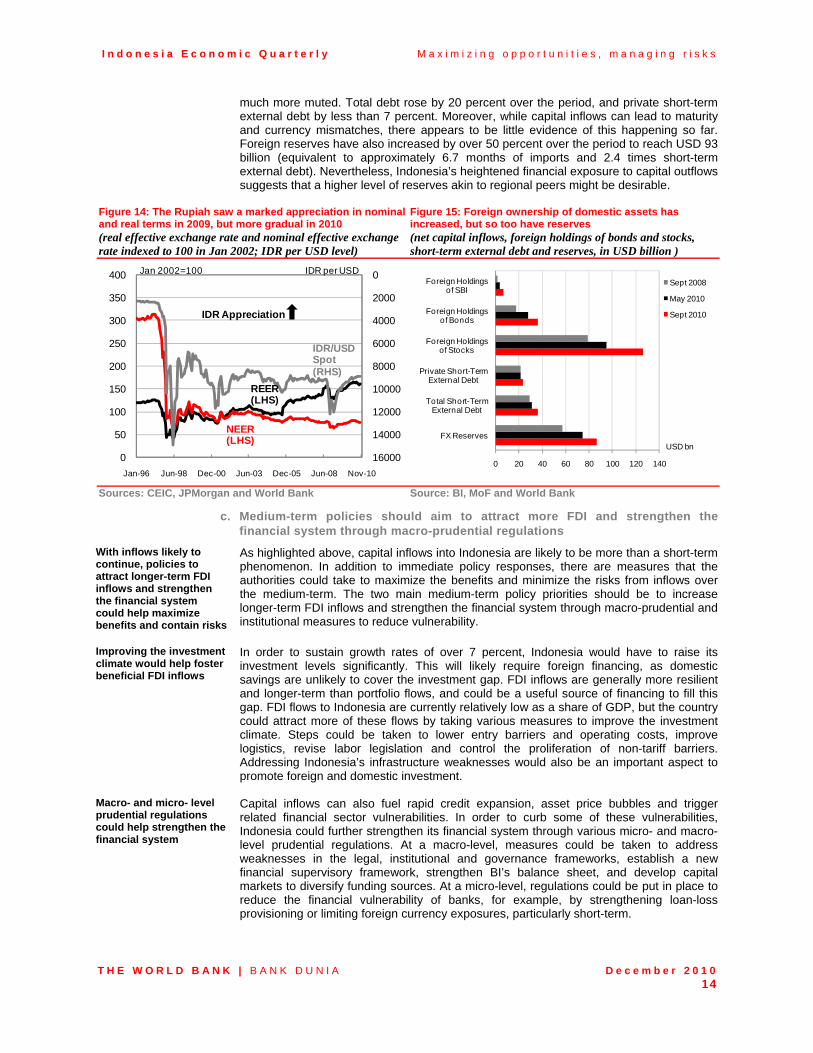
A key macroeconomic policy challenge presented by large capital inflows is the potential appreciation of the exchange rate. As non-resident investors are buying local assets, this puts upward pressure on the local currency. To the degree that appreciation has a deleterious effect on exports and competitiveness, it can be damaging for certain sectors of the economy. The Rupiah has seen a 24 percent appreciation in nominal and real terms since March 2009. From January to November 2010, the currency has strengthened by 2 percent in real terms and 4 percent nominally (Figure 14).
Inflows have also helped drive up prices in the equity and fixed income markets, reducing the Government’s cost of borrowing on the one hand, but making the system more vulnerable to a sudden reversal of flows due to high foreign ownership on the other
Capital inflows can also contribute to asset price bubbles and greater volatility in financial markets. In Indonesia, although property prices do not appear to have risen much since early 2009, equity and fixed income prices have. Local equities are up over 40 percent year-to-date or 190 percent since March 2009. Local currency government bond yields are at historic lows, with 10 year yields dropping by 280 basis points since January (from 9.9 to 7.1 percent) and 5 years falling by 230 basis points (from 8.8 to 6.5 percent). The small size of domestic capital markets means that this is unlikely to have much of an impact on the wider economy, for example, in terms of wealth effects on consumption. While the drop in yields represents a big reduction in the government’s cost of borrowing, the high proportion of foreign ownership of government securities and equities makes the system more vulnerable to a sudden reversal of flows. At end-September 2010, non-residents owned 67 percent of the value of equity shares (around USD 126 billion), 28 percent of SUNs (over USD 20 billion) and 26 percent of SBIs outstanding (USD 7 billion).
Indonesia’s open capital account increases its vulnerability to disruptive outflows, but reserves have risen proportionately with recent inflows and short-term external debt has remained stable
The risk of a sudden reversal of capital flows is particularly relevant given Indonesia’s open capital markets. If there was a sudden surge of capital out of the country, it would put downward pressure on the exchange rate (heightening the repayment cost of foreign currency denominated debt), as well as leading to higher yields and costs of borrowing. Figure 15 compares Indonesia’s exposure to foreign ownership of financial assets and short-term external debt in September 2008, May 2010 and September 2010.2 The value of foreign holdings of bonds has doubled since September 2008, and the value of foreign equity holdings has gone up by 60 percent (although the latter is largely due to record high equity valuations). However, the increase in short-term external debt has been
2 It is important to point out that the different indicators of this chart measure different types of vulnerability: for example, short-term external debt levels serve to indicate how well reserves could cover fixed amortization requirements if foreign capital markets closed down. On the other hand, the value of foreign equity holdings indicates possible outflows if there was a sudden selloff, although this value would adjust downwards as selling would lead to lower price levels.
-15
-10
-5
0
5
10
15
20
25
-15
-10
-5
0
5
10
15
20
25
2006 2007 2008 2009 2010 Q1-Q3
Net Other InvestmentNet Portfolio InvestmentNet FDI InvestmentFinancial Account
USD billion USD billion
15
30
45
60
75
90
105
-60
-40
-20
0
20
40
60
Nov-08 May-09 Nov-09 May-10 Nov-10
IDR trillion USD billion
Net non-resident investor purchases (LHS):SBI JCI SUN
Foreign Reserves (RHS)
I n d o n e s i a E c o n o m i c Q u a r t e r l y M a x i m i z i n g o p p o r t u n i t i e s , m a n a g i n g r i s k s
T H E W O R L D B A N K | B A N K D U N I A D e c e m b e r 2 0 1 0 14
much more muted. Total debt rose by 20 percent over the period, and private short-term external debt by less than 7 percent. Moreover, while capital inflows can lead to maturity and currency mismatches, there appears to be little evidence of this happening so far. Foreign reserves have also increased by over 50 percent over the period to reach USD 93billion (equivalent to approximately 6.7 months of imports and 2.4 times short-term external debt). Nevertheless, Indonesia’s heightened financial exposure to capital outflows suggests that a higher level of reserves akin to regional peers might be desirable.
Figure 14: The Rupiah saw a marked appreciation in nominal and real terms in 2009, but more gradual in 2010 (real effective exchange rate and nominal effective exchange rate indexed to 100 in Jan 2002; IDR per USD level)
Figure 15: Foreign ownership of domestic assets has increased, but so too have reserves (net capital inflows, foreign holdings of bonds and stocks, short-term external debt and reserves, in USD billion )
Sources: CEIC, JPMorgan and World Bank Source: BI, MoF and World Bank
c. Medium-term policies should aim to attract more FDI and strengthen the financial system through macro-prudential regulations
With inflows likely to continue, policies to attract longer-term FDI inflows and strengthen the financial system could help maximize benefits and contain risks
As highlighted above, capital inflows into Indonesia are likely to be more than a short-term phenomenon. In addition to immediate policy responses, there are measures that the authorities could take to maximize the benefits and minimize the risks from inflows over the medium-term. The two main medium-term policy priorities should be to increase longer-term FDI inflows and strengthen the financial system through macro-prudential and institutional measures to reduce vulnerability.
Improving the investment climate would help foster beneficial FDI inflows
In order to sustain growth rates of over 7 percent, Indonesia would have to raise its investment levels significantly. This will likely require foreign financing, as domestic savings are unlikely to cover the investment gap. FDI inflows are generally more resilient and longer-term than portfolio flows, and could be a useful source of financing to fill this gap. FDI flows to Indonesia are currently relatively low as a share of GDP, but the country could attract more of these flows by taking various measures to improve the investment climate. Steps could be taken to lower entry barriers and operating costs, improve logistics, revise labor legislation and control the proliferation of non-tariff barriers. Addressing Indonesia’s infrastructure weaknesses would also be an important aspect to promote foreign and domestic investment.
Macro- and micro- level prudential regulations could help strengthen the financial system
Capital inflows can also fuel rapid credit expansion, asset price bubbles and trigger related financial sector vulnerabilities. In order to curb some of these vulnerabilities, Indonesia could further strengthen its financial system through various micro- and macro-level prudential regulations. At a macro-level, measures could be taken to address weaknesses in the legal, institutional and governance frameworks, establish a new financial supervisory framework, strengthen BI’s balance sheet, and develop capital markets to diversify funding sources. At a micro-level, regulations could be put in place to reduce the financial vulnerability of banks, for example, by strengthening loan-loss provisioning or limiting foreign currency exposures, particularly short-term.
0
2000
4000
6000
8000
10000
12000
14000
160000
50
100
150
200
250
300
350
400
Jan-96 Jun-98 Dec-00 Jun-03 Dec-05 Jun-08 Nov-10
NEER (LHS)
REER(LHS)
IDR/USD Spot (RHS)
Jan 2002=100 IDR per USD
IDR Appreciation
0 20 40 60 80 100 120 140
FX Reserves
Total Short-Term External Debt
Private Short-Term External Debt
Foreign Holdings of Stocks
Foreign Holdings of Bonds
Foreign Holdings of SBI
Sept 2008
May 2010
Sept 2010
USD bn

I n d o n e s i a E c o n o m i c Q u a r t e r l y M a x i m i z i n g o p p o r t u n i t i e s , m a n a g i n g r i s k s
T H E W O R L D B A N K | B A N K D U N I A D e c e m b e r 2 0 1 0 15
d. Indonesia has various short-term policy options, of which gradual appreciation and the sterilized accumulation of reserves may be the two most appropriate
Short-term policy options should be tailored to country circumstances
Depending on country circumstances, the short-term policy responses to capital inflows range from appreciation and reserve accumulation (sterilized and unsterilized) through to reducing interest rates or tightening fiscal policy and imposing controls on capital inflows and outflows. Each of these policies comes with its own set of pros and cons.
Currency appreciation raises competitiveness concerns but can also have its benefits
In the absence of central bank intervention, currency appreciation is a direct consequence of capital inflows. Appreciation has the advantages of increasing the purchasing power of domestic consumers, reducing inflation, making imports cheaper, and reducing the local currency burden of foreign currency-denominated debt. On the other hand, appreciation heightens competitiveness pressures on exporters and import-competing sectors. The resulting sectoral reallocations may have social consequences depending on how the adjustment process is managed. However, such competitiveness pressures can stimulate necessary improvements in productivity, and unless the currency is severely overvalued, which according to the IMF’s latest Article IV report does not seem to be Indonesia’s case, allowing additional appreciation can be a good option, albeit at a gradual pace.
Exchange rate appreciation can be offset or slowed by central bank accumulation of foreign reserves
In order to prevent appreciation or slow its pace in the face of inflows the central bank can accumulate reserves (by buying foreign currency and selling local currency back into the market). Building reserves may be a good option for Indonesia given its continued relatively high vulnerability to outflows of foreign investments. However, if the extra liquidity is left in the market (unsterilized), it can increase inflationary pressures. The central bank can sterilize the extra liquidity through open market operations (OMOs) or other tightening measures such as increasing reserve requirements. Over the past year, BI has intervened to prevent an overly rapid appreciation of the Rupiah, especially in recent months. This is evident from the significant build-up in foreign reserves, from USD 66 billion at the beginning of January 2010 to USD 93 billion at end-November. BI has sterilized part of its intervention through OMOs, including issuance of SBIs and, increasingly, term deposits. However, increased SBI issuance raises quasi-fiscal costs for the central bank due to the interest rate differential between BI’s payments on SBIs and earnings on reserves. In September, BI chose a different approach to reduce liquidity in the market and raised the statutory reserve requirement from 5 percent to 8 percent, an action that will drain approximately IDR 53 trillion from the system. Given recent pressures on BI’s balance sheet and the quasi-fiscal costs of sterilizing through OMOs, liquidity tightening measures such as September’s reserve requirement hike may be more suitable in the immediate future.
Monetary and fiscal policy can also be used if circumstances are conducive
Monetary and fiscal policy can also be adjusted in response to inflows. Lowering interest rates reduces the incentives for inflows but, given inflationary pressures, does not appear to be a viable option for Indonesia at this stage. Fiscal tightening can help counter inflows via lowering interest rates by reducing aggregate demand. However, Indonesia currently has a relatively conservative fiscal stance and tightening would adversely impact important development spending on infrastructure, health and education.
If other options are not feasible, tailored, temporary and targeted capital controls may be appropriate but require good governance and administrative capacity
If other options are not possible, capital controls can be used to limit large and sudden short-term inflows or outflows, but good governance and adequate administrative capacity are important preconditions to administer these effectively. Controls are a short-term solution because if inflows continue, investors often find ways to circumvent them. They can also be administratively costly to implement and introduce unfair competition in the access to foreign funds (with small and medium size enterprises losing out). Finally, the imposition of controls can create uncertainty regarding a country’s policy stance, potentially leading to sudden capital reversals. Examples of controls include a tax on portfolio inflows, a ban on non-resident purchases of certain financial instruments, and a minimum holding period for certain types of investments. Several emerging economies around the world have issued various types of capital controls to stem inflows in the past year. BI’s approach to date has focused instead on prudential regulatory measures to shift flows away from short-term instruments, particularly SBIs. This includes the 28 day minimum holding period for investments in SBIs announced in June. Issuance of 1 and 3 month SBIs has also been suspended in favor of 6 and 9 month paper.

I n d o n e s i a E c o n o m i c Q u a r t e r l y M a x i m i z i n g o p p o r t u n i t i e s , m a n a g i n g r i s k s
T H E W O R L D B A N K | B A N K D U N I A D e c e m b e r 2 0 1 0 16
2. Quality of public spending and disbursement profile in Indonesia
a. Improving the quality of public spending is a key priority for the Government
Improving the quality of public spending is a key priority for the Government, particularly overall absorptive capacity and timely budget execution
The Government of Indonesia has outlined its commitment in its medium term development plan (RPJMN 2010-2014) to increase significantly infrastructure spending as well as to continue social and poverty reduction programs. Ambitious development targets have been set to be achieved by 2014, including building 1,900 kilometers of toll roads, connecting more households to the electricity grid, and reducing poverty levels to 8-10 percent. However, experience indicates that absorptive capacity (i.e. ability to spend) and the disbursement of public spending remains a challenge. Further improvements in public financial and management (PFM) systems and institutions can help to ensure that planned spending is realized in an efficient and timely manner. Any assessment of the quality of overall public spending would include an evaluation of overall PFM processes and institutions. This section focuses on just one aspect, which is of particular note in Indonesia: budget execution. There are long-standing issues that have resulted in disbursements being under budget and heavily skewed towards the last quarter of the fiscal year. This raises concerns over the absorption capacity of funds, and the potential for inefficient or inappropriate spending.
b. Budget execution is skewed towards the end of the fiscal year
Budget spending patterns continue to be skewed towards the end of the year
The execution of the Indonesian budget follows a pattern which is characterized by slow and back-loaded disbursements. Spending is particularly slow at the start of the fiscal year (Q1); then expenditures accelerate after July and August when parliament finishes its budget revision, followed by a spending rush in the final three months (Q4). Capital expenditures are especially skewed towards the final months of the year (Figure 16). In the past four years, roughly half of capital expenditures were seen in Q4. As a result, in many cases, overall expenditures for the year are frequently below the budget (Figure 17).
Progress in speeding up the disbursement cycle was seen in 2009……
Progress in speeding up the disbursement cycle on capital expenditures was seen in 2009 with spending less back-loaded than in other recent years. This improvement reflected related policy measures and also the Government’s commitment to realize the stimulus package. As discussed in more detail below, some long-standing issues impeding timely budget disbursement remain. Nevertheless, the experience during 2009 suggests that significant improvement in speeding up budget execution is possible and can be achieved with strong political commitment from all government agencies..
Figure 16: Capital expenditures are heavily skewed (monthly and cumulative actual capital spending as percentage of total actual)
Figure 17: Spending frequently under-shoots Budget levels (percentage gap between actual spending and revised Budget)
Sources: Ministry of Finance, World Bank staff Note: * 2010 full-year actual figure based on World Bankstaff estimates
Sources: Ministry of Finance, World Bank staff Note: * 2010 full-year actual figure based on World Bankstaff estimates
…but spending rates have slowed in 2010
However, disbursement rates in 2010 have been weak. In the year-to-November, only 73percent of the revised Budget was spent. Capital and material expenditures were
0
20
40
60
80
100
0
20
40
60
80
100
2007 2008 2009 2010*
Lines = cumulative Bars = monthly
-20
-10
0
10
20
-20
-10
0
10
202007 2008
2009 2010*
43

I n d o n e s i a E c o n o m i c Q u a r t e r l y M a x i m i z i n g o p p o r t u n i t i e s , m a n a g i n g r i s k s
T H E W O R L D B A N K | B A N K D U N I A D e c e m b e r 2 0 1 0 17
particularly low, at 50 percent and 64 percent, respectively. This compares with corresponding expenditures in the first eleven months of 2009 of 68 percent and 69 percent of their full year totals, respectively.
c. International comparisons highlight Indonesia’s budget execution challenges
In comparison to its regional peers, Indonesia’s disbursement profiles are more back-loaded to the end of the fiscal year
Indonesia’s back-loaded budget disbursement profile stands out in comparison with other countries within the region (Figure 18). In 2009, more than 20 percent of Indonesia’s central government budget was realized in the last month of the fiscal year, and is likely to be highly concentrated in December in 2010. In contrast, Thailand, Philippines, and, to some extent India, showed a more equal distribution of disbursement across months.
Figure 18: Indonesia’s skewed disbursement profile stands out amongst regional peers (monthly fiscal actual expenditures as percentage of annual total)
Sources: CEIC and World Bank
Experience from other countries suggests that flexible virement procedures and provision of adequate flexibility to line ministry and agency managers may improve timely budget execution
A full analysis of the PFM systems of the countries mentioned in Figure 18 is beyond the scope of this section. However, a preliminary review suggests that flexible rules for budget virement, i.e. the administrative transfer of funds from one part of a budget to another, and providing more flexibility for line ministries’ managers contribute to smoother disbursement profiles. However, moves toward more deconcentrated controls should be accompanied by strengthened procedures for auditing and reporting. These are some of the issues that Schiavo-Campo and Tommasi (1999)3 highlight as being generally needed to improve the efficiency of public spending, particularly budget execution. Other areas include the authorization of multi-year commitments and spending, at least for capital expenditures, but the procedures need to be closely regulated and combined with robust commitment controls. Market testing and outsourcing can also play a role, although caution is needed in contract preparation and management and ensuring competitive procurement for activities that are contracted out. Malaysia provides an example of granting flexibility to line mangers, while linking it to some agreement on goals and performance. Under the Modified Budgeting System, introduced in Malaysia in 1990, Controlling Officers are responsible for determining their department’s performance in terms of outputs and impacts, which are recorded in the departmental program agreement.4 This records the inputs, outputs and impact of an activity as agreed between the Federal Treasury and the department during budget execution. To enable them to manage their resources more effectively, Controlling Officers have greater powers over their utilization, for example, the ability to transfer resources across activities within a particular program without prior approval from the Treasury.
3 Schiavo-Campo and Tommasi, 1999, “Managing Government Expenditure”, Asian Development
Bank. 4 From Tan Sri Dato' Seri Ahmad Sarji bin Abdul Hamid, Chief Secretary of the Government of
Malaysia, “Improvements in the Public Service for the year 1992,1993” in Schiavo-Campo and Tommasi (ibid).
0
5
10
15
20
25
0
5
10
15
20
25
1 2 3 4 5 6 7 8 9 10 11 12Month
Philippines (2009) Thailand (2008) India (2007) Indonesia (2009)

I n d o n e s i a E c o n o m i c Q u a r t e r l y M a x i m i z i n g o p p o r t u n i t i e s , m a n a g i n g r i s k s
T H E W O R L D B A N K | B A N K D U N I A D e c e m b e r 2 0 1 0 18
d. Budget under-spending and a skewed disbursement profile can hinder the effectiveness and efficiency of public spending
Slow and back-loaded disbursement profile and unspent budget could indicate low absorptive capacity or bottlenecks in implementing public investment…
The degree of underspending of annual budgets in Indonesia may be due to the absorptive capacity of line ministries not keeping track with rising budget allocations. In certain cases unspent budget could also result from efficiency gains in some spending categories (i.e. it does not necessarily reflect low absorptive capacity). However, this seems less likely in the case of Indonesia since there is an incentive for line agencies to spend all of their budget within the fiscal year due to the strict annual budget system. Box 2 considers the budget allocation and spending within the Ministry of Health and potential indicators of absorptive capacity.
Box 2: Allocation and spending for the Ministry of Health As part of its input toward the preparation of 2010 Financial Note, the Ministry of Health conducted a review on the implementation of policies and programs in the health sector between 2004 and 2009. The review provides a brief assessment of the progress in achieving health outcome targets, budget allocation, as well as budget realization of each program. Table 6 below provides a summary of the assessment. Although the actual spending was never fully realized, the Ministry of Health in most cases continued to receive significant budget increases. This could be driven by the pressing needs and relatively low level of current spending in the health sector. However, in 2008, the Ministry of Health was unable to meet targets for more than one-third of health target indicators. This may be associated with, among others, lack of absorption capacity, and allocative inefficiency. The above points suggest that increasing budget needs is to be done in parallel with improving the institution’s capacity in planning and implementation to achieve their development goals.
Table 6: Ministry of Health budget allocation and target performance
2005 2006 2007 2008
Budget allocation and actual spending
Annual budget (IDR billion) 11,110 13,980 18,750 18,420
Percent increase on preceding year 89% 26% 34% -2%
Budget realization (IDR billion) 8,260 12,270 15,210 15,880
As percent of budget 74% 88% 81% 86%
Programs and target indicators (outputs / outcomes)
Number of programs 15 14 14 14
Number of indicators, of which: 45 63 62 58
Above target 11 19 23 10
At target 14 28 20 22
Below target 20 16 19 26
Sources and notes: World Bank staff from Laporan Kementrian Kesehatan sebagai Bahan Penyusunan (i) Nota Keuangan dan RAPBN Tahun 2010, (ii) Laporan Pelaksanaan APBN Semester I Tahun 2009 dan Prognosa Semester II Tahun 2009, (iii) Nota Keuangan dan RAPBN-P Tahun 2009
… and can lead to distortions in public expenditure efficiency and effectiveness and hinder the attainment of development outcomes
Skewed spending patterns can disrupt infrastructure investments and project implementation. Infrastructure projects require multi-year financial planning and cash flow certainty throughout the year. Back-loaded annual disbursement disrupts cash management and planning and creates uncertainty in the implementation of the capital budget. In addition, while the cautious use of multi-year contracts is somewhat understandable — given the focus on the annual budget cycle, the inability to carry-over funds between years and weaknesses in multi-year commitment planning and management — this typically leads to a rush to deliver projects by year end, compromising quality.5 Moreover, rushed budget execution at the fiscal year end could
5 The introduction of a government-wide medium-term expenditure framework (MTEF) is expected to
help reduce the budgetary risks associated with multi-year commitments, as budget holders will receive greater assurances about the availability of medium term resources.

I n d o n e s i a E c o n o m i c Q u a r t e r l y M a x i m i z i n g o p p o r t u n i t i e s , m a n a g i n g r i s k s
T H E W O R L D B A N K | B A N K D U N I A D e c e m b e r 2 0 1 0 19
also lead to inappropriate use of public funds. Box 3 provides an illustration of the potential cost of implementation problems for the road and bridge sector. As mentioned above, low absorption capacity also means that some portions of the allocated budget for development programs are not spent. This can affect the achievement of development targets which have been set along with the budget. Finally, there is also an opportunity cost related to the unutilized funds, which could otherwise be used for high-return investments.
Box 3: Enhancing internal control and supervision can improve quality of spending Each year, the Supreme Audit Body (Badan Pemeriksa Keuangan, BPK) carries out an audit on the implementation of central, provincial, and districts budget to assess selected programs or activity implementation. This Box focuses on the audit assessment of the implementation of road and bridge infrastructure. The audit covers the budget implementation of national, provincial, and district road and bridge in fiscal years 2007, 2008, and 2009. The review included implementing units within DG-Highway-Ministry of Public Work, 18 provincial highway offices, and 26 district highway offices. The total budget of the sample was IDR 6.9 trillion, or 12.6 per cent of the overall budget realization of IDR 55 trillion. The audit found that the value of the total budget that was likely to be inappropriately used or not used in an efficient and effective manner was around IDR 315 billion or 4.6 per cent of the sample’s budget (Table 7).
Table 7: Summary of BPK audit findings on the road sector
Findings that cause the following: No of cases
Value (IDR Billion)
Financial loss to government (central and sub-national) 199 149.1
Potential financial loss 65 45.2
Revenue below target (central and sub-national) 42 25.1
Administration 89 n.a.
Inefficiency 30 62.9
Ineffectiveness 26 32.7
Total 451 314.9
The assessment suggests that many cases related to potential financial loss were due to weaknesses in the control system. These include unfinished project implementation, not-completed work volumes, over payment (over price), as well as weak planning. The assessment also reported some inefficiencies and ineffectiveness in project implementation, mostly due to weakness in internal control and supervision. For example, the use of inputs with price, quantity or quality that is of higher than standard, quantity or quality that is beyond what is needed, and higher price compared to similar procurement at the same time. The assessment found that some projects did not provide any benefit or intended outcomes. For example, some spending was not well targeted or the utilization of goods and services not as planned, or the purchase of goods that are not or not yet being utilized. Other issues included the delay or blocking of activities hindering the attainment of organizational objectives, sub-optimal service delivery, or the improper function or tasks of the institution.
Sources: World Bank staff from BPK Audit Report, 2009, available at www.bpk.go.id
e. Impediments to disbursement and recent policy reforms
The Government is taking steps to address budget execution and disbursement delays
The Government has taken several steps in recent years to improve budget execution. On procurement this includes a move in 2008 to allow procurement procedures to start as early as October in the preceding year. However, this will have an even greater impact once resources are allocated to support this early procurement preparation process. The Ministry of Finance has also set new standards to reduce the time it takes to process payments, and introduced measures to improve cash management and planning In terms of the implementing units, the Government issued Presidential Regulation No. 53/2010 which states that the assignments and dismissals of implementing unit officials are no longer bound to the fiscal year. However, to be effective, new technical regulations also need to be issued by the Ministry of Finance. The Government has also issued a presidential regulation that gives greater flexibility for multi-year contracting and seasonal

I n d o n e s i a E c o n o m i c Q u a r t e r l y M a x i m i z i n g o p p o r t u n i t i e s , m a n a g i n g r i s k s
T H E W O R L D B A N K | B A N K D U N I A D e c e m b e r 2 0 1 0 20
activities such as seed planting, reforestation, and provision of medicine. In addition, DG Treasury has issued a circular letter to form a permanent team at the level of ministerial and regional treasury units to monitor the Satker disbursement performance. Progress has also been made on the timely issuance of budget execution documents(DIPAs). Since 2007, DIPAs have been issued in early January (i.e. the beginning of the fiscal year). Previously, DIPAs could be delayed if the relevant parliamentary commission failed to complete its budgetary review before the beginning of the year.
Ongoing impediments to budget execution span the periods before, during, and at the end of the fiscal year
Weak budget preparation, cumbersome revision procedures, highly detailed budget documentation, and procurement bottlenecks are among the main challenges for timely budget execution. In addition the strict annual (“stop and go” or use it or lose it) system puts pressure on line ministries to spend the entire allocated budget in one year. Despite the above reforms, which have been introduced to speed up budget execution, challenges remain. These include issues from before, during, and at the end of fiscal year: Before the fiscal year, activities may be marked with a bintang (asterix or “star”), to prevent spending on a budget item that has been approved by Parliament. This approach is designed to provide a time extension to the relevant line ministry to complete the required project documentation. However, in practice, it provides incentives for line ministries to submit incomplete projects and gives room for “non-formal negotiation”. As a result, a bintang-marked project has to go through a cumbersome approval process and sometimes never gets implemented. The main issues during the fiscal year are complicated budget revision and virement procedures, and detailed budget execution controls. Most issues related to long termchallenges also need to be addressed. These include, among others, the shortage of qualified procurement staff; the need to strengthen the capacity of the Satker staff; and the need to improve coordination and communication between the Ministry of Finance and line ministries. The identified issues related to budget execution at the end of fiscal year include: cumbersome and difficult carry-over processes, particularly for multi-year investment projects. These issues need careful consideration, to encourage both flexibility and timelybudget absorption.
f. Looking forward
A number of key policy improvements should be considered to improve the quality of budget spending
Reforms in a range of areas could help to improve further the quality of spending, particularly in terms of the disbursement profile. These include the following: first, simplifying budget revision procedures by increasing flexibility to budget holders in managing their resources; second, simplifying and streamlining budget execution controls; third, streamlining the budget preparation process by discontinuing the bintang practice. Continuing the reform agenda to improve public procurement is also important. In particular, this includes moving from the current ad-hoc approach of procurement committees to a sustainable procurement management function, coupled with a national capacity building program. Another priority is to improve the regulatory framework by anchoring it to a comprehensive national public sector procurement law.
Reforming civil service rules and…
Rigidities in civil service rules and current practices also impede the efficient operation of public institutions and the effective implementation of reform measures Modifications to existing organizational structures are laborious and time consuming, since approval must be sought from the Ministry for State Apparatus. This creates difficulties for managers to select, train, promote and motivate their staff. It also limits the ability of public ministries and agencies to introduce more performance orientated management reforms.
…promoting a medium term focus and performance orientation are also critical
The Government is also introducing a Medium-Term Expenditure Framework (MTEF) and program-based budgeting for the 2011 Budget. These are ambitious initiatives that are designed to, over time, help promote a greater focus on budget outputs and to gradually change the nature of expenditure controls, holding policy makers and managers accountable for delivering greater performance improvements and not just complying with financial regulations.

I n d o n e s i a E c o n o m i c Q u a r t e r l y M a x i m i z i n g o p p o r t u n i t i e s , m a n a g i n g r i s k s
T H E W O R L D B A N K | B A N K D U N I A D e c e m b e r 2 0 1 0 21
C. INDONESIA 2014 AND BEYOND: A SELECTIVE LOOK
Poverty includes both income and non-income dimensions
The poverty of a household can be measured in a variety of ways. Income- or expenditure-based poverty rates focus on the share of households whose consumption is below a certain poverty level. However, adequate consumption is just one of a number of different dimensions of human well-being. Others include reduced vulnerability to poverty, education, health and access to basic infrastructure such as water and sanitation, housing and electricity.6 These multiple aspects of poverty can be reflected in multi-pronged poverty reduction strategies including first making economic growth work for the poor in terms of reducing disparities in incomes across sectors and regions and reducing vulnerability to poverty. Second, ensuring that social services work for the poor, and third that public spending can help to alleviate poverty through expenditures targeted to the poor, for example, on social assistance.
Poverty and service delivery is the focus for this section of the December IEQ
Subsequent articles focus on a select sample of topics within these different aspects of poverty and service delivery. The first article is related to the issue of vulnerability to poverty. It examines the effectiveness of the Government of Indonesia’s nationwide temporary cash transfer program for poor households, Bantuan Langsung Tunai (BLT) which was used in 2005 and 2008 to limit the impact on household welfare of upward adjustments in fuel prices as subsidies were cut. The second article covers both vulnerability and access to health services by analyzing the Jamkesmas health insurance for the poor program. The next two articles, on housing and water and sanitation respectively, cover the challenges on provision of access to these basic infrastructure services. The final article considers how monitoring and evaluation can be used to increase our understanding of the government’s ability to deliver goods and access to basic services. To provide context, before these pieces, a brief snapshot of consumption based poverty rates is provided from the 2010 Susenas household survey.
Poverty rates have declined since 2006
The share of the population below the poverty line has shown a sustained reduction since 2006 falling from 17.8 percent to 13.3 percent. The number of poor has fallen to 31 million. Sustained growth in aggregate GDP, and consumption, over this period contributed to reductions in both urban and rural poverty. The gap between the two poverty rates has remained relatively stable with the urban rate just under 7 percentage points lower. Without attempting a comprehensive analysis, it is interesting to compare these aggregate trends with the services discussed in subsequent articles. For example, urban housing conditions have also been improving, moderately. Similarly, rural and urban access to sanitation services have also been on an upward trend but the share of urban population with access to piped water supply has been declining.
Figure 19: Aggregate poverty is falling (poverty rate, percent of population)
Source: Susenas 2010
6 For detailed analysis of poverty trends in Indonesia, including non-income dimensions of poverty, see the World Bank (2006), Making the New Indonesia Work for the Poor. For an analysis of service delivery see also World Bank (2006), Making Services Work for the Poor. Both reports are available at http://go.worldbank.org/XEIS8O8SE0.
0
5
10
15
20
25
0
5
10
15
20
25
Rural
Urban
Urban+Rural

I n d o n e s i a E c o n o m i c Q u a r t e r l y M a x i m i z i n g o p p o r t u n i t i e s , m a n a g i n g r i s k s
T H E W O R L D B A N K | B A N K D U N I A D e c e m b e r 2 0 1 0 22
Provincial disparities in poverty rates remain
Within the headline figures, there continue to be strong provincial variations in poverty rates. For example, provincial poverty rates vary from 37 percent in Papua to 3.5 percent in DKI Jakarta. Access to basic services also varies strongly with geography. Indeed access to basic services and infrastructure is found to be one of the correlates of household consumption levels, as is education, gender and occupation. For example, the2010 poverty rates by sector of employment ranged from 19 percent for agriculture to 1.4 percent for industry and 6.2 percent for services.
Figure 20: Provincial disparities in poverty remain (poverty rate as percentage of population, by province)
Sources: Susenas 2010

I n d o n e s i a E c o n o m i c Q u a r t e r l y M a x i m i z i n g o p p o r t u n i t i e s , m a n a g i n g r i s k s
T H E W O R L D B A N K | B A N K D U N I A D e c e m b e r 2 0 1 0 23
1. Assessing the performance of an Indonesian unconditional cash transfer: BLT
Targeted social assistance benefits can help poor households manage abrupt changes in macroeconomic conditions…
Changes to managed price regimes, such as those undertaken repeatedly by the Government of Indonesia (GoI) during the 2000s, are an important source of risk to the well-being of poor households. Nonetheless, reductions in subsidies on key consumption items such as food, fuel, and power, can free up fiscal space for spending on other areas such as health and education. By managing policy changes carefully, governments can achieve such a pro-poor re-allocation of resources while mitigating the losses to income and productivity that poor households will inevitably face. As the Government of Indonesia considers further changes to its own subsidy systems, the following section analyzes the Indonesian experience in delivering social assistance benefits to poor households adversely affected by such shocks.
… and the GoI has solid experience delivering a large-scale transfer program to those affected by reforms – Bantuan Langsung Tunai or BLT
Previously the GoI used a nationwide temporary cash transfer program for poor households, Bantuan Langsung Tunai (BLT), to cushion the blow from increases in managed prices and to provide poor households time and budget space to adjust to new price regimes. In 2005 subsidy cuts raised household fuel prices by an average of over 125 percent. BLT, a year-long direct cash transfer in four installments, was a GoI initiative designed to mitigate the effects of these increases in fuel prices. Another BLT was delivered in 2008 when another reduction in fuel subsidies coincided with a global food price crisis; later these events were followed by a global economic slowdown precipitated by financial crisis. In both years, funds (for benefits and operations) for BLT were allocated from the implied budgetary savings from the subsidy reductions themselves.
The BLT program assisted over a third of households in Indonesia
BLT delivered direct cash assistance to over a third of all households in Indonesia – a remarkable achievement given that it was designed and deployed in less than 5 months.The post office distributed BLT benefits to 19 million households in every one of Indonesia’s provinces in 2005. In 2008, there were fewer beneficiaries but every province continued to be served. Poor households receiving BLT were those benefiting least from the old subsidy regime and were most at risk of consumption reductions caused by price increases and changes in government policy. With cash payments equal to approximately 15 percent of regular household expenditure (IDR 100,000 per month) and a year-long schedule of benefits, these households had budget space and also time to readjust spending patterns to price changes or the global economic crisis.
The impacts of BLT benefits on recipients can be gleaned from household surveys and qualitative fieldwork
BLT’s just-in-time cash assistance had positive effects on households and communities at benefit levels that did not create incentives for unproductive behavior. This assessment is based on World Bank analysis of a panel of households whose characteristics and behaviors were recorded in the Indonesian socioeconomic survey of households (Susenas). This analysis covers the period prior to the BLT’s launch dates in 2005 and 2008 and once again after two or possibly three BLT disbursements had already been made. Qualitative surveys in a limited number of areas done by the SMERU research institute were also used to assess the impact of the BLT transfers.7
BLT benefits were adequate for basic consumption needs and benefited both households and wider communities
The size of BLT benefits was considered adequate for vulnerable households and cash was delivered at the right time. Beneficiaries indicated that BLT benefits were spent within a week of receipt and used to buy basic necessities (especially rice because it could be stored) or spent on pressing one-time expenditures like school costs or clothes for the annual Eid ul-Fitr religious holidays. Spending on fuel and transport (which contains a fuel cost component) were also popular uses of BLT funds. The first BLT disbursement in October 2005 corresponded to the greatest one-time nationwide increase in fuel prices and households were able to rely on BLT payments for the next twelve months.8 In the short run, those households receiving BLT did reduce their fuel consumption even though BLT funds were equal to approximately twice the additional expenditure needed
7 For complete details, see “Social Safety Nets Indonesia: Bantuan Langsung Tunai (BTL), Temporary Unconditional Cash Transfer”, World Bank, 2010. 8 In 2008 when prices rose less steeply, BLT delivery was not everywhere simultaneous with price increases but in some areas followed one to two quarters later, and both total amounts and the number of disbursements decreased (from IDR 1.2 million to IDR 900,000 and from 4 to 3 respectively).

I n d o n e s i a E c o n o m i c Q u a r t e r l y M a x i m i z i n g o p p o r t u n i t i e s , m a n a g i n g r i s k s
T H E W O R L D B A N K | B A N K D U N I A D e c e m b e r 2 0 1 0 24
for the households to maintain their fuel consumption at the same level as before the subsidy reduction. In the long run, and prior to the subsidy reductions (in 2005 and 2008), fuel as a share of total expenditure for target households was just under nine percent, so BLT did not significantly distort household fuel consumption decisions.
Where district macroeconomic environments were weakest – as defined by average household expenditure performance – BLT recipient households were able to increase their expenditures at significantly higher rates than all other non-BLT households.9 In addition, by increasing consumption opportunities for poorer households, BLT had positive multiplier effects on expenditures throughout the wider community as well.
BLT households more often found jobs…
Those households receiving BLT also found new jobs at increased rates (Table 8).Between 2005 (pre-BLT) and 2007, the slight long-term reduction in hours worked was broadly the same across both BLT recipients and households not receiving BLT. However, in 2008, BLT household heads who previously were not working and without a job or business were more likely (by 10 percentage points) to report that they had become employed. In addition, across nearly all sectors, heads of households receiving BLT were not more likely to leave work if they had a job. This was reflected in statements made by 2005 BLT recipients and other community members who said that “the value of BLT was not enough to fulfill all living needs” and therefore was not sufficient to create work apathy.
…more often consumed health services…
Impacts were also seen in terms of usage of health services. Households receiving BLT avoided reductions in health expenditure that can have lasting negative effects. Indeed, in areas most heavily affected by epidemics poor BLT households more often sought health services than households without BLT. There was variation in this positive effect of BLTon health care usage; for example, utilization was greater for inpatient than outpatient care, and larger also for insured households.
…more often kept their children in school and out of labor markets…
In addition, BLT households avoided increases in child labor and reductions in education (Table 9) which also feed through into adverse longer-term effects for well-being and the opportunities of children and the next generation of households. From higher initial levels,the rate by which child labor fell from 2008 to 2009 is slightly higher among BLT households. While average national gross enrollment rates were about constant between 2008 and 2009, the effect of BLT on school participation rates for 6 to 18 year olds was positive. This positive impact was more pronounced for secondary school age children, aged 12 to 18 years old, almost double the effect seen for children aged 6 to 12 year olds.
…and maintained regular consumption choices
BLT households were able to make regular or “average” consumption choices. When food prices rose steeply during 2008, all Indonesian households cut back on meat and instead consumed more fish, vegetables, rice, and dairy; BLT households switched into these goods at the same rates as non-BLT households. BLT households actually had slightly smaller rates of increase in tobacco expenditure relative to the rest of the poor population while rates of increase in alcohol consumption were approximately equal. Retiring or taking on new debt was a popular use for BLT according to beneficiaries; such financial management is a common mitigation and prevention behavior in Indonesia. During the 2008 BLT, funds were more often spent on education, likely because major urban centers received the first transfer at the end of May, or at least a month before upcoming-year school fees and other non-fee school charges would have been assessed.
Household experience shows that initial pessimism concerning the behavioral effects of BLT in Indonesia was unwarranted…
In summary, it is clear that the pessimistic forecasts regarding BLT – that said it could encourage dependency, reduced labor hours, or bad consumption choices – were unwarranted. Households benefited from a year-long cushion during which they could re-adjust behaviors and they did so without exiting the labor market or choosing to work fewer hours. They also did not substitute the labor of school-age children for the labor of older household members and in fact enjoyed increased use of education and health services. Regarding consumption of food and tobacco, BLT households continued to spend much like other poor and non-poor Indonesian households 9 Weak (strong) districts are defined as those with average per-capita expenditure growth equal to the 25th percentile or below (75th percentile or above) of the nationwide distribution of district average per-capita expenditure growth. Beginning in 2004, growth in Indonesian real GDP has been averaging approximately five and a half percent per year and nationally, poorer households gained relatively more in expenditure terms than did richer households during both the 2005 and 2008 BLT periods.

I n d o n e s i a E c o n o m i c Q u a r t e r l y M a x i m i z i n g o p p o r t u n i t i e s , m a n a g i n g r i s k s
T H E W O R L D B A N K | B A N K D U N I A D e c e m b e r 2 0 1 0 25
Table 8: BLT recipients found jobs at a greater rate Table 9: BLT households also avoided reductions in school
participation and increases in child labor
BLT impact: percentage increase in likelihood of finding jobs, 2008-09
32**
BLT non-BLT
Percentage finding jobs, 2008-09
36 30
Working Hours
2005 39.2 41.0
2007 37.7 39.8
Change -1.5 -1.2
2009 BLT working sector:
1st most common Agriculture
2nd most common Service
3rd most common Construction, Retail
BLT Impacts, 2008-2009: Percentage points
School participation
All 6-18 yr olds +1.2
12-18 yr olds +2.6*
Labor participation
All 6-18 yr olds -2.3***
2008 household averages (percent)
Poor BLT
All BLT
All non-BLT
Gross Enrolment rate 72 76 84
Labor Participation rate 13 13 9
Note: *Significant at the 5 percent level. Impacts are measured as increases over matched poor and non-BLT households (for previously unemployed heads of household only). The 2008/2009 Susenas do not allow calculation of hours worked. Working sector choices for BLT household heads are ranked the same regardless of employment status in 2008 Source: Susenas and World Bank staff calculations
Note: *Significant at the 10 percent level. *** Significant at the 1 percent level. Impacts measured as increases over rates in matched poor non-BLT households. Source: Susenas and World Bank staff calculations
…however, there were serious weakness in BLT operations and implementation across most agencies
BLT implementation and operations – from targeting through to complaint resolution –were weak and are in need of improvement. Compressed delivery schedules, insufficient guidelines and incentives, a lack of clear accountability between BLT agencies and operational bodies, poor technology, and a difficult and varied poverty environment combined to make all non-delivery operations problematic. Underestimates of necessary administrative resources may also have contributed to operational shortcomings. Targeting of BLT to poor households was moderately successful (Figure 21 shows BLT coverage relative to other GoI social assistance programs), but a significant proportion of benefits ended up with non-poor households. Mostly-failed socialization, including of targeting procedures, led to protest activity and delivery disruption as well as worse targeting outcomes. Finally, the lack of complaint monitoring, information management, or audit systems prevented any improvements to implementation either in real time or in the non-BLT years between 2006 and 2008 (Figure 22 shows roughly constant targeting performance in 2005 and 2008).
A lack of oversight contributed to a rise in deductions of benefits at administrative levels
Too little detail in implementation arrangements and weak chains of authority and control contributed to a lack of oversight; as a result of which deductions of BLT benefits were on the rise between 2005 and 2008 (Table 10). It is unknown in most cases whether these deductions are petty corruption or whether they produce community-desired outcomes. Regardless, they are not recorded, monitored, or evaluated. Neither BLT guidelines nor program officials are equipped to manage or stop such re-distribution, and a lack of socialization kept beneficiary households from interrupting, reporting, or acting on these modifications to the program.

I n d o n e s i a E c o n o m i c Q u a r t e r l y M a x i m i z i n g o p p o r t u n i t i e s , m a n a g i n g r i s k s
T H E W O R L D B A N K | B A N K D U N I A D e c e m b e r 2 0 1 0 26
Figure 21: GoI social assistance program coverage, 2008 and 2009 (percentage of decile receiving/using program)
Figure 22: BLT incidence and coverage, 2005 and 2008 (percent of households)
Expenditure decile Expenditure quintile
Source: Susenas and World Bank staff calculations Note: Incidence is share of total BLT benefits going to the quintile while coverage is the percentage of the quintile which receive BLT benefits Source: Susenas and World Bank staff calculations
Table 10: BLT deduction frequencies, amounts, actors, and uses
2005 - 2006 2008 - 2009
Frequency (%) 10 46 - 54
Amount (IDR ‘000) 1st tranche 2nd tranche
Mean 53 72 67
Median 20 60 50
Mode 10 100 100
Deducted by:
1st most common Sub-village Admin. (51%) N/A
2nd most common Village Admin. (25%) N/A
Deducted for:
1st most common Redistribute Equally (63%) Redistribute Equally (42%)
2nd most common Collective Transport (26%) New Identity Card (29%)
Note: Mode is the amount most frequently deducted. Deduction frequency as derived in 2005 cannot be calculated in 2008. In 2008, deduction frequency is calculated 1) as the proportion of beneficiaries receiving less than the stipulated benefit amount (46 percent) and 2) as one minus the proportion of beneficiaries who answer “No” to all questions asking about deductions made by different actors, including a catch-all “other” category (54 percent). Source: Susenas 2005, 2009 and World Bank staff calculations
Overall BLT was a net positive for households, but a temporary and unconditional cash transfer should be supplemented by additional safety net initiatives directed at longer-term determinants of poverty
Data from direct BLT beneficiaries shows that BLT was successful in cushioning the blow from increased fuel, transport, and food prices, or externally produced macroeconomic and financial shocks, but BLT was not designed to be a poverty reduction system. BLT provided protection to poor households in a manner that was more progressive than the subsidies it was replacing. Moderately-sized benefits were delivered at the right time, for the right duration, and with a very lean administrative apparatus. However, for long-term poverty reduction goals, BLT is not appropriate. Continuing investments in health, education, and business, which can help disrupt the intergenerational transmission of poverty, are better served by programs like conditional cash transfers, free health insurance, secondary and university scholarships, and micro loans for entrepreneurs (see “Indonesia Social Assistance Public Expenditure Review”, World Bank forthcoming).
0
20
40
60
80
100
0
20
40
60
80
100
1 2 3 4 5 6 7 8 9 10
Poor households
Non-poor households
0
20
40
60
0
15
30
45
60
1 2 3 4 5
Incidence 2005 Incidence 2008
Coverage 2005 Coverage 2008
Jamkesmas 2009 usage
BLT 2008
Jamkesmas 2009 coverage
Raskin 2009
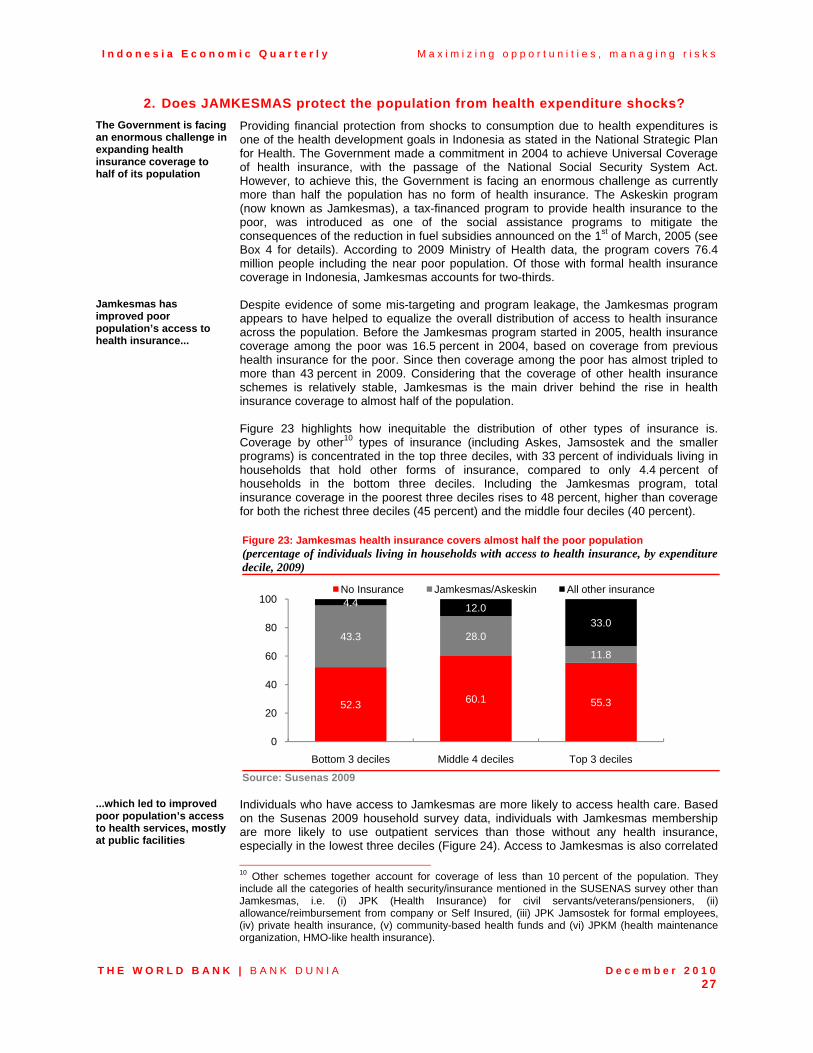
I n d o n e s i a E c o n o m i c Q u a r t e r l y M a x i m i z i n g o p p o r t u n i t i e s , m a n a g i n g r i s k s
T H E W O R L D B A N K | B A N K D U N I A D e c e m b e r 2 0 1 0 27
2. Does JAMKESMAS protect the population from health expenditure shocks?
The Government is facing an enormous challenge in expanding health insurance coverage to half of its population
Providing financial protection from shocks to consumption due to health expenditures is one of the health development goals in Indonesia as stated in the National Strategic Plan for Health. The Government made a commitment in 2004 to achieve Universal Coverageof health insurance, with the passage of the National Social Security System Act. However, to achieve this, the Government is facing an enormous challenge as currently more than half the population has no form of health insurance. The Askeskin program (now known as Jamkesmas), a tax-financed program to provide health insurance to the poor, was introduced as one of the social assistance programs to mitigate the consequences of the reduction in fuel subsidies announced on the 1st of March, 2005 (see Box 4 for details). According to 2009 Ministry of Health data, the program covers 76.4 million people including the near poor population. Of those with formal health insurance coverage in Indonesia, Jamkesmas accounts for two-thirds.
Jamkesmas has improved poor population’s access to health insurance...
Despite evidence of some mis-targeting and program leakage, the Jamkesmas program appears to have helped to equalize the overall distribution of access to health insurance across the population. Before the Jamkesmas program started in 2005, health insurance coverage among the poor was 16.5 percent in 2004, based on coverage from previous health insurance for the poor. Since then coverage among the poor has almost tripled to more than 43 percent in 2009. Considering that the coverage of other health insurance schemes is relatively stable, Jamkesmas is the main driver behind the rise in health insurance coverage to almost half of the population. Figure 23 highlights how inequitable the distribution of other types of insurance is. Coverage by other10 types of insurance (including Askes, Jamsostek and the smaller programs) is concentrated in the top three deciles, with 33 percent of individuals living in households that hold other forms of insurance, compared to only 4.4 percent of households in the bottom three deciles. Including the Jamkesmas program, total insurance coverage in the poorest three deciles rises to 48 percent, higher than coverage for both the richest three deciles (45 percent) and the middle four deciles (40 percent). Figure 23: Jamkesmas health insurance covers almost half the poor population (percentage of individuals living in households with access to health insurance, by expenditure decile, 2009)
Source: Susenas 2009
...which led to improved poor population’s access to health services, mostly at public facilities
Individuals who have access to Jamkesmas are more likely to access health care. Based on the Susenas 2009 household survey data, individuals with Jamkesmas membership are more likely to use outpatient services than those without any health insurance, especially in the lowest three deciles (Figure 24). Access to Jamkesmas is also correlated
10 Other schemes together account for coverage of less than 10 percent of the population. They include all the categories of health security/insurance mentioned in the SUSENAS survey other than Jamkesmas, i.e. (i) JPK (Health Insurance) for civil servants/veterans/pensioners, (ii) allowance/reimbursement from company or Self Insured, (iii) JPK Jamsostek for formal employees, (iv) private health insurance, (v) community-based health funds and (vi) JPKM (health maintenance organization, HMO-like health insurance).
52.3 60.1 55.3
43.3 28.0
11.8
4.4 12.0
33.0
0
20
40
60
80
100
Bottom 3 deciles Middle 4 deciles Top 3 deciles
No Insurance Jamkesmas/Askeskin All other insurance

I n d o n e s i a E c o n o m i c Q u a r t e r l y M a x i m i z i n g o p p o r t u n i t i e s , m a n a g i n g r i s k s
T H E W O R L D B A N K | B A N K D U N I A D e c e m b e r 2 0 1 0 28
with an increase in the likelihood of inpatient service utilization, as well as with a slightly longer length of stay. Jamkesmas members overwhelmingly choose to use public rather than private facilities, most likely reflecting the benefit structure of the program in which its benefit package offers limited availability of private providers in its provider network.
Box 4: A brief introduction to the Jamkesmas program The Jamkesmas program provides health insurance for the poor and the near-poor (equivalent to approximately the lowest three expenditure deciles of the population) who are targeted through the application of a means test, with a comprehensive package of health benefits. The program is tax-financed by the central government and does not require any insurance contributions or cost-sharing on the part of beneficiaries or local governments. The budget cost per individual covered was initially IDR 5,000 per month, and now increased to IDR 6,500 giving a total budget for the current Jamkesmas program roughly equivalent to 20 percent of the central government health budget. The program is similar in spirit to several other initiatives that have recently been introduced by countries in the region such as in India (the Rashtriya Swastha Bima Yojna), Thailand Universal Coverage scheme and the health insurance program for the poor in Vietnam. The benefit package is quite generous and requires no copayments (although this does not imply that out-of-pocket spending is zero), but the provider network is mostly limited to public facilities. In fact, Jamkesmas’ benefit package is more generous than that of the other social insurance schemes, including the contributory civil servants health insurance program, Askes, and the program for formal sector employees, Jamsostek. For example, Askes beneficiaries often face high copayments (especially for inpatient care), have very limited access to private providers, and benefits are limited to the member, the spouse and up to two non-working, non-married children. The providers included in the Jamkesmas program network are mainly government-owned facilities and are paid using a combination of capitation, fee-for-service, or Diagnostic Related Groups (DRGs), depending on the type of provider. The program pays for primary care services by capitation, reimburses inpatient services at primary health care facilities on a fee-for-service basis and has just recently started to use a DRG type provider payment mechanism for hospital inpatient care. The DRG was piloted in 15 vertical hospitals in 2008 and expanded to all hospitals in the network in 2009. In addition to the DRG payment, public providers receive subsidies in the form of the salaries of workers and some capital costs. Only a limited number and type of private providers are contracted, and mostly in the urban areas of Java (in 2009, private hospital accounted for more than 30 % of total hospitals in the network, but a far smaller share of the total number of beds). Source: World Bank staff
Figure 24: Individuals with Jamkesmas coverage are more likely to use inpatient services a) All respondents b) Bottom three expenditure deciles (percentage of individuals using public and private facilities for inpatient care, among those who used inpatient services, by insurance type, 2009)
Source: Susenas 2009
0
20
40
60
80
100
0
20
40
60
80
100
No Insurance Jamkesmas All other insurance
Public Facility Private Facility
0
20
40
60
80
100
0
20
40
60
80
100
No Insurance Jamkesmas All other insurance
Public Facility Private Facility

I n d o n e s i a E c o n o m i c Q u a r t e r l y M a x i m i z i n g o p p o r t u n i t i e s , m a n a g i n g r i s k s
T H E W O R L D B A N K | B A N K D U N I A D e c e m b e r 2 0 1 0 29
Jamkesmas beneficiaries are better protected from shocks due to health payment
Susenas 2009 data also suggest that Jamkesmas beneficiaries are, on average, better protected from the adverse financial effects of health shocks. Compared to households without insurance, and also compared to households with other types of insurance, Jamkesmas households have systematically lower Out of Pocket (OOP) spending, conditional on utilization. This is probably because the Jamkesmas benefit package is more generous than many other types of insurance, covering almost all types of care with no copayments and few service limitations. Importantly, this protective effect was more pronounced among households of lower economic status. Jamkesmas beneficiaries also have a lower incidence of catastrophic expenditure than those with no insurance and even those with other types of insurance. Moreover, the impoverishing effect of uninsured health expenditures, whether measured in terms of the increase in the incidence of poverty or the increase in the poverty gap, is smaller.
However, lower utilization compare to other health insurance beneficiaries indicates other barriers for the poor to access service persist
Nevertheless, it is important to note health service utilization among Jamkesmas beneficiaries remains low compared to those covered by other types of insurance despite a relatively generous benefit package. This indicates that other barriers for the poor to access health services persist. These barriers may include other out-of-pocket expenses, opportunity costs, distance to facilities, perceived low quality of care of the network providers, and availability of services.
Also, OOP health expenditures remain significant among Jamkesmas beneficiaries
Also, it is important to note that OOP health expenditures – although lower than among those without coverage -- remain relatively significant among Jamkesmas beneficiaries. This may suggest that those with no health insurance coverage use less health services thus have lower out of pocket spending. This finding suggests that although Jamkesmas has shown protective effect as mentioned above, it indicates that the program has not yet provided adequate protection to health shocks. This will require further investigation, e.g., via the use of focus group discussions among beneficiaries: Are transportation costs a factor? Do users face informal or other “hidden” payments?
Leakage in targeting is a serious program weakness that needs to be addressed
The program performs relatively well in terms of increasing utilization and enhancing financial protection, but as mentioned above this remains inadequate. One of the issues is that a large share of the population which, according to their socioeconomic status, should be eligible for participation in Jamkesmas, but does not currently participate in the program. Not all of the poor are reached by the program, and there is considerable leakage to the non-poor. Part of this may be weaknesses in the program’s targeting mechanism, but part of this might be the design and the implementation of the membership management of the Jamkesmas program itself. This is serious program weakness that needs to be addressed. Nevertheless, Jamkesmas participants are, on average, of poorer socioeconomic status than those who are not covered by Jamkesmas, confirming that the program is indeed pro-poor.
Options on the role of Jamkesmas in achieving universal health insurance coverage
In relation to the Government’s intention to achieve Universal Coverage (UC), the question is the role that the Jamkesmas program, which currently accounts for two-thirds of the currently insured, will play. There are several options, including expanding the program’s coverage to all uninsured, or to vulnerable population groups only, such as women and children. Each option has its own challenges for implementation and also each has significant fiscal implications.
An expansion to additional population sub-groups financed by general revenues will have substantial fiscal implications
For the option of expanding the program to the currently uninsured, the cost for a UC program, scaled up to full UC by 2020, is projected to be between 1.04 percent of GDP (low cost scenario) and 1.46 percent of GDP (high cost scenario; both scenarios include only health insurance costs but exclude all other public spending on health) 11. To put this in context, in 2008 total health spending is 2.2 percent of GDP (WHO 2010) which is
11 Yves Guerard, “Actuarial Costing of UC Coverage Options: Model and Summary Results”, Consultant Report, World Bank Indonesia, Jakarta 2010. The basis for the Government to set the premium of the Jamkesmas program, IDR 5,000 or now IDR 6,500, per member per month (PMPM) is not based on an actuarial calculation. The World Bank conducted an actuarial study as a part of the Health Sector Review activities. The actuarial study uses data from the civil servants social health insurance (ASKES) program and once adjusted to the whole population the study calculated that the baseline cost per member per month in 2010 ranges from IDR 18,704 (low baseline) to IDR 25,662 (high baseline).
I n d o n e s i a E c o n o m i c Q u a r t e r l y M a x i m i z i n g o p p o r t u n i t i e s , m a n a g i n g r i s k s
T H E W O R L D B A N K | B A N K D U N I A D e c e m b e r 2 0 1 0 30
almost equally divided between public and private. Although the total cost projection includes general subsidies to public personnel salary and public health facilities, the magnitude of these figures still raises concerns about the option’s long-term sustainability. Moreover, 1.46 percent does not include substantial spending needs for public health and primary and preventive care, which now make up an estimated 1 percent of GDP.
In order to remain affordable, any program expansion will need to be accompanied by efficiency improvements
To remain affordable any program expansion will need to be accompanied by efficiency improvements. The introduction of Diagnostic Related Groups (DRGs)12 in hospitals as a cost containment effort has been a good start. However, the implementation of DRGs needs to be improved, and so do other cost containment measures including utilization review, provider profiling, other provider payment methods, and the gatekeeper function of primary level providers as a key part of referral system needs to be strengthened.
Important decisions need to be made in expanding existing health financing programs to achieve UC
Based on existing health financing programs, the Government of Indonesia still has to decide on the approach to achieving universal health insurance as the end goal. Theseapproaches include the National Health System (NHS)-like program or Social Health Insurance (SHI), or variant or combination of both. The Social Security Law mandated the SHI model using contributions from its beneficiaries. Regardless of the option chosenimportant decisions on the basic benefit package, provider payment mechanism and contracting arrangements and strategies to respond to supply-side constraints need to be made.
The short-term challenge of improving the targeting and the management of the existing Jamkesmas program
More immediately, while the debate on future program expansion continues, there is the short-term challenge of improving the targeting and the management of the existing Jamkesmas program. Efforts to improve targeting are ongoing, including efforts to establish a unified database for potential beneficiaries, but over and above those efforts, there are additional specific problems related to the targeting of the Jamkesmas program. These include discrepancies between data at the central and sub-national levels and also the use of different targeting criteria in different districts. Improving the program management is very important to enhance Jamkesmas’ performance. The absence of a reliable information system, for instance, prevents the Government, as well as other stakeholders, from evaluating the effectiveness of the program in achieving its objectives. Records on utilization of both inpatient and outpatient of primary level of care, referral services, and drugs, and hospital claims, can be a start for a data warehouse that provides basic information to monitor and evaluate which can be used to further develop Jamkesmas program, especially if it is considered as the stepping stone to achieve Universal Coverage.
12 Diagnostic Related Groups (DRGs) is a provider payment mechanism based on defined groups of diagnoses that are both cohesive and similar in the intensity of resources

I n d o n e s i a E c o n o m i c Q u a r t e r l y M a x i m i z i n g o p p o r t u n i t i e s , m a n a g i n g r i s k s
T H E W O R L D B A N K | B A N K D U N I A D e c e m b e r 2 0 1 0 31
3. Housing and services for low-income households in Indonesia
Indonesia is facing housing problems as its cities expand
Indonesia is facing increasing pressure on its cities as they expand. As countries urbanize, government attention on urban housing becomes increasingly important because coordination is needed to ensure provision of infrastructure, support property rights, enforce appropriate regulation, and mitigate negative externalities such as congestion and pollution. Without attention to these issues, the urban living environment can quickly deteriorate, leading to health and social problems, and reducing the benefits of urban agglomeration.
Low-income groups are particularly affected, and this can have negative impacts on the society as whole
Greater attention to the housing conditions and access to infrastructure of low-income groups is also needed, because they are disproportionately affected by housing problems and this can have negative impacts on society as a whole. For example, limited access to services can lead to the disposal of waste in rivers, lakes and other public open spaces, contaminating the ground water for all. Not only do poor housing conditions negatively impact the urban environment, they also reduce the country’s overall development potential. Housing of a decent quality is important as a space to live, and good quality housing, especially access to basic infrastructure, can bring health benefits and social stability for families and children.
The quality of housing and services in Indonesia lags behind that of comparable countries especially in access to water and sanitation facilities
The quality of housing and services in Indonesia lags behind that of comparable countries, and there seems to be a growing supply shortage. Moreover, low-income households bear a greater incidence of low-quality housing without services, even though they spend a greater share of income on housing. Compared to other countries in South East Asia, even those with lower per capita incomes, Indonesia lags behind in the provision of water and sanitation for urban households. The low access to sanitation facilities especially stands out. For example, the share of Indonesia’s urban population with access to improved sanitation is of just under 70 percent is as low as that of Cambodia, which has about a third of the US dollar per capita income.
Housing conditions in Indonesia have been improving but not to a large degree
Housing conditions in Indonesia have been improving, but not to a large degree. Figure 25 shows the share of urban households with access to infrastructure services, such as piped water, improved sewage facilities and electricity, the share of households that are built of permanent materials (e.g. concrete), and the share of households with an official title to their property from the National Land Agency (BPN). The biggest improvement in housing conditions has been in terms of construction materials; the share of houses built with permanent materials increasedfrom 60 to 85 percent from 1988 to 2007. Improvements in access to services and land titling were much lower, growing by 6 and 7 percent respectively. Yet, the incidence of quality housing is very unevenly distributed.
Figure 25: Changes in housing conditions in urban areas, 1988 - 2007 (percent of urban households)
Source: Struyk et al., 1990; Biro Pusat Statistik, 2007 Note: # Official land title indicates title from the National Land Agency (BPN)
0
20
40
60
80
100
0
20
40
60
80
100
Access to services
Permanent materials
Offical land title
1988 2007

I n d o n e s i a E c o n o m i c Q u a r t e r l y M a x i m i z i n g o p p o r t u n i t i e s , m a n a g i n g r i s k s
T H E W O R L D B A N K | B A N K D U N I A D e c e m b e r 2 0 1 0 32
Low-income households get less housing and basic services…
Low-income households have much lower rates of access to water and sanitation, worse housing conditions, and less secure property rights than higher income households do. Figure 26 shows the share of households that have access to basic infrastructure like water, sewage and electricity; housing built of permanent materials and with non-dirt floors, and housing with access to official land title, for households in different expenditure deciles. The difference in the quality of housing and the security of property rights for poorer households is clear. For example, less than half of the households in the lowest expenditure decile have access to infrastructure while almost 90 percent do so amongst the top decile.
Figure 26: Housing materials, infrastructure and land title by expenditure deciles, 2007 (share of households, percent)
Figure 27: Rent-to-income and-expenditure ratios (rent as a share of expenditure; percentage increase in rent as share of expenditure)
Source: Biro Pusat Statistik, 2007 Source: Biro Pusat Statistik, 2001, 2002, 2007
…but pay more for it relative to their total expenditures
Although low-income households experience much worse housing conditions, the poorest households spend a greater share of their income on housing than high-income households do. Figure 27 shows the rent-to-income ratio for households, again grouped by expenditures as a proxy for incomes. In 2001 poorer households dedicated more than 20 percent of incomes to housing on average, while high-income households only about 17 percent. The difference for rent-to-expenditure, from 2007, is less marked, although the poorest decile still spent proportionately more on housing than the richest.
There is an increase in the share of household expenditures dedicated to housing, particularly among low-income groups
The more dramatic trend is the increase in the share of household expenditures dedicated to housing, which is much greater among the poor. Housing expenditures have increased faster (about 1.4 times faster) than expenditures for all income groups since the recovery from late 1990s financial crisis. This increase does not necessarily represent a problem, however, as to some extent it stems from an increase in incomes and a positive income elasticity of demand for higher quality and more expensive housing. The extent to which the increase stems from demand for quality also depends on the housing market in question – some cities have seen housing prices increase as demand for land grows while in other cities housing prices have increased due to growing incomes.
Indonesia faces a problem of housing supply…
Indonesia also faces a problem of housing supply. Indeed, the government frequently cites an estimated backlog of 800,000 housing units. Analysis of household formation rates confirms that the country faces a housing shortage, and by some measures the backlog could even be twice as large as estimated by the government. These measures are extremely sensitive to assumptions, and it is thus preferable to report the facts of household formation, rather than the estimate of the supply shortage. In a housing system with adequate supply, people who wish to form a new household by moving into an independent dwelling unit should be able to do so. Examining household size and the number of adults who live in their parents’ home, who can be thought of as potential new households, can be used to measure the sufficiency of housing supply.
0
20
40
60
80
100
0
20
40
60
80
100
1 2 3 4 5 6 7 8 9 10Household Expenditure Decile
Access to Infrastructure
Permanent Materials
BPN Title
0
5
10
15
20
25
30
35
0
5
10
15
20
25
30
35
1 2 3 4 5 6 7 8 9 10
Household Expenditure Decile
Rent to income, 2001
Percentage increase in rent to expenditure (2001-2007)
Rent to expenditure, 2007

I n d o n e s i a E c o n o m i c Q u a r t e r l y M a x i m i z i n g o p p o r t u n i t i e s , m a n a g i n g r i s k s
T H E W O R L D B A N K | B A N K D U N I A D e c e m b e r 2 0 1 0 33
… as shown by the decrease in household formation rates…
In a country that is urbanizing and growing like Indonesia, it is expected that household size decreases and that middle-aged people form new households at an increasing rate. In fact, both of these trends followed these expectations during the latter quarter of the 20th century. However, these trends reversed course beginning in 2001. The share of 30 to 40 year olds classified as children, i.e. living with parents, increased from 8.7 to 12.8 percent between 2001 and 2007, and the share of people in this age range classified as children-in-law almost doubled from 2.2 to 3.9 percent. This means that more married couples are living with parents, probably since they are not able to find suitable housing.
… particularly affecting low-income households
Not surprisingly, this change has a greater effect on low-income households, who already had a lower household formation rate. This is especially true for the young, as young adults without sufficient means must live with family even after forming their own family. For example, in large cities in Indonesia, the share of people that have formed a household at the age of 18 to 30 in the lowest income quintile was 24 percent and for those in the upper-income quintile was 39 percent.
Access to land might be an important aspect of housing supply limitation
Although the exact cause of the reduction in household formation is not yet clear, strong correlations between housing affordability and household formation across cities implies that housing supply plays a major role. Given the importance of self-build housing, it is likely that access to land is playing an important role in limiting new housing supply. But, more research is needed to identify the factors leading to a constraint in housing supply.
A final, but important dimension of an evaluation of the housing sector is the connection to urban efficiency and the urban environment
A final, but important dimension of an evaluation of the housing sector is the connection to urban efficiency and the urban environment. The location of housing within cities relative to employment, for example, impacts the efficiency in terms of congestion and travel time to work. As upper-income households move to the periphery, but continue to work in the central city, they must drive longer distances to work, leading to wasted time and congestion. In addition, the organization of housing lots within neighborhoods can have important impacts on transportation and thus congestion. Superblocks with few entrances, for example, can lead to localized bottlenecks.
Housing of poor quality, can have significant negative impacts on environmental quality in cities.
Additionally, housing of poor quality, especially in terms of sewage and waste disposal systems, can have significant negative environmental impacts in cities. Far too many households in Indonesian cities discard waste into rivers or other open areas, while the use of septic tanks of low quality at urban densities can contaminate ground water. Just as there are strong arguments for economies of scale and efficiency in networked infrastructure, such as sewage and water systems, there are major negative externalities associated with not having these systems in urban areas. In spite of the limited evidence that is available, the urban efficiency implications of the location and neighborhood organization of housing in Indonesia, and the environmental impacts of limited sewage and waste disposal systems surely merit policy, as well as research attention.

I n d o n e s i a E c o n o m i c Q u a r t e r l y M a x i m i z i n g o p p o r t u n i t i e s , m a n a g i n g r i s k s
T H E W O R L D B A N K | B A N K D U N I A D e c e m b e r 2 0 1 0 34
4. Incentivizing local governments to take responsibility for water and sanitation services
Public investment in water and sanitation are projected to rise significantly in the next five years
Investments in water and sanitation are investments in development and recognized as important in achieving the other Millennium Development Goals (MDGs) targets such as eradicating poverty and hunger, achieving gender equality and reducing child mortality. The Government’s RPJMN (2010-2014) sets out an ambitious agenda for water and sanitation over the next 5 years. National government budgets for the sector, largely through the Ministry of Public Works, are expected to double for water supply and increase four-fold for environmental sanitation compared to the previous planning period. Annual special allocation grants (DAK) have also more than doubled since 2005 and will become available to support local government investments in community-based water and sanitation systems. These are signs that positive steps are being taken to curb the downward trend of water and sanitation service levels experienced in the last decade. This section reviews these trends and then focuses in on the incentives of sub-national government to provide water and sanitation services and the related policy reforms aimed at improving service provision at the local level.
Figure 28: Declining total access to improved water supply (percent of population with improved water supply)
Figure 29: Urban usage of unimproved water supply has risen (type of water supply, percent of urban population)
Source: Susenas (various years) Note: Improved water supply is piped water plus protected well, spring and pump
Source: Susenas (various years) Note: Other improved water supply is protected well, spring and pump. Unimproved is population minus piped and other improved supply
Access levels to piped water are low following years of poor cost-recovery…
The rate of urban access to piped water supply has been declining (Figure 28). This trend started at the turn of the century with recent evidence indicating that the trend continues. Currently only 15 percent of the population – 25 percent in urban areas (Figure 29) – or about 27 million people - have access to piped water – an extremely low level of coverage compared to countries at similar levels of income as Indonesia. In low coverage areas, the poor are inevitably worse off – for example, about half of the poorest 10 percent relies on unsafe sources of drinking water compared to 90 percent coverage in the richest 10 percent. Current coverage levels fall far short of the Government’s targets of 32 percent of people connected to safe water sources through piped connections and a total of 70 percent with access to safe water.
…with a declining capital stock of urban water infrastructure
The state of the sector reflects rapidly declining equity in urban water utilities (PDAMs) as a result of years of poor financial viability and low levels of investments. An examination of 42 audit reports published in 2009 shows that most PDAMs’ levels of capital investments fall below the rates of asset depreciation, meaning that the capital stock is declining(Figure 31).
60
70
80
90
60
70
80
90
2006 2007 2008 2009
Total
Urban
Rural
0
20
40
60
80
100
0
20
40
60
80
100
2006 2007 2008 2009
Unimproved Other improved Piped

I n d o n e s i a E c o n o m i c Q u a r t e r l y M a x i m i z i n g o p p o r t u n i t i e s , m a n a g i n g r i s k s
T H E W O R L D B A N K | B A N K D U N I A D e c e m b e r 2 0 1 0 35
Figure 30: Quality of access to water supply and household income are highly correlated (percent of decile, 2007)
Figure 31: Depreciation in urban water utilities (PDAMs) can exceed new investment (depreciation, IDR billion in 2006, log scale)
Income decile
Source: Susenas 2007
Source: BPKP PDAM Audited Reports Note: Sample of 42 PDAMs
Urban sanitation services are gaining ground
In contrast to the picture on water supply, urban access to sanitation services has slowly, but steadily increased (Figure 32). Of note, however, is that urban sanitation service primarily means toilets flushing into a septic tank (about 70 percent) or a pit (about 20 percent) as a final point of disposal. The majority of the sanitation infrastructure that exists is due to investments by households themselves who focus on in-house and on-site facilities and not on treatment and disposal. It is not clear what portion of domestic sewage is disposed of untreated into water courses and lands, but a conservative estimate would be that at least half of it finds its way into the environment. According to a 2008 report by the World Bank’s Water and Sanitation Program, East Asia and Pacific, Indonesia is estimated to have lost an equivalent of 2.3 percent of its GDP in 2006 due to poor sanitation.13 Of the impacts evaluated, effects on health and water resources contribute the most to estimated overall economic losses, which also includes losses to tourism receipts and the environment.
Figure 32: Access to improved sanitation (percent of population)
Source: Adapted from Bappenas (2010), “Report on the Achievement of the Millennium Development Goals 2010" Note: MDG is Millennium Development Goals 13 World Bank (2008), Economic Impacts of Sanitation in Indonesia: A five-country study conducted in Cambodia, Indonesia, Lao PDR, the Philippines, and Vietnam, under the Economics of Sanitation Initiative (ESI).
0%
20%
40%
60%
80%
100%
0%
20%
40%
60%
80%
100%
1 2 3 4 5 6 7 8 9 10
Unimproved Sources Other improved sources
Bottled Water Piped Water
0.0
0.1
1.0
10.0
100.0
1000.0
10000.0
100000.0
0.0 1.0 100.0 10000.0
Investment (IDR billion in 2007), log scale
0
20
40
60
80
100
0
20
40
60
80
100
1993 1995 1997 1999 2001 2003 2005 2007 2009 2011 2013 2015
Rural
Urban
Total
62.4
76.8
TargetMDG
55.6

I n d o n e s i a E c o n o m i c Q u a r t e r l y M a x i m i z i n g o p p o r t u n i t i e s , m a n a g i n g r i s k s
T H E W O R L D B A N K | B A N K D U N I A D e c e m b e r 2 0 1 0 36
Sub-national governments have an important role to play in financing the sector
Although the urgent need for capital maintenance, renewal and investment is well recognized, the sector faces a huge agenda in enhancing investment levels. A key player in this effort will be sub-national governments to whom responsibility for water and sanitation services has been decentralized.
Good local governance is associated with improvements in water and sanitation services
A detailed analysis of six towns and cities points to good local governance as a key factor for improved service. Good governance means a situation in which sub-national governments respond to their citizens demand for water and sanitation services by making policy choices (usually an investment in the utility and supporting appropriate levels of tariffs) as well as by making utilities accountable for their performance. Towns with good governance have seen improved services, while demand for better services goes unanswered in towns with poor governance. In Ciamis, Malang and Palembang, services and investment have improved markedly over the last five or so years. In these cases, the improvements started when a new mayor was elected and made water sector improvements a priority. In Palembang, the mayor appointed a new Director of the urban water utility (PDAM). The mayor and PDAM Director agreed on a business plan to rapidly improve services. The local government supported the PDAM financially, and the PDAM in turn delivered the agreed improvements. In Palembang, the average annual increase in new connections has been 2.5 times higher since governance improved (Figure 33). In Palembang and Malang, the mayors were duly reelected, in part on their record of improving water services. Figure 33: Good Governance in Kota Palembang Leads to Better Services (number of house connections)
Source: Water and Sanitation Program, unpublished work
The national Government has initiated a number of new reform programs to assist sub-national governments in fulfilling their water and sanitation service roles and increasing their accountability
The success of governance in improving quality of service at the sub-national level raises the question of does the way in which national program are implemented reinforce good governance? In line with the RPJMN ambitions, the national government has embarked on a number of reform programs that are taking new approaches to assisting sub-national governments in fulfilling their roles and making them better accountable. For example, the Accelerated Sanitation Development for Human Settlements (“PPSP”) program is a substantial program dedicated to building capacity at the local level to pave the way for sanitation service delivery. The program will support over 300 Indonesian cities/districts develop sanitation strategies on the basis of which investment support from the central government will be provided for sanitation infrastructure. The Ministry of Public Works also continues to work with revitalizing the ‘health’ of PDAMs, ensuring first of all that a supportive policy environment is facilitated between them and sub-national governments. In relation to the debt restructuring program of PDAMs, the Ministry of Finance has put in place sanctions to PDAM owners, such as the ability to intercept fiscal transfers, in the event that arrears recur. This and other new initiatives signal a search to find new strategies that fit the new realities.

I n d o n e s i a E c o n o m i c Q u a r t e r l y M a x i m i z i n g o p p o r t u n i t i e s , m a n a g i n g r i s k s
T H E W O R L D B A N K | B A N K D U N I A D e c e m b e r 2 0 1 0 37
But, sub-national government continue to face poor incentives to operate and maintain water and sanitation infrastructure
Technical support for planning and unblocking the financing bottleneck linked to PDAM debt are definitely important steps to creating increased capacity for accountable service delivery by sub-nationals. However, the capacities developed can quickly be overwhelmed if other perverse incentives remain unaddressed. One such potentially critical issue is the lack of incentives for sub-national governments to operate and maintain investments given the way national government funds infrastructure development. This is still largely done through handing over of assets built by central agencies through deconcentration funds (dana dekonsentrasi). Aside from the pitfalls of ill suited design and rent-seeking, the off-budget approach to investment funding delinks capital development with recurrent cost provisioning in the planning and budgeting system.
In water supply, local utilities need to improve cost recovery and receive equity investments from their local government owners
In the water supply sector, there is a need to reverse the trend of poor cost-recovery and PDAMs urgently need equity infusion. At present, besides internally-generated cash, which does not generate a large enough surplus even for maintenance, equity still only largely comes from central government grants through deconcentration funds. In this scenario, sub-national governments continue to have no incentives to invest their own resources and therefore, no reason to take PDAMs to task for the efficient use of those moneys and no incentives to raise tariffs to cost-recovery levels. Tariffs can remain at deflated levels since the investment budget comes from external sources – the same situation pre-decentralization, which left utilities without adequate resources to renew assets and eventually, affecting their operations.
In urban sanitation the challenge is to put in place appropriate cost-sharing between central and sub-national government and to incentivize good operations and maintenance
In urban sanitation, for which willingness-to-pay for collection, treatment and disposal services is low and the public goods nature of the service is more prominent, there is reason for cost-sharing between central and sub-national government – the question is how can this be arranged so that sub-national governments have an incentive to operate and maintain the system? It is not likely that users will pay for the full cost of urban sanitation since households do not suffer the full cost of poor sanitation directly. This means that in order to financially sustain the system, sub-national governments will likely need to subsidize their operations and maintenance (O&M). O&M costs could range between 3-5 percent, sometimes even up to 10 percent, of the annualized capital investment. Depending on the technology chosen and system capacity, this could be seen as a significant cost given the multiple expenditure priorities of sub-national governments. Is there an incentive for sub-national governments to operate and maintain these infrastructure, where, on the one hand, the general public does not seek these services (low willingness to pay, not generally an election issue ), and on the other hand, programs promoting sanitation, at best, still only provide grants towards capital investments?
The Ministry of Finance is exploring approaches to increase sub-national responsibility for water and sanitation provision
The Ministry of Finance has been championing and exploring approaches to increasing sub-national responsibility through the improved use of budget mechanisms to fund local governments– such as reforms on to the annual special allocation grant, DAK, and the introduction of incentive grants (Water Hibah) for sub-national governments through the on-granting mechanism. At present, these reforms still only emphasize capital investment funding, but can have wider implications for incentivizing good operations and maintenance behavior. The Water Hibah program presently seeks to reimburse a part of sub-national government investments for water supply development benefiting poor households. This approach already incorporates innovations in incentives delivery since it encourages sub-national governments to ensure that the utility is able to provide working connections and since the grants are contingent on sub-national governments investing in equity in the utility. In future phases, it is conceivable to design a similar mechanism, for instance, for reimbursing part of the cost of bringing volumes of domestic waste to treatment facilities, the capital financing for which could be from other sources, such as the private sector.

I n d o n e s i a E c o n o m i c Q u a r t e r l y M a x i m i z i n g o p p o r t u n i t i e s , m a n a g i n g r i s k s
T H E W O R L D B A N K | B A N K D U N I A D e c e m b e r 2 0 1 0 38
5. National Monitoring and Evaluation (M&E) in Indonesia
Monitoring and evaluating the performance of public programs tells us to what extent public expenditures are addressing the most pressing manifestations of poverty
Program monitoring and evaluation (M&E) information increases our understanding of the government’s ability to deliver goods and services. For poor households access to public goods and services is essential because they cannot afford to purchase comparable goods in the private sector. Besides looking at changes in the overall poverty rate, usually measured in terms of household expenditures, one way to evaluate the government’s progress in alleviating poverty is through the delivery and receipt of public goods. This can be estimated as a measure of outputs and outcomes of public programs that are targeted to meet basic human needs and enhance opportunities, such as access to education, health services and infrastructure. In the context of M&E, outputs refer to the products, goods and services produced by a development intervention. In contrast, an outcome is a change in behavior or a particular condition resulting from the intervention. More specifically, M&E information can help answer questions like: Do poor children have access to public education? Do poor women receive prenatal care? Are the social safety net programs reaching their intended beneficiaries? The answers to these questions tell us about the effectiveness of the government programs focused on alleviating the most pressing manifestations of poverty.
a. International shift towards performance-informed policy making, planning and budgeting
Globally, stakeholders are demanding increased accountability and transparency from government
Globally there is increased demand for M&E information and pressure to develop systems that are responsible for producing this information. This shift is a response to stakeholders’ demands for increased transparency and accountability, and pressure for governments to demonstrate tangible development outcomes. The shift is largely influenced by the experiences of Organisation for Economic Co-operation and Development (OECD) countries.
Successful M&E systems involve the intensive use of quality and reliable information within systems robust to changes in government administration
Internationally, there exist diverse organizational configurations of M&E systems. Despite this diversity, there exists international consensus regarding three characteristics that are common to successful systems (1) intensive use of the information in policy making, planning and budgeting; (2) the information produced by the system is of sufficient quality and considered reliable; and (3) the system is sustainable in terms of its ability to withstand changes in the government’s administration (Mackay, 2010).14 In addition to these shared characteristics, there are three general models of M&E systems (Table 11).
An independent, external body may be responsible for M&E or government systems may be used in a centralized or decentralized structure
The first type of system is where an independent, external body located outside the government is responsible for carrying out M&E activities. Examples of independent bodies include civil society organizations, universities and research institutions. This system allows for the greatest transparency, accountability, and credibility of information. Disadvantages include: a lack of access to adequate information, absence of contextual knowledge, and the inability to provide comprehensive information on the whole of government programs and institutions. An example of an external body is the Bogotá Cómo Vamos initiative in Colombia (Briceño, 2010).15 The second model is a centralized system. This type of system is a powerful tool for planning and budgeting. In Chile, for example, the Management Control Division of DIPRES is located in the budget department of the Ministry of Finance. The system manages four areas of work: evaluation of programs and institutions, instruments for monitoring and supervision, institutional salary incentives, public management modernization fund. For the 2010 budget, 150 government institutions adopted approximately 1,200 performance indicators and there are 28 evaluations of programs and institutions (Briceño, 2010). The third model is a decentralized government system. The advantages of this system include: ease of access to information and high likelihood that information will be used 14 Mackay, Keith. 2010. Conceptual Framework for Monitoring and Evaluation. PREM Notes, Special Series on the Nuts and Bolts of Government M&E Systems. Number 1. World Bank: Washington D.C. 15 Briceño, Bertha. 2010. Defining the Type of M&E System: Clients, Intended Uses, and Actual Utilization. PREM Notes, Special Series on the Nuts and Bolts of Government M&E Systems. Number 2. World Bank: Washington D.C.
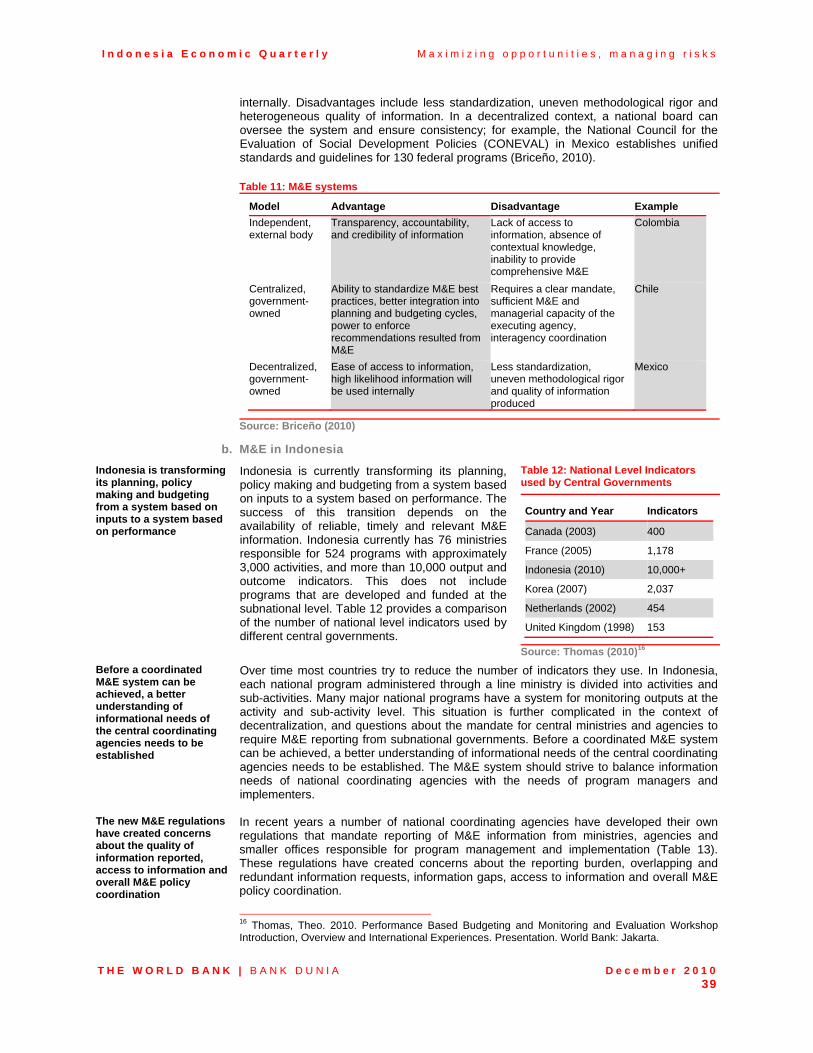
I n d o n e s i a E c o n o m i c Q u a r t e r l y M a x i m i z i n g o p p o r t u n i t i e s , m a n a g i n g r i s k s
T H E W O R L D B A N K | B A N K D U N I A D e c e m b e r 2 0 1 0 39
internally. Disadvantages include less standardization, uneven methodological rigor and heterogeneous quality of information. In a decentralized context, a national board can oversee the system and ensure consistency; for example, the National Council for the Evaluation of Social Development Policies (CONEVAL) in Mexico establishes unified standards and guidelines for 130 federal programs (Briceño, 2010). Table 11: M&E systems
Model Advantage Disadvantage Example
Independent, external body
Transparency, accountability, and credibility of information
Lack of access to information, absence of contextual knowledge, inability to provide comprehensive M&E
Colombia
Centralized, government-owned
Ability to standardize M&E best practices, better integration into planning and budgeting cycles, power to enforce recommendations resulted from M&E
Requires a clear mandate, sufficient M&E and managerial capacity of the executing agency, interagency coordination
Chile
Decentralized, government-owned
Ease of access to information, high likelihood information will be used internally
Less standardization, uneven methodological rigor and quality of information produced
Mexico
Source: Briceño (2010)
b. M&E in Indonesia
Indonesia is transforming its planning, policy making and budgeting from a system based on inputs to a system based on performance
Indonesia is currently transforming its planning, policy making and budgeting from a system based on inputs to a system based on performance. The success of this transition depends on the availability of reliable, timely and relevant M&E information. Indonesia currently has 76 ministries responsible for 524 programs with approximately 3,000 activities, and more than 10,000 output and outcome indicators. This does not include programs that are developed and funded at the subnational level. Table 12 provides a comparison of the number of national level indicators used by different central governments.
Table 12: National Level Indicators used by Central Governments
Country and Year Indicators
Canada (2003) 400
France (2005) 1,178
Indonesia (2010) 10,000+
Korea (2007) 2,037
Netherlands (2002) 454
United Kingdom (1998) 153
Source: Thomas (2010)16
Before a coordinated M&E system can be achieved, a better understanding of informational needs of the central coordinating agencies needs to be established
Over time most countries try to reduce the number of indicators they use. In Indonesia, each national program administered through a line ministry is divided into activities and sub-activities. Many major national programs have a system for monitoring outputs at the activity and sub-activity level. This situation is further complicated in the context of decentralization, and questions about the mandate for central ministries and agencies to require M&E reporting from subnational governments. Before a coordinated M&E system can be achieved, a better understanding of informational needs of the central coordinating agencies needs to be established. The M&E system should strive to balance information needs of national coordinating agencies with the needs of program managers and implementers.
The new M&E regulations have created concerns about the quality of information reported, access to information and overall M&E policy coordination
In recent years a number of national coordinating agencies have developed their own regulations that mandate reporting of M&E information from ministries, agencies and smaller offices responsible for program management and implementation (Table 13). These regulations have created concerns about the reporting burden, overlapping and redundant information requests, information gaps, access to information and overall M&E policy coordination.
16 Thomas, Theo. 2010. Performance Based Budgeting and Monitoring and Evaluation Workshop Introduction, Overview and International Experiences. Presentation. World Bank: Jakarta.

I n d o n e s i a E c o n o m i c Q u a r t e r l y M a x i m i z i n g o p p o r t u n i t i e s , m a n a g i n g r i s k s
T H E W O R L D B A N K | B A N K D U N I A D e c e m b e r 2 0 1 0 40
Table 13: Agencies and M&E Mandates in Indonesia
Agency Mandate Bappenas PP39/2006: evaluation of development plans
UKP4 Inpres 1/2010: acceleration of national development priorities
MenPAN PP09/2005: evaluation of accountability of government institutions
Ministry of Home Affairs
PP03/2007: local government management report (LPPD) to government PP06/2008: local government management evaluation guidelines
Ministry of Finance PP21/2004: design of work plan and budget ministries PP08/2006: financial and government institutions performance report
Source: World Bank staff
The current national five year plan includes a matrix with output and outcome indicators for each activity and program related to the national development priorities
The M&E reporting mandate of the National Development Planning Agency (Bappenas) is based on regulation PP39/2006. Besides the information collected by PP 39/2006, the current five year national plan (RPJMN, 2010-2014) includes a matrix with output and outcome indicators, for each activity and program that relates to a national development priority specified in the plan. Bappenas worked with each of the 76 line ministries to develop the indicators published in the matrix. Since this is the first year these indicators have been published, it remains unclear how Bappenas will collect this information and how the information will be used to support national planning and budgeting decisions.
UKP4 collects information related to tangible program milestones every two months
The Presidential Work Unit for Development Monitoring and Control (UKP4) was created to serve the president in response to information gap in Indonesia. The information collected focuses on short-term programmatic milestones that are reported to the President and his cabinet as a way of monitoring the work of the ministers, their offices, and specific programs (as opposed to the longer-term planning and policy making conducted by other coordinating agencies). Presently, the system collects information on 370 indicators, related to 155 action plans, representing 70 programs implemented by 45 line ministries.
MenPAN seeks to evaluate other government institutions
The Ministry of State Apparatus and Reform (MenPAN) evaluates performance and accountability of all government institutions. MenPAN’s mandate can be differentiated from other coordinating agencies because it seeks to evaluate government institutions, as opposed to focusing on the outputs or outcomes of a particular program (although this is a factor in their evaluation formula). Their evaluation focuses on five aspects of performance: planning, measurement, report, evaluation and achievement. Each aspect is weighted and the total score is used to rank institutions. There is no standardized form to collect this information; the ministry uses a combination of interviews, direct observation and secondary data. The results of the evaluation are reported annually to President.
The Ministry of Home Affairs monitors and evaluates development at the subnational level The
The Ministry of Home Affairs (Depdagri) also has an M&E mandate to conduct three types of evaluations that focus on the subnational level: (1) performance evaluation of local policy makers and executors (EKPPD), (2) local capacity to achieve the goals of decentralization (EKPOD), and (3) evaluation of geographic areas that recently received autonomy (EDOB). These evaluations are collaboration between a national team (led by the Ministry of Home Affairs) and local technical team. The results of these three evaluations are reported at different intervals to the President.
Ministry of Finance is currently developing a M&E system based on the principles of performance based budgeting
The Ministry of Finance is currently developing an M&E system to be implemented in 2011. The system will contain a number of indicators including budget realization, output target realization and a number of indicators on the quality of planning and quality of spending. Performance as measured against these indicators will provide the basis for a recommendation on “rewards and punishment” through budget allocation. To summarize the aforementioned national coordinating agencies have distinct spheres of influence and M&E mandates; however, there exists overlapping information needs, particularly in terms of output and outcome information and subnational information.

I n d o n e s i a E c o n o m i c Q u a r t e r l y M a x i m i z i n g o p p o r t u n i t i e s , m a n a g i n g r i s k s
T H E W O R L D B A N K | B A N K D U N I A D e c e m b e r 2 0 1 0 41
c. Moving towards performance-informed budgeting and developing a coordinated M&E system
Indonesia is shifting towards a performance informed budgeting system and an important input in this system is M&E information
Indonesia is currently moving towards a system of performance informed budgeting. A key input in this system is M&E information. The process by which the government will use this information to make resource allocation decisions is yet to be determined. The use of M&E information will require consensus regarding indicators and targets, nuanced analysis of M&E information, safeguards to protect the system from perverse incentives related to the setting of targets as well as the reporting of M&E information, and developing a system for checking the credibility of information reported.
Future steps in developing coordinated M&E systems will likely include greater information sharing, improving systems and building a consensus on indicators, formats and coordination across agencies
As Indonesia moves towards developing a coordinated M&E system, future steps will likely include a series of discussions among the key agencies. Priority areas for developing the M&E system include the sharing of information on current and planned changes to M&E systems, addressing weakness of existing agency-level M&E systems, and working towards a more coordinated national M&E system. Because of the relative newness of many of the M&E regulations and the shift in planning and budgeting from a system that is based on inputs to one that is based on performance, a number of agencies are currently developing new systems or revising old M&E regulations. There appears to be a need and scope for more information sharing across agencies regarding current and planned changes. The individual line ministries are often aware of the weakness of their own M&E systems. Some examples of weakness include, the quality of information reported, the level of detail that is collected, the reporting burden on program staff, the time it takes for information to become available to users, and reporting compliance. More support should be given to ministerial efforts to improve the overall quality and credibility of M&E information. Agencies that require M&E information across sectors have individual mandates to collectthis information, and have their own spheres of influence and information needs. Many of these mandates, however, require collecting the same or similar information, for instance, activity output and program outcome information. While at the same time, there exist information gaps that need to be addressed. Some of the greatest challenges in developing a coordinated M&E are developing consensus regarding specific indicators, reporting formats and information sharing protocols.
The system should start small and keep the international lessons about information utilization, information quality and sustainability in the forefront
In conclusion, based on international experience, it will likely take Indonesia several years to develop a fully functioning M&E system. The system should start small and keep the international lessons about information utilization, information quality and system sustainability in the forefront. This process will require intensive dialogue and policy coordination among key agencies, ministries, program managers, program implementers and subnational governmental units. The development of a coordinated M&E system will also require building capacity at all levels, particularly in terms of those designing the systems, making methodological decisions, selecting indicators, and those responsible for collecting information on the ground.

I n d o n e s i a E c o n o m i c Q u a r t e r l y M a x i m i z i n g o p p o r t u n i t i e s , m a n a g i n g r i s k s
T H E W O R L D B A N K | B A N K D U N I A D e c e m b e r 2 0 1 0 42
APPENDIX: SNAPSHOT OF THE INDONESIAN ECONOMY Figure 1: GDP growth moderates (per cent growth)
Figure 2: Contributions to GDP expenditures (quarter-on-quarter, seasonally adjusted)
*Average QoQ growth between Q1 2000 – Q3 2010. Sources: BPS, World Bank seasonal adjustment
Source: BPS via CEIC and World Bank
Figure 3: Contributions to GDP production (quarter-on-quarter, seasonally adjusted)
Figure 4: Motor cycle and motor vehicle sales (levels)
Source: BPS via CEIC Source: CEIC Figure 5: Consumer indicators (index levels)
Figure 6: Industrial production indicators (year-on-year growth)
Source: BI via CEIC Source: CEIC
0
2
4
6
8
0
1
2
3
4
Sep-03 Jun-05 Mar-07 Dec-08 Sep-10
Per cent Per cent
QoQ seas. adjust (LHS)
Year on year (RHS)
Average (LHS)*
-2
0
2
4
-2
0
2
4
Sep-07 Jun-08 Mar-09 Dec-09 Sep-10
Discrepancy Net Exports Investment
Government Private cons GDP
Per cent Per cent
-1
0
1
2
-1
0
1
2
Sep-07 Jun-08 Mar-09 Dec-09 Sep-10
Other (incl services) Retail tradeCom & trans ManufacturingMining and construction Agriculture
Per cent Per cent
0
20
40
60
80
0
200
400
600
800
Oct-06 Oct-07 Oct-08 Oct-09 Oct-10
'000
Motor vehicles (RHS)
Motor cycles (LHS)
'000
110
150
190
230
270
310
60
80
100
120
Nov-06 Nov-07 Nov-08 Nov-09 Nov-10
Index Index
BI Retail sales (RHS)
BI Consumer Survey Index
(LHS)
-30
-20
-10
0
10
20
30
-30
-20
-10
0
10
20
30
Oct-07 Jul-08 Apr-09 Jan-10 Oct-10
Per centPer cent
Cement Electricity
Industrial Production
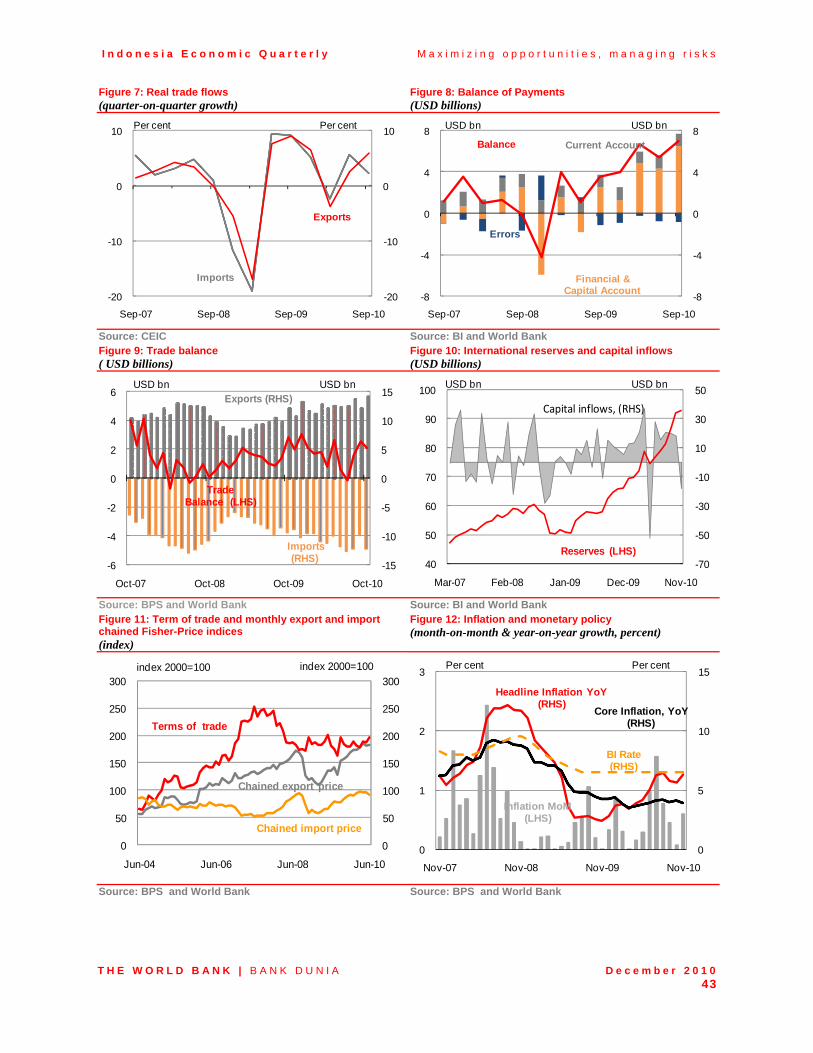
I n d o n e s i a E c o n o m i c Q u a r t e r l y M a x i m i z i n g o p p o r t u n i t i e s , m a n a g i n g r i s k s
T H E W O R L D B A N K | B A N K D U N I A D e c e m b e r 2 0 1 0 43
Figure 7: Real trade flows (quarter-on-quarter growth)
Figure 8: Balance of Payments (USD billions)
Source: CEIC Source: BI and World Bank Figure 9: Trade balance ( USD billions)
Figure 10: International reserves and capital inflows (USD billions)
Source: BPS and World Bank Source: BI and World Bank Figure 11: Term of trade and monthly export and import chained Fisher-Price indices (index)
Figure 12: Inflation and monetary policy (month-on-month & year-on-year growth, percent)
Source: BPS and World Bank Source: BPS and World Bank
-20
-10
0
10
-20
-10
0
10
Sep-07 Sep-08 Sep-09 Sep-10
Exports
Imports
Per cent Per cent
-8
-4
0
4
8
-8
-4
0
4
8
Sep-07 Sep-08 Sep-09 Sep-10
Financial & Capital Account
Balance Current Account
USD bn USD bn
Errors
-15
-10
-5
0
5
10
15
-6
-4
-2
0
2
4
6
Oct-07 Oct-08 Oct-09 Oct-10
Imports(RHS)
Trade Balance (LHS)
Exports (RHS)USD bn USD bn
-70
-50
-30
-10
10
30
50
40
50
60
70
80
90
100
Mar-07 Feb-08 Jan-09 Dec-09 Nov-10
Reserves (LHS)
USD bn USD bn
Capital inflows, (RHS)
0
50
100
150
200
250
300
0
50
100
150
200
250
300
Jun-04 Jun-06 Jun-08 Jun-10
index 2000=100 index 2000=100
Terms of trade
Chained import price
Chained export price
0
5
10
15
0
1
2
3
Nov-07 Nov-08 Nov-09 Nov-10
Core Inflation, YoY(RHS)
Headline Inflation YoY(RHS)
Inflation MoM(LHS)
Per cent Per cent
BI Rate(RHS)
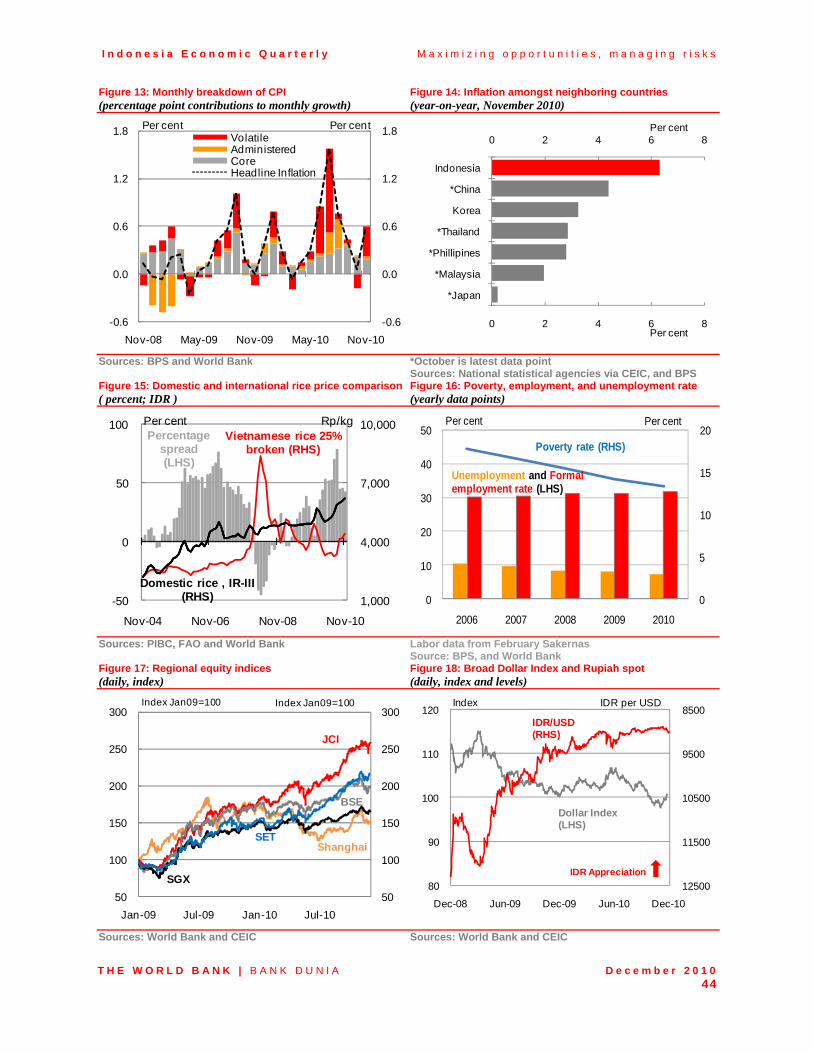
I n d o n e s i a E c o n o m i c Q u a r t e r l y M a x i m i z i n g o p p o r t u n i t i e s , m a n a g i n g r i s k s
T H E W O R L D B A N K | B A N K D U N I A D e c e m b e r 2 0 1 0 44
Figure 13: Monthly breakdown of CPI (percentage point contributions to monthly growth)
Figure 14: Inflation amongst neighboring countries (year-on-year, November 2010)
Sources: BPS and World Bank *October is latest data point Sources: National statistical agencies via CEIC, and BPS
Figure 15: Domestic and international rice price comparison( percent; IDR )
Figure 16: Poverty, employment, and unemployment rate (yearly data points)
Sources: PIBC, FAO and World Bank Labor data from February Sakernas Source: BPS, and World Bank
Figure 17: Regional equity indices (daily, index)
Figure 18: Broad Dollar Index and Rupiah spot (daily, index and levels)
Sources: World Bank and CEIC Sources: World Bank and CEIC
-0.6
0.0
0.6
1.2
1.8
-0.6
0.0
0.6
1.2
1.8
Nov-08 May-09 Nov-09 May-10 Nov-10
VolatileAdministeredCoreHeadline Inflation
Per cent Per cent0 2 4 6 8
0 2 4 6 8
*Japan
*Malaysia
*Phillipines
*Thailand
Korea
*China
Indonesia
Per cent
Per cent
1,000
4,000
7,000
10,000
-50
0
50
100
Nov-04 Nov-06 Nov-08 Nov-10
Domestic rice , IR-III (RHS)
Vietnamese rice 25% broken (RHS)
Percentagespread(LHS)
Per cent Rp/kg
0
5
10
15
20
0
10
20
30
40
50
2006 2007 2008 2009 2010
Per cent Per cent
Unemployment and Formal employment rate (LHS)
Poverty rate (RHS)
50
100
150
200
250
300
50
100
150
200
250
300
Jan-09 Jul-09 Jan-10 Jul-10
Index Jan09=100 Index Jan09=100
SGX
JCI
SETShanghai
BSE
8500
9500
10500
11500
1250080
90
100
110
120
Dec-08 Jun-09 Dec-09 Jun-10 Dec-10
Index
IDR/USD (RHS)
Dollar Index (LHS)
IDR Appreciation
IDR per USD

I n d o n e s i a E c o n o m i c Q u a r t e r l y M a x i m i z i n g o p p o r t u n i t i e s , m a n a g i n g r i s k s
T H E W O R L D B A N K | B A N K D U N I A D e c e m b e r 2 0 1 0 45
Figure 19: 5 Year local currency bond yields (daily, percent)
Figure 20: Sovereign USD Bond EMBI Spreads (daily, basis points)
Sources: World Bank and CEIC Sources: World Bank and CEIC Figure 21: International commercial bank lending (monthly, index)
Figure 22: Banking sector financial indicators (monthly, percent)
Sources: World Bank and CEIC Sources: BI and World Bank
0
5
10
15
20
0
5
10
15
20
Dec-08 Jun-09 Dec-09 Jun-10 Dec-10
Per cent
Philippines
United States
Thailand Malaysia
Indonesia
Per cent
-150
-100
-50
0
50
100
150
200
0
150
300
450
600
750
900
1050
Dec 08 Jun 09 Dec 09 Jun 10 Dec 10
Basis points Basis points
Indonesian EMBI USDbond spreads (LHS)
Indo sreads less Global EMBI average (RHS)
90
110
130
150
170
90
110
130
150
170
Jan-08 Sep-08 May-09 Jan-10 Sep-10
Index Jan08=100 Index Jan08=100
USA
Thailand
Singapore
Indonesia
India
Malaysia
0
2
4
6
8
10
0
20
40
60
80
100
Jan-06 Dec-06 Nov-07 Nov-08 Oct-09 Sep-10
Capital Adequacy Ratio (LHS)
Return on Assets Ratio (RHS)
Loan to Deposit Ratio (LHS)
Percent Percent
Non-Performing Loans (RHS)

I n d o n e s i a E c o n o m i c Q u a r t e r l y M a x i m i z i n g o p p o r t u n i t i e s , m a n a g i n g r i s k s
T H E W O R L D B A N K | B A N K D U N I A D e c e m b e r 2 0 1 0 46
Table 14: Budget outcomes and estimates (IDR trillion)
Note: *World Bank revenue forecasts are based on a different methodology to the government to derive projections for nominal GDP (see Part C of the June 2010 IEQ for a full discussion). Source: MoF and World Bank estimates.
Table 15: Balance of Payments (USD billion)
Note: * Reserves at end-period. Source: BI and BPS.
2009 2010 2010 (p) 2010 (p) 2011 (p)
ActualRevised Budget
Semester 1 report
WB estimates
Budget
A. State revenues and grants 848.8 992.4 994.7 968.4 1,104.91. Tax revenues 619.9 743.3 738.9 708.9 850.3
o/w natural resources 317.6 362.2 360.9 349.4 420.5 - Oil and gas 50.0 55.4 55.3 52.2 55.6 - Non oil and gas 267.5 306.8 305.6 297.2 364.9
2. Non tax revenues 227.2 247.2 253.9 257.5 250.9o/w natural resources 139.0 164.7 164.7 157.3 163.1
- Oil and gas 125.8 151.7 151.5 141.2 149.3- Non oil and gas 12.8 13.0 13.2 16.2 13.8
B. Expenditure 937.4 1,126.1 1,089.8 1,037.5 1,229.61. Central government 628.8 781.5 742.4 694.6 836.62. Transfers to the regions 308.6 344.6 347.4 342.9 393.0
C. Primary balance 5.2 -28.1 5.7 26.0 -9.4
D. SURPLUS / DEFICIT (88.6) (133.7) (95.1) (69.1) (124.7)Deficit (per cent of GDP) (1.6) (2.1) (1.5) (1.1) (1.8)
2010
2008 2009 Q1 Q2 Q3 Q4 Q1 Q2 Q3
Balance of Payments -1.9 12.5 4.0 1.1 3.5 4.0 6.6 5.4 7.0
Per cent of GDP -0.4 2.3 3.5 0.8 2.4 2.6 4.1 3.1 3.8
Current Account .1 10.7 2.5 2.5 2.1 3.6 2.0 1.8 1.3
Per cent of GDP 0.0 2.0 2.2 1.9 1.5 2.4 1.2 1.0 0.7
Trade Balance 9.9 21.0 4.1 5.1 5.0 6.8 5.2 5.2 5.2
Net Inome & Current Transfers -9.8 -9.2 -1.6 -2.1 -2.3 -3.2 -3.2 -3.4 -3.9
Capital & Financial Accounts -1.8 3.5 1.6 -1.8 2.5 1.3 4.8 4.4 6.5Per cent of GDP -0.4 0.6 1.4 -1.4 1.7 0.8 3.0 2.5 3.5
Direct Investment 3.4 1.9 .5 .4 .5 .6 2.3 2.0 2.5Portfolio Investment 1.8 10.3 2.0 1.9 3.0 3.5 6.2 1.1 6.1Other Investment -7.3 -8.8 -.8 -4.1 -1.0 -2.9 -3.6 1.3 -2.1
Errors & Omissions -.2 -1.8 -.1 .4 -1.1 -.9 -.2 -.8 -.8
Foreign Reserves* 51.6 66.1 54.8 57.6 62.3 66.1 71.8 76.3 86.6
2009