Embed Size (px)
Citation preview

Coral Reef Rehabilitation and Management Program—Coral Triangle Initiative Project (RRP INO 46421)
Supplementary Document 18 Subproject Appraisal for Bintan
Indonesia: Coral Reef Rehabilitation and Management Program—Coral Triangle Initiative Project

Coral Reef Rehabilitation and Management Program—Coral Triangle Initiative Project
Subproject: MPA Management Effectiveness and Livelihoods Improvement in Bintan District MPA, Indonesia

Acronyms used ADB - Asian Development Bank Bupati - District Mayor CBD - Convention on Biodiversity CF - Capture Fisheries COREMAP - Coral Reef Rehabilitation and Management Project CT - Coral Triangle CTI - Coral Triangle Initiative DG - Directorate General GEF - Global Environment Facility GoI - Government of Indonesia ha - hectare KKJI - Directorate of Marine and Aquatic Resources Conservation km - kilometer LIPI - National Science Agency MCSI - Marine Conservation and Small Islands MMAF - Ministry of Marine Affairs and Fisheries MPA - Marine Protected Area NCB - national competitive bidding NGO - nongovernment organization PES - payment for ecosystem services PMO - Project Management Office Rp - Rupiah SOE - state owned enterprise SOP - standard operating procedure UPT - Technical Implementation Unit USD - United States Dollar

TABLE OF CONTENTS
I. SUBPROJECT SUMMARY................................................................................................. 1 II. SUBPROJECT CONTEXT AND RATIONALE .................................................................... 2
A. Need for the Investment............................................................................................ 2 1. Biodiversity and Ecological Features ................................................................... 2 2. Threats to Biodiversity and Fisheries ................................................................... 7 3. Designation as District Based MPA ...................................................................... 7 4. Importance of tourism and livelihood support ....................................................... 7 5. Socioeconomic Considerations ............................................................................ 8 6. Subproject rationale ............................................................................................10 B. Subproject Objectives ..............................................................................................10
III. SUBPROJECT DESIGN ....................................................................................................11 A. Subproject Description .............................................................................................11 1. Institutional Strengthening ....................................................................................11 2. Biodiversity Conservation and ecosystem based fisheries management...........11 3. Basic MPA infrastructure and livelihoods improvement .........................................12 4. Project management and impact monitoring .........................................................13 B. Socioeconomic Analysis ..........................................................................................13 1. Livelihood Sources ...............................................................................................13 2. Poverty .................................................................................................................14 3. Gender .................................................................................................................15 4. Social and Cultural Landscape (Indigenous Peoples / Ethnic Minorities) ..............15 C. Social and Environmental Safeguards .....................................................................18 1. Social Safeguards .................................................................................................18 2. Environmental Safeguards ....................................................................................19 3. Gender .................................................................................................................19
IV. INVESTMENT AND FINANCING PLAN.............................................................................20 A. Cost Estimates ......................................................................................................20 B. Financing Plan .........................................................................................................20
V. IMPLEMENTATION ARRANGEMENTS ............................................................................20 A. Subproject Implementation Roles ............................................................................20 1. Ministry of Marine Affairs and Fisheries (MMAF)...................................................20 2. Ministry of Tourism ..............................................................................................21 3. Directorate General, Marine, Coasts and Small Islands (MCSI) and PMO ........21 4. Technical Implementation Unit, Padang (BPSPL) - Spatial Planning for Sea, .... Coastal, and Small Islands ...................................................................................21 5. MPA District Fisheries Office (UPT Bintan) – Project Implementation Unit ........22 6. District Fisheries Office and Community Surveillance Units ..................................23 7. National Science Agency (LIPI) ............................................................................24 B. Implementation Schedule ........................................................................................25 C. Financial Management ............................................................................................28 1. Preparation of Annual Budgets and Work Plans ...................................................28 2. Accounting, Financial Reporting and Audit Arrangements ....................................28 D. Procurement .............................................................................................................29 1. Procurement Methods ..........................................................................................29 2. Procurement Plan .................................................................................................30
VI. RISKS AND RISK MITIGATION ........................................................................................30 VII. INDICATORS AND TARGETS ..........................................................................................31 LIST OF APPENDICES 1. Subproject Investment Cost Details

I. SUBPROJECT SUMMARY 1. The Bintan Regency is internationally considered to be an attractive tourist destination for Southeast Asians entering Indonesia through Singapore and through Hong Kong, China. It has high conservation value in some areas based on its levels of endemic fauna and also being the natural habitat of the dugong, which is under serious threat. The Bintan Regency (District) Kepulauan Bintan covers 88,038.54 km2 of which the total land area is only 2.21% or 1,946.13 km2. One of the areas with the highest coral diversity is the group of Tambelan islands with an area of about 90.96 km2 and is the farthest subdistrict in Bintan Regency and located in the middle of the Natuna Sea. 2. Under Coral Reef Rehabilitation and Management Program—Coral Triangle Initiative Project (COREMAP—CTI), Bintan District MPA plans to undertake an investment of over $4.20 million and Rp4.95 billion over a period of five years (2014-2018) to enhance management effectiveness and environmentally sound tourism. The Bupati has declared the seriously threatened dugong to be a flagship of Bintan and efforts supported by GEF and UNEP previously have achieved the establishment of a seagrass sanctuary on the eastern side of Bintan island. 3. The outputs to achieve improved management effectiveness are: (i) institutional strengthening; (ii) biodiversity and ecosystem assessments regularly updated; (iii) MPA infrastructure operational and local livelihoods enhanced; and (iv) project management and monitoring. Tourism based revenue streams, including fees and charges are to flow towards increasing financial sustainability of MPA operations. In particular, Women’s groups that have done exceedingly well under COREMAP II, such as POKMAS Bandeng in Malang Rapat village, are to receive continued support to expand, diversify, and link up to external markets, thus boosting revenues for the members of the POKMAS. 4. In addition, it is estimated that investments will generate incremental benefits for at least 300 households involved in tourism related activities and mariculture by 2018. Furthermore, by 2018, coral reef and ecosystem health is expected to evidence enhancement of live coral cover in protected zones increasing to above the average of 50%, reduction in coral damage from destructive fishing practices and maintenance of density of coral reef fish and mangroves where these currently appear (baseline of 2010-2014). 5. Under COREMAP—CTI, the investments are to be sourced from an ADB loan, GEF grant, and the Government of Indonesia. Investments in Bintan are expected to contribute to overall objectives of COREMAP—CTI. By 2018, it is expected that baselines of biodiversity and ecosystem health will be updated and monitoring data uploaded on a website, nature based tourist numbers increased, tourism revenue streams consolidated, and dugong management plan implemented. Investments under COREMAP—CTI are expected to leverage private sector funding under corporate social responsibility (CSR) and, if possible, a payment for ecosystem services (PES) to maintain dugong habitat and increase population numbers.

2
II. SUBPROJECT CONTEXT AND RATIONALE
A. Need for the Investment
6. The total area of Bintan Regency is recorded at 88,038.54 km2 of which the total land area is only 2.21% or 1,946.13 km2. The largest subdistrict is Gunung Kijang with 344.28 km2. Tambelan subdistrict is the smallest in area at about 90.96 km2 and is the farthest subdistrict in Bintan Regency. This area is a group of islands located in the middle of the Natuna Sea. Tambelan has high coral diversity, but is vulnerable to the use of explosives for fishing activities in the area. Bintan consists of 240 large and small islands but only 39 islands are populated and the remaining though not yet populated, are under agricultural crops.
1. Biodiversity and Ecological Features
7. In 2008, a baseline survey was conducted to estimate condition of live coral by categories in the Gunung Kijian and Bintan Pesisir subdistricts, the details of which have been documented in the table below. The baseline data needs to be updated. Table 1. Condition of Coral Reefs in Gunung Kijang and Bintan Pesisir Sub-districts
Area I II III IV V
No. of Station 7 10 13 6 5
Dead coral with algae 59.91 61.72 52.87 0.95 76.99
Dead coral 1.69 1.13 4.25 2.31 1.03
Live coral 29.21 29.77 37.12 7.85 14.85
LIVE CORAL BY CATEGORY
Non Acropora
Coral encrusting 21.43 9.42 15.53 11.76 21.46
Coral branching 14.29 11.63 8.20 5.88 14.29
Coral foliosa 14.29 9.39 14.65 11.76 14.29
Coral massif 14.29 23.28 17.50 17.65 14.29
Coral submassif 14.29 12.71 15.83 17.65 14.29
Coral mushroom 7.14 6.51 8.27 5.88 7.14
Coral meliopora 0.00 0.00 2.00 0.00 0.00
Coral heliopora 0.00 1.00 2.00 0.00 0.00
Acropora
Acropora branching 7.13 12.36 5.10 5.88 7.13
Acropora encrusting 0.00 8.66 4.90 5.90 0.00
Acropora submassif 0.00 1.94 3.40 5.88 0.00
Acropora digitata 0.00 3.00 0.00 0.00 0.00
Acropra tabular 7.14 4.08 4.61 11.76 7.14
DIVERSITY INDEX 2.95 3.00 3.35 2.55 2.63
CSI 0.29 0.31 0.32 0.22 0.16 Source: CORMEMAP II Bintan District. 2008. Jakarta. Ground Check.
8. Along the northern coast of Bintan Island a recent survey of five reef sites were carried out to determine the most recent condition of the benthic and fish communities.1 Fourteen years of resort development on the island have elapsed since the survey in 1993 and the survey used
1 Loke Ming Chou et al. 2010. Temporal Changes in Reef Community Structure at Bintan Island (Indonesia) Suggest
Need for Integrated Management. Honolulu. Vol. 64, no. 1:99–111.

3
several diversity measures to compare the reefs then and in 2007. Abundance of hard corals and fish remained high (average of >50% coral cover and >0.7 fish/m3), but taxonomic richness was compromised. In 2007-2008, the most common taxa accounted for greater proportions of fish counts at all sites and of coral cover at three of four comparable sites. These shifts in coral and fish assemblages may be explained by freshwater influences and development along the north coast of Bintan Island. Because the local community and tourism industry still rely heavily on the reefs, implementing a comprehensive, integrated coastal management plan may mitigate further reef declines and promote sustainable use. 9. The 2008 baseline conducted by COREMAP II also extends to information presented separately for Tambelan subdistrict, the details of which have been documented in the table below. The cluster of coral reefs found in Tambelan Islands are fringe reefs and submerged reef (gosong) with the average range covering 31,261.8 km2. Based on observations, there are 181 species of stony corals belonging to 18 genera. Live coral cover ranges from 10%-90% with an average of 47.39% so that the live coral reef area is estimated to reach 14,815 km2. Reef fish species found in these waters are among others: Pomacentrus moluccensis, Lutjanus decussates, Amblyglyphidodon curacao, Chaetodon octofaciatus, Paraglyphidodon nigrosis, Abudefduf sexfaciatus, Thalassoma lunare. In addition, mega benthos is also found, namely Acanthaster planci, Diadema setosum, and clams.
Table 2. Condition of Coral Reefs in Tambelan Sub-district
Area I II III IV
No. of station 8 15 5 4
Dead coral with algae % 14.92 34.09 38.17 7.79
Dead coral % 28.67 11.72 19.67 54.78
Live coral % 49.92 32.25 35.60 27.02
LIVE CORAL BY CATEGORY
Non Acropora
Coral encrusting 14.29 12.53 11.76 9.42
Coral branching 11.63 8.20 5.88 14.29
Coral foliosa 9.39 14.65 11.76 14.29
Coral massif 23.28 17.50 17.65 14.29
Coral submassif 12.71 15.83 17.65 14.29
Coral mushroom 6.51 8.27 5.88 7.14
Coral meliopora 0.00 2.00 0.00 0.00
Coral heliopora 1.00 2.00 0.00 0.00
Acropora
Acropora branching 12.36 5.10 5.88 7.13
Acropora encrusting 8.66 4.90 5.90 0.00
Acropora submassif 1.94 3.40 5.88 0.00
Acropora digitata 3.00 0.00 0.00 0.00
Acropra tabular 4.08 4.61 11.76 7.14
Diversity Index 3.53 3.00 2.74 2.55
CSI 0.32 0.30 0.31 0.22 Source: COREMAP II Bintan District 2008, Riau University 2008, and Ground Check.
10. Of particular importance is also seagrass as dugongs feed on these. Tables below document the status of seagrass as at baseline in 2008 in the Bintan subdistricts. Not all areas have high cover and community efforts with GEF and UNEP support was undertaken in Trikora,

4
eastern Bintan to establish a seagrass sanctuary. Table 3. Percentage Cover and Diversity of Sea Grass Species in Gunung Kijang, Bintan
Pesisir and Tambelan Sub-districts
Area Transect No. Cover (%) Category Diversity (H’) Category
I 8 20.00 Low 1.76 Low
II 16 22.92 Low 3.0 Low
III 27 26.25 Moderate 2.36 Moderate
IV 10 31.04 High 1.78 High
V 13 39.76 High 2.09 High
Tambelan
I 17 34.10 High 3.01 High
II 27 25.73 Moderate 2.51 Moderate
III 15 22.51 Low 1.96 Low
IV 10 21.11 Low 1.73 Low
Source: COREMAP II Bintan District 2008, Riau University 2008 and Ground Check.
11. A Seagrass Sanctuary has been declared near the village of Penduang, which is managed by the local community. The sanctuary was initiated by Trikora Seagrass Management Demonstration site (TRISMADES), a project aimed to safeguard the seagrass ecosystem in east Bintan, supported by GEF, LIPI and United Nations Environment Program (UNEP). Prior to the operation of TRISMADES, the local people sometimes hunted the dugongs for food. After a 3-year intensive campaign by TRISMADES to save the seagrass and their associated marine biota, the local people now appreciate the existence of the dugongs living in their vicinity. The accidents of dugongs entering into fishermen gear, however, still cannot be avoided. The Bupati (Head of District) of Bintan has paid special attention and commitment to save the dugongs. The Bupati has declared the dugong as a flagship animal or icon of the District. A special regulation has been issued by the local government to protect this rare marine mammal. This is one area, where a potential payment for ecosystem services (PES) or compensation agreement can be pursued/developed, wherein a partnership with a nongovernment organization, private sector (resorts) and LIPI can “buy” services of the fisherfolk not to fish in dugong areas with nets and gear that are hazardous to dugongs, and in return the “sellers” of this “abstention” (not to exercise their traditional right) should receive “agreed” payments in a community revolving fund as “compensation” for the service provided. This needs to be further explored during implementation of COREMAP—CTI (2014-2018). 12. The most recent surveys in 2010 were carried out in Tambelan, Pulau Mapur and Pulau Numbing. The results are provided in tables below.

5
Table 4. Coral Reef Ecology in Bintan District, 2010 (Pulau Tambelan, Pulau Mapur and Pulau Numbing)
Indicator P. Tambelan P. Mapur P. Numbing Live coral 72.63% 67.27% 53.68% Coral Fish (Number of individual/ 350m2)
Indicator Fish 17.67 16.50 16.17 Target Fish 103.08 112.50 81.17 Major Fish 575.17 535.50 323.17
Mega benthos (Number of individual/ 140m2)
A planci 0.75 0.00 0.00 Diadema sp 64.58 91.83 74.59 Drupella sp 1.33 14.17 0.00 Large Giant Clam 0.92 2.00 0.17 Small Giant Clam 4.00 0.83 0.17 Large Holothuria 0.92 0.00 0.17 Small Holothuria 0.33 0.00 0.00 Lobster 0.08 0.33 0.00 Trochus sp 1.08 2.33 0.00
DCA (Turf Algae) + FS (Macro Algae)
17.28% 25.52% 29.25%
DC (Dead Coral) + R 4.40% 0.07% 5.05% Abiotic (Rubble, Sand, Silt, Rock) 0.39% 3.22% 9.38% Source: BME Ecology P. Tambelan, P. Mapur and P. Numbing, Bintan District, LIPI 2010
Table 5. Abundance of Coral Fish based on Species in Bintan District 2010
No
Pulau Tambelan Pulau Mapur Pulau Numbing
Species # of
Individual Species
# of
Individual Species
# of
Individual
1 Pomacentrus lepidogenys 2,606 Neopomacentrus
anabatoides
459 Neopomacentrus anabatoides
338
2 Pomacentrus moluccensis 2,404 Caesio teres 365 Caesio teres 287
3 Lepidozygus tapeinosoma 1,300 Chromis viridis 261 Amblglyphidodon curacao
165
4 Caesio cuning 1,290 Pterocaesio tile 254 Apogon quenquelineatus
109
5 Pomacentrus alexanderae 1,191 Pomacentrus moluccensis 214 Neoglyphidodon nigroris
89
6 Amblglyphidodon curacao 1,067 Amblglyphidodon curacao 193 Pomacentrus alexanderae
85
7 Chromis atripectoralis 910 Apogon quenquelineatus 151 Lutjanus carponottatus
82
8 Chromis viridis 694 Pomacentrus alexanderae 137 Archamia goni 77
9 Chromis ternatensis 523 Neoglyphidodon nigroris 132 Apogon chrysopomus
69
10 Halichoeres melanurus 501 Dascyllus reticulatus 109 Chaetodon octofasciatus
65
11 Abudefduf sexfasciatus 377 Apogon cyanosoma 90
12 Neopomacentrus azysron 334 Spratelloides sp 87
13 Pterocaesio tile 303 Chaetodon octofasciatus 79
14 Pterocaesio crysozona 300 Abudefduf sexfasciatus 73
15 Thalassoma lunare 247 Chromis caudalis 57
16 Abudefduf vaigiensis 213
17 Halichoeres trimaculatus 156 18 Chromis weberi 136 19 Diproxtacanthus xanthurus 120 20 Dascyllus reticulatus 110
Source: BME Ecology P. Tambelan, P. Mapur and P. Numbing, Bintan District, LIPI 2010.
Table 6. Abundance of Coral Fish based on Genera in Bintan District 2010

6
No P. Tambelan P. Mapur P. Numbing
Genera # of Individual Genera # of Individual Genera # of Individual
1 Pomacentridae 12,428 Pomacentridae 1,994 Pomacentridae 1,188 2 Caesionidae 1,999 Caesionidae 624 Apogonidae 306 3 Labridae 1,378 Apogonidae 412 Caesionidae 292 4 Scaridae 280 Labridae 282 Labridae 245 5 Apogonidae 212 Scaridae 180 Lutjanidae 108 6 Chaetodontidae 125 Chaetodontidae 99 Sphyraenidae 106 7 Lutjanidae 74 Lutjanidae 88 Chaetodontidae 97 8 Siganidae 38 Clupeidae 87 Nemipteridae 69 9 Pseudochromidae 36 Nemipteridae 43 Scaridae 68 10 Scolopsidae 26 Holocentridae 41 Pomachantidae 13 11 Serranidae 24 Labridae 37 Serranidae 13 12 Monodactilidae 15 Pomacanthidae 31 Centriscidae 9 13 Pomachantidae 11 Serranidae 22 Mullidae 6 14 Kypphosidae 7 Siganidae 20 Holocentridae 5 15 Acanthuridae 6 Mullidae 15 Haemulidae 4 16 Lethrinidae 6 Sphyraenidae 14 Letthrinidae 4 17 Monacanthidae 6 Pempheridae 3 Siganidae 4 18 Bleniidae 4 Muraenidae 2 Monacanthidae 2 19 Carangidae 4 Ostraciidae 1 Bleniidae 1 20 Ephippidae 4 Carangidae 1 Dasyatidae 1 21 Nemipteridae 3 Muranidae 1 22 Cirrhitidae 2 23 Pinguipedidae 1
Source: BME Ecology P. Tambelan, P. Mapur and P. Numbing, Bintan District, LIPI 2010
13. Mangrove ecosystems are found in Gunung Kijang, Bintan Pesisir and Tambelan Subdistricts. Mangrove species that can be found are Rhizopora mucronata, Bruguiera gymnorhiza, Soneratia alba, Rhizopora stylosa, Xylocarpus mluccensis, Rhizopora apiculata, Lumnitzera littorea, Heritiera litoralis, Ceriops tagal, and Excoecaria agallocha.
Table 7. Density and Diversity of Mangroves in Gunung Kijang and Bintan Pesisir and
Tambelan Sub-districts
Area Diversity (H’) Category Density (Tree/Ha)
Category
I 0.76 Low 115 Low
II 0.34 Low 178 Moderate
III 3.12 High 151 Moderate
IV 2.70 Moderate 379 High
V 3.20 High 264 High
Tambelan
I 3.22 High 115 Moderate
II 2.34 Moderate 100 Moderate
III 0 -- 0 -
IV 0 -- 0 - Source: COREMAP II Bintan District 2008, Riau University 2008 and Ground Check.
14. Sporadic efforts (on World Environment Day) have been undertaken to replant mangrove areas using volunteers / school children. These efforts need a systematic plan and intensive mangrove rehabilitation efforts to maintain coastal area integrity given the increased developmental activities in Bintan.

7
2. Threats to Biodiversity and Fisheries
15. There has been a general decline of economically useful coral fish species in Bintan. Moreover, use of destructive fishing practices, such as dynamiting, is increasing destruction of the coral reefs. There are reports of dugongs (Dugong dugon) being accidentally trapped in fishing gear / nets, particularly near villages known to have extensive seagrass meadows, although the local people try to relieve the dugong and release it safely back to the open waters. It is important to forge an alliance between local communities and tour operators / tour associations to enter into a public private partnership (PPP) to save some of the remaining coral reef areas, dugong feeding grounds of seagrass, and the commercially useful fisheries grounds.
16. There are several causes of threat to dugongs: among others it is coastal development that degrades the coastal environment, habitat loss, logging and mining, land-based and sea-based pollution, oil spill, destructive fishing, accidental catches, hunting, and boat strikes. The Dugong has been protected under the Indonesian Law No. 7, 1999 on the Conservation of Flora and Fauna. The law enforcement, however, is very weak. The personnel and resources to enforce the law are inadequate to cope with the large extent of Indonesian waters. Recently, a document on the strategy and action plan for dugong conservation in Indonesia was published jointly by the Research Centre for Oceanography (Indonesian Institute of Sciences-LIPI) and the Directorate for Regional and Fish Conservation (Ministry of Marine Affairs and Fisheries) (Hutomo et al. 2012). A regional cooperation on dugong conservation is also under preparation with GEF/UNEP CMS (Convention on Migratory Species).
3. Designation as District Based MPA 17. The legal basis for the establishment of a Marine Protected Area in Bintan is the Bintan Regency Decree No. 261/VIII/2007 (SK Bupati Bintan No. 261/VIII/2007) issued on August 23, 2007. The Marine Protected Area size is 479,905 hectares prioritized to support sustainable fishery practices and marine ecotourism. 4. Importance of Tourism and Livelihood Support 18. Bintan can boast of unspoiled white beaches in the East, aquatic life and beautiful scenery; it has become one of the most visited islands in the area and is gradually becoming a popular tourist spot. Bintan and Batam saw huge investments and development, including industrial parks and large tourist resorts. Bintan has since become a popular tourist destination due to its close vicinity to Singapore. Bintan is located 55 minutes by ferry from Singapore, the nearest international access point and ferries leave from Tanah Merah Ferry Terminal in Singapore regularly. Currently, Singapore residents make up 47 per cent of all tourist arrivals to Bintan, and 80% of Bintan visitors arrive via Singapore. Bintan has developed into an attractive tourist destination. A new, private sector financed airport at a cost of $79 million is being built, which is expected to double tourist arrivals (estimated at 470,470 in 2011) as well as facilitate investments on the resort island. It will enhance connectivity to resorts, which are currently only accessible via ferries; it will also attract more investments in new resorts, holiday homes, food & beverage, retail and attractions, especially in the Lagoi Bay Development area. The new airport is expected to be operational in 2015 and tourist arrivals are expected to surpass current levels with a target of bringing in 1 million tourists a year to Bintan. Resorts are aiming to attract tourists from important markets such as China and India with a flying radius of about five hours. 19. COREMAP II’s most significant social impact was the empowerment of fishing

8
households and women.2 Apart from the income opportunities that they enjoyed as a result of the project, women have substantially benefited in terms of empowerment. This empowerment is evidenced by their membership in pokmas (community group), their participation in training activities, and, to a large extent, in the management of the Lembaga Pengelola Sumberdaya Terumbu Karang-LPSTK (Coral Reef Management Body). Women made up 28% of the total membership in pokmas and accounted for 15% of the total number of LPSTK officers.
Table 8: Financial Analysis of Bintan Fish Cracker Processing in Constant 2012 Prices
(Rp ‘000)
Item Year 1 Year 2 Year 3 Year 4 Year 5 Year 6 Year 7 Year 8 Year 9 Year 10 Gross income 142,500 142,500 142,500 142,500 142,500 142,500 142,500 142,500 142,500 142,500 Investment 26,662 157 245 157 245 1,605 245 157 245 157 Production cost 91,974 91,974 91,974 91,974 91,974 91,974 91,974 91,974 91,974 91,974 Total cost 118,636 92,131 92,219 92,131 92,219 93,579 92,219 92,131 92,219 92,131 Net cash flow 23,864 50,369 50,281 50,369 50,281 48,921 50,281 50,369 50,281 50,369 NPV @ 10% 284,380
NPV= net present value. Source: ADB. 2012. Completion Report: Coral Reef Rehabilitation and Management Project Phase II in Indonesia. Manila.
20. In the village of Malang Rapat, the fish cracker business is managed successfully by a women’s group called Community Group (Pokmas) Bandeng. In 2010, Pokmas Bandeng received considerable support from COREMAP II, which enabled the group to procure production equipment (gas tube, gas stove, freezer, cool box, and fish meat grinder). With this support starting from January 2011 for 4 consecutive months, the production increased to 300kg/month with prices varying according to the type of fish (mackerel and other fish) between Rp60,000 to 75,000 /kg. It is a household based enterprise that has received support from the local Fisheries Department. The LPSTK Malang Rapat has established a revolving fund, which supports its members and has invested substantial profits back into the enterprise. The markets so far have mainly been the towns of Tanjung Pinang and Batam, to which there is easy access. 21. The production group is poised to expand its business and has already invested in building a storage facility; it produces under its own label and the product has been certified; the group now is in need of capital to expand and improve the kitchen facility, procure equipment and tools to improve the diversity and quality of its products. Above all, it would benefit from technical assistance in diversifying its products, exploring markets and value chain links in the ASEAN region. Bintan’s proximity to Singapore and Malaysia is a potential asset to the group for linking up to larger markets. 5. Socioeconomic Considerations
22. The Bintan Regency consists of 10 subdistricts: Teluk Bintan, Seri Kuala Lobam, Bintan Utara, Teluk Sebong, Bintan Timur, Bintan Pesisir, Mantang, Gunung Kijang, Toapaya, and Tambelan (Table 9). Tambelan subdistrict is the farthest (360 km) from Kijang, the capital of Bintan located in Bintan Timur Subdistrict. There are 36 villages and 15 so-called urban villages.
2 ADB. 2012. Completion Report: Coral Reef Rehabilitation and Management Project Phase II in Indonesia.

9
Table 9. Population distribution of Bintan administrative districts
No Kecamatan (Subdistrict)
Luas Wilayah (km2) (Area)
Jumlah Desa No of
Villages
Jumlah Kelurahan No of Urban Villages
Jumlah KK (# of HH) Jumlah
Penduduk (Individuals)
Laki-laki (Male)
Perempuan (Female)
% Perempuan (% Female)
1 Teluk Bintan 185 5 1 2,338 8,934 4,755 4,179 46.8%
2 Seri Kuala Lobam
3 2 4,508 17,632 8,029 9,603 54.5%
3 Bintan Utara 219.25 1 4 5,706 21,193 10,643 10,550 49.8%
4 Teluk Sebong 408.34 6 1 4,798 16,019 8,527 7,492 46.8%
5 Bintan Timur 461.00 0 4 9,573 39,006 20,319 18,687 47.9%
6 Bintan Pesisir 4 0 2,030 8,005 4,390 3,615 45.2%
7 Mantang 4 0 1,033 3,896 2,128 1,768 45.4%
8 Gunung Kijang 503.12 3 1 2,851 12,007 6,575 5,432 45.2%
9 Toapaya 3 1 2,622 10,633 5,731 4,902 46.1%
10 Tambelan 169.42 7 1 1,154 4,975 2,568 2,407 48.4%
2010 1,946.13 36 15 36,613 142,300 73,665 68,635 48.2%
2009 1,946.13 33,803 139,407 72,728 66,679 47.8%
Source: National Bureau of Statistics for Bintan. 2010. Jakarta.
23. The population (see Figure 1) in 2010 was recorded at 142,300 with population density at 73 persons per km2, an increase by 2,896 or 2.07%. The largest population was recorded in East Bintan subdistrict at 39,006, but the most dense area is North Bintan subdistrict with 97 persons per km2. Mantang subdistrict has the lowest population at 3,896. 24. Distribution of male-female population is much lower for females at 48.2%, an increase from the 47.8% in 2009 despite zero maternal mortality. In 2010, Bintan recorded its available health facilities: 1 Hospital, 12 Public Health Centers, 29 Supporting Public Health Centers, 15 Outlying Health Centers, and 13 Medical Clinics. 25. The percentage of literate population aged over 10 years was recorded at 95.52%. Schools distinctly have the regular curriculum and the Islamic. This is understandable as the population by religion in Bintan consist of 86.47% Islam, 2.04% Catholic, 3.74% Protestant, 0.27% Buddhist, 7.34% Hindu and 0.15% others religions.
Figure 1. Population Distribution in Bintan Regency, 2010 (Source: Bintan Dalam Angka/ Bintan in Figures 2011)

10
6. Subproject rationale
26. Given need for protection of biodiversity (corals, coral reef fish, seagrass, dugong and mangroves) and providing a scope for increasing number of tourists to enjoy nature, learn from it, and also contribute towards its conservation, it is necessary to invest in the management effectiveness of the District based Bintan MPA. This will enable the MPA to continue updating the baseline and conduct monitoring surveys, protect the fisheries and dugongs, and provide continuing support to enhancing livelihoods.
B. Subproject Objectives 27. The outcome of the subproject is to enhance management effectiveness of District based Bintan MPA achieving the blue level status by year 5 after project start as compared to start of project. The impact or long term objective of the subproject is to conserve marine resources and flagship species sustainably. The main outputs are: (i) institutional strengthening; (ii) biodiversity conservation and ecosystem based fisheries management; (iii) basic MPA infrastructure and livelihoods improvement; and (iv) management and monitoring.

11
II. SUBPROJECT DESIGN
A. Subproject Description 1. Institutional Strengthening
28. The District based MPA in Bintan will require institutional strengthening inputs to improve MPA and regional border demarcation of various zones, disseminate information relating to the MPA and its mandate among various stakeholders, particularly local communities, and issue guidelines and SOPs for smooth functioning of MPA operations. The following activities are envisaged:
Table 10. Institutional Strengthening Activities in Bintan District MPA 1 Coral Reef Management and Institutions Strengthened
1.1 Dissemination of MPA Info and Institutional Strengthening 1.2 Determination of Legal Status by Regional Team 1.3 Supervision by Pokmas and Team MCS UPT 1.4 Study on additional diving area (Zone expansion and boundary revision) 1.5 Supervision of the preparation of standard operating procedures Region 1.6 Boundary validation and dissemination of regional boundaries Law enforcement 1.7 Preparation of Technical Guidelines 1.8 Preparation of Performance Indicators (social, economic and ecological) 1.9 Identify potential products and services in the region Indicators of a state (context) 1.10 Regional meeting of the Steering Committee and Advisory Board Products and services 1.11 Workshop on management of the border 1.12 Technical Coordination Meeting (UPT) on Communication between stakeholders and managers 1.13 Unit Operating Costs Involvement and participation of stakeholders 1.14 Area Development border meeting 1.15 Identification of Infrastructure feasibility in the Region 1.16 Setting tariffs for tourists, fines and utilization of revenue for management of the border visitor
facilities Source: Bintan District MPA Draft Management Plan, 2013.
2. Biodiversity Conservation and Ecosystem Based Fisheries Management
29. Biodiversity conservation will require doubled efforts if it is to provide protection to the last remaining Dugong population in Bintan. As the District Mayor has declared it a flagship species of the district and a seagrass sanctuary has been established with GEF support, it is important to focus inputs in species protection (coral, fish, sea grass, dugong, and mangroves). The following activities are deemed important:
Table 11. Biodiversity and Ecosystem Based Activities 2 Ecosystem-based Resource Management Developed
2.1 Training on conservation, traditional knowledge of indigenous people, conservation area management, species protection (coral reefs, coral fish, seagrass, dugongs, and mangroves), diving, marine tourism etc.
2.2 Updating of baselines (coral reef resources, coral reef fish, seagrass, dugong, and mangrove, and socioeconomic data with control points in and outside MPA
2.3 Monitoring of coral reef health, seagrass, dugong population, mangroves 2.4 Mapping of boundaries and installation of demarcation markers
2.5 Spatial Planning integrating Climate Change scenarios 2.6 Procurement of equipment, boats, vehicles, diving gear, leaflets, posters, furniture etc. Source: Bintan District MPA Draft Management Plan, 2013.

12
3. Basic MPA Infrastructure and Livelihoods Improvement
30. The Bintan District MPA needs upgrading of facilities and infrastructure to enable it to effectively manage the zoning and reach its management effectiveness targets. In addition, small scale infrastructure on a CDD basis may be requested by villages and support is to be focused on livelihoods improvement, which can be in the form of continuing support for Pokmas Bandeng, which is the Women’s Fish Processing Group as well as other groups interested in pursuing alternative livelihoods.
Table 12. MPA Infrastructure and Livelihoods Improvement
3 Sustainable Marine-Based Livelihoods (Economy) Improved
3.1 Detailed design of MPA and marine tourism infrastructure
3.2 Development of the Border UPT office
3.3 Border Area Information Center
3.4 Surveillance post and surveillance tower
3.5 Guest House and Homestay construction
3.6 Mini laboratory for environmental quality check 3.7 Water Well Drilling and Water Installation
3.8 Information and communication infrastructure
3.9 Sanitation and waste management 3.10 Fisheries infrastructure
3.11 Research Facilities and infrastructure
3.12 Alternative Livelihoods development activities (CDD approach-livelihood models) 3.13 Support to Women Fish Processing Group "Pokmas Bandeng" (TA and equipment)
3.14 Cooperation with Private Parties in Connection with Public Welfare Improvement through CSR funds
Source: Bintan District MPA Draft Management Plan, 2013.
Figure 2. Pokmas Bandeng Fish Processing Group, Malang Rapat, Bintan

13
31. Under livelihoods improvement continuing support to well performing livelihood groups from COREMAP II deserve attention and need continued support to expand, diversify and add value to their business. Such an example is Pokmas Bandeng at Malang Rapat village, operated by a Women’s Group involved in processing and marketing of fish crackers currently produced at a household level (micro production). It needs additional support to improve its kitchen infrastructure and procure additional equipment and furnishings to emerge from a household based enterprise to a micro-level enterprise with diversified products and expanded market links. For this it will need technical assistance and capital to procure equipment and improve infrastructure and its current production facility.
4. Project management and impact monitoring 32. Under project management, the activities are related to awareness raising and conducting impact monitoring.
Table 13. MPA Infrastructure and Livelihoods Improvement
4 Project Management
4.1 Dissemination of Management Plan, Strategic Plan, Zoning and Plan of Action plan, boundary demarcation, Area Management Policies on border enforcement
4.2 Monitor impact of Area Management Effectiveness, Impact / Environmental Degradation in the zoned areas, evaluation of coral reef resource, seagrass, dugong populations, mangroves, socioeconomic improvement, visitor behavior etc.
Source: Bintan District MPA Draft Management Plan, 2013
B. Socioeconomic Analysis
1. Livelihood Sources
33. In 2010, labor force was determined to be 51,826 and employment rate at 93.19%. Majority or 31.75% of employed workers come from the agricultural sector followed by trade (15.54%) and services (16.71%).
34. Agriculture. Bintan regency has vast potential area to food crops cultivation, although not optimized yet. Total potential areas reach 5.044 ha. Paddy plants are not potential in Bintan, seeing at planted field area only in three subdistricts and calculated area is only 60 ha. The harvested crops area of maize in 2010 was 246 ha it was same compared to 2009. In 2010, productivity of maize (5.34%), cassava (15.25%), sweet potatoes (12.20%), black radish (9.36%), and peanuts (10.04%) increased compared to 2009.

14
35. In 2009 the highest field crop was spinach green 2.451 tons, followed by mustard 2.262 tons. In contrast, the lowest production was 17 tons. The production at fruit crops consists of mangoes, rambutan, nangka, papaya, banana, pineapple, orange, durian, guava, sepadile, salacia and lanza. In 2010, the main fruit produced was banana at 1.323 tons, followed by papaya 962 tons. 36. Areas planted to coconut decreased by 0.385% from 5.188 ha in 2009 to 5.168 ha in 2010. Productive plant area was down to 0.52% in 2010 became 2.851 ha and production also decreased to 6,112.16 tons. 37. The large livestock population includes heads of cattle (1,036), goat (1,048), and swine (3,500) in 2010, an increase from 2009 levels. Poultry production slightly decreased in 2010. 38. Fisheries. The total fishery production increased in 2010 by 6.77% compared to production in 2009. The value of fishery production increased by 40.73%, compared to the previous year, and reached Rp222.02 billion. The total fisherfolk household in Bintan was recorded at 9,332: this trend has always been increasing since 2002. 39. Others. Tourism development is aimed to increase economic activities thus the local government encourages initiatives for the sector to increase job opportunities, improve the people’s welfare and regional income as well. The number of foreign tourists in Bintan Regency in 2010 was recorded at 313,982 persons an increase of 6.20% compared with 2009 at 295,640. Most come from Singapore, South Korea, and China.
2. Poverty 40. Table 14 shows that poverty line for Bintan is towards the lower end of the spectrum compared to the other COREMAP sites and that based on the Rp 274,721 poverty line, around 7.33% of the population is poor. In terms of poverty levels, an estimated 15% of the population is poor and/or bordering on poor and the very poor is relatively low at 2.9% of the population.
Table 14. Poverty Indicators in COREMAP Areas: Focus on Bintan Regency, 2010.
Poverty Dimension Nias Nias Selatan
Tapanuli Tengah
Bintan Natuna Batam Bintan Lingga
Poor Population
Poor Population (x1000) 25.20 60.10 52.20 15.10 3.40 69.7 10.50 13,60 % poor population 30.89 20.27 16.73 19.74 4.83 7.26 7.33 15.81 Poverty line (Rp/ Cap/month) 233,867 185,825 240,457 186,381 217,359 401,849 274,721 310,489 Level of poverty Very poor 9.88 3.30 6.63 12.42 1.71 2.33 2.94 5.53 Poor 10.09 17.42 10.10 7.33 3.13 4.93 4.39 10.28 Nearly Poor 8.92 23.49 13.01 7.88 4.54 7.53 7.71 8.39 Not Poor 71.11 55.79 70.26 72.38 90.63 85.21 84.96 75.80 % Food Expenditures Per Capita
Poor 79.93 78.45 74.14 71.20 65.63 54.28 59.62 69.16 Non-poor 75.61 73.22 67.96 76.17 59.59 46.61 55.25 62.36 All 76.47 74.30 68.99 75.19 59.88 47.35 55.57 63.44 Raskin Beneficiaries % Raskin acceptor 81.67 63.67 88.20 90.91 66.49 52.37 79.12 72.06 Average Raskin (kg) Household
16.88 30.71 15.10 32.84 21.61 17.10 18.94 10.34
Price of Raskin (Rp) 1.699 1.995 2.235 1.944 1.874 1.963 1.795 1.606 Source: BPS. 2011. Data dan Informasi Kemiskinan Kabupaten/Kota 2010.
3 Below this monthly income a person is considered poor.

15
41. Percentage of food expenditures is also used to describe the level of poverty. The poor will spend more on food than non-food items. Food expenditure in Bintan among the poor and non-poor is almost the same with just a 4-percentage point difference. One of the practical measures to help the poor in Indonesia is through direct assistance in providing rice, known as ‘beras miskin, RASKIN’ (rice for the poor). Table 14 indicates that Bintan is able to satisfactorily distribute program benefits to the poor. 42. Table 15 presents some indicators of educational level and employment status based on 2010 Central Bureau of Statistics data. Educational levels of the poor in Bintan have greater percentage reflecting aspirations for and initiatives to pursue higher education (20.21%). In the other COREMAP districts, the percentage of the same category of education is below 10%. 43. While the overall statistics for the province indicate a propensity for agri-related employment, those within COREMAP sites of Bintan are less dependent on agriculture and fisheries for employment as shown in Table 15. The poor have penetrated the formal sector in the non-agricultural (includes fisheries) sector.
Table 15. Educational Levels and Status of Employment of the Poor in Bintan Regency, 2010
Education / Employment Percent % of poor by educational levels
Elementary 40.60 Jr and Sr high 39.19
Higher education 20.21 % of poor by status of employment, formal/informal sector
Unemployed 4.96 Informal 28.78 Formal 66.26
% of poor by sector, agriculture/non agriculture Unemployed 4.96 Agriculture 26.58
Non-Agriculture 68.46 Source: BPS. 2011. Data dan Informasi Kemiskinan Kabupaten/Kota 2010. Various pages.
3. Gender
44. Table 16 shows that women enter the labor force at a much lower rate than men. Although laws and consultations consider women with equal rights, generally, women still spend more time doing domestic chores and raising the family and men do most of the productive work. Women need more access to non-traditional coastal management roles and basic life- and business-skills coupled with improved access to opportunities.
4. Social and Cultural Landscape (Indigenous Peoples / Ethnic Minorities)
45. While indigenous populations are not well recorded at the District level, data generated from the World Bank IP maps was able to show some areas in Bintan to be positive for the presence of IPs (See Table 17 and Figure 3). These will have to be validated on the ground for the subproject investment. However, based on documented IP groups in Bintan, an estimated 1.2% of the total population comprises IPs.

16
Table 16. Employment by Gender in Bintan Regency, 2010. Description Male Female Total 1. Working Age Population (person) 51,746 48,165 99,911 2. Labor Force (person) 43,381 19,355 62,736 3. Working (persons) 40,388 18,073 58,461 4. Looking for work (persons) 2,993 1,282 4,275 5. Labor Force Participation Rate (%) 83.83 40.18 62.79 6. Open Unemployment Rate (%) 6.90 6.62 6.81 7. Average Working Hour (hours/week) 49 41 47
Source: Based on National Labor Survey 2010, BPS – Statistics of Bintan Regency.
Table 17. Identified/Documented IPs in Bintan Regency
Kecamatan Village IP Name IP HH
Population IP
Population IP Geo Position Teluk Sebung Berakit Laut 40 160 Sea/coastal Teluk Sebung Berakit Laut 40 160 Sea/coastal Tambelan Pulau Mentebung IP no name 21 84 Coastal Tambelan Pulau Mentebung IP no name 21 84 Coastal Tambelan Pulau Pinang IP no name 52 208 Coastal Tambelan Pulau Pinang IP no name 52 208 Coastal
Bintan Timur Sungai Enam Laut 64 227 Sea/coastal Bintan Timur Sungai Enam IP no name 33 200 Sea/coastal Bintan Timur Sungai Enam IP no name 33 200 Sea/coastal Bintan Timur Sungai Enam Laut 64 227 Sea/coastal
Total 420 1,758 Source: World Bank IP Map
Figure 3. Identified/Documented IPs in Bintan Islands
Source: World Bank.

17
46. The Orang Suku Laut4 also regarded as the Orang asli Melayu (indigenous Malays) and as Orang Laut (Sea People) inhabit several islands of the Riau Archipelago. Just like Suku Bajau or Bajo from Sulawesi Islands, Orang Laut are often named as “kelana laut” or “sea wanderer” because of their nomadic lifestyle, spending their lives on the sea in their boats. In the 1980s, they were estimated to number between 3,000 to more than 5,000 people5, having their own “language of the sea” (bahasa laut), or more precisely, speaking various Suku Laut dialects closely related to Riau Malay. While some are at sea, others live in coastal settlements or recently built villages given to them by the government though some of still returns seasonally to their boat-dwelling way of life. 47. Their way of life is well adapted to the ecological zone of the sea, mangrove swamps and adjacent coastal areas. They navigate through the archipelago by following ocean currents and tides, winds, fishing grounds, position of the sun, moon and stars, about which they bear a remarkable knowledge. For generations, the sea and coastal places have been the life and living spaces of the Orang Suku Laut and they claim ownership to these territories based upon customary laws. They make their living from fishing and strand collecting of marine products for both subsistence and small-scale trading with Chinese middlemen (tauke). Besides this, some are seasonally employed as woodcutters and workers at the tauke's charcoal kilns. For a time they bartered some of their products for things to cover their daily needs. Nowadays, they sell and buy things instead of bartering but have not accumulated stocks, goods or money. 48. Orang Laut (Garnaz, 1993) usually dwell aboard a boat as long as the sea condition enables them to catch fish and other sea biota. They later build cottages on the coast if a monsoon is detected. Before they determine suitability of on-land settlement, they remain aboard their boat, usually 6 to 7.5 meters in length and 1.70 meters in breadth that they built themselves. The roof of the boat is made of kajang also called sampan kajang made of woven thorny pandanus. 49. A group of settlement aboard sampans usually consists of 10-15 sampan kajangs each having a nuclear family. They will move as a group led by a batin. The Orang Laut will decide to select a place for their sampans to anchor. They then build temporary cottages (sapao) on the coast and take the opportunity to repair sampans that may have been used continuously for three to four months. The sapao is a temporary cottage made of kayu bakau (Tizuphora), having bamboo flooring and kajang roof. A floating house is called rumah beranyur, which is one of the endeavors to sedentarize the Orang Laut of Batam and Bintan Island in 1991. 50. Elementary school was first introduced in 1964. On the average, 57% of them quit before graduation as they go out to sea, depending on the season and before completing elementary education. During the north wind monsoon, they operate through the seawaters of Mantang and Mapur Islands; with the east wind monsoon they are in the waters of Batam, Galang and Karas; and during the west wind monsoon they are found in the seawaters Bintan and Kelong (Zen, 1992). 51. In a study conducted by Lenhart (1997) in an Orang Suku Laut settlement within the Riau Archipelago, three labels exist: modern-minded, tradition-minded, Vand doubting minds. The three groups differed in (i) degree of sedentarism and their descent, (ii) readiness to interact with non-Orang Suku Laut and their acceptance of outside influences, and (iii)
4 L. Lenhart. (1997) Orang Suku Laut ethnicity and acculturation. In: Bijdragen tot de Taal, Land- en Volkenkunde, Riau in transition 153 (1997), no: 4, Leiden, 577- 604.
5 Walikotamadya Kepala Wilayah Kotamadya Administratif Batam 1986:36

18
importance attached to outside acceptance. The modern-minded Orang Suku Laut had become sedentary house dwellers many years ago, and since then only rarely left the settlement for temporary fishing trips. The forefathers of a few of them were of Chinese or Malay descent. The doubting Orang Suku Laut had been living a semi-sedentary way of life for a couple of years, but some of them regularly returned to their houseboats. They had no non-Orang Suku Laut forefathers. The tradition-minded Orang Suku Laut had become house dwellers only recently and still returned to the boat-dwelling habit for months at a time. Among them were some families who oscillated between being exclusively house dwelling or exclusively boat dwelling. All of them were descendants of Orang Suku Laut. Each of the three groups had nomadic relatives who frequently visited the settlement for days or even for a couple of weeks. 52. When government officials visit, the modern-minded Orang Suku Laut normally join meetings. They also regularly attend gatherings to learn the tenets of Islam and take part in joint work programs to build a house of prayer (surau) and other projects proposed by officials. They agreed fairly quickly to the officials even if they had not understood the intentions of the officials very well. The tradition-minded Orang Suku Laut, on the other hand, were not ready to accept any kind of contact and attended neither meetings nor joint activities. In principle, they tended to refuse everything. When the officials came to the settlement, they avoided contact by withdrawal. They did this either by not leaving their houses or leaving the settlement before the officials arrived. The doubting Orang Suku Laut took a position between the two other groups. 53. The developmental pressure has led to intense struggles over territorial rights. It has also raised issues concerning the social assimilation of indigenous peoples as citizens, religious conversion and cultural identity.6 C. Social and Environmental Safeguards 1. Social Safeguards 54. Involuntary Resettlement (Category B): The Project will require minimal land acquisition as indicated in the proposed development plan. Details of land acquisition will be known only after the subprojects are identified at detailed design level. However, marine spatial planning and marine protected area management practices may temporarily exclude some people from some areas that previously had open access to formerly open or ancestral or communal properties, particularly for indigenous peoples, potentially impacting their traditional sources of food, cultural practices, or livelihood. The benefits of these zoning restrictions will outweigh any temporary or small adverse effects due to strengthening of the natural resource base that ultimately address the needs of the communities. In all cases, cultural places will be protected as part of the subproject criteria. In case triggers on involuntary resettlement surface, a Resettlement Framework is provided in the loan document to guide the preparation of Resettlement Plans for project-affected people that will have to be prepared and endorsed by the government, consistent with relevant national laws, ADB’s Safeguard Policy Statement, and the project Resettlement Framework. 55. Indigenous Peoples (Category B): The overall project was determined positive for the presence of indigenous peoples in several target areas, especially in Bintan district as well as the Suku Laut also called as Orang Laut (seafarers). An Indigenous Peoples Planning Framework is prepared for the overall project reflecting the requirements of ADB’s safeguard
6 Chou, Cynthia. (2009) The Orang Suku Laut of Riau, Indonesia: The inalienable gift of territory (The Modern Anthropology of Southeast Asia). http://www.amazon.com/Orang-Suku-Laut-Riau-Indonesia/dp/0415297672.

19
policies and laws of the Government of Indonesia. The Indigenous Peoples Framework ensures that subprojects are designed and implemented in a way that fosters full respect for indigenous peoples’ identity, dignity, human rights, livelihood systems, and cultural uniqueness as defined by the indigenous peoples themselves to enable them to (i) receive culturally appropriate social and economic benefits, (ii) do not suffer adverse impacts as a result of the project, and (iii) can participate actively in the project.7 This Indigenous Peoples Planning Framework safeguards the rights of indigenous peoples to participate and equitably receive culturally appropriate benefits from the project. An Indigenous Peoples Plan will be prepared and implemented by the government should the subproject trigger IP safeguards.
2. Environmental Safeguards
56. The subproject is categorized as Category B according to ADB guidelines. This rating will be enforced through selection criteria for infrastructure so that no interventions will exceed this rating. Due to subproject’s emphasis on biodiversity conservation and ecosystem based fisheries management, the overall environmental impact is expected to be generally positive. The main environmental issues to be faced by this subproject will primarily be on account of minor potential disturbances from basic infrastructure development. The initial environmental examination (IEE) of this subproject is completed and the Environmental Assessment and Review Procedures Framework (EARF) is prepared to guide the executing agency and the implementing agencies in the preparation of environmental assessment reports for additional subproject interventions for investment during implementation. 57. The basic infrastructure and amenities required for MPA to be operational will generate positive environmental benefits, in terms of improved communication and public information, better services to the community and faster response to threats in MPA, which all redounds to more effective management of MPA and improve biodiversity conservation. The construction of MPA office, Surveillance post and surveillance tower, and kitchen extension for fish processing are expected to produce positive environmental and economic impacts in the long run. Any potential negative impacts that may be caused by construction and operation of these infrastructures is minimal and can easily be mitigated by adoption of specific measures as outlined in the IEE report, including additional environmental safeguards to confine the impacts below threshold level or at the minimum, and by the adoption of an environmental management/monitoring plan, as described in the IEE.
3. Gender
58. The project scope will meet women’s needs and improve their socioeconomic status getting them more involved in aquaculture, culture-based fisheries, and related activities, including fish processing, trading, and community-based monitoring. Several gender-responsive activities dealing with women’s productive, community management and leadership roles have been incorporated into the project design. The Project will support poor women in gaining access to resources, technical assistance, and capacity-building efforts for poverty reduction and food security. Women will be included in all project activities, including those dealing with production inputs assistance and training. To ensure that the Project addresses gender concerns women will be hired to conduct gender training to sensitize local government officials and personnel to women’s needs. Baseline Project Performance and Monitoring System (PPMS) surveys and the midterm and project completion surveys will collect gender-disaggregated data. Gender indicators will be included in the Project Performance and
7 ADB-SPS 2009, Appendix 3.

20
Monitoring System and will become an important element in the evaluation system for the national project management office. III. INVESTMENT AND FINANCING PLAN
A. Cost Estimates
59. According to the proposed cost estimates submitted by the Bintan District, the total investment costs (in USD) from external sources over a five year period (2014-2018) are estimated at $2.740, while the Indonesian Government (district) investments are estimated US$0.447 million).
Table 18. Bintan Budget, June 2013 No. Items US$
1 Coral Reef Management and Institutions Strengthened 275,000.0
2 Ecosystem-based Resource Management Developed 826,100.0
3 Sustainable Marine-Based Livelihoods Improved 1,488,300.0
4 Project Management 150,700.0
Total 2,740,100.0
Source: ADB. 2013.Bintan Subproject estimates. B. Financing Plan
60. The financing plan provided in the table below is by sources; allocation of funds are envisaged from the ADB loan, GEF Grant, and the Government of Indonesia.
Table 19. Funding Source of Bintan National MPA investments June 2013
COREMAP–CTI Outputs Total ADB GEF GOI Coral Reef Management and Institutions Strengthened 275,000.0 170,000.0 0.0 105,000.0 Ecosystem-based Resource Management Developed 826,100.0 376,000.0 375,000.0 75,100.0 Sustainable Marine-Based Livelihoods (Economy)
Improved 1,488,300.0 909,500.0 325,000.0 253,800.0
Project Management 150,700.0 137,000.0 - 13,700.0 Total 2,740,100.0 1,592,500.0 700,000.0 447,600.0 Source: Bintan Subproject estimates, ADB 2013
V. IMPLEMENTATION ARRANGEMENTS
A. Subproject Implementation Roles
1. Ministry of Marine Affairs and Fisheries (MMAF)
61. The Presidential Decree No.165 issued in 23 November 2000 describes functions and organizational structure of MMAF and the Presidential decree No.9 in the year 2005 states the main mission of MMAF as: “To Assist the President (of the Republic of Indonesia) in holding the process of governance in the Marine and Fisheries sector”. The main functions of MMAF are: (i) formulation of national policy for the Marine and Fisheries sector; (ii) implementation of national and technical policies; (iii) governance of affairs in the Marine and Fisheries Sector; (iv) management of state-owned properties under MMAF; (v) supervision of MMAF mission

21
implementation; and (vi) report to the President on the account, evaluations, suggestions and consideration of MMAF mission and functions. MMAF is the Executing Agency for COREMAP—CTI.
2. Ministry of Tourism 62. The main mission of the Ministry of Tourism and Economy Creation is: “to assist the President (of the Republic of Indonesia) in holding the process of governance in the Tourism and Economy Creation sector”. The functions are: (i) formulation of national policy, implementation policy and technical policy in the Tourism and Economy Creation sector; (ii) governance of affairs in the Tourism and Economy Creation Sector; (iii) management of state-owned properties under Tourism and Economy Creation; (iv) supervision of Tourism and Economy Creation mission implementation; (v) delivery of report to the President on the account, evaluations, suggestions and consideration on Ministry mission and Function; (vi) technical assistance and supervision on the tourism and creative economy affairs in the region (provincial and district level); and (vii) implementation of technical activities on a national scale. The Department of Tourism in Bintan District will be a close collaboration partner with MPA Bintan Office and the MMAF/PMO in promoting environmentally responsible tourism that minimizes damage and fosters sustainable environment.
3. Directorate General, Marine, Coasts and Small Islands (DGMCSI) and PMO
63. Under MMAF, the Directorate General of Marine, Coasts and Small Islands (MCSI) has responsibility for project management and administration and hosts the Project Management Office (PMO). The PMO will (i) coordinate overall planning and scheduling (particularly infrastructure related and consultants); (ii) administer contracts; (iii) maintain books of accounts and consolidate liquidation reports; (iv) bear responsibility for overall supervision and monitoring and preparation of consolidated monitoring reports; and (v) submit reports. The DG MCSI will also liaise with Directorate General Capture Fisheries (DG CF) and LIPI. Technical planning and supervision of national MPAs has been delegated to the Technical Implementation Unit (UPT) in Pekanbaru. The PMO will liaise directly with the Bintan District MPA for project implementation.
4. Technical Implementation Unit, Padang (BPSPL) - Spatial Planning for Sea, Coastal, and Small Islands
64. The Technical Implementation Unit in Padang (BPSPL) will coordinate activities with national agencies, districts and communities and support coastal communities as they conduct Climate Adaptation and Community Resilience assessments during the feasibility and infrastructure planning phase. It will provide technical assistance to MPA, spatial planning and EAFM activities under ICZM framework and facilitate partnerships with coastal training organizations, marine private sector enterprises, and provincial universities. Spatial plans, if already drafted for Bintan, will be revisited and the concept of “ridge to reef” and climate change impact scenarios will be built in / applied to the district. Based on zoning proposals so far, the Bintan district authorities have proposed zoning, which may need further agreements with ethnic minority traditional rights and practices for the participatory co-management of the district MPA to function effectively.

22
5. MPA District Fisheries Office (UPT Bintan) – Project Implementation Unit
65. The MPA Field Area Management Office in Bintan is located in the District Fisheries Office.

23
Figure 4. Technical Implementation Unit, District MPA, Bintan
66. The UPT Bintan has the responsibility for day-to-day running of MPA operations; under COREMAP—CTI and this office will also house the project implementation unit (PIU). The PIU coordinates with provincial and national government agencies at district levels. Together with MMAF and LIPI, the District PIUs will supervise and monitor the spatial planning, community development, MPA development, marine-resource based economic development, ecological and socioeconomic monitoring, and coastal management activities in the district. It will administer local contracting services, maintain project accounts for monitoring project expenses, and prepare liquidation reports for each source of funds received for undertaking project activities; prepare local progress reports and monitoring reports for submission to the PMO, including Project progress, technical and financial reports covering site specific activities, and field data and feedback from local participating agencies. It will provide technical advice and assistance to village governments and communities on the technical aspects of the Project and facilitate partnerships and training.
6. District Fisheries Office and Community Surveillance Units 67. The main tasks of the District Fisheries Office in Bintan are: (i) improving and strengthening management and utilization marine and fisheries resources to be optimal, effective, efficient and sustainable; (ii) empowering economic coastal and small islands communities; (iii) improving and strengthen surveillance and law enforcement for marine and
Dinas Kelautan dan Perikanan
Dept. of Marine and Fisheries
Komite Pengarah Steering Committee
Kepala UPTD
Head Implementation Unit
Urusan Kesekretariatan
Secretariat
Urusan Perlindungan
Protection
Urusan Litbang
Research
Urusan Pelayanan
Services
Urusan Monev
Monitoring & Evaluation
Lembaga Pengelola Sumberdaya Terumbu Karang (LPS-TK)
Coral Reef Resource Management Body (LPS-TK)

24
fisheries sector; (iv) preparing database and resource potential data of marine and fisheries; and (v) improving quality and quantity marine and fisheries personnel.
7. National Science Agency (LIPI) 68. LIPI is a non-departmental research institution belonging to the government. The Chairman of LIPI is directly responsible to the President of the Republic of Indonesia. At present, LIPI is one of the five non-ministerial Government Institutes (Lembaga Pemerintah Non Department-LPND) coordinated by the State Ministry of Research and Technology (Kementrian Negara Riset dan Teknologi-KNRT). Main functions of LIPI are: (i) to advice and to formulate national policies in the field of science and technology; (ii) to conduct strategic and fundamental research in science and technology; (iii) to undertake appropriate scientific and technological research for sustainable development; (iv) to carry out basic, inter-and multidisciplinary research; (v) to monitor, evaluate, and analyze trends in science and technology; (vi) to facilitate government institution activities in scientific research; and (vii) to provide guidance and services to scientific and technological enterprises. 69. LIPI’s role in Bintan MPA will be to update and document the baseline undertaken under COREMAP II and assist with surveys and monitoring. Data collected so far will be uploaded in a web-based relational database with easy access. It will be the repository of data on biodiversity, ecosystem, and socioeconomic aspects relating to project impacts.

25
B. Implementation Schedule
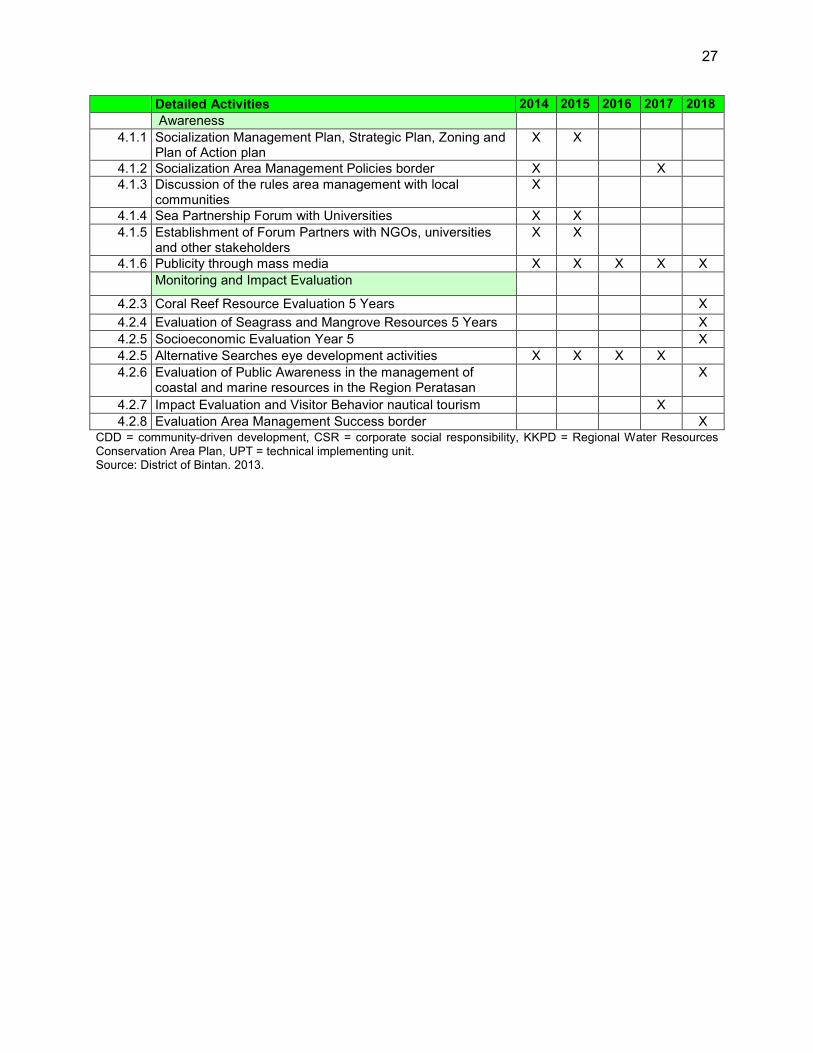
70. Tentative implementation details covering a five-year period are provided below:
Table 20. Implementation Schedule, Bintan National MPA 2014-2018 Detailed Activities 2014 2015 2016 2017 2018
1 Coral Reef Management and Institutions Strengthened
1.1 Dissemination of MPA information & Institutional strengthening
X
1.2 Determination of Legal Status by Regional Team X
1.3 Supervision by Pokmaswas and Team MCS UPT X X X X X
1.4 Study additional diving area for diving activity X
1.5 Supervision of the preparation of standard operating procedures Region
X
1.6 Boundary validation and dissemination of regional boundaries
X X
1.7 Preparation of Technical Guidelines X
1.8 Preparation of Performance Indicators (social, economic and ecological)
X
1.9 Identify potential products and services in the region KKPD X
1.10 Regional meeting of the Steering Committee and Advisory Board
X X X X X
1.11 Workshop on management of the border X X
1.12 Technical Coordination Meeting UPT kawasann border X X X X X
1.13 Unit Operating Costs border area X X X X X
1.14 Area Development border meeting X X X X X
1.15 Identification Infrastructure Feasibility in the Region X
1.16 Setting tariffs for tourists, fines and utilization of revenue for the management of the KKPD
X
2 Ecosystem-based Resource Management Developed
Training
2.1.1 Training Staff of Supervisory Unit X
2.1.2 Conservation Area Management Training X
2.1.3 Training Resource Monitoring Coral Reefs, Mangroves and Seagrass
X
2.1.4 Advanced diving training for officers and managers of marine tourism
X
2.1.5 Marine guide / tour guide training X
2.1.6 GIS and Database Training Zone coastal resources KKLD X
2.1.7 Conservation Training for Students X X
2.1.8 Diving training for executives and lawmakers X
Ecosystem Baseline and Monitoring
2.2.1 Preparation of baseline coral reef resources in the Region KKLD
X
2.2.2 Preparation of baseline data for seagrass and mangrove resources in the Region KKLD
X
2.2.3 Preparation of baseline resources other biota in the border area
X
2.2.4 Preparation of socioeconomic baseline in border areas X
2.2.5 Evaluation of the status and potential threat of coastal and marine resources of border areas
X
2.2.6 Socioeconomic Monitoring in the border area X X X X X

26
Detailed Activities 2014 2015 2016 2017 2018
2.2.7 Health Monitoring Coral Reefs, Seagrass, and Mangrove X X X X X
2.2.8 Monitoring Creel X X X X X
2.2.9 Seagrass and Mangrove Resource Monitoring X X X X X
2.2.10 Marine Tourism Activity Monitoring X X
2.2.11 Zone Monitoring Capability X
2.2.12 Identification and Mapping of Regional Water Resources Conservation Area (KKPD) Bintan
X X X X X
Boundary Demarcation
2.3.1 Installation of regional boundaries X
2.3.2 DPL installation boundaries and zoning X
2.3.3 Spatial Planning integrating Climate Change scenarios X X
Equipment, Vehicles, Materials for MPA
2.3.1 Installation boat mooring / buoy mooring dive destinations in the region
X
2.3.2 Equipment for office personnel X
2.3.3 Information Board with Name / Information X
2.3.4 Boat for Monitoring Coral Reef Ecosystems, Seagrass and Marine Water Conditions
X
2.3.5 Diving Equipment Procurement X
2.3.6 Equipment Mini Laboratorium Environment X
2.3.7 Unit-Area Transportation Facilities KKPD X
2.3.8 Communications Equipment X X X X
2.3.9 Equipment for Promotion and Documentation X X X X
2.3.10 Procurement of leaflets, booklets and posters X X X X
2.3.11 Office Furniture Procurement X
2.3.12 Procurement information and promotional media X X X
3 Sustainable Marine-Based Livelihoods Improved
3.1.1 Preparation of detailed design of marina tourism infrastructure
X
3.1.2 Development of the Border UPT office X 3.1.3 Office Support Facilities Unit X
3.1.4 Office business development UPT X
3.1.5 Border Area Development Information Center X
3.1.6 Surveillance Post Development X X
3.1.7 Surveillance Tower Development X
3.1.8 Construction of Guest House and Furnishings X
3.1.9 Homestay construction and furnishings X
3.1.10 Construction of mini laboratory for environmental quality X
3.1.11 Water Well Drilling and Water Installation X X
3.1.12 Information and communication infrastructure (tower) X
3.1.13 Sanitation and waste management X
3.1.14 infrastructure marine aquaculture (fisheries) X X
3.1.15 Tourism facilities infrastructure X X X
3.1.16 Research and development infrastructure X X X
Livelihoods
3.2.1 Alternative livelihoods (CDD approach) X X X X
3.2.2 Support to Women’s Fish Processing Group X X X X
3.2.3 Cooperation with Private Parties in Connection with Public Welfare Improvement through CSR funds
X
4 Project Management
27
Detailed Activities 2014 2015 2016 2017 2018
Awareness
4.1.1 Socialization Management Plan, Strategic Plan, Zoning and Plan of Action plan
X X
4.1.2 Socialization Area Management Policies border X X 4.1.3 Discussion of the rules area management with local
communities X
4.1.4 Sea Partnership Forum with Universities X X
4.1.5 Establishment of Forum Partners with NGOs, universities and other stakeholders
X X
4.1.6 Publicity through mass media X X X X X
Monitoring and Impact Evaluation
4.2.3 Coral Reef Resource Evaluation 5 Years X
4.2.4 Evaluation of Seagrass and Mangrove Resources 5 Years X
4.2.5 Socioeconomic Evaluation Year 5 X
4.2.5 Alternative Searches eye development activities X X X X
4.2.6 Evaluation of Public Awareness in the management of coastal and marine resources in the Region Peratasan
X
4.2.7 Impact Evaluation and Visitor Behavior nautical tourism X
4.2.8 Evaluation Area Management Success border X CDD = community-driven development, CSR = corporate social responsibility, KKPD = Regional Water Resources Conservation Area Plan, UPT = technical implementing unit. Source: District of Bintan. 2013.

28
C. Financial Management 1. Preparation of Annual Budgets and Work Plans 71. The Coordinator for the PIU in Bintan will prepare annual work plans and budgets and submit these to the PMO for approval. These will be reviewed by MMAF and approved according to procedures laid down in the COREMAP-CTI Project.
2. Accounting, Financial Reporting and Audit Arrangements
72. The project finance and accounting functions will be performed by qualified and experienced staff both at district level and central level. In addition, the project will provide training and written guidelines, especially in ADB procedures. The PMO will prepare terms of reference (TORs) that define duties, responsibilities, lines of supervision, and limits of authority for all officers, managers, and staff. The following responsibilities will be performed by different units or persons: (i) authorization to execute a transaction; (ii) recording of the transaction; and (iii) custody of assets involved in the transaction. 73. The bank reconciliation will be prepared by someone other than those who approve payments. Accounting software to be used will be capable of generating reports identifying expenditures in accordance with project outputs/components, expenditure accounts, disbursement categories, and sources of funds. A project financial manual will be prepared to be applicable for the project and acceptable to ADB. Controls will be in place concerning the preparation and approval of transactions, ensuring that all transactions are correctly made and adequately explained. The chart of accounts will be able to account for and report on project activities and disbursement categories. The cost allocations to the various funding sources will be made accurately and in accordance with established agreements. The general ledger and subsidiary ledgers will be reconciled and in balance. 74. All accounting and supporting documents will be retained by the PMO on a permanent basis in a defined system that allows authorized users easy access. Regular monitoring and internal audit functions will be built up to monitor transactions along the line from central government to provincial, and subproject levels. Such control procedures will be documented in the project finance and administration manual. 75. The PIU in Bintan will prepare and submit to PMO for onward transmission to MMAF and ADB within 30 days of the end of each calendar quarter, consolidated quarterly progress reports in a format consistent with ADB's project performance reporting system (PPR). In addition to these quarterly progress reports, the PMO will prepare consolidated annual reports, which will include (i) progress achieved by output as measured through the indicator's performance targets, (ii) key implementation issues and solutions; (iii) an updated procurement plan; and (iv) an updated implementation plan for the next 12 months. To ensure projects continue to be both viable and sustainable, project accounts and the executing agency annual financial statements, together with the associated auditor's report, will be adequately reviewed. 76. Within 6 months of physical completion of the Project, the PMO will submit to ADB a completion report that describes the physical achievements of the Project, actual costs incurred in relation to cost estimates, the results of project activities, a preliminary assessment of
29
achieved benefits, and other relevant project implementation matters requested by ADB. 8 77. The PMO will review and consolidate the accounts and records and have them audited annually in accordance with sound accounting practices by the sovereign audit agency of the Government, (the BPK, Badan Pengawas Keuangan), that has been acceptable to ADB. Audit coverage will include a statement verifying whether or not the funds disbursed by ADB were used for the purposes for which they were provided, as well as separate opinions on (i) utilization of the imprest fund and the statement of expenditures procedure; and (ii) compliance with financial covenants specified in the loan agreements and project agreement. 78. Audit reports, management letter, and related financial statements will be submitted to ADB in the English language not later than 6 months after the end of the fiscal year to which they relate, or the Project closing date if earlier. D. Procurement 1. Procurement Methods 79. All procurement under the ADB loan will be undertaken in accordance with ADB’s Procurement Guidelines (March 2013, as amended from time to time). All procurement to be financed exclusively by counterpart fund will be undertaken in accordance with government guidelines. 80. Procurement of civil works packages and goods and services will be carried out by the PMO for the Bintan District MPA Project Implementation Unit. Civil works packages valued at less than $5.0 million equivalent but more than $100,000 equivalent, and packages for goods valued at less than $1.0 million equivalent but more than $100,000 equivalent, will be procured following national competitive bidding (NCB) procedures (one stage, one package and two envelopes). For goods packages valued below $100,000 equivalent, shopping procedures acceptable to ADB will be followed. For works packages valued below $100,000 equivalent, shopping procedures, and some packages up to $50,000 equivalent will be through community participation acceptable to ADB will be followed. The following thresholds will be applied to procurement of goods and works.
Table 21. Procurement Thresholds Method Threshold
International Competitive Bidding (ICB) for Works
Above $5,000,000
International Competitive Bidding for Goods Above $500,000
National Competitive Bidding (NCB) for Works Below $5,000,000 and above $100,000 National Competitive Bidding for Goods Below $500,000 and above $100,000 Shopping for Works Up to $ 100,000 Shopping for Goods Up to $ 100,000 Community participation Up to $50,000 Direct Purchase —
8 Project completion report format available at: http://www.adb.org/Consulting/consultants-toolkits/PCR-Public-Sector-Landscape.rar. (link doesn’t exist, please correct.)

30
2. Procurement Plan
81. In the Bintan District MPA, the list of goods and works contracts to be procured within the next 18 months will be revised at start of Project. VI. RISKS AND RISK MITIGATION
82. Possible risks and risk mitigation measures are considered below.
Table 22. Risks and Risk Management
Risks Assessment Without Mitigation
Management Plan Assessment with
Mitigation (i) Adverse climate change impacts such as sea level rise including catastrophic weather events
High Awareness raising, disaster preparedness, and spatial planning scenarios 2020 and 2050 and 2075 taking into consideration climate change impacts (temperature, rainfall, and sea level rise); physical planning and infrastructure will have to follow spatial planning scenarios as the only high hill / mountain on the main island of Bintan is just 370m above sea level; Bintan is not known to be a tsunami area but disaster preparedness plans are important
medium
(ii) Ad hoc development investment decisions and fisheries utilization targets override long term marine resource protection and sustainable use plans
High MPA zoning, awareness, surveillance, and enforcement with participatory community based monitoring will help establish “marine stewardship” rights and duties and bring some measure of order and discipline; spatial planning and adherence to such by District and provincial governments will enhance the management regime of the MPA; the Tourism Development Plan of Bintan foresees expansion of tourist resorts in the North and building of a privately financed airport, which will bring in up to 1 million tourists a year. This will need careful monitoring and reinforcing of ecosystem values and biodiversity conservation; it also poses an opportunity for CSR and PES agreements on protecting the dugong and marine fish and seagrass sanctuaries
Low
(iii) Influx of population / in-migration creating pressure on resources and increasing waste management problems
Medium Designated peri-urban, urban and rural centers of growth will need awareness raising and disciplined physical planning to manage influx of population; in the medium term, waste management, sewage treatment, and renewable energy solutions will be needed / encouraged as investment instruments to manage this risk.
Low
(iv) Insufficient operation and maintenance leading to premature asset deterioration
Medium Participating MMAF have committed to provide adequate operation and maintenance funding as a condition for selection of subprojects. Robust designs and good quality
Low

31
Risks Assessment Without Mitigation
Management Plan Assessment with
Mitigation control will reduce the maintenance burden. Maintenance capacity building will be supported for subprojects. The project will have close coordination with the authorities responsible for management of the road improvements. Central and provincial governments have committed a minimum level of funding to each district; in addition, the revenues generated from growing tourism will need to flow into maintenance of the infrastructure and replacement of vehicles and equipment
(v) Poor governance and weak control of illegal fishing from outside Indonesia
High The investments in the MPA management effectives, law enforcement, community-based monitoring and public awareness will assist in combating this risk; in particular, MOUs will be put in place between District MPA (Fisheries Department) and the communities to do more in this respect; under COREMAP II, POKMAS (groups) have been set up for surveillance and patrolling; these need to be strengthened
Low
Source: Subproject design – Bintan District MPA
VII. INDICATORS AND TARGETS
1. The following targets are projected for the period 2014-2018:
Table 23. Indicative Targets Level Indicator Description Target Impact Coral reef health – live coral cover increased in core
zone and other protected areas 2025
Outcome MPA management facility fully operational (personnel, equipment, operations); a % of revenue
streams from marina and tourists allocated for maintenance and MPA operations
2017
Output 1 Institutional Strengthening 1.1 Agreements on protection of core zone in place with
traditional leaders and ethnic minority groups where relevant and with communities
2014
1.2 MPA rules and regulations known to all major stakeholder groups and well displayed in public
places
2015
1.3 Zoning completed and demarcation done 2015 Output 2 Biodiversity Conservation & Ecosystem Based
Fisheries Management
2.1 Baseline of coral reefs / fisheries updated 2014 2.2 Web-accessible Database on key species 2014 2.3 Database on illegal fishing incidents 2014 2.4 Dugong population database 2014

32
Level Indicator Description Target 2.5 Fisheries Catch-effort data updated 2014 2.6 Spatial Planning documents with climate change
impacts and integrated “Ridge to Reef” approach 2015
2.7 Monitoring data from within MPA and control points outside MPA
2015
2.8 Patrols / Law Enforcement fully operational 2014 2.11 Maintenance of coral coverage at 50% as at
baseline of 2012 2018
2.12 Increase in coral coverage from 50% – 60% in Tambelan and elsewhere from 35% - 50% in
degraded areas at baseline 2012
2018
2.13 Seagrass meadows and dugong spawning grounds protected compared to baseline of 2012; number of
accidental deaths reduced
2018
2.14 Stabilization of coral reef fish (key) species
(abundance and density) as compared to 2012
2018
Output 3. MPA Infrastructure and livelihoods 3.1 MPA / Marina detailed design 2014 3.2 Construction awarded 2014-2015 3.3 Infrastructure commissioned 2015 3.4 Information Center, Washrooms 2015 3.5 Communication Tower 2015 3.6 Mooring buoys 2015 3.7 Water supply / sanitation 2015 3.8 Information boards and Signage 2015 3.9 Pokmas Bandeng Women’s Fish Processing Group
diversify products, markets, revenue 2016
3.10 Households involved in livelihood activities At least 300 by 2016 Output 4 Management and monitoring
4.1 PIU – UPT operational 2014 4.2 Baseline, species and monitoring data uploaded 2015 4.6 Revenue data and business plans 2015

Appendix 1 3
3
Annex 1: Subproject Investment Cost Details Ref Items Totals incl Contingencies ADB GEF GOI
DT3 I. Investment Costs DT3 A. MPA Institution Strengthening DT3 Dissemination of MPA Information 22,000.0 20,000.0 - 2,000.0 DT3 Supervision of Community Surveillance Groups 55,000.0 50,000.0 - 5,000.0 DT3 Supervision of Preparation of Standard Operating Procedures 11,000.0 10,000.0 - 1,000.0 DT3 Boundary Validation and Dissemination 27,500.0 25,000.0 - 2,500.0 DT3 Preparation of Technical Guidelines 11,000.0 10,000.0 - 1,000.0 DT3 Preparation of Performance Indicators 11,000.0 10,000.0 - 1,000.0 DT3 Identification of Potential Products and Services 11,000.0 10,000.0 - 1,000.0 DT3 Meeting of Steering Committee and Advisory Board on Products and Services 22,000.0 20,000.0 - 2,000.0 DT3 Boundary Management Workshop 11,000.0 - - 11,000.0 DT3 Technical Coordination Meeting - Managers and Strakeholders 11,000.0 - - 11,000.0 DT3 Stakeholder Participation in Boundary Development 55,000.0 - - 55,000.0 DT3 Meeting on Area Development 11,000.0 - - 11,000.0 DT3 Identification of Infrastructure Needs 11,000.0 10,000.0 - 1,000.0 DT3 Setting Tariffs for Tourists, Fines and Revenue Utilization 5,500.0 5,000.0 - 500.0 DT3 Subtotal 275,000.0 170,000.0 - 105,000.0 DT3 B. Training DT3 Training Staff of Boundary Supervisory Unit in Regulations 38,500.0 35,000.0 - 3,500.0 DT3 Conservation Area Management Training /a - - - - DT3 Training in Resource Monitoring /b - - - - DT3 Diving Training 22,000.0 20,000.0 - 2,000.0 DT3 Marine Guide and Tour Guide Training 11,000.0 10,000.0 - 1,000.0 DT3 Training in GIS and Coastal Resource Database /c - - - - DT3 Conservation Training for Students /d - - - - DT3 Subtotal 71,500.0 65,000.0 - 6,500.0 DT3 C. Ecosystem Baseline Survey and Monitoring DT3 Monitoring of Coral Reef Resources /e - - - - DT3 Baseline Survey of Mangrove and Seagrass Resources /f - - - - DT3 Baseline Survey of Other Coral Reef Resources /g - - - - DT3 Baseline Socioeconomic Survey /h - - - - DT3 Evaluation of Status and Potential Threats to Marine and Coastal Resources 27,500.0 - 25,000.0 2,500.0 DT3 Socioeconomic Monitoring in Boundary Areas 38,500.0 - 35,000.0 3,500.0 DT3 Health Monitoring of Coral Reef 38,500.0 - 35,000.0 3,500.0 DT3 Mangrove and Seagrass Resource Monitoring 38,500.0 - 35,000.0 3,500.0 DT3 Monitoring of Marine Tourism Activity 38,500.0 - 35,000.0 3,500.0 DT3 Identification and Mapping of MPA Resources 60,500.0 - 55,000.0 5,500.0 DT3 Subtotal 242,000.0 - 220,000.0 22,000.0 DT3 D. Boundary Demarcation

34 A
ppendix 1
Ref Items Totals incl Contingencies ADB GEF GOI
DT3 Installation of Boundary 38,500.0 - 35,000.0 3,500.0 DT3 Village Level Installation of Boundary and Zoning 38,500.0 - 35,000.0 3,500.0 DT3 Spatial Planning (including Climate Change Scenarios) 71,500.0 - 65,000.0 6,500.0 DT3 Dissemination of Management, Boundary Demarcation, Zoning, Etc 22,000.0 - 20,000.0 2,000.0 DT3 Subtotal 170,500.0 - 155,000.0 15,500.0 DT3 E. MPA Vehicles and Equipment DT3 Boat Mooring and Buoys at Dive Locations 33,000.0 30,000.0 - 3,000.0 DT3 Equipment for Office Personnel 16,500.0 15,000.0 - 1,500.0 DT3 Signage 6,600.0 6,000.0 - 600.0 DT3 Boat for Monitoring Purposes 60,500.0 55,000.0 - 5,500.0 DT3 Diving Equipment 33,000.0 30,000.0 - 3,000.0 DT3 Laboratory (Monitoring) Equipment 33,000.0 30,000.0 - 3,000.0 DT3 Transport Equipment 33,000.0 30,000.0 - 3,000.0 DT3 Communications Equipment 27,500.0 25,000.0 - 2,500.0 DT3 Promotion and Documentation Equipment 33,000.0 30,000.0 - 3,000.0 DT3 Leaflets, Booklets and Posters 22,000.0 20,000.0 - 2,000.0 DT3 Office Equipment 11,000.0 10,000.0 - 1,000.0 DT3 Informational and Promotional Media 33,000.0 30,000.0 - 3,000.0 DT3 Subtotal 342,100.0 311,000.0 - 31,100.0 DT3 F. MPA Infrastructure DT3 Detailed Design of MPA Infrastructure 11,000.0 10,000.0 - 1,000.0 DT3 Office Development /i 55,000.0 - - 55,000.0 DT3 Office Support Facilties /j 11,000.0 - - 11,000.0 DT3 Office Business Development Package /k 55,000.0 - - 55,000.0 DT3 Information Center 60,500.0 55,000.0 - 5,500.0 DT3 Surveillance Post 22,000.0 16,500.0 - 5,500.0 DT3 Surveillance Tower 11,000.0 10,000.0 - 1,000.0 DT3 Guest House Construction and Fittings 48,400.0 44,000.0 - 4,400.0 DT3 Dormitory Construction and Fittings 48,400.0 44,000.0 - 4,400.0 DT3 Mini Laboratory 60,500.0 55,000.0 - 5,500.0 DT3 Water Supply Facilities 60,500.0 55,000.0 - 5,500.0 DT3 Information and Communications Infrastructure 27,500.0 25,000.0 - 2,500.0 DT3 Sanitation and Waste Management 60,500.0 55,000.0 - 5,500.0 DT3 Fisheries Facilities 60,500.0 55,000.0 - 5,500.0 DT3 Tourism Facilities 60,500.0 55,000.0 - 5,500.0 DT3 Research Facilities 60,500.0 55,000.0 - 5,500.0 DT3 Subtotal 712,800.0 534,500.0 - 178,300.0 DT3 G. Support to Alternative Livelihoods DT3 Alternative Livelihoods Development 357,500.0 - 325,000.0 32,500.0 DT3 Support to Fisheries Value Chain Investments 401,500.0 365,000.0 - 36,500.0 DT3 Subtotal 759,000.0 365,000.0 325,000.0 69,000.0 DT3 H. Awareness Building DT3 Dissemination of Area Management Policies 11,000.0 10,000.0 - 1,000.0

Appendix 1 3
5
Ref Items Totals incl Contingencies ADB GEF GOI
DT3 Cooperation with Private Sector /l 5,500.0 - - 5,500.0 DT3 Subtotal 16,500.0 10,000.0 - 6,500.0 DT3 I. MPA Monitoring and Evaluation DT3 Evaluation of MPA Management Effectiveness 16,500.0 15,000.0 - 1,500.0 DT3 Evaluation of Environmental Degradation 16,500.0 15,000.0 - 1,500.0 DT3 Evaluation of Coral Reef Resources 16,500.0 15,000.0 - 1,500.0 DT3 Evaluation of Mangrove and Seagrass Resources 16,500.0 15,000.0 - 1,500.0 DT3 Socioeconomic Evaluation 22,000.0 20,000.0 - 2,000.0 DT3 Evaluation of Public Awareness 22,000.0 20,000.0 - 2,000.0 DT3 Evaluation of Visitor Behavior and Impact 13,200.0 12,000.0 - 1,200.0 DT3 Evaluation of MPA Management Success 27,500.0 25,000.0 - 2,500.0 Subtotal 150,700.0 137,000.0 - 13,700.0 Total 2,740,100.0 1,592,500.0 700,000.0 447,600.0