Embed Size (px)
Citation preview

1
Individualistic responses of forest herb traits to environmental change 1
Authors: Haben Blondeel1*, Michael P. Perring1,2, Emiel De Lombaerde1, Leen Depauw1, Dries 2
Landuyt1, Sanne Govaert1, Sybryn L. Maes1, Pieter Vangansbeke1, Pieter De Frenne1 and Kris 3
Verheyen1 4
*Corresponding author: [email protected] 5
Addresses: 6
1: Forest & Nature Lab, Campus Gontrode, Faculty of Bioscience Engineering, Ghent University, 7
Geraardsbergsesteenweg 267, 9090 Melle-Gontrode, BELGIUM 8
2: Ecosystem Restoration and Intervention Ecology Research Group, School of Biological Sciences, 9
the University of Western Australia, 35 Stirling Highway, Crawley WA 6009 AUSTRALIA 10
Key words: vegetation cover, land-use legacies, temperate forest, intraspecific trait variation, plant 11
height, specific leaf area, nitrogen deposition, climate change 12
Running title: Individualistic responses of forest herb traits to environmental change 13
14

2
Abstract 1
• Intraspecific trait variation (ITV; i.e. variability in the mean and/or distribution of plant 2
attribute values within species), can occur in response to multiple drivers. Environmental 3
change and land-use legacies could alter trait values within species directly, but also indirectly 4
by changing the vegetation cover. Greater variability in environmental conditions could lead 5
to more ITV but responses could differ among species. Disentangling these drivers on ITV is 6
necessary to accurately predict plant community responses to global change. 7
• We planted herb communities into forest soils with and without recent agricultural history. 8
Soils were collected across temperate European regions, while the fifteen selected herb 9
species had different colonising abilities and affinities to forest habitat. These mesocosms 10
(384) were exposed to two-level full-factorial treatments of warming, nitrogen addition and 11
illumination. We measured plant height and specific leaf area (SLA). 12
• For the majority of species, mean plant height values increased as vegetation cover increased 13
in response to light addition, warming and agricultural legacies. The coefficient of variation 14
(CV) for plant height was larger in fast colonising species. Mean SLA for vernal species 15
increased with warming, while light addition mainly decreased mean SLA for shade-tolerant 16
species. Interactions between treatments were unimportant predictors. 17
• Environmental change treatments influenced ITV, either via an increasing vegetation cover 18
or by affecting trait values directly. Species’ ITV was individualistic, i.e. species responded 19
to different single resource and condition manipulations that benefited their growth in the 20
short term. These individualistic responses could be important for altered community 21
organisation after a prolonged period. 22
23
3
Introduction 1
Functional traits are morphological, physiological or phenological traits which affect growth, 2
reproduction, and survival of plants (Violle et al. 2007; Funk et al. 2017). Variation in functional 3
traits related to leaf economics (“leaf”), growth (“height”) and reproduction (“seed”) has been 4
associated with trade-offs that plant species face to compete for resources across environmental 5
gradients (Westoby 1998; Borer et al. 2014; Reich 2014; Garnier et al. 2016; Díaz et al. 2016; 6
Beckman et al. 2018). While many have focused on trait variation between species and how different 7
environments influence this (Wright et al. 2017; Bruelheide et al. 2018), trait variation also occurs 8
within species (Siefert et al. 2015; Fajardo & Siefert 2018). This intraspecific trait variation (ITV) 9
can occur in response to environmental drivers (Albert et al. 2010; Jung et al. 2010), and is maintained 10
by processes of phenotypic plasticity and genetic differentiation (Valladares et al. 2006). Phenotypic 11
plasticity is an individual’s plastic response to its environment, and its effect can be larger than that 12
of genetic adaptation in altering trait values of species at small spatiotemporal scales (Lajoie & 13
Vellend 2015, 2018; Turcotte & Levine 2016). Changes in mean trait values of species in response 14
to altered environments can ultimately affect variability in traits across populations, and thus 15
contribute to ITV (Moran et al. 2016). ITV greatly influences community patterns and processes 16
(Bolnick et al. 2011; Escudero & Valladares 2016), and accounting for these effects improves 17
predictions of plant communities in a changing world (Laughlin et al. 2012; Cadotte et al. 2015). 18
Evidence exists that competition for light enhances ITV in height and leaf trait values (Le Bagousse-19
Pinguet et al. 2015; Bennett et al. 2016; Henneron et al. 2017). This is most evident in asymmetric 20
competition for light, where light as a resource is disproportionally removed by individuals that 21
manage to grow taller than their direct neighbours (Freckleton & Watkinson 2001). In dense plant 22
communities with high vegetation cover, larger growth of individuals can be achieved as long as 23
additional mineral nutrition and water are provided to sustain the increased growth (Watkinson 1983; 24
Begon et al. 1996; Freckleton & Watkinson 2001; Craine & Dybzinski 2013). Asymmetric 25

4
competition for light in such dense communities shapes the structure of canopies (Nagashima & 1
Hikosaka 2011) and the plant community as a whole (DeMalach et al. 2016). Plants that manage to 2
survive under the shade of the taller neighbours can alter leaf morphology to deal with photosynthesis 3
when light availability is low (Valladares & Niinemets 2008). A common plastic response of 4
individual plants is to increase the leaf area to leaf mass ratio (specific leaf area, SLA) to optimize 5
light capture for growth maintenance (Milla & Reich 2007; Valladares & Niinemets 2008; Liu et al. 6
2016; Smart et al. 2017). Plants can also compete for light that is inherently scarce, such as in 7
herbaceous communities at the forest floor under the shade of large canopy trees (Valladares et al. 8
2016). Sudden gaps in the tree canopy could then enhance light availability and photosynthesis in the 9
understorey at very short notice (Paul-Limoges et al. 2017). This change in light availability could 10
lead to quick plastic responses in plant height and SLA (Valladares et al. 2002) in synchrony with 11
shifts in community composition (De Frenne et al. 2015) and an increased community biomass 12
production (Jagodziński et al. 2016). 13
Apart from a varying light availability (Navas & Garnier 2002; Rozendaal et al. 2006; Lemke et al. 14
2015; Garnier et al. 2016; Burton et al. 2017), three main global change drivers are affecting 15
temperate forest herb ecology (Gilliam, 2007) and thus potentially ITV. First, climate warming can 16
alter growth and leaf trait values within herbaceous plants to resemble those of warmth-adapted 17
communities (Hoeppner & Dukes 2012; De Frenne et al. 2015; Helsen et al. 2017; Bjorkman et al. 18
2018; Henn et al. 2018). Second, nitrogen (N) deposition (Bobbink et al. 2010) can cause increasing 19
mean values of plant height and SLA by enhancing growth and increasing N content per dry mass of 20
plant tissues (Hejcman et al. 2012; Mao et al. 2017). Finally, elevated soil N and phosphorus (P) 21
concentrations stemming from agricultural land-use history can cause increases in productivity and 22
variability in functional leaf traits (Fraterrigo et al. 2009; Baeten et al. 2010, 2011; Siefert & Ritchie 23
2016). These drivers can interact to affect trait values in plant communities (Perring et al. 2016). 24

5
Plant functional traits can differ between species depending on how species capture resources (Poorter 1
et al. 2009; Garnier et al. 2016; Jagodziński et al. 2016; Mao et al. 2017). In forest herbs, there is 2
evidence that life-history traits and plant height are correlated to forest colonisation and specialisation 3
in forests habitat use (Verheyen et al. 2003). Herbaceous species that are confined to ancient forests 4
are typically small-statured slow colonisers that can photosynthesise in mature forests, either as 5
spring-flowering geophytes (Rothstein 2000; Tessier & Raynal 2003; Mabry et al. 2008) or as shade 6
tolerant plants that grow under fully-developed tree canopies (Valladares & Niinemets 2008). These 7
perennial ancient forest herbs consequently invest more nutrients into roots, bulbs, suckers or large 8
seeds for proliferation (Verheyen et al. 2003), but at a cost of slow dispersal (Klimešová et al. 2016). 9
Contrastingly, the ability of forest herbs to colonise post-agricultural forests correlates positively with 10
large relative growth rates and aging quickly (Verheyen et al. 2003), both plant characteristics 11
indicative of a “fast life-history” (Adler et al. 2014; Beckman et al. 2018). Such fast colonisers are 12
tall with light seed which allows further dispersal than species that are typical of ancient forest 13
(Verheyen et al. 2003; Thomson et al. 2011; Beckman et al. 2018). Fast colonising forest herbs 14
additionally have a high SLA and high leaf N content (Verheyen et al. 2003) which is a leaf 15
construction that favours resource acquisition over resource conservation (Wright et al. 2004; Adler 16
et al. 2014; Reich 2014; Díaz et al. 2016). Fast colonisers could thus benefit more from variation in 17
height and leaf traits than slow colonisers to quickly capitalise on resources in rapidly changing 18
environments (Alpert & Simms 2002). 19
Here we assess within-species responses of plant height and SLA to environmental change and land-20
use legacies directly, but also indirectly by looking at change in vegetation cover. Furthermore, 21
responses could also differ between species and potentially link to colonisation capacity. We 22
performed a manipulative experiment with temperate herbaceous communities in forests comprising 23
species with varying colonisation capacities and affinities to forests habitat. This experiment allows 24
us to disentangle effects of enhanced light availability, warming, N addition and agricultural land-use 25
history on intraspecific variation in plant height and SLA. We specifically hypothesize that: 26

6
1. Within species, high vegetation cover increases mean plant height and SLA, likely due to 1
asymmetric competition for light. Higher vegetation cover could stem from community 2
growth due to nutrient enrichment (from either N addition or agricultural land-use history) in 3
warmer and brighter conditions. 4
2. Within-species differences in mean plant height and SLA could result from variability in 5
growing conditions induced by environmental changes and agricultural land-use history. The 6
effect of these drivers can depend on each other. Concretely, we examine two-way interactions 7
between enhanced light availability, warming, N addition and agricultural land-use history on 8
changes of mean values in plant height and SLA. 9
3. Species with a good ability to colonise post-agricultural forests can exhibit a greater variability 10
in trait values for both plant height and SLA. Since these species colonise novel environments, 11
they need to cope with higher environmental unpredictability, and could potentially benefit 12
from larger trait variation than species confined to ancient forests. 13
Material and Methods 14
We performed a full-factorial experiment with 384 experimental units (mesocosms) to disentangle 15
interactive two-level effects of forest agricultural land-use history, enhanced light availability, 16
nitrogen addition and warming on fifteen common European herbaceous forest species that differ in 17
colonisation capacity and affinity to forest habitat (Figure 1). We measured plant height on 3445 18
individual plants and characterised SLA using 1125 leaf samples with measurements taken during 19
the growing season of 2017, from the first week of March until the first week of September. 20
Land-use legacies: ancient and post-agricultural forest soils across environmental 21
gradients 22
We collected soil (0.1 m³ in each forest) from eight temperate European regions across gradients of 23
inherent soil fertility, regional phosphorus balance and nitrogen deposition (further details in Blondeel 24

7
et al. 2019). Regions spanned from Southwest Estonia (N 58 ° 8' 45.10", E 24° 47' 04.83") to Central 1
France (N 47° 50' 10.04”,E 2° 45' 39.80") and included Southern Sweden (N 55° 32' 58.67", E 13° 2
14' 28.11"), Northwest Germany ( N 53° 20' 25.12", E 9° 25' 17.34" ), Northeast Germany (N 53° 13' 3
41.41”, E 12° 07' 30.06"), Northern Belgium (N 51° 00' 00.30", E 4° 20' 17.13"), Southern Belgium 4
(N 50° 03' 56.05", E 4° 22' 01.54") and Northern France (N 49° 53' 42.65", E 2° 18' 41.36"). The 5
collected soils were classified in three groups using cluster analysis according to inherent soil fertility 6
(texture and calcareous properties). These soil types were either i) “Eutrophic” which are rich in clay 7
and carbonates with high pH (6.6-7.1), ii) “Oligotrophic which are high in sand and low in pH (4 – 8
5) or iii) “Mesotrophic” with intermediate fertility, siltier textures and intermediate pH (5-5.6) (see 9
Blondeel et al., 2019). These soil groups are relative terms to categorise inherent soil fertility within 10
our samples, and should not be used to compare outside of our population. We use this categorical 11
soil type variable as a covariate when testing variation in mean plant height and mean SLA in response 12
to interactive environmental changes (see section “Data analysis”). 13
To enable a comparison by agricultural land-use history, we searched for three adjacent pairs of 14
ancient and post-agricultural broadleaved forest with similar canopy composition within each region, 15
leading to 48 forest patches included in the study (Blondeel et al. 2019). We searched for pairs of 16
forest patches where one patch was in existence before 1850 (ancient forest) and the other established 17
in mid-20th century (post-agricultural forest). The agricultural legacies in the post-agricultural forest 18
soils varied along gradients of inherent soil characteristics, regional P balance and N deposition 19
(Blondeel et al. 2019). Overall, the soils from post-agricultural forest had higher pH (+0.4 ± 0.16 20
standard error (se)), lower C:N (-1.49 ± 0.24 se) , higher total P concentration (+118 mg kg-1± 60 se) 21
and higher Olsen P concentration (+13 mg kg-1 ± 5.5 se) compared to ancient forest (Blondeel et al. 22
2019). 23
We collected a large volume of soil (ca. 0.1 m³) in each forest patch from a pit with a depth of 15 cm 24
and a surface of 70 cm x 100 cm. We transported all 48 collected soil samples to the long-term 25

8
ecological research site (LTER) in the Aelmoeseneie forest in Belgium during November 2015- 1
February 2016 (50°58′30” N, 3°48′16” E, mean annual temperature (MAT) = 10.6 °C, mean annual 2
precipitation (MAP) = 768 mm, altitude = 20 m, N deposition (2016) = 15.5 kg N ha-1) (DEIMS-SDR 3
Database). We sieved the 48 bulk soil samples through a 5 mm mesh sieve. The sampled soil from 4
each forest patch was divided over eight mesocosms, one for each two-level factorial combination of 5
light x warming x temperature. Each mesocosm consisted of 13L sampled soil, placed in trays with 6
12 drainage holes (46.5 x 31.5 cm, depth of 19.5 cm) on top of 9 L of white sand to ensure proper 7
drainage. The bottom of the trays were first lined with a root fabric to ensure that plants would not 8
root in the site’s soil upon burying the mesocosms with their tops level to the ground. 9
Plant community assembly: slow and fast colonisers grow together 10
We compiled a pool of fifteen species commonly found in temperate European forests (Table 1) and 11
divided this species pool according to three emergent groups that are linked with a species’ 12
colonisation capacity and affinity to forests habitat (Verheyen et al. 2003; De Frenne, Baeten, et al. 13
2011; Heinken et al. 2019).Verheyen et al. (2003) quantified differences in functional and life-history 14
traits among 216 herbaceous species that colonised and established in post-agricultural forests to 15
varying degrees or remain confined to ancient forests, allowing the determination of traits that lead 16
to a successful colonisation. The varying success between species to colonise post-agricultural forest 17
was captured in the colonisation capacity index (CCI), where more negative values indicate a higher 18
capacity to successfully colonise into post-agricultural forests (Verheyen et al. 2003). The continuous 19
CCI scale exists from -100 to +100, where -100 means that the species only occurred in post-20
agricultural forest, while +100 means that the species was only found in ancient forest. The CCI scale 21
thus allows to estimate a species’ affinity to post-agricultural forest vs. ancient forest. We classified 22
these species in three groups based on our expert knowledge, guided by the CCI (Verheyen et al. 23
2003; De Frenne, Baeten, et al. 2011) and whether a species can be specified as a forest habitat 24
specialist (Heinken et al. 2019). The first group (A) are six poor colonisers and forest specialists, 25

9
typical of ancient forest (Table 1). The second group (B) are six intermediate colonizers of post-1
agricultural forest and not strictly forest specialists (Table 1). The final group (C) are three fast 2
colonising and generalist nitrophilic species with a higher affinity towards post-agricultural forest 3
and a large negative CCI (Table 1). We took both colonisation of species and forest habitat specificity 4
into account to classify these species. For those reasons, Polygonatum multiflorum is in group A as it 5
is a typical forest species even though it has a relatively low CCI. Likewise, group B incorporates 6
species with a wider range in habitat use that are not strictly forest specialists. Ajuga reptans and Poa 7
nemoralis can occur in grassy habitats and grasslands, while Hedera helix is often found in shaded 8
urban and rural habitats. The groups supported the planting process (see next paragraph). We used 9
the CCI directly to characterise species in the analysis (see “Data analysis”), because of its established 10
correlations between several life-history traits (Verheyen et al. 2003). 11
We created twelve species combinations (Supplementary Table 1) in which we randomly assigned 12
two poor colonisers (group A), two common colonisers of post-agricultural forest (group B) and one 13
fast-colonising nitrophilic species (group C). These twelve species combinations serve as 14
representative species assemblages in temperate mesotrophic deciduous forests in Europe, and are 15
solely used as random effect term in the analysis. The twelve species combinations are repeated four 16
times over the 48 soil samples in each two level factorial combination of light x warming x nitrogen 17
addition (48 soil samples x 8 factorial combinations = 384 mesocosms). We planted the 384 18
mesocosms in the first week of March 2016. Per mesocosm, we planted four individuals of each of 19
the five species in a grid (7x8.5 cm) in a randomised order using the sample function in R. This 20
planting scheme results in 20 plants per mesocosm. We planted these species from vegetative plant 21
material (Table 1) and obtained our plants from either the local population in the Aelmoeseneie forest 22
or Brakelbos (Belgium), or a local plant nursery that deals in wild plants for horticulture 23
(ECOFLORA, Halle, Belgium). During the first growing season (May, June, September 2016), we 24
applied three rounds of weeding, where we eradicated species that had emerged spontaneously from 25
the mesocosm soil. We buried all mesocosms with their tops at surface level, in a fenced area in the 26

10
Aelmoeseneie Forest (Belgium) with a tree canopy (95% cover) dominated by Fagus sylvatica, 1
Quercus robur, Acer pseudoplatanus, Fraxinus excelsior and Larix decidua. We buried mesocosms 2
in 96 random groups (“Plots”), of four mesocosms per plot, to apply manipulative experimental 3
treatments (see Fig. 1), as explained in the next section and following methods of De Frenne et al. 4
(2015). In total, we planted 7680 (384 mesocosms x 20) individuals of fifteen species (512 individuals 5
per species). 6
Manipulating the environment: N addition, experimental warming and enhanced light 7
availability 8
We have applied three two-level environmental treatments in a full-factorial design since April 2016. 9
Ongoing treatments consist of (i) nitrogen addition; (ii) experimental warming and (iii) enhanced 10
light availability (Supplementary Table 2 and 3). The first treatment is N addition (further referred to 11
as treatment “N”) by adding 0.25 L of a 2.01 g L-1 solution of NH4NO3 (50 kg N ha-1 yr-1 eq.) per 12
mesocosm. We then rinsed the leaves with 0.25 L of demineralised water to ensure that the applied 13
N did not remain adhered to plant tissues. We performed this treatment four times per year at the start 14
of each season, with the control mesocosms receiving 0.5 L of demineralised water. The second 15
treatment consisted of experimental warming (referred to as treatment “T”) with 75 cm-wide open 16
top chambers (De Frenne et al. 2010). We measured air temperature (15 cm above forest floor), 17
surface temperature (0 cm) and soil temperature (5 cm depth) in eight plots, one for each factorial 18
combination of light x warming x nitrogen, using 24 thermocouples which log every 30 seconds 19
(Type T miniature, TC Direct, The Netherlands and datalogger type CR1000, Campbell Scientific, 20
USA). In the first half of our sampling period (from March 1 until May 31), the forest canopy 21
developed and light could easily reach the open top chambers in order to warm the chamber. During 22
this period, we measured a significant increase (p<0.05) in daily mean air temperature of 1.04±0.47 23
°C, and statistically insignificant increases in surface temperature (0.46±0.26) and soil temperature 24
(0.13±0.30 °C ) at 5 cm depth (Supplementary Fig. 1). In the latter half of our sampling period (June 25

11
1 until August 31), the forest canopy closed which resulted in less effective warming, with no 1
significant differences (p>0.05) between the warming and control treatments at any depth. The third 2
treatment, light addition (referred to as “L”), adds 23.98±4.40 µmol m-2s-1 PAR to the ambient light 3
conditions (7.79±0.68 µmol m-2s-1 under fully closed canopy) by use of two 18 W fluorescent tubes 4
suspended 75 cm above ground level of each plot (Supplementary Fig. 2). This increment in light 5
availability can be associated to a small forest gap, and could increase carbon assimilation rates in 6
typical forest understorey plants by three times (Rothstein & Zak 2001). The lights are programmed 7
to follow the natural photoperiod throughout the year and did not significantly affect air temperatures 8
(De Frenne et al. 2015). Control plots receive ambient light and have a dummy lamppost suspended 9
over the plot to account for undesired side effects of the lamp installation other than light addition 10
(e.g. precipitation, interception, see Fig. 1). 11
Plant trait and community measurements 12
We measured plant height and SLA in the second growing season of the experiment, from March 13
2017 to September 2017, at the time of each species’ estimated biomass peak (Table 1). We chose 14
not to measure reproductive traits (i.e. seed mass) as proposed in the common leaf-height-seed 15
scheme (Westoby 1998; Laughlin et al. 2010). Seed mass and plant height are strongly positively 16
correlated in the global plant trait spectrum (Thomson et al. 2011; Díaz et al. 2016; Beckman et al. 17
2018), but also in forest herb species (Verheyen et al. 2003). Furthermore, several herbaceous species 18
in our pool favour clonal reproduction, so that seeding is often limited in these species (Klimešová et 19
al. 2016). Finally, these reproductive traits can be intensive to correctly measure and quantify given 20
our large numbers of test plants (Pérez-Harguindeguy et al. 2013). 21
We were able to measure plant height on 3445 survivors of the 7680 initially planted individuals 22
(45% survival). The number of plant height measurements (i.e. individual survivors) did not depend 23
on treatment effects (Supplementary Fig. 3). Differences in survival among species existed (Table 1, 24
Supplementary Table 4). Vegetative plant height was measured as the shortest distance between 25

12
ground level and the upper boundary of main photosynthetic tissues. This means that we solely 1
measured foliage height, not inflorescence or seeding height (Pérez-Harguindeguy et al. 2013). We 2
measured plant height using a common folding meter in centimetres up to one decimal place. 3
We measured average specific leaf area (SLA) as the one-sided area of multiple leaves from a single 4
species in each mesocosm, divided by the oven-dry mass and expressed in mm² mg-1 (Pérez-5
Harguindeguy et al. 2013). We collected maximally eight healthy leaves of each species and no more 6
than two per individual to avoid excessive damage to any individual plant. We only sampled outer 7
leaves (excluding petioles) because SLA can be strongly affected by light intensity (Pérez-8
Harguindeguy et al. 2013). The amount of SLA measurements did not vary due to treatments within 9
any species (Supplementary Fig. 4), while there were larger differences in measured SLA values 10
between species (Table 1, Supplementary Table 4). The projected area of the leaves was measured 11
with the Easy leaf area free mobile application (Easlon & Bloom 2014) within two hours of picking 12
the leaves, after taking a picture with a mobile phone (13 MP camera). This open-source software 13
package can estimate green leaf area in a RGB photograph by counting the total amount of green 14
pixels and converting this into an area measurement by counting red pixels from a 4 cm² calibration 15
square provided in the image. After the area measurement (mm²), each leaf sample was dried in an 16
oven at 65°C for 48 hours to ensure constant mass upon weighing (in mg). 17
We measured total vegetation cover (%), which is tightly linked with productivity, leaf biomass and 18
competition for light (Muukkonen et al. 2006). We measured vegetation cover as the one-sided 19
projection of vegetation in the tray. We measured vegetation cover two times during the experiment: 20
the first week of May (4th of May) and the second week of August (11th August). We used digital 21
RGB photographs of the mesocosms taken perpendicular to the ground surface and the Canopy Area 22
tool that measures green pixels of vegetation and recalculates this into a cover percentage (Easlon & 23
Bloom 2014). 24
Data analysis 25

13
All data analysis was performed in R (R Core Team 2019). We performed three analyses to assess 1
whether trait variation in plant height and SLA within species is a function of 1) vegetation cover, 2) 2
agricultural land-use history interacting with multiple environmental drivers and 3) a species’ 3
colonisation ability. We consequently addressed within-species trait variation in two ways. First, by 4
assessing change in mean trait values due to vegetation cover and treatments (hypothesis 1 and 2 5
respectively). Second, by looking at variability in traits across all measured values via the coefficient 6
of variation (CV, hypothesis 3). Prior to the analyses, we excluded Glechoma hederacea because this 7
species had fewer than 30 measurements (see Table 1). During the analysis on variation in mean plant 8
height and SLA (hypothesis 1 and 2), we excluded Geranium robertianum because there were too 9
few measurements to fit the model structure robustly. 10
In the first analysis, we tested whether vegetation cover explains differences in mean plant height and 11
SLA in each species (hypothesis 1). We calculated separate hierarchical linear mixed – effects models 12
(package: nlme, Pinheiro et al. 2018) for each species to estimate the mean trait value in response to 13
vegetation cover. The original Region of the soil (8 levels), Community (12 levels) and Plot (96 14
levels) are separate random effect terms in this structure, i.e. (1|Region) + (1|Community) + (1|Plot). 15
Adding the “Plot” random effect term was not possible for SLA because of limited degrees of freedom 16
(SLA is an averaged measure for each species in each mesocosm). The predictor variable is the 17
average vegetation cover (%) of each mesocosm measured between May 2017 and August 2017. We 18
checked normality in residuals with a Shapiro-Wilk test (function shapiro.test in stats package, R 19
Core Team 2019) on each model, and log-transformed the response variable when necessary to 20
achieve normality in model residuals. Log transforming the response was needed for six species in 21
plant height and five species in SLA (see Supplementary Table 5). We additionally tested whether 22
the covariate (Soil type), and two-way interactions (including main effects) of agricultural land-use 23
history (LU), enhanced light availability (L), nitrogen addition (N) and warming (T) directly 24
explained variation in total vegetation cover. We used the same hierarchical model structure as 25
explained above. 26

14
We tested the second hypothesis by estimating mean plant height and SLA of species in response to 1
two-way interactions of agricultural land-use history (LU), enhanced light availability (L), nitrogen 2
addition (N) and warming (T). Concretely, we calculated separate hierarchical linear mixed effects 3
models (function “lme” in package nlme, Pinheiro et al. 2018) for each species with six double 4
interactions including all four main effects (LU, L, N, T, LU:L, LU:N, LU:T, L:N, L:T, N:T) and an 5
extra covariate “Soil type”. We included the covariate “Soil type” (three levels: “eutrophic”, 6
“mesotrophic”, “oligotrophic”) in the models because inherent soil fertility can be a major source of 7
trait variation, even though it is not one of our focal environmental change predictors. The random 8
effects structure of these models is the same as in hypothesis 1, with “Region” (8 levels), “Community 9
combination” (12 levels) and “Plot” (96 levels) included. Prior to computing the tests, we checked 10
normality assumptions using a Shapiro-Wilk test (function shapiro.test in stats package, R Core Team 11
2019) on each model accompanied by a qq-plot and histogram on model residuals. We log-12
transformed when necessary to achieve normality in residuals, which was the case for seven species 13
for plant height and six species for SLA (see Supplementary Table 6). We performed ANOVA (F-14
test, function “anova” in stats package, R Core Team 2019) on one linear model for each of the 15
thirteen species per trait, which contain 11 terms per model (four main effects, six double interactions 16
and one covariate main effect). We applied an adjusted alpha (p<0.007) so that the expected value of 17
a false positive effect is less than 1 out of the 143 tested terms (alpha = 1/143 = 0.007) for a given 18
trait. If we had used the common alpha of p<0.05, the expected value of interpreting false positive 19
effects would have been 7 terms (143*0.05 = 7.15) for each trait. 20
We tested the third hypothesis by calculating the coefficient of variation (CV) for each species across 21
all measurements of plant height and SLA. We performed linear regression of the CV as function of 22
the species’ capacity to colonise post-agricultural forest. We used the colonisation capacity index 23
(CCI) to determine a species ability to successfully colonise post-agricultural forest (Verheyen et al. 24
2003), where more negative values denote a larger capacity to colonise post-agricultural forest. We 25
calculated the CV in plant height and SLA for the whole range of species’ trait values (so across all 26

15
treatments) as the ratio of the standard deviation to the estimate of the population mean. The 1
coefficient of variation is a simple measure for intraspecific trait variation and phenotypic plasticity 2
in the wide sense, i.e. when traits are not measured on individuals of the same genotype but of the 3
same species (Valladares et al. 2006). As we have computed one CV for each species for the whole 4
data set, we performed a non-hierarchical linear regression (function “lm” in stats package, R Core 5
Team 2019) of the species’ coefficient of variation in response to the species’ CCI for both traits 6
(alpha =0.05). 7
Results 8
Response of mean traits to vegetation cover 9
In the first analysis, we found that increasing vegetation cover related to changes in mean values of 10
both plant height and SLA. Vegetation cover (Table 2) was significantly higher on post-agricultural 11
forest soils (+6.06, se = 1.68), with light addition (+15.88, se = 1.79) and with warming (+8.41, se = 12
1.83). There was no evidence for interactions between environmental treatments in affecting 13
vegetation cover. In turn, we found that vegetation cover affected both species’ mean plant height 14
and mean SLA, while mean plant height was more responsive to vegetation cover than mean SLA 15
(Figure 2). Ten of the thirteen species had increasing mean plant height estimates with increasing 16
vegetation cover, all on p <0.001 (Supplementary Table 5). The largest absolute increase in plant 17
height occurred in Urtica dioica, also the fastest coloniser into post-agricultural forest (most negative 18
CCI). Its predicted mean plant height was 15.8 cm (95% confidence interval (CI): 8.4– 29.7 cm) at 19
the lowest community cover (36%) and 41.6 cm (95% CI: 22.2 - 78.0 cm) at the highest community 20
cover (96%). This is, over the range of total cover values that it occurred in, a relative increase in 21
mean plant height of 160%. However, the largest relative increase was a five-fold increase in mean 22
plant height that occurred in Ficaria verna. The model results show that this species increased its 23
mean plant height from 1.9 cm (95% CI: 1.05 – 2.83 cm) at 9 % total cover to 10.6 cm (95% CI: 8.7 24
– 12.5 cm) when the vegetation cover was 97 %. 25

16
For SLA, we found both significant increases and decreases in response to community vegetation 1
cover depending on the species. Species mean SLA decreased significantly in four species 2
(Aegopodium podagraria, Poa nemoralis, Vinca minor, Carex sylvatica) and increased in two 3
(Ficaria verna, Hyacinthoides non-scripta) in response to vegetation cover. However, the slopes were 4
not as pronounced as for the plant height response (Figure 2) with 30 % as a maximal decrease of 5
SLA for both Aegopodium podagraria and Carex sylvatica. The significant increases occurred within 6
a similar magnitude of 31% for Ficaria verna and 30% for Hyacinthoides non-scripta 7
(Supplementary Table 5). 8
Response of mean traits to environmental treatments 9
Plant height increased in response to the environmental treatments and agricultural land-use history 10
across several species (p<0.007, see Supplementary Table 6 for p-values). The pattern in significant 11
responses (Fig. 3) shows that a total of six species had significant plant height responses (excluding 12
the Soil type covariate), which mostly occurred in slow-colonising species (5 species), compared to 13
fast-colonising species (1 species). However, the covariate “Soil type” significantly affected plant 14
height in three species, all relatively fast colonisers based on CCI. The most important significant 15
(p<0.007) main effect in the plant height response was that of light addition which increased plant 16
height for four species (Fig. 4A, Supplementary Table 7). The largest relative increase in mean plant 17
height to light was found in Urtica dioica (+65%) followed by Carex sylvatica (+40%), Anemone 18
nemorosa (+28%) and Hyacinthoides non-scripta (+19%). Nitrogen addition did not affect any 19
species. Agricultural land-use history and warming each affected mean plant height of one species. 20
Galium odoratum responded positively to agricultural land-use history with a relative increase in 21
mean plant height of 15% (Fig. 4B and Supplementary Table 7). Vinca minor responded positively 22
to warming as a main effect with a relative increase of 2% (Fig. 4C, Supplementary Table 7). 23
However, the warming effect depended on light addition; when added together, its height increased 24

17
by 33%. This was the only interaction that we found in the analysis across all considered species (Fig. 1
4D, Supplementary Table 7). 2
Specific leaf area (SLA) had less significant responses to the environmental treatments and 3
agricultural land-use history than plant height (Fig. 3). The most common significant (p<0.007) main 4
effect was of warming. Warming increased SLA by 11% for Hyacinthoides non-scripta, by 9 % for 5
Anemone nemorosa and by 10% for Ficaria verna. Warming negatively affected SLA of Carex 6
sylvatica with a decrease of 6% (Fig. 4E, Supplementary Table 7). Light addition had a significant 7
negative main effect for two species: Carex sylvatica with a 15% decrease and Polygonatum 8
multiflorum with a 10% decrease (Figure 4F, Supplementary Table 7). SLA within species did not 9
respond to N addition and the forest land-use history and there were no significant interactions. In 10
summary, SLA increased in response to warming in the early flowering species Hyacinthoides non-11
scripta, Anemone nemorosa and Ficaria verna. Conversely, SLA decreased in late-flowering species, 12
in response to both light and warming (separately) for Carex sylvatica. 13
ITV in relation to a species’ colonisation capacity 14
In the final analysis (Fig. 5), we found that the coefficient of variation (CV) for plant height was 15
highest (p = 0.001, R² = 0.61) for species that exhibit fast colonisation into post-agricultural forest 16
(negative values in the colonisation capacity index, CCI). CV for plant height ranged from 0.29 for 17
the slow colonising Galium odoratum to 0.71 for the fast colonising Poa trivialis. CV for SLA ranged 18
from 0.12 for the slow colonising Anemone nemorosa to 0.33 for the fast-colonising Aegopodium 19
podagraria, but this response of SLA to the species’ colonisation capacity index was statistically not 20
significant (p = 0.50, R² = 0.038). Fast colonisers into post-agricultural forest thus show more 21
intraspecific variation in plant height as measured by CV than slow colonisers across the whole trait 22
range, but not in SLA. 23
18
Discussion 1
We found that variation in plant height and SLA of forest herbs under environmental change related 2
to the trait’s function. A general observation is that trait values of most species did not respond to 3
more than one main effect of a treatment. Interactions between the multiple environmental treatments 4
were hardly important in explaining variation in mean trait values of species. However, generalizable 5
patterns in plant height and SLA responses arose across species. Mean plant height values increased, 6
as vegetation cover increased in response to light addition, warming and agricultural land-use history. 7
The coefficient of variation (CV) for plant height was larger in fast colonising species. Contrastingly, 8
changes in mean SLA only occurred within selected species to improve light acquisition in shaded 9
conditions. These individualistic, functional trait responses to single factors benefit a particular 10
species' growth in the short term (Garnier et al. 2016). Our results suggest that 1) variation in plant 11
height relates to a greater vegetation cover in brighter conditions and largely benefits fast colonisers, 12
and 2) changing SLA is beneficial for species that have acclimatised to shaded conditions in forests, 13
i.e. vernal geophytes and shade-tolerant species. 14
Intraspecific variation in plant height 15
The variability in mean plant height could benefit growth, light acquisition and dispersal (Moles et 16
al. 2009). Plant size differences between individuals in communities can be an outcome of 17
asymmetric competition for light (DeMalach et al. 2016) as individuals invest in height to 18
disproportionately capture light from neighbours when vegetation becomes denser (Freckleton & 19
Watkinson 2001). We observed that mean vegetation cover of the community increased from 40% to 20
75 % due to combined effects of primarily light addition, followed by warming and an agricultural 21
land-use history. As the vegetation became denser and increased to maximal cover, individuals of 10 22
out of 13 species nearly doubled in mean plant height. This plant height response to vegetation cover 23
was stronger than the plant height response of species to environmental change directly. This 24
observation could indicate that competition mediated by larger vegetation cover better explains plant 25

19
height change than altered environmental conditions per se. A large meta-analysis on functional trait 1
variation in forest herbs also found that changing vegetation cover, due to environmental change or 2
otherwise, was a strong predictor for larger plant height values in forests herbs (Burton et al. 2017). 3
Light was the main driver for mean plant height increases and affected four out of thirteen species. 4
Lemke et al. (2015) also found that plant height increased in response to light availability, but only 5
in a graminoid and not in a forb. Warming was of minor importance and affected one out of thirteen 6
species. We had expected that more plant species would respond positively to warming, given that 7
individuals of forest herb species are taller in warmer areas of their range (Kollmann & Bañuelos 8
2004; De Frenne, Graae, et al. 2011; De Frenne et al. 2014; Lemke et al. 2015). Agricultural land-9
use history and N addition barely affected plant height values. This suggests that, in general, nutrient 10
availability was less limiting than light availability. Adding the equivalent of ca. 50 kg N ha-1yr-1 (the 11
equivalent of N deposition near a point source, e.g. a pig farm) yielded limited individualistic plant 12
responses. This is likely due to a high ambient N deposition (15.5 kg N ha-1yr-1) which already falls 13
within the critical load range (10 – 20 kg N ha-1yr-1) for temperate broadleaved forest (Bobbink et al. 14
2015). However, including the inherent soil fertility as a covariate in the analysis did explain mean 15
plant height differences in three species. This suggests that pH – influenced nutrient availability can 16
be an important driver for trait variation as well (Siefert 2012). Other studies suggest that nutrient 17
enrichment from N addition or agricultural land-use history can increase height of forest herb 18
individuals, with a taller plant community as a result (Baeten et al. 2010; Tatarko & Knops 2018). 19
However, many of these studies were performed on individual species growing in pots, rather than in 20
a field community such as in our study. The relatively few responses of plant height to environmental 21
change directly could thus exemplify that community properties (i.e. vegetation cover) determine an 22
individual’s short-term response to environmental change (Bennett et al. 2016). 23
We also found that the variability in plant height values (CV) was larger within species with a good 24
colonisation capacity into post-agricultural forest than within slow colonisers. For fast-colonising 25

20
wind-dispersers, plasticity in height is important to disperse seed further than neighbouring plants 1
(Thomson et al. 2011) apart from the benefits it yields in capturing light (Freckleton & Watkinson 2
2001). Slow colonising forest herbs would need to invest less in above-ground biomass to disperse, 3
as bud banks are more common for multiplication (Klimešová et al. 2016; Ott et al. 2019). Overall, 4
these findings suggest that variation in plant height largely benefits fast colonisers when vegetation 5
cover is high. 6
Intraspecific variation in specific leaf area (SLA) 7
SLA is a functional trait that is related to trade-offs in photosynthetic machinery and the associated 8
leaf economics spectrum (Wright et al. 2004). We observed responses of SLA in selected species that 9
typically perform photosynthesis in shaded temperate forest, while we did not find a clear relation 10
between colonisation capacity and the CV of SLA in a species. SLA responded only to light and 11
warming, and solely in shade-avoiding geophytes or shade-tolerant plants that grow under the closed 12
canopy (Verheyen et al. 2003; De Frenne, Baeten, et al. 2011). Interestingly, within-species SLA can 13
both increase or decrease in response to a gradient going from shady to sunny conditions (Garnier et 14
al. 2016). We observed both directions in our study, given contrasting species responses to warming 15
and light addition respectively. 16
Growing temperatures can positively affect SLA of individuals (Atkin et al. 2006). This relationship 17
for forest herbs has been established along latitudinal (De Frenne, Graae, et al. 2011) and elevation 18
gradients (Midolo et al. 2019) where lower SLA is expected at colder, higher latitudes and altitudes. 19
The increasing mean SLA in response to warming of the early flowering geophytes Hyacinthoides 20
non-scripta, Anemone nemorosa and Ficaria verna would thus be advantageous for these spring-21
flowering geophytes. These are the three earliest species in our species pool to reach their peak 22
biomass during the growing season, and need to withstand frosty nights in early spring to sustain 23
growth. A common response to low air temperatures in plants is to have thicker leaves, which raises 24
leaf mass (Pérez-Harguindeguy et al. 2013) but invokes an important mass-investment trade-off 25
21
considering the short life-span of their leaves (Wright et al. 2004; Jagodziński et al. 2016). Our three 1
vernal species likely benefitted from the 1°C increase in air temperature because they decreased leaf 2
thickness, and thus mass investments, which yields a higher photosynthetic surface area per unit of 3
mass investment (SLA). Conversely, we found that SLA decreased in response to light for Carex 4
sylvatica and Polygonatum multiflorum, shade-tolerant species that flower under closed canopies in 5
ancient forests (Wulf 1997; Bossuyt et al. 1999). Shade tolerant species are generally not plastic in 6
leaf physiology, but can be in leaf morphology (Wright et al. 2004; Milla & Reich 2007; Valladares 7
& Niinemets 2008). Individual plants usually develop a higher SLA when grown under low light 8
conditions (Reich et al. 2003; Rozendaal et al. 2006; Feng & Van Kleunen 2014; Liu et al. 2016) to 9
optimize light capture and carbon gain in those environments (Evans & Poorter 2001). A lower SLA 10
of the shade-tolerant species Carex sylvatica and Polygonatum multiflorum within the light treatment 11
followed this pattern. 12
We found limited effects of N addition and agricultural land-use history on SLA of species. Other 13
studies suggest that intraspecific SLA either has a limited or positive response to enhanced nutrient 14
availability due to agricultural land-use history (Siefert 2012; Siefert & Ritchie 2016) or N addition 15
(Zhou et al. 2018; Firn et al. 2019). In any case, leaf nutrient content and leaf dry matter are more 16
consistent in predicting leaf trait variation in response to larger nutrient availability (Smart et al. 2017; 17
Firn et al. 2019). SLA of multiple forests herbs have been found to be highly sensitive to a changing 18
light availability, which makes SLA a relatively unreliable predictor of altered nutrient availability 19
(Burton et al. 2017). 20
Perspectives on trait variation in a changing world 21
Our experimental design allows disentangling of multiple environmental change treatments on trait 22
expressions of typical forest herb species. A major outcome of this experiment is the lack of 23
treatment interactions on intraspecific trait values. Instead, simple univariate treatment responses of 24
height and SLA were detected. Patterns in plant species growth responses to warming (Hollister et 25

22
al. 2005), light availability (Rozendaal et al. 2006) and high nutrient availability (Fynn & O’Connor 1
2005) have long been shown to be dependent on the species, suggesting different limiting factors 2
for plant species that naturally occur in the same communities (Chapin & Shaver 1985). Such 3
selective plant responses to our considered environmental factors imply a “Gleasonian” perspective 4
regarding plant responses to global change and its effect on community organisation: one where 5
individualistic trait expressions to simple environmental factors determines the interactions between 6
species (Gleason 1926; Nicolson & Mcintosh 2002; Götzenberger et al. 2012). This individualistic 7
perspective could however pose a gross underestimation of the complex multidimensional 8
interactions between energy and nutrients, consumers and competitors, and time, in affecting 9
plasticity of traits in observed communities (Westneat et al. 2019). Our experimental approach did 10
allow us to unravel the importance of drivers that are entangled in the natural world. Important 11
entangled factors are light availability and warming in forest gap conditions, and species 12
composition of understorey communities due to agricultural land-use history. This disentangled 13
view showed that vegetation cover responded to environmental change and in turn affected trait 14
values of species. Individualistic species responses further promoted ITV due to changing resources 15
and conditions. 16
Apart from competition in the community affecting ITV (Bennett et al. 2016), species richness effects 17
on ITV could occur as well as a result of resource partitioning (Lipowsky et al. 2015). We did not 18
look into these effects by keeping a constant species richness across communities at the time of 19
planting (5 species); this was not to inflate the experimental design. We also did not look into genetic 20
variation within species, as the component of genetic variation and local adaptation in ITV generally 21
becomes more prominent at larger geographical scales (Albert et al. 2011; Lajoie & Vellend 2015; 22
Moran et al. 2016; Veresoglou & Penuelas 2019). However, it is likely that local adaptation in species 23
across a large geographical gradient could alter various trade-offs between functional traits within 24
those species (Oldfather 2019). Such genetic variation between populations of species could 25
consequently influence the magnitude of ITV in response to environmental change (Kahl et al. 2019). 26

23
Against our expectations, this short-term mesocosm experiment barely revealed any interactive 1
effects between the multiple treatments on plant trait variation. This lack of interaction on the short-2
term does not imply that such interactive effects are not important for functional trait responses to 3
global change. It rather shows the complementary of experimental research to long-term vegetation 4
resurveys (Verstraeten et al. 2013; Perring, Diekmann, et al. 2018; Perring, Bernhardt-Römermann, 5
et al. 2018) or mechanistic modelling approaches (Dirnböck et al. 2017; Landuyt et al. 2018). Long-6
term experiments, vegetation resurveys and modelling are perhaps better suited to unravel such long-7
term interactive effects between global change drivers on understorey trait variation (Luo et al. 2011; 8
Verheyen et al. 2017). Most probably, interactions between the treatments in this experiment could 9
emerge after prolonged time when resources and conditions other than light become more limiting 10
(Oliver & Morecroft 2014). 11
Conclusions and future directions 12
It is known that estimating ITV in response to land-use legacies (Siefert & Ritchie 2016) and 13
environmental change (Bolnick et al. 2011; Albert et al. 2011) can be important for predicting the 14
future of plant communities. Here we assessed ITV in plant height and SLA of forest herbs with 15
different colonisation abilities and affinity to forest habitat, in response to community growth and 16
multiple environmental changes, and on a distinct local scale via a manipulative experiment. Contrary 17
to our expectations, we found that interactions between environmental drivers were not important in 18
explaining variation in traits. A lack of interactive treatment effects could suggest that traits respond 19
individualistically to single factors that benefit a species’ growth. We showed that increases in within-20
species mean plant height relate to a greater vegetation cover in brighter conditions, and largely 21
benefitted fast colonisers. Trait variation in SLA promoted species that are acclimated to shaded 22
conditions in forests, as within-species mean SLA distinguished between shade-avoiding vernal 23
species, given their response to warming, and shade-tolerant species, given their response to light 24
addition. 25

24
The responses in plant height and SLA occurred after one growing season following herb layer 1
introduction in the experimental communities. Understorey plant responses to environmental change 2
remained individualistic for now, but with decades of time after the initial trait response (Gross et al. 3
2009), these patterns could reveal how community assembly veers towards fast-growing and fast-4
colonising species in disturbed forests when light availability is high. When typical forest herbs would 5
be introduced in such disturbed forests, these could be excluded from community assembly in the 6
long run by more generalist species (see Baeten and Verheyen, 2017). Patterns in ITV at initial stages 7
of plant species establishment could thus potentially reflect the trajectory in community assembly 8
after prolonged time. 9
Author contributions 10
• HB, PDF, EDL, LD, SLM, MPP and KV designed the study. SG and PV added conceptual 11
views in a later stage of the study. 12
• HB and EDL collected the data. 13
• HB performed statistical analyses, with significant inputs from MPP, DL and KV. 14
• HB led the writing of the manuscript, with significant inputs from MPP and KV. All authors 15
provided comments on the manuscript at several stages in its development. 16
Data archiving 17
Data will be made available via http://www.pastforward.ugent.be/data.html 18
Funding information 19
This work was supported by the European research council (ERC) for funding the study through 20
PASTFORWARD [ERC Consolidator Grant 614839, assigned to KV]. We thank the Research 21
Foundation – Flanders (FWO) for supporting DL. 22

25
Acknowledgements 1
Special thanks to Laurent Bergès, Jörg Brunet, Guillaume Decocq, Martin Diekmann, Jaan Liira and 2
Monika Wulf for their help with relocation of the forest patches for the soil collection. We thank Filip 3
Ceunen, Kris Ceunen and Luc Willems for their technical support in setting up the experiment. We 4
thank all 30+ colleagues in the Forest & Nature Lab who helped in March 2016 with planting the 5
mesocosms. We thank all people that helped in collecting trait data: Adrien Berquer, Kris Ceunen 6
and Robbe De Beelde. We thank the reviewers and editor for providing valuable comments to the 7
manuscript. 8

26
References 1
Adler P.B., Salguero-Gomez R., Compagnoni A., Hsu J.S., Ray-Mukherjee J., Mbeau-Ache C., Franco M. 2
(2014) Functional traits explain variation in plant life history strategies. Proceedings of the 3
National Academy of Sciences 111:740–745. 4
Albert C.H., Grassein F., Schurr F.M., Vieilledent G., Violle C. (2011) When and how should intraspecific 5
variability be considered in trait-based plant ecology? Perspectives in Plant Ecology, Evolution and 6
Systematics 13:217–225. 7
Albert C.H., Thuiller W., Yoccoz N.G., Soudant A., Boucher F., Saccone P., Lavorel S. (2010) Intraspecific 8
functional variability: extent, structure and sources of variation. Journal of Ecology 98:604–613. 9
Alpert P., Simms E.L. (2002) The relative advantages of plasticity and fixity in different environments: 10
when is it good for a plant to adjust? Evolutionary Ecology 16:285–297. 11
Atkin O.K., Loveys B.R., Atkinson L.J., Pons T.L. (2006) Phenotypic plasticity and growth temperature: 12
understanding interspecific variability. Journal of Experimental Botany 57:267–281. 13
Baeten L., Vanhellemont M., De Frenne P., De Schrijver A., Hermy M., Verheyen K. (2010) Plasticity in 14
response to phosphorus and light availability in four forest herbs. Oecologia 163:1021–1032. 15
Baeten L., Verheyen K. (2017) Changes in the nature of environmental limitation in two forest herbs 16
during two decades of forest succession. Journal of Vegetation Science 28:883–892. 17
Baeten L., Verstraeten G., De Frenne P., Vanhellemont M., Wuyts K., Hermy M., Verheyen K. (2011) 18
Former land use affects the nitrogen and phosphorus concentrations and biomass of forest herbs. 19
Plant Ecology 212:901–909. 20
Le Bagousse-Pinguet Y., Börger L., Quero J.-L., García-Gómez M., Soriano S., Maestre F.T., Gross N. 21
(2015) Traits of neighbouring plants and space limitation determine intraspecific trait variability in 22
semi-arid shrublands. Journal of Ecology 103:1647–1657. 23

27
Beckman N.G., Bullock J.M., Salguero-Gómez R. (2018) High dispersal ability is related to fast life-history 1
strategies. Journal of Ecology 106:1349–1362. 2
Begon M., Harper J.L., Townsend C.R. (1996) Ecology: Individuals, populations and communities, Third 3
Edit. Blackwell Science Ltd. 4
Bennett J.A., Riibak K., Tamme R., Lewis R.J., Pärtel M. (2016) The reciprocal relationship between 5
competition and intraspecific trait variation (M. Semchenko, Ed.). Journal of Ecology 104:1410–6
1420. 7
Bjorkman A.D., Myers-Smith I.H., Elmendorf S.C., Normand S., Rüger N., Beck P.S.A., Blach-Overgaard A., 8
Blok D., Cornelissen J.H.C., Forbes B.C., Georges D., Goetz S.J., Guay K.C., Henry G.H.R., 9
HilleRisLambers J., Hollister R.D., Karger D.N., Kattge J., Manning P., Prevéy J.S., Rixen C., 10
Schaepman-Strub G., Thomas H.J.D., Vellend M., Wilmking M., Wipf S., Carbognani M., Hermanutz 11
L., Lévesque E., Molau U., Petraglia A., Soudzilovskaia N.A., Spasojevic M.J., Tomaselli M., Vowles 12
T., Alatalo J.M., Alexander H.D., Anadon-Rosell A., Angers-Blondin S., Beest M. te, Berner L., Björk 13
R.G., Buchwal A., Buras A., Christie K., Cooper E.J., Dullinger S., Elberling B., Eskelinen A., Frei E.R., 14
Grau O., Grogan P., Hallinger M., Harper K.A., Heijmans M.M.P.D., Hudson J., Hülber K., Iturrate-15
Garcia M., Iversen C.M., Jaroszynska F., Johnstone J.F., Jørgensen R.H., Kaarlejärvi E., Klady R., 16
Kuleza S., Kulonen A., Lamarque L.J., Lantz T., Little C.J., Speed J.D.M., Michelsen A., Milbau A., 17
Nabe-Nielsen J., Nielsen S.S., Ninot J.M., Oberbauer S.F., Olofsson J., Onipchenko V.G., Rumpf S.B., 18
Semenchuk P., Shetti R., Collier L.S., Street L.E., Suding K.N., Tape K.D., Trant A., Treier U.A., 19
Tremblay J.-P., Tremblay M., Venn S., Weijers S., Zamin T., Boulanger-Lapointe N., Gould W.A., Hik 20
D.S., Hofgaard A., Jónsdóttir I.S., Jorgenson J., Klein J., Magnusson B., Tweedie C., Wookey P.A., 21
Bahn M., Blonder B., van Bodegom P.M., Bond-Lamberty B., Campetella G., Cerabolini B.E.L., 22
Chapin F.S., Cornwell W.K., Craine J., Dainese M., de Vries F.T., Díaz S., Enquist B.J., Green W., Milla 23
R., Niinemets Ü., Onoda Y., Ordoñez J.C., Ozinga W.A., Penuelas J., Poorter H., Poschlod P., Reich 24
P.B., Sandel B., Schamp B., Sheremetev S., Weiher E. (2018) Plant functional trait change across a 25
warming tundra biome. Nature 562:57–62. 26

28
Blondeel H., Perring M.P., Bergès L., Brunet J., Decocq G., Depauw L., Diekmann M., Landuyt D., Liira J., 1
Maes S.L., Vanhellemont M., Wulf M., Verheyen K. (2019) Context-dependency of agricultural 2
legacies in temperate forest soils. Ecosystems 22:781–795. 3
Bobbink R., Hicks K., Galloway J., Spranger T., Alkemade R., Ashmore M., Bustamante M., Cinderby S., 4
Davidson E., Dentener F., Emmett B., Erisman J.W., Fenn M., Gilliam F., Nordin A., Pardo L., De 5
Vries W. (2010) Global assessment of nitrogen deposition effects on terrestrial plant diversity: A 6
synthesis. Ecological Applications 20:30–59. 7
Bobbink R., Tomassen H., Weijters M., van den Berg L., Braun S., Nordin A., Schütz K., Hettelingh J.P. 8
(2015) Chapter 4: Effects and empirical critical loads of Nitrogen for Europe. In: Critical Loads and 9
Dynamic Risk Assessments.pp 297–326. 10
Bolnick D.I., Amarasekare P., Araújo M.S., Bürger R., Levine J.M., Novak M., Rudolf V.H.W., Schreiber S.J., 11
Urban M.C., Vasseur D.A. (2011) Why intraspecific trait variation matters in community ecology. 12
Trends in Ecology & Evolution 26:183–192. 13
Borer E.T., Harpole W.S., Adler P.B., Lind E.M., Orrock J.L., Seabloom E.W., Smith M.D. (2014) Finding 14
generality in ecology: a model for globally distributed experiments. Methods in Ecology and 15
Evolution 5:65–73. 16
Bossuyt B., Hermy M., Deckers J. (1999) Migration of herbaceous plant species across ancient-recent 17
forest ecotones in central Belgium. Journal of Ecology 87:629–638. 18
Bruelheide H., Dengler J., Purschke O., Lenoir J., Jiménez-Alfaro B., Hennekens S.M., Botta-Dukát Z., 19
Chytrý M., Field R., Jansen F., Kattge J., Pillar V.D., Schrodt F., Mahecha M.D., Peet R.K., Sandel B., 20
van Bodegom P., Altman J., Alvarez-Dávila E., Arfin Khan M.A.S., Attorre F., Aubin I., Baraloto C., 21
Barroso J.G., Bauters M., Bergmeier E., Biurrun I., Bjorkman A.D., Blonder B., Čarni A., Cayuela L., 22
Černý T., Cornelissen J.H.C., Craven D., Dainese M., Derroire G., De Sanctis M., Díaz S., Doležal J., 23
Farfan-Rios W., Feldpausch T.R., Fenton N.J., Garnier E., Guerin G.R., Gutiérrez A.G., Haider S., 24
Hattab T., Henry G., Hérault B., Higuchi P., Hölzel N., Homeier J., Jentsch A., Jürgens N., Kącki Z., 25
29
Karger D.N., Kessler M., Kleyer M., Knollová I., Korolyuk A.Y., Kühn I., Laughlin D.C., Lens F., Loos J., 1
Louault F., Lyubenova M.I., Malhi Y., Marcenò C., Mencuccini M., Müller J. V., Munzinger J., Myers-2
Smith I.H., Neill D.A., Niinemets Ü., Orwin K.H., Ozinga W.A., Penuelas J., Pérez-Haase A., Petřík P., 3
Phillips O.L., Pärtel M., Reich P.B., Römermann C., Rodrigues A. V., Sabatini F.M., Sardans J., 4
Schmidt M., Seidler G., Silva Espejo J.E., Silveira M., Smyth A., Sporbert M., Svenning J.-C., Tang Z., 5
Thomas R., Tsiripidis I., Vassilev K., Violle C., Virtanen R., Weiher E., Welk E., Wesche K., Winter M., 6
Wirth C., Jandt U. (2018) Global trait–environment relationships of plant communities. Nature 7
Ecology & Evolution 8
Burton J.I., Perakis S.S., McKenzie S.C., Lawrence C.E., Puettmann K.J. (2017) Intraspecific variability 9
and reaction norms of forest understorey plant species traits. Functional Ecology 31:1881–1893. 10
Cadotte M.W., Arnillas C.A., Livingstone S.W., Yasui S.-L.E. (2015) Predicting communities from 11
functional traits. Trends in Ecology & Evolution 30:510–511. 12
Chapin F.S., Shaver G.R. (1985) Individualistic growth response of tundra plant species to environmental 13
manipulations in the field. Ecology 66:564–576. 14
Craine J.M., Dybzinski R. (2013) Mechanisms of plant competition for nutrients, water and light (D. 15
Robinson, Ed.). Functional Ecology 27:833–840. 16
DEIMS-SDR Database (2019) DEIMS-SDR: Dynamic Ecological Information Management System - Site 17
and dataset registry. 18
DeMalach N., Zaady E., Weiner J., Kadmon R. (2016) Size asymmetry of resource competition and the 19
structure of plant communities. Journal of Ecology 104:899–910. 20
Díaz S., Kattge J., Cornelissen J.H.C., Wright I.J., Lavorel S., Dray S., Reu B., Kleyer M., Wirth C., Colin 21
Prentice I., Garnier E., Bönisch G., Westoby M., Poorter H., Reich P.B., Moles A.T., Dickie J., Gillison 22
A.N., Zanne A.E., Chave J., Joseph Wright S., Sheremet’ev S.N., Jactel H., Baraloto C., Cerabolini B., 23
Pierce S., Shipley B., Kirkup D., Casanoves F., Joswig J.S., Günther A., Falczuk V., Rüger N., Mahecha 24

30
M.D., Gorné L.D. (2016) The global spectrum of plant form and function. Nature 529:167–171. 1
Dirnböck T., Foldal C., Djukic I., Kobler J., Haas E., Kiese R., Kitzler B. (2017) Historic nitrogen deposition 2
determines future climate change effects on nitrogen retention in temperate forests. Climatic 3
Change 144:221–235. 4
Easlon H.M., Bloom A.J. (2014) Easy Leaf Area: Automated digital image analysis for rapid and accurate 5
measurement of leaf area. Applications in plant sciences 2:1400033. 6
Escudero A., Valladares F. (2016) Trait-based plant ecology: moving towards a unifying species 7
coexistence theory. Oecologia 180:919–922. 8
Evans J.R., Poorter H. (2001) Photosynthetic acclimation of plants to growth irradiance: The relative 9
importance of specific leaf area and nitrogen partitioning in maximizing carbon gain. Plant, Cell 10
and Environment 24:755–767. 11
Fajardo A., Siefert A. (2018) Intraspecific trait variation and the leaf economics spectrum across 12
resource gradients and levels of organization. Ecology 99:1024–1030. 13
Feng Y., Van Kleunen M. (2014) Responses to shading of naturalized and non-naturalized exotic woody 14
species. Annals of Botany 114:981–989. 15
Firn J., Mcgree J.M., Harvey E., Flores-moreno H., Schütz M., Buckley Y.M., Borer E.T., Seabloom E.W., 16
Pierre K.J. La, Macdougall A.M., Prober S.M., Stevens C.J., Sullivan L.L., Porter E., Ladouceur E., 17
Allen C., Moromizato K.H., Morgan J.W., Harpole W.S., Hautier Y., Eisenhauer N., Wright J.P., Adler 18
P.B., Brown C.S., Bugalho M.N., Caldeira M.C., Cleland E.E., Ebeling A., Fay P.A., Hagenah N., 19
Kleinhesselink A.R., Mitchell R., Moore J.L., Nogueira C., Peri P.L., Roscher C., Smith M.D., Wragg 20
P.D., Risch A.C. (2019) Leaf nutrients, not specific leaf area, are consistent indicators of elevated 21
nutrient inputs. Nature Ecology & Evolution 22
Fraterrigo J.M., Pearson S.M., Turner M.G. (2009) The response of understory herbaceous plants to 23
nitrogen fertilization in forests of different land-use history. Forest Ecology and Management 24

31
257:2182–2188. 1
Freckleton R.P., Watkinson A.R. (2001) Asymmetric competition between plant species. Functional 2
Ecology 15:615–623. 3
De Frenne P., Baeten L., Graae B.J., Brunet J., Wulf M., Orczewska A., Kolb A., Jansen I., Jamoneau A., 4
Jacquemyn H., Hermy M., Diekmann M., De Schrijver A., De Sanctis M., Decocq G., Cousins S.A.O., 5
Verheyen K. (2011) Interregional variation in the floristic recovery of post-agricultural forests. 6
Journal of Ecology 99:600–609. 7
De Frenne P., Coomes D.A., De Schrijver A., Staelens J., Alexander J.M., Bernhardt-Römermann M., 8
Brunet J., Chabrerie O., Chiarucci A., den Ouden J., Eckstein R.L., Graae B.J., Gruwez R., Hédl R., 9
Hermy M., Kolb A., Mårell A., Mullender S.M., Olsen S.L., Orczewska A., Peterken G., Petřík P., Plue 10
J., Simonson W.D., Tomescu C. V., Vangansbeke P., Verstraeten G., Vesterdal L., Wulf M., Verheyen 11
K. (2014) Plant movements and climate warming: intraspecific variation in growth responses to 12
nonlocal soils. New Phytologist 202:431–441. 13
De Frenne P., Graae B.J., Kolb A., Shevtsova A., Baeten L., Brunet J., Chabrerie O., Cousins S.A.O., Decocq 14
G., Dhondt R., Diekmann M., Gruwez R., Heinken T., Hermy M., Öster M., Saguez R., Stanton S., Tack 15
W., Vanhellemont M., Verheyen K. (2011) An intraspecific application of the leaf-height-seed 16
ecology strategy scheme to forest herbs along a latitudinal gradient. Ecography 34:132–140. 17
De Frenne P., Rodríguez-Sánchez F., De Schrijver A., Coomes D. a., Hermy M., Vangansbeke P., Verheyen 18
K. (2015) Light accelerates plant responses to warming. Nature Plants 1 19
De Frenne P., De Schrijver A., Graae B.J., Gruwez R., Tack W., Vandelook F., Hermy M., Verheyen K. 20
(2010) The use of open-top chambers in forests for evaluating warming effects on herbaceous 21
understorey plants. Ecological Research 25:163–171. 22
Funk J.L., Larson J.E., Ames G.M., Butterfield B.J., Cavender-Bares J., Firn J., Laughlin D.C., Sutton-Grier 23
A.E., Williams L., Wright J. (2017) Revisiting the Holy Grail: using plant functional traits to 24

32
understand ecological processes. Biological Reviews 92:1156–1173. 1
Fynn R.W.S., O’Connor T.G. (2005) Determinants of community organization of a South African mesic 2
grassland. Journal of Vegetation Science 16:93–102. 3
Garnier E., Navas M.L., Grigulis K. (2016) Plant functional diversity. Organism traits, community 4
structure, and ecosystem properties. Oxford University Press, Oxford, UK. 5
Gilliam F.S. (2007) The ecological significance of the herbaceous layer in temperate forest ecosystems. 6
Bioscience 57:845–858. 7
Gleason H. (1926) The individualistic concept of the plant association. Bulletin of the Torrey Botanical 8
Club 53:7–26. 9
Götzenberger L., de Bello F., Bråthen K.A., Davison J., Dubuis A., Guisan A., Lepš J., Lindborg R., Moora 10
M., Pärtel M., Pellissier L., Pottier J., Vittoz P., Zobel K., Zobel M. (2012) Ecological assembly rules in 11
plant communities-approaches, patterns and prospects. Biological Reviews 87:111–127. 12
Gross N., Kunstler G., Liancourt P., De Bello F., Suding K.N., Lavorel S. (2009) Linking individual 13
response to biotic interactions with community structure: a trait-based framework. Functional 14
Ecology 23:1167–1178. 15
Heinken T., Diekmann M., Liira J., Orczewska A., Brunet J., Chytrý M., Chabrerie O., De Frenne P., Decocq 16
G., Drevojan P., Dzwonko Z., Ewald J., Feilberg J., Graae B.J., Grytnes J.A., Hermy M., Kriebitzch W.-17
U., Laivins M., Lindmo S., Marage D., Marozas V., Meirland A., Niemeyer T., Paal J., Prysek P., 18
Roosaluste E., Sadlo J., Schaminée J.H.J., Schmidt M., Tyler T., Verheyen K., Wulf M. (2019) 19
European forest vascular plant species list. 20
Hejcman M., Křišťálová V., Červená K., Hrdličková J., Pavlů V. (2012) Effect of nitrogen, phosphorus and 21
potassium availability on mother plant size, seed production and germination ability of Rumex 22
crispus. Weed Research 52:260–268. 23

33
Helsen K., Acharya K.P., Brunet J., Cousins S.A.O., Decocq G., Hermy M., Kolb A., Lemke I.H., Lenoir J., 1
Plue J., Verheyen K., De Frenne P., Graae B.J. (2017) Biotic and abiotic drivers of intraspecific trait 2
variation within plant populations of three herbaceous plant species along a latitudinal gradient. 3
BMC Ecology 17:1–12. 4
Henn J.J., Buzzard V., Enquist B.J., Halbritter A.H., Klanderud K., Maitner B.S., Michaletz S.T., Pötsch C., 5
Seltzer L., Telford R.J., Yang Y., Zhang L., Vandvik V. (2018) Intraspecific trait variation and 6
phenotypic plasticity mediate alpine plant species response to climate change. Frontiers in Plant 7
Science 9 8
Henneron L., Chauvat M., Archaux F., Akpa-Vinceslas M., Bureau F., Dumas Y., Mignot L., Ningre F., 9
Perret S., Richter C., Balandier P., Aubert M. (2017) Plant interactions as biotic drivers of plasticity 10
in leaf litter traits and decomposability of Quercus petraea. Ecological Monographs 87:321–340. 11
Hoeppner S.S., Dukes J.S. (2012) Interactive responses of old-field plant growth and composition to 12
warming and precipitation. Global Change Biology 18:1754–1768. 13
Hollister R.D., Webber P.J., Bay C. (2005) Plant response to temperature in Northern Alaska: 14
Implications for predicting vegetation change. Ecology 86:1562–1570. 15
Jagodziński A.M., Dyderski M.K., Rawlik K., Katna B. (2016) Seasonal variability of biomass, total leaf 16
area and specific leaf area of forest understory herbs reflects their life strategies. Forest Ecology 17
and Management 374:71–81. 18
Jung V., Violle C., Mondy C., Hoffmann L., Muller S. (2010) Intraspecific variability and trait-based 19
community assembly. Journal of Ecology 98:1134–1140. 20
Kahl S.M., Lenhard M., Joshi J. (2019) Compensatory mechanisms to climate change in the widely 21
distributed species Silene vulgaris. Journal of Ecology:1–13. 22
Klimešová J., Tackenberg O., Herben T. (2016) Herbs are different : clonal and bud bank traits can 23
matter more than leaf – height – seed traits. New phytologist 210:13–17. 24

34
Kollmann J., Bañuelos M.J. (2004) Latitudinal trends in growth and phenology of the invasive alien plant 1
Impatiens glandulifera (Balsaminaceae). Diversity and Distributions 10:377–385. 2
Lajoie G., Vellend M. (2015) Understanding context dependence in the contribution of intraspecific 3
variation to community trait–environment matching. Ecology 96:2912–2922. 4
Lajoie G., Vellend M. (2018) Characterizing the contribution of plasticity and genetic differentiation to 5
community-level trait responses to environmental change. Ecology and Evolution 8:3895–3907. 6
Landuyt D., Perring M.P., Seidl R., Taubert F., Verbeeck H., Verheyen K. (2018) Modelling understorey 7
dynamics in temperate forests under global change–Challenges and perspectives. Perspectives in 8
Plant Ecology, Evolution and Systematics 31:44–54. 9
Laughlin D.C., Joshi C., van Bodegom P.M., Bastow Z.A., Fulé P.Z. (2012) A predictive model of 10
community assembly that incorporates intraspecific trait variation (T. Fukami, Ed.). Ecology 11
Letters 15:1291–1299. 12
Laughlin D.C., Leppert J.J., Moore M.M., Sieg C.H. (2010) A multi-trait test of the leaf-height-seed plant 13
strategy scheme with 133 species from a pine forest flora. Functional Ecology 24:493–501. 14
Lemke I.H., Kolb A., Graae B.J., De Frenne P., Acharya K.P., Blandino C., Brunet J., Chabrerie O., Cousins 15
S.A.O., Decocq G., Heinken T., Hermy M., Liira J., Schmucki R., Shevtsova A., Verheyen K., Diekmann 16
M. (2015) Patterns of phenotypic trait variation in two temperate forest herbs along a broad 17
climatic gradient. Plant Ecology 216:1523–1536. 18
Lipowsky A., Roscher C., Schumacher J., Michalski S.G., Gubsch M., Buchmann N., Schulze E.D., Schmid B. 19
(2015) Plasticity of functional traits of forb species in response to biodiversity. Perspectives in Plant 20
Ecology, Evolution and Systematics 17:66–77. 21
Liu Y., Dawson W., Prati D., Haeuser E., Feng Y., van Kleunen M. (2016) Does greater specific leaf area 22
plasticity help plants to maintain a high performance when shaded? Annals of Botany 118:1329–23
1336. 24
35
Luo Y., Melillo J., Niu S., Beier C., Clark J.S., Classen A.T., Davidson E., Dukes J.S., Evans R.D., Field C.B., 1
Czimczik C.I., Keller M., Kimball B.A., Kueppers L.M., Norby R.J., Pelini S.L., Pendall E., Rastetter E., 2
Six J., Smith M., Tjoelker M.G., Torn M.S. (2011) Coordinated approaches to quantify long-term 3
ecosystem dynamics in response to global change. Global Change Biology 17:843–854. 4
Mabry C.M., Gerken M.E., Thompson J.R. (2008) Seasonal storage of nutrients by perennial herbaceous 5
species in undisturbed and disturbed deciduous hardwood forests. Applied Vegetation Science 6
11:37–44. 7
Mao W., Felton A.J., Zhang T. (2017) Linking changes to intraspecific trait diversity to community 8
functional diversity and biomass in response to snow and nitrogen addition within an inner 9
Mongolian grassland. Frontiers in Plant Science 8:1–10. 10
Midolo G., De Frenne P., Hölzel N., Wellstein C. (2019) Global patterns of intraspecific leaf trait response 11
to elevation. :1–14. 12
Milla R., Reich P.B. (2007) The scaling of leaf area and mass: The cost of light interception increases with 13
leaf size. Proceedings of the Royal Society B: Biological Sciences 274:2109–2114. 14
Moles A.T., Warton D.I., Warman L., Swenson N.G., Laffan S.W., Zanne A.E., Pitman A., Hemmings F.A., 15
Leishman M.R. (2009) Global patterns in plant height. Journal of Ecology 97:923–932. 16
Moran E. V., Hartig F., Bell D.M. (2016) Intraspecific trait variation across scales: Implications for 17
understanding global change responses. Global Change Biology 22:137–150. 18
Muukkonen P., Mäkipää R., Laiho R., Minkkinen K., Vasander H., Finér L. (2006) Relationship between 19
biomass and percentage cover in understorey vegetation of boreal coniferous forests. Silva Fennica 20
40:231–245. 21
Nagashima H., Hikosaka K. (2011) Plants in a crowded stand regulate their height growth so as to 22
maintain similar heights to neighbours even when they have potential advantages in height growth. 23
Annals of Botany 108:207–214. 24

36
Navas M.L., Garnier E. (2002) Plasticity of whole plant and leaf traits in Rubia peregrina in response to 1
light, nutrient and water availability. Acta Oecologica 23:375–383. 2
Nicolson M., Mcintosh R.P. (2002) H. A. Gleason and the individualistic hypothesis revisited summary. 3
Bulletin of the Ecological Society of America 83:133–142. 4
Oldfather M.F. (2019) Ecoregion shapes the range response. Nature Climate Change 9:730–731. 5
Oliver T.H., Morecroft M.D. (2014) Interactions between climate change and land use change 6
on biodiversity: Attribution problems, risks, and opportunities. Wiley Interdisciplinary Reviews: 7
Climate Change 5:317–335. 8
Ott J.P., Klimešová J., Hartnett D.C. (2019) The ecology and significance of below-ground bud banks in 9
plants. Annals Oo Botany 0:1–20. 10
Paul-Limoges E., Wolf S., Eugster W., Hörtnagl L., Buchmann N. (2017) Below-canopy contributions to 11
ecosystem CO₂ fluxes in a temperate mixed forest in Switzerland. Agricultural and Forest 12
Meteorology 247:582–596. 13
Pérez-Harguindeguy N., Díaz S., Lavorel S., Poorter H., Jaureguiberry P., Bret-Harte M.S., Cornwell W.K., 14
Craine J.M., Gurvich D.E., Urcelay C., Veneklaas E.J., Reich P.B., Poorter L., Wright I.J., Ray P., Enrico 15
L., Pausas J.G., Vos A.C. De, Buchmann N., Funes G., Quétier F., Hodgson J.G., Thompson K., Morgan 16
H.D., Steege H. ter, Heijden M.G.A. Van Der, Sack L., Blonder B., Poschlod P., Vaieretti M. V, Conti G., 17
Staver A.C., Aquino S., Cornelissen J.H.C. (2013) New handbook for standardized measurment of 18
plant functional traits worldwide. Australian Journal of Botany 23:167–234. 19
Perring M.P., Bernhardt-Römermann M., Baeten L., Midolo G., Blondeel H., Depauw L., Landuyt D., Maes 20
S.L., De Lombaerde E., Carón M.M., Vellend M., Brunet J., Chudomelová M., Decocq G., Diekmann 21
M., Dirnböck T., Dörfler I., Durak T., De Frenne P., Gilliam F.S., Hédl R., Heinken T., Hommel P., 22
Jaroszewicz B., Kirby K.J., Kopecký M., Lenoir J., Li D., Máliš F., Mitchell F.J.G., Naaf T., Newman M., 23
Petřík P., Reczyńska K., Schmidt W., Standovár T., Świerkosz K., Van Calster H., Vild O., Wagner 24
37
E.R., Wulf M., Verheyen K. (2018) Global environmental change effects on plant community 1
composition trajectories depend upon management legacies. Global Change Biology 24:1722–2
1740. 3
Perring M.P., Diekmann M., Midolo G., Schellenberger Costa D., Bernhardt-Römermann M., Otto J.C.J., 4
Gilliam F.S., Hedwall P.O., Nordin A., Dirnböck T., Simkin S.M., Máliš F., Blondeel H., Brunet J., 5
Chudomelová M., Durak T., De Frenne P., Hédl R., Kopecký M., Landuyt D., Li D., Manning P., Petřík 6
P., Reczyńska K., Schmidt W., Standovár T., Świerkosz K., Vild O., Waller D.M., Verheyen K. (2018) 7
Understanding context dependency in the response of forest understorey plant communities to 8
nitrogen deposition. Environmental Pollution 242:1787–1799. 9
Perring M.P., De Frenne P., Baeten L., Maes S.L., Depauw L., Blondeel H., Carón M.M., Verheyen K. 10
(2016) Global environmental change effects on ecosystems: the importance of land-use legacies. 11
Global Change Biology 22:1361–1371. 12
Pinheiro J., Bates D., DebRoy S., Sarkar D., R Core Team (2019) nlme: Linear and Nonlinear Mixed Effects 13
Models. R package version 31 -143 14
Poorter H., Niinemets Ü., Poorter L., Wright I.J., Villar R., Niinemets U., Poorter L., Wright I.J., Villar R. 15
(2009) Causes and consequences of variation in leaf mass per area (LMA): a meta-analysis. New 16
phytologist 182:565–588. 17
R Core Team (2019) R: A language and environment for statistical computing. URL: https://www.r-18
project.org/ 19
Reich P.B. (2014) The world-wide ‘fast-slow’ plant economics spectrum: a traits manifesto (H. 20
Cornelissen, Ed.). Journal of Ecology 102:275–301. 21
Reich P.B., Wright I.J., Craine J.M., Oleksyn J., Westoby M., Walters M.B. (2003) The evolution of plant 22
functional variation : traits , spectra , and strategies. International Journal of Plant Sciences 164 23
Rothstein D.E. (2000) Spring ephemeral herbs and nitrogen cycling in a northern hardwood forest: An 24

38
experimental test of the vernal dam hypothesis. Oecologia 124:446–453. 1
Rothstein D.E., Zak D.R. (2001) Photosynthetic adaptation and acclimation to exploit seasonal periods of 2
direct irradiance in three temperate, deciduous-forest herbs. Functional Ecology 15:722–731. 3
Rozendaal D.M.A., Hurtado V.H., Poorter L. (2006) Plasticity in leaf traits of 38 tropical tree species in 4
response to light; relationships with light demand and adult stature. Functional Ecology 20:207–5
216. 6
Siefert A. (2012) Spatial patterns of functional divergence in old-field plant communities. Oikos 7
121:907–914. 8
Siefert A., Ritchie M.E. (2016) Intraspecific trait variation drives functional responses of old-field plant 9
communities to nutrient enrichment. Oecologia 181:245–255. 10
Siefert A., Violle C., Chalmandrier L., Albert C.H., Taudiere A., Fajardo A., Aarssen L.W., Baraloto C., 11
Carlucci M.B., Cianciaruso M. V., de L. Dantas V., de Bello F., Duarte L.D.S., Fonseca C.R., Freschet 12
G.T., Gaucherand S., Gross N., Hikosaka K., Jackson B., Jung V., Kamiyama C., Katabuchi M., Kembel 13
S.W., Kichenin E., Kraft N.J.B., Lagerström A., Bagousse-Pinguet Y. Le, Li Y., Mason N., Messier J., 14
Nakashizuka T., Overton J.M., Peltzer D.A., Pérez-Ramos I.M., Pillar V.D., Prentice H.C., Richardson 15
S., Sasaki T., Schamp B.S., Schöb C., Shipley B., Sundqvist M., Sykes M.T., Vandewalle M., Wardle 16
D.A. (2015) A global meta-analysis of the relative extent of intraspecific trait variation in plant 17
communities. Ecology Letters 18:1406–1419. 18
Smart S.M., Glanville H.C., Blanes M. del C., Mercado L.M., Emmett B.A., Jones D.L., Cosby B.J., Marrs R.H., 19
Butler A., Marshall M.R., Reinsch S., Herrero-Jáuregui C., Hodgson J.G. (2017) Leaf dry matter 20
content is better at predicting above-ground net primary production than specific leaf area. 21
Functional Ecology 31:1336–1344. 22
Tatarko A.R., Knops J.M.H. (2018) Nitrogen addition and ecosystem functioning: Both species 23
abundances and traits alter community structure and function. Ecosphere 9 24

39
Tessier J.T., Raynal D.J. (2003) Vernal nitrogen and phosphorus retention by forest understory vegetation 1
and soil microbes. Plant and Soil 256:443–453. 2
Thomson F.J., Moles A.T., Auld T.D., Kingsford R.T. (2011) Seed dispersal distance is more strongly 3
correlated with plant height than with seed mass. Journal of Ecology 99:1299–1307. 4
Turcotte M.M., Levine J.M. (2016) Phenotypic plasticity and species coexistence. Trends in Ecology & 5
Evolution 31:803–813. 6
Valladares F., Balaguer L., Martinez-Ferri E., Perez-Corona E., Manrique E. (2002) Plasticity, instability 7
and canalization: Is the phenotypic variation in seedlings of sclerophyll oaks consistent with the 8
environmental unpredictability of Mediterranean ecosystems? New Phytologist 156:457–467. 9
Valladares F., Laanisto L., Niinemets Ü., Zavala M.A. (2016) Shedding light on shade: ecological 10
perspectives of understorey plant life. Plant Ecology & Diversity 9:237–251. 11
Valladares F., Niinemets Ü. (2008) Shade tolerance, a key plant feature of complex nature and 12
consequences. Annual Review of Ecology, Evolution, and Systematics 39:237–257. 13
Valladares F., Sanzecg-Gomez D., Zavala M.A. (2006) Quantitative estimation of phenotypic plasticity: 14
bridging the gap between the evolutionary concept and its ecological applications. Journal of 15
Ecology 94:1103–1116. 16
Veresoglou S.D., Penuelas J. (2019) Variance in biomass-allocation fractions is explained by distribution 17
in European trees. New Phytologist 18
Verheyen K., De Frenne P., Baeten L., Waller D.M., Hédl R., Perring M.P., Blondeel H., Brunet J., 19
Chudomelová M., Decocq G., De Lombaerde E., Depauw L., Dirnböck T., Durak T., Eriksson O., 20
Gilliam F.S., Heinken T., Heinrichs S., Hermy M., Jaroszewicz B., Jenkins M.A., Johnson S.E., Kirby 21
K.J., Kopecký M., Landuyt D., Lenoir J., Li D., Macek M., Maes S.L., Máliš F., Mitchell F.J.G., Naaf T., 22
Peterken G., Petřík P., Reczyńska K., Rogers D.A., Schei F.Hø., Schmidt W., Standovár T., Świerkosz 23
K., Ujházy K., Van Calster H., Vellend M., Vild O., Woods K., Wulf M., Bernhardt-Römermann M. 24

40
(2017) Combining biodiversity resurveys across regions to advance global change research. 1
BioScience 67:73–83. 2
Verheyen K., Honnay O., Motzkin G., Hermy M., Foster D.R. (2003) Response of forest plant species to 3
land-use change: a life-history trait-based approach. Journal of Ecology 91:563–577. 4
Verstraeten G., Baeten L., Van den Broeck T., De Frenne P., Demey A., Tack W., Muys B., Verheyen K. 5
(2013) Temporal changes in forest plant communities at different site types. Applied Vegetation 6
Science 16:237–247. 7
Violle C., Navas M.-L., Vile D., Kazakou E., Fortunel C., Hummel I., Garnier E. (2007) Let the concept of 8
trait be functional! Oikos 116:882–892. 9
Watkinson A.R. (1983) Yield-density relationships: The influence of resource availability on rowth and 10
elf-thinning in populations of Vulpia fasciculata. Annals of Botany 53:469–482. 11
Westneat D.F., Potts L.J., Sasser K.L., Shaffer J.D. (2019) Causes and consequences of phenotypic plasticity 12
in complex environments. Trends in Ecology & Evolution 34:555–568. 13
Westoby M. (1998) A leaf-height-seed (LHS) plant ecology strategy scheme. Plant and Soil 199:213–227. 14
Wright I.J., Dong N., Maire V., Prentice I.C., Westoby M., Díaz S., Gallagher R. V., Jacobs B.F., Kooyman R., 15
Law E.A., Leishman M.R., Niinemets Ü., Reich P.B., Sack L., Villar R., Wang H., Wilf P. (2017) Global 16
climatic drivers of leaf size. Science 357:917–921. 17
Wright I.J., Westoby M., Reich P.B., Oleksyn J., Ackerly D.D., Baruch Z., Bongers F., Cavender-Bares J., 18
Chapin T., Cornellissen J.H.C., Diemer M., Flexas J., Gulias J., Garnier E., Navas M.L., Roumet C., 19
Groom P.K., Lamont B.B., Hikosaka K., Lee T., Lee W., Lusk C., Midgley J.J., Niinemets Ü., Osada H., 20
Poorter H., Pool P., Veneklaas E.J., Prior L., Pyankov V.I., Thomas S.C., Tjoelker M.G., Villar R. 21
(2004) The worldwide leaf economics spectrum. Nature 428:821–827. 22
Wulf M. (1997) Plant species as indicators of ancient woodland in northwestern Germany. Journal of 23

41
Vegetation Science 8:635–642. 1
Zhou X., Guo Z., Zhang P., Du G. (2018) Shift in community functional composition following nitrogen 2
fertilization in an alpine meadow through intraspecific trait variation and community composition 3
change. Plant and Soil 431:289–302. 4
5

42
Tables 6
Table 1: Pool of 15 species used in the experiment and their most important attributes. Scientific names are drawn from the plantlist.org. Number of 7 measurements (N) for height (maximum 512) and SLA (maximum 128) are given. The colonisation capacity index (CCI, see Verheyen et al., 2003) 8 indicates the affinity of a species with ancient forest (positive values) and ranged from 100 (slow colonisation into post-agricultural forest) to -100 (fast 9 colonisation). We classified these species in three groups based on our expert knowledge, guided by the CCI and whether a species can be specified as a 10 forest habitat specialist (Heinken et al. 2019). Group A are poor colonisers and forest specialists, Group B are intermediate colonizers of post-agricultural 11 forest and not strictly forest specialists, and group C are fast colonising and generalist nitrophilic species with a large negative CCI. Plant material used 12 at the time of planting is indicated as well (March 2016), which all came from adults of perennial species to ensure that the trait values we measured 13 would come from individuals at the same life stage. Symbols denote the origin of the plant material, and is either from an organic horticultural nursery 14 (°, ECOFLORA, Belgium) or the native population in Brakelbos (*) and the Aelmoeseneie forest (**) in Belgium. 15
Scientific name Group % survivors N (Height) N (SLA) Life form Peak biomass CCI Forest specialist? Plant material
Hyacinthoides non-scripta (L.) Chouard ex Rothm A 51% 263 100 Geophyte May 100 Yes Bulb°
Galium odoratum (L.) Scop. A 76% 387 102 Hemicryptophyte June 95 Yes Whole plant°
Anemone nemorosa L. A 28% 142 63 Geophyte April 77 Yes Rhizome°
Carex sylvatica Huds A 82% 422 114 Therophyte July-August 74 Yes Whole plant°
Vinca minor L. A 72% 369 109 Chamaephyte May-June 33 Yes Whole plant°
Polygonatum multiflorum (L.) All. A 75% 383 122 Geophyte May-June 15 Yes Rhizome°
Ajuga reptans L. B 19% 99 37 Hemicryptophyte June 60 No Whole plant°
Hedera helix L. B 29% 147 67 Chamaephyte July-August 50 No Whole plant°
Poa nemoralis L. B 59% 301 96 Hemicryptophyte May-June 29 No Whole plant*
Ficaria verna Huds. B 85% 434 108 Geophyte March 11 No Root nodule**
Glechoma hederacea L. B 2% 12 4 Hemicryptophyte June -5 No Whole plant°
Geranium robertianum L. B 10% 50 21 Hemicryptophyte June-July -9 No Whole plant°
Aegopodium podagraria L. C 34% 175 71 Hemicryptophyte August-September -45 No Rhizome**
Poa trivialis L. C 35% 179 64 Hemicryptophyte May-June -67 No Whole plant°
Urtica dioica L. C 16% 82 47 Hemicryptophyte August-September -71 No Rhizome**
Total 3445 1125
16

43
17
Table 2: Model fit of the significant (p<0.05) treatments that influenced mean vegetation cover (%). Estimates with standard error (S.E.), denominator 18 degrees of freedom (D.F.), F-value and p-value are given for the model terms. The three fixed effect terms were the two-level terms Land-use history 19 (LU), Light treatment (L) and Temperature treatment (T) which together explained less than 20% of variation (R²m = 0.17). 65% of the variation is 20 accounted for when including the random effect terms (R²c), i.e. Region of soil, Plot and community combination. The intercept term is the average 21 intercept across random effect terms and is the estimate for an Ancient forest soil with control treatments for light and warming. 22
term Estimate S.E. D.F. F-value p-value Intercept 43.15 3.40 276 376 <0.0001
Post-agricultural +6.06 1.68 9 12 0.0074 Light addition +15.88 1.79 276 79 <0.0001
Warming +8.41 1.83 276 21 <0.0001
23
24

44
Figure legends 1
Figure 1: Images of the multifactor experiment, showing mesocosms in groups of four combined 2 as a “plot”. Panel A. Overall view of the fenced area in the Aelmoeseneie forest (Belgium). Panel 3 B. A plot with a factorial combination of Warming and Light addition. Panel C Singular treatment4 of Light addition, with a temperature sensor to measure air temperature. Panel D. Control treatment 5 where the plot receives ambient conditions. Plots that receive the N enrichment treatment are not 6 discernible in the field. 7
Figure 2. Plant height (panel A) is more responsive to total vegetation cover than SLA (panel 8 B) across species. Results of the within species linear mixed effects models testing plant height and9 SLA in response to total vegetation cover in a mesocosm. Significance levels are 0.05*, 0.01** and 10 0.001***. The lines are the average predicted values of the linear mixed effects model for each 11 species (either normal or log-transformed response). Marginal R² (R²m) are given, which denote the 12 model fit on the only fixed effect (vegetation cover). Species are ordered on colonisation capacity 13 index (CCI) with the fastest colonisers into post agricultural forest on top and hues ranging from 14 purple-blue-yellow from fast to slow colonisers. 15
Figure 3: Species selectively respond to environmental change in both plant height (panel A) 16 and specific leaf area (SLA) (panel B). Results of the ANOVA (p<0.007) testing two-way 17 interactions of the forest’s land-use history (LU), light availability (L), nitrogen addition (N) and 18 warming (T). We applied an adjusted alpha (p<0.007) so that the expected value of a false positive 19 effect is less than 1 out of the 143 tested terms (alpha = 1/143 = 0.007). Species are ordered on 20 colonisation capacity index (CCI) with the fastest colonisers into post-agricultural forest on top. 21
Figure 4: Significant effects (p<0.007) of the experimental treatments on within-species plant 22 height (A-D) and SLA (E-F). Panels are illustrations to the significant effects shown in Figure 3. 23 Species are ordered on colonisation capacity index (CCI) with faster colonisers into post-agricultural 24 forest on the left. 25
Figure 5: Faster colonisers into post-agricultural forest exhibit significantly higher ITV, for 26 plant height (panel A) but not SLA (panel B). Coefficient of variation for plant height (panel A) 27 and specific leaf area (panel B) for each species in regression (95% CI) to that species’ colonisation 28 capacity index (CCI). CCI values closer to 100 indicate higher affinity for ancient forest; values closer 29 to -100 indicate a faster colonisation into post-agricultural forest (Verheyen et al., 2003).
30
31

Figures
Fig. 1

Fig. 2

Fig. 3

Fig. 4
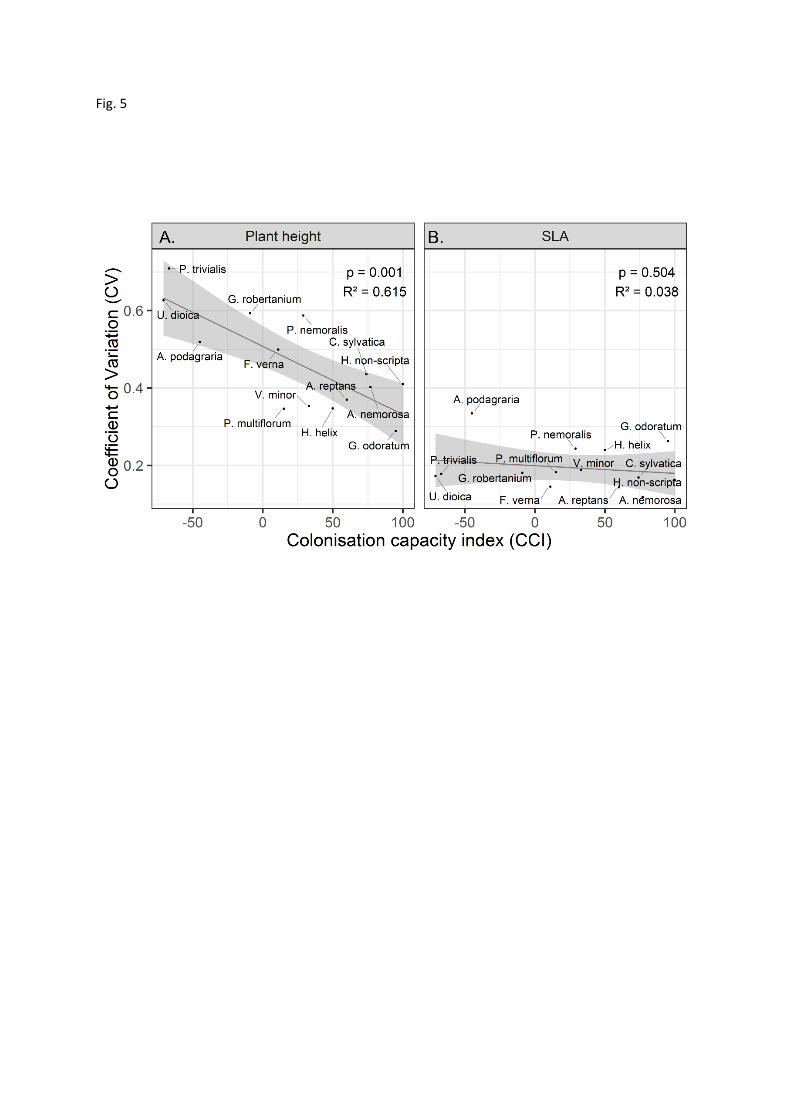
Fig. 5