Embed Size (px)
Citation preview

1
Individual Investors Repurchasing Behavior:
Preference for Stocks Previously Owned1
Cristiana Cerqueira Leal
NIPE & School of Economics and Management – University of Minho
Campus de Gualtar
4710-057 Braga – Portugal
Manuel J. Rocha Armada
NIPE & School of Economics and Management – University of Minho
Campus de Gualtar
4710-057 Braga – Portugal
Gilberto Loureiro
NIPE & School of Economics and Management – University of Minho
Campus de Gualtar
4710-057 Braga – Portugal
This version: January 2014
1 This work is financed by FEDER Funds through “Programa Operacional Factores de Competitividade – COMPETE” and by National Funding from FCT – Fundação para a Ciência e a Tecnologia through project FCOMP-01-0124-FEDER-037268 (PEst-C/EGE/UI3182/2013)

2
Individual Investors Repurchasing Behavior:
Preference for Stocks Previously Owned
ABSTRACT
In this paper we study the repurchasing behavior of individual investors and identify several stock- and investor-
specific characteristics that affect the preference for repurchasing stocks previously owned. Using a unique database
of 5,128 individual investors trading from August 1st, 2003 to July 31st, 2007, we find that investors prefer to repurchase
stocks that are prior winners and those that dropped in price after being sold, in line with Strahilevitz, Odean and
Barber (2011). We also find that the larger the prior gain, or the drop in stock price after the sell, the more likely is the
investor to repurchase the same stock. Additionally, we find that (1) local stocks with negative market adjusted
performance are more likely to be repurchased, and (2) less active, under-diversified, and poor performance investors
are more likely to engage in such behavior. Overall, our results indicate that reference prices, prior stock returns, stock
visibility, and investor performance and sophistication are determinants of the repurchasing behavior.
JEL classification: G02; G11; G14
Keywords: regret; counterfactuals; portfolio choice; individual investors.

3
1. Introduction
Given the immense set of investment opportunities, investors need to narrow the amount of possibilities due to time
constraints, effort and cognitive limitations. Some clusters catch investors’ attention. For instance, stocks that are
geographically closer to them (Grinblatt and Keloharju, 2001a; Huberman, 2001; Feng and Seasholes, 2004; Ivkovich
and Weisbenner, 2005) or that are more visible in the media (Barber, Odean and Zhu, 2009) catch investors attention,
are easily recalled, and consequently, are considered for purchase. We would also expect that investors are more likely
to repurchase stocks that they have previously owned both because they can easily recall them and they have learned
something about them. However, investors do not want to repurchase those stocks at the same rate. The prior
experienced prices act as anchors and affect the wiliness to repurchase. When an investor buys an asset by the first
time at some price, he becomes anchored to that price. It determines the future accepted prices, even if they are
arbitrary, because individuals seek to be coherent with previous decisions (Ariely, Loewenstein and Prelec, 2003). In
the context of repurchasing behavior study, the concept of mental accounting is extended, in line with Arkes,
Hirshleifer, Jiang and Lim (2008): even when the security is sold, the account is kept opened and investors continue
monitoring prices to implement future decisions. Strahilevitz, Odean and Barber (2011) looking at these particular
anchors established the following patterns: (1) preference for repurchasing stocks previously sold for a gain rather
than a loss; and (2) preference for repurchasing stocks that have lost rather than gained value subsequent to a prior
sale. Weber and Welfens (2011) using an experimental setting applied to 145 students also document the same
patterns. Apart from these studies, the topic of repurchasing behavior is much unaddressed in the literature. This
paper aims to contribute to the understanding of this phenomenon by analyzing the portfolios of 5,128 individual
investors during four years (from August 2003 to July 2007). First, we analyze who is repurchasing, and which stocks
are being repurchased, compared to all purchases that occurred in the period. We argue that more unsophisticated
investors are more likely to repurchase and geographically closer and more visible stocks are more likely to be
repurchased. Secondly, we identify patterns of repurchasing behavior related to past anchors, not only at the
aggregated level, as in Strahilevitz, Odean and Barber (2011), but also at the individual level2. Third, we focus only on
the investors that have repurchases in the data period and test whether the repurchasing behavior is associated with
investor and stock characteristics. In general, the literature identifies such characteristics as variables that may
increase or attenuate behavioral bias. We use them in multivariate analysis to determine preferences in the
repurchasing behavior, which, to the best of our knowledge, has never been done in the context of repurchasing
behavior. Demographic and investors’ trading-specific variables are accepted in the literature as proxies for investor
sophistication, in the sense that they predict the behavioral bias reduction. The literature identifies wealth,
experience, financial literacy, occupational status, diversification level and IQ, among others, as sources of investor
2 By aggregated level we mean looking at the all trades together, while by individual level we mean measured by investor and then averaged across investor.

4
sophistication (e.g., Feng and Seasholes, 2005; Campbell, 2006; Dhar and Zhu, 2006; Calvet, Campbell and Sodini, 2007;
2009a; 2009b; Seru, Shumway and Stoffman, 2010; Korniotis and Kumar, 2011; Linnainmaa, 2011; Grinblatt, Keloharju
and Linnainmaa, 2012). Stock characteristics also play a role in explaining trading behavior. For instance, the literature
identifies preferences for home and local stocks (e.g., Huberman, 2001; Ivkovich, Sialm and Weisbenner, 2008), or
preferences related to previous performance (e.g., Kaniel, Saar and Titman, 2008). We argue that variables related to
investor sophistication, such as the experience, diversification and performance also determine the likelihood of
repurchasing, as we expect that more unsophisticated investors are more eager to repurchase. We also expect that
some stocks are more attractive for repurchasing due to their visibility, captured by size, volume, location (home and
Euro zone) and performance.
We find that price anchors, prior stock performance, stock visibility, investor performance, and investor sophistication
are determinants of repurchasing behavior. Being a prior winner matters as well as the stock price variation after the
sell. Our evidence shows that the repurchasing behavior is positively associated with prior gains on the same stock
and negatively related with the stock price variation after the sell. We also find that the purchase of prior winners is
more frequent among home visible stocks with negative market adjusted performance, especially when the investor
is less active, under-diversified and experienced poorer performance. As for investor demographic characteristics
(such as age, gender, marital status and profession), we find no evidence that they are associated with the
repurchasing behavior.
Our study offers several contributions. First, to the best of our knowledge, this is the largest study on repurchasing
behavior outside the U.S.. Second, we identify preferences on investors repurchasing behavior, measured not only at
aggregated level (as Strahilevitz, Odean and Barber, 2011) but also at the individual level. Third, we analyze the impact
of numerous variables, including stock characteristics, investor trading characteristics and demographic
characteristics, on the investors repurchasing behavior and identify several determinants that help explain this
phenomenon.
The remainder of this paper is organized as follows: section 2 reviews the literature and section 3 describes the data.
Section 4 tests test whether the repurchasing behavior is concentrated in some stocks or type of investors. Section 5
verifies the existence of patterns in the repurchasing behavior. Section 6 tests investor-specific and stock-specific
determinants of the repurchasing behavior. Section 7 concludes.

5
2. Literature Review: Individual Investors Behavior and Preferences
As Massa and Simonov (2005) argue, individual stock picking seems to be mostly affected by the amount of information
available. Reliance on familiarity with a stock is an easy and cheap way of acquiring information. A source of
information-based familiarity is the ownership of the stock. One can expect that investors have accumulated a
significant amount of information (somehow seen as expertise) about the stocks previously owned. Consequently,
these stocks become salient in the moment of stock selection. In addition, individual investors often discover naïve
patterns in past price movements (De Bondt, 1998). Individual investors over-extrapolate from their personal
experience when making investment decisions and random accidents of personal financial history, irrelevant to a
rational investor, affect their saving decisions (Choi, Laibson, Madrian and Metrick, 2009). In this framework and based
on mental accounting, individuals keep track of the prices they have experienced (buying and selling prices) and it is
expected that they extrapolate prices to which they have a particular emotional tie.
2.1 Repurchasing past winners versus past losers
Gains and losses lead to opposite sentiments and individuals derive utility from them. As Statman (2011) states,
investors want to feel pride when investments bring gains and avoid the regret that comes with losses. Thus, investors
act in order to feel the pleasure of a good decision and emphasize it. Simultaneously, they try to avoid the experienced
regret of a bad decision and hide it. In this setting, in the context of the repurchasing behavior, investors keep the
mental account of stocks previously owned and its reference prices as anchors for future decisions. Then, we can
expect that investors prefer to repurchase past winners rather than past losers to emphasize the sources of pleasure
and eschewing the sources of experienced regret. Even if, eventually, some future losses occur when repurchasing the
stock, investors use mental accounting strategies to integrate those losses in the total gains and keep believing that
overall the stock is a winning one, in line with Thaler (1985). Simultaneously, inventors avoid repurchasing their past
losers in order to stay away from the sources of experienced regret. When a stock is a loser, it is very difficult to
mitigate the disappointment and regret with the prospect that it will recover. If, even so, the investor decides to
repurchase a past loser, he may ignore the previous occurrence in his mental accounting. Then, it is also expectable
that the framing for the repurchasing behavior of past winners or past losers is distinct. This behavior develops in a
context of naïve reinforcement learning heuristic, where personally experienced outcomes are over-weighted
compared to rational Bayesian learning. Investors repeat strategies in which they experienced success, even if that
past success does not predict future success. The literature describes some findings in this line. Choi, Laibson, Madrian
and Metrick (2009) find that investors who had particularly rewarding outcomes from saving in 401(k) increase their
savings rate in 401(k) more than others with less rewarding experiences. Kaustia and Knüpfer (2008) find that Finnish
investors are more likely to subscribe future IPOs if they experienced positive returns in their prior IPOs subscriptions.
Malmendier and Nagel (2011) find that individual investors risk taking is strongly related with experienced returns:
those who experienced high stock returns throughout their lives are more likely to take risk and hold more stocks.

6
Additionally, the authors report that the more recent the experienced returns are, the stronger is the impact. A
possible alternative explanation is that investors focus on their past winners because they have some advantage:
experience, knowledge, expertise, etc. However, Strahilevitz, Odean and Barber (2011) find that the repurchase of
previous winners does not yield superior adjusted returns in the subsequent 12 months, which casts some doubt on
the argument of superior experience and knowledge associated with the repurchase of past winners.
2.2 Repurchasing stocks that increased/decreased in price after being sold
When considering the repurchase of a stock, investors also take into account the behavior of that stock subsequent to
the sell. Investors engage in mental accounting simulations and think in terms of counterfactuals that can induce
pleasure or regret. Counterfactual thinking is a mental construction of “what might have been” (Roese, 1996; 1997).
Counterfactuals emerge mainly in response to a negative effect and generate feelings of pain and regret. It is an
anticipated regret, since the investor did not experience it, but it feels like it is real when imagining the present
situation, had he decided differently (Zeelenberg, 1999). Suppose the stock price increases after the sell. The investor
engaging in counterfactual thinking concludes that he would be better off if he had kept the stock in his portfolio. To
avoid this anticipated regret, he might not consider buying it again. On the contrary, suppose the stock price decreased
after the sell. Now, the stock is a good choice in terms of counterfactual thinking, as long as the investor is in a better
situation than he would have been if he had done nothing. Thus, repurchasing stocks that are losing value subsequent
to the sell will emphasize the investor’s ability and will make him proud of his investment decision. These mental
simulations assume the existence of mental accounting and price anchoring, even after the sell. If the investor closes
the mental account when he sells the stock, the anchor would be lost. The mental accounting and its prevalence over
time even after the sell emphasizes the importance of past prices as anchors for current decisions. Moreover, the
relevant prices are the prices of the previous transactions, meaning that the references are distinct for each investor.
Weber and Welfens (2011), in an experimental setting, analyze the counterfactual thinking as a possible explanation
for the preference to repurchase. If individuals have no responsibility in their past decisions, counterfactual thinking
should be irrelevant. The experiment consists in comparing two groups: in one group the previous decision to purchase
or sell was imposed, while the other group has the opportunity to decide. For the group where the decision was
imposed, the preference for purchasing stocks at a price lower than the reference was considerably lower, which
means that counterfactual thinking is truly the main explanation for this behavior.
Summarizing, when considering buying a stock, investors have an enormous amount of possibilities available.
However, constrains of time and effort reduce the possibilities to a small number that they can effectively consider.
Hence, investors tend to focus on a few stocks, and trade them many times, because they are more visible or familiar.
However, investors do not buy these stocks discretionarily. Their personal experience with those stocks will affect
their repurchasing preferences. The stock prices of their previous transactions are the most relevant input for the
decision to repurchase, meaning that the references are individual and very particular to each investor.
7
3. Data
Our primary data consist of a unique database of 5,128 individual investor accounts, with detailed information about
their registered trades. The time period covered in this study is from 1st August 2003 to 31st July 2007, comprising
about 1 million trades. The data are provided by a well-known Portuguese brokerage house and includes their discount
brokerage clients. These investors make their own investing decisions without supervision or advice from the
brokerage house. The largest majority of them trade online and the direct interaction with the brokerage house is
almost inexistent. Our focus is on stock trades, thus we exclude all transactions of bonds, warrants, and options. The
5,128 investors covered in this study traded stocks at least once in the sample period. In total there are 343,360 stock
trades (179,481 buys and 163,879 sells), involving 1,648 different stocks in 14 markets (countries) and 6 different
currencies.
To study investors trading behavior, we construct individual stock portfolios, for each investor, based on the
information about daily movements from their accounts. We follow the procedures of Odean (1998) and Grinblatt and
Keloharju (2001b) to construct individual investor daily accounts. We net all trades, on the same day and security, for
the same investor and ignore all sells for which it is not possible to identify the purchase date nor the corresponding
price due to lack of information (i.e., we eliminate purchases occurring before the 1st of August 2003 because we do
not have information on their acquisition prices). We also adjust the data for every corporate action that occurs during
the sample period (dividends, stock splits, mergers, etc). All the empirical analysis is conducted on a daily basis, using
an end-of-day perspective, i.e. we use the intraday-trading information to determine the net daily movements. This
means that multiple buys or sells of the same stock, in the same account, in the same day are aggregated. This
procedure reduced the data from 343,360 trading entries to 117,976. Throughout the entire sample period there are
1,167 corporate actions (840 of which relate to dividends) in the market and we adjust every account to these
corporate actions.
In line with Odean (1998), Strahilevitz, Odean and Barber (2011), we construct the accounts starting from a zero initial
balance at the beginning of the data period, and then we follow the chronological order for securities which acquisition
dates and prices are known. The sells without a matching purchase with a known price are dropped (the elimination
can be total or partial). Hence, we only consider investors that traded stocks at least once in the period. In the end,
we are left with 4,428 investors with suitable trades and holding positions.
Table 1 describes the data after this process. We end-up with 111,616 suitable observations. On average, and ignoring
the intra-day trading and sells with matching purchases, each investor has 25.21 net trades in the period. However,
there are great differences among investors. The standard deviation of trading is 125.45 and the maximum number of
trades for one investor is 3,516. We also find that stock accounts are under-diversified: on average, each investor holds
a portfolio with 2.34 securities. This is not very different from what others find in the literature. For instance, Barber
and Odean (2000) report that a typical individual investor holds a portfolio of only four stocks. The fact that each

8
investor only trades a few stocks, besides the vast range of possibilities in the stock markets, may indicate that, due
to their cognition constrains, investors tend to simplify the decision process and focus on a small number of stocks.
Even though Portuguese investors can accede to other stock markets very easily, they concentrate their investments
in few stocks from the Portuguese stock market. On average, each investor trades 4.73 stocks in the period (standard
deviation of 12.14 and maximum of 287 stocks), meaning that investors trade many times the same stocks. Hence,
one can affirm that past experience plays an important role, as investors keep trading what is familiar to them. In our
sample, we have 61,123 purchases, on average 13.8 net purchases per investor (standard deviation of 66.78 and
maximum number of net purchases for one investor of 1,936). Some of these purchases are of stock previously owned.
Each time a purchase occurs, we classify it as repurchase if the investor owned and sold the stock in the prior year
(quarter). We start looking for repurchases as of August 1, 2004 (November 1, 2003), using a moving window of the
prior 365 (91) calendar days. We observe that 651 (742) investors engage in repurchasing behavior and 13,143 (13,848)
repurchases are of stocks owned in the prior year (quarter). Those repurchases - the purchase of a stock previously
owned and sold in the prior year (quarter) – represent 29% (24%) of all purchases. We should notice, however, that
the Portuguese stock market is small and the number of liquid stocks is limited. Hence, it is not surprising that rational
investors frequently trade the same stocks. Nevertheless, a rational investor is not expected to use past experienced
prices to decide which stocks to repurchase. We cannot even invoke that investors have similar expectations about
future prices, since each investor’s anchor is very particular.
4. Who Is Repurchasing? What Is Being Repurchased?
Repurchasing is a large proportion of all stock purchases. We question whether the preference for repurchasing stocks
is common to all investors or varies significantly across them and whether investor confine themselves to only certain
types of stocks. Basically, in this section, we address two main questions: (1) which investors are more likely to
repurchase stocks?; and (2) which stocks are more likely to be repurchased? We estimate probit regressions of the
probability to repurchase a stock, rather than making a new purchase. Each time a purchase occurs, we classify it as
repurchase if the investor owned and sold the stock in the prior year, starting looking one year after the beginning of
the data period and using a moving window of the prior 365 calendar days. The independent variables comprise both
stock and investor characteristics.
Table 2 reports the results of the probit estimation for the propensity to repurchase versus new purchase. The table
reports marginal effects. The dependent variable of the model is a dummy representing the binary outcome: 1 for
repurchase and 0 for new purchase. We consider 4,090 investors that purchase 1,508 different stocks, which generates
16,471 unique combinations of investor-stock for 46,504 observations. The z-stats are adjusted for clustering by stock
in equations (1) to (3) and (8) and for clustering by investor in equations (4) to (7). Clustered standard errors correct
for the possibility that the results are biased by a certain type of stocks or investors. In equation (9), we include investor
9
dummies. Note that when we do so, investors that do not have both new purchases as well as repurchases in the
period are automatically eliminated.
In the probit analysis our main variable of interest is the "Log of Daily Stock Volume, in Euros" (natural logarithm of
the stock volume on the day of the purchase/repurchase, expressed in Euros). Barber and Odean (2008) argue
that individuals buy stocks that catch their attention. The stock trading volume is a proxy for stock investor sentiment,
visibility, and size. It can be viewed as an investor sentiment index (Baker and Stein, 2004; Baker and Wurgler, 2007).
It can also be used as a proxy for market capitalization, which is positively related to analyst coverage (Bhushan, 1989),
meaning that these stocks have greater visibility in the market. As trading volume is likely to increase when new
information is disclosed and media coverage increases, daily stock volume is a good proxy for visibility and investor
sentiment (Barber and Odean, 2008). We argue that when the investor previously owned a stock, his attention is
directed to that stock and the likelihood of repurchasing it increases. When the daily stock volume increases, there
are more investors buying (as well as selling) and we expect that those who previously owned the stock will buy it at
a higher rate. The "Log of Daily Stock Volume, in Euros" is statistically, as well as economically, significant: doubling
the daily stock volume (on the day that the repurchase occurs) increases the repurchasing behavior, at least, by 1.8%
on average3. Overall, the results show that investors are more likely to repurchase stocks with larger daily volume.
In panel A of Table 2, we also test impact of other stock characteristics on the propensity for repurchasing. In
particular, we include three dummy variables: “PSI-20 index dummy” that identifies stocks that belong to the PSI-20
index (a proxy for highly visible stocks); “PT dummy” that identifies Portuguese stocks (“home bias”); and “Euro
dummy” that identifies stocks denominated in Euros (“Euro currency bias”). One should notice that the Portuguese
stock market is very narrow and the trading volume is concentrated in a few companies of the PSI-20 index. The
preference for these stocks is better captured by the variables of trading volume than by the PSI-20 Index dummy. The
results show some evidence, albeit weak, that belonging to the PSI-20 index has a positive impact on the probability
of repurchasing a stock. Moreover, we find that the likelihood of repurchasing is lower for Portuguese stocks and
higher for Euro currency stocks. This is consistent with the idea of Peng and Xiong (2006) that investors have scarce
cognitive resources and attention constrains. Because attention tends to be more concentrated on those foreign
stocks previously owned, investors are more likely to repurchase the same stocks than purchase new ones.
Panel B shows how stock prior performance influences the repurchasing behavior. For each stock, we determine the
prior market-adjusted return for 12 historical intervals up to one year before each trade: current day of trading (day
3 We test alternatively the “Log of the Mean Stock Volume, in Euros” (natural logarithm of the mean of the stock volume for the entire data period, expressed in Euros) and find a positive and significant relation (coefficient of 0.6%). We conclude that the stocks that are more visible over time (usually larger size stocks) are also more probable to be repurchased.
10
0), the four prior days (days -1, -2, -3 and -4) and series of multiday (trading days -9 to -5; -19 to -10; -39 to -20; -59 to
-40; -119 to -60 ; -179 to -120 and -239 to -180, inclusive). We interact the prior stock market-adjusted returns with
positive and negative dummies (the generated variables are reported in absolute values) in order to analyze whether
positive or negative past returns influence the repurchasing decision. We consider the positive and negative past
returns over 12 historical intervals and end up with 24 variables, similar to what Grinblatt and Keloharju (2001b) use
to analyze the trading decision. Our estimation reports marginal effects, making the interpretation of the results more
intuitive. We find evidence that positive or negative past market adjusted returns matter but in different intervals and
directions. For instance, the likelihood of a stock repurchase is positively related to the lagged return (for the second
and third prior days). However, from the fourth previous day up to the previous year, we find the opposite effect,
which is statistically significant for almost every interval: the larger the positive market-adjusted return, the more likely
is the investor to repurchase that stock, compared to simply buying a new stock that he had not owned in the previous
year. When it comes to losses, the evidence indicates that in the prior two weeks (from the third to the 9th previous
trading day), the more negative are the market-adjusted returns, the lower the propensity to repurchase the stocks
previously owned. In the case of the third prior day, we observe that investors avoid to repurchase stocks with extreme
positive (coefficient of 0.005) or negative performance (coefficient of 0.266), but the effect is much stronger on the
negative side. This evidence suggests that previous performance is also an important factor in triggering the
repurchase. We argue that, as investors owned the stock and maintain a mental account for it (in line with Arkes,
Hirshleifer, Jiang and Lim, 2008), the prior positive or negative returns become more relevant for repurchases than for
new purchases.
Panel C extends the previous regressions by including investor account characteristics, namely: activity (natural
logarithm of the total number of investor trades, excluding day-trading, in the data period), diversification
(diversification index defined below), performance (investor market-adjusted return), account value (natural
logarithm of the mean of the stock account value, expressed in Euros), and experience (elapsed time since the account
opening date, expressed in years at the beginning of the data period). The literature identifies these variables as
proxies for investor sophistication (Feng and Seasholes, 2005; Nicolosi, Peng and Zhu, 2009; Grinblatt, Keloharju and
Linnainmaa, 2012). Trading activity implies the assumption of trading costs, thus investors that are more active are
the ones that lose the most, because their performance is diluted in trading costs (Odean, 1999; Barber and Odean,
2000). However, activity is also a source of experience and learning and trading costs tend to diminish with experience
(Grinblatt, Keloharju and Linnainmaa, 2012). We find a positive and statistically significant coefficient for the variable
“log of total trading” meaning that more active investors are more likely to repurchase a stock than less active
investors. As trading activity doubles, the probability of repurchasing (versus new purchases) increases at least by
6.6%, on average.
The number of stocks in account may not be an appropriate measure of diversification when the wealth of the portfolio
is not evenly distributed. To better capture the level of portfolio diversification, we create a diversification index that
takes into account the proportion invested in each stock. The Herfindahl–Hirschman Index (HHI) measures the degree

11
of investor portfolio concentration, thus we use 1 - HHI to denote diversification4. We compute the proportion invested
in each stock using the acquisition prices, net of trading costs, for each stock held at the end of each day of trading.
The diversification index equals zero for absolutely non-diversified portfolios and 1 [100%] for the ultimate diversified
portfolio. The mean of the diversification index for the entire period is 0.26, which is very low, according to Woerheide
and Persson (1993) for whom index values of less than 0.85 represent not adequately diversified portfolios.
We find that the index of portfolio diversification has a negative impact on the probability of repurchasing a stock: a
unit increase in the investor “Mean of Diversification Index” reduces the probability of repurchasing a stock previously
owned by at least 30%, on average.
To analyze the impact of investor performance on repurchasing behavior, we include in the probit model the “Mean
of investor daily market-adjusted returns” (mean of the investor daily market-adjusted return, on the days when the
investor has holdings in account) interacted with positive and negative dummies. This variable captures the investor
real ability and skill, but not the perceived or realized performance in the moment of the decision. We find that the
higher is the positive performance the more the investor avoids repurchases.
The independent variable “log of the mean of the stock account value” (natural logarithm of the mean of the stock
account value, on the days when the investor has holdings in account, expressed in Euros) measures account value
and it is a proxy for investor wealth. We find some evidence that the larger is the account value, the less likely is the
investor to engage in repurchasing behavior. For instance, each time the stock account value doubles, the propensity
to repurchase decreases at least by 3% on average. The results are in line with Grinblatt, Keloharju and Linnainmaa
(2012) who find that wealthier investors are more likely to improve trading behavior. Another source of trading
experience derives from the account age (Nicolosi, Peng and Zhu, 2009). “Account age” is the elapsed time (in years)
since the account opening at the beginning of the data period. The mean of the account age is 3.9 years. We find some
evidence, albeit weak, that account age reduces investor propensity to repurchase (coefficient of -0.016 from equation
7). Summarizing, our results suggest more sophisticated investors are less likely to repurchase a stock, since they will
be less attached to the stocks previously hold and more willing to consider other investment opportunities.
In Panel D, we test whether certain investors’ demographic characteristics affect their repurchasing behavior. To do
so, we add to the previous regressions the following independent variables: gender, age (natural logarithm of the
investor age in years at the beginning of the data period), marital status (1 if married, zero otherwise), and occupation.
4 Thus, the Diversification Index is: 𝐷𝐼 = 1 − 𝐻𝐻𝐼 = 1 − ∑ (𝑤𝑖)2𝑛𝑖=1 , where DI represents the Diversification Index; HHI the Herfindahl–
Hirschman Index for portfolio concentration; wi the proportion of portfolio value invested in security i, in decimal form; and n the number of
securities in the portfolio.

12
Investor gender can be associated with more aggressive trading behavior, as men tend to trade more , are more
overconfident and greater risk-takers than women (Barber and Odean, 2001). Investor age is also a source of
experience and learning. Older investors are more risk averse while younger investor are more naïve (Dhar and Zhu,
2006). Older and experienced investors are more likely to make better investment decisions that reflect their
accumulated knowledge of the market. However, as mentioned by Korniotis and Kumar (2011), the investment skills
also deteriorate due to the adverse effects of cognitive aging. Thus, we end up with two competing hypotheses and it
is not clear which one dominates. Finally, occupation and marital status may be associated to overconfidence and
trading activity (Grinblatt and Keloharju, 2009). Due to missing data for some of the demographic variables, the
number of observations used in the regressions is considerably lower. Generally, we do not find significant evidence
that demographic characteristics influence the decision to purchase a stock previously owned, as the coefficients are
not statistically different from zero. There are some exceptions though: in regression (8) we find that investors that
are consultants are more likely to repurchase, whereas mangers or entrepreneurs are less likely to do so. There results,
however, are not robust after we control for investor fixed effects, as shown in regression (9).
In conclusion, we find evidence less sophisticated investors (those who, besides their intensive trading, have
underdiversified portfolios) are more likely to repurchase stocks. These characteristics are common among investors
who trade as gamblers and usually underperform the average individual investor, as shown by Kumar (2009). Using
different proxies for investor sophistication, such as better prior performance, wealth, and experience, lead to the
same conclusion of a negative relation between investor sophistication and repurchasing behavior.
5. Repurchasing Behavior and Price Anchors
From this section on, we narrow down our analysis to the investors5 that have repurchases in the data period and
examine whether investors have preferences in the repurchasing behavior, by comparing their actual repurchasing
behavior with the opportunities to do so. In this section, we use univariate analysis (following Strahilevitz, Odean and
Barber (2011)) to determine the impact of prior selling prices and stock price evolution after the sell in the
repurchasing decision. In the next section, we use a multivariate analysis to examine the impact of the price anchors
and the investor and stock specific characteristics in the preferences on the repurchasing behavior.
According to rational economic theory, investors shall make buying and selling decisions based on the economic
agents’ expectations about future stock prices. Theoretically, buying and selling are two sides of the same coin.
5 651 (742) investors when defining repurchase as the purchase of stocks that were owned and sold in the prior year (quarter). The smaller number of investors for the year window occurs because we start looking for repurchases one year after the beginning of the data period, while for the one quarter window, we start looking one quarter after (using thereafter a year/quarter moving window).

13
However, for investors, and particularly for individual investors who do not short-sell that much, these decisions are
fundamentally different. Individual investors accumulate knowledge and learn based on their experiences. Historical
prices and, particularly, their reference historical prices, play an important role in their future decisions. Investor
expectations can be very idiosyncratic, linked to what happened previously in their account and somehow
disconnected from the relevant market information.
5.1 Preferences for repurchasing prior winners
We expect that, when considering the repurchase of one stock, investors prefer repurchasing their past winners rather
than their past losers. Once they have a positive experience with that stock, they expect to repeat that experience. On
the contrary, we expect investors to avoid past losers, as an attempt to avoid sources of pain and regret. To test
whether investors prefer the repurchase of stocks previously sold for a gain or for a loss, it is not sufficient to compare
the number of repurchases of stocks previously sold for a gain (prior winners) or a loss (prior losers) (Odean, 1998).
The repurchases of prior winners/ losers by an investor have to be scaled by the opportunities to do so, that is the
total number of prior gains/ losses, realized by that investor. We follow the measurement method of Strahilevitz,
Odean and Barber (2011) and compute the ratios Proportion of Prior Winners Repurchased (PPWR) and Proportion of
Prior Losers Repurchased (PPLR). The first divides the number of repurchases of stocks previously sold for a gain by
the total number of stocks sold for a gain that could have been repurchased on the same day; the second divides the
number of repurchases of stocks previously sold for a loss by the total number of stocks sold for a loss that could have
been repurchased on that day. To classify prior losses/ gains we compare the selling price with the reference price. In
our study, the reference price is the volume weighted average acquisition price of the stock previously bought. If only
one buying trade occurred, the average security price is the sole buying price registered in that account for that specific
security.
Table 3 shows the investor preferences regarding the repurchase of stocks previously sold for a gain and for a loss, by
testing the difference between the Proportion of Prior Winners Repurchased (PPWR) and the Proportion of Prior
Losers Repurchased (PPLR). Table 3 Panel A compares the proportions aggregated over time and across all investors
in the data set, while Panel B compares the mean of the proportions per investor6. The upper part of the panels shows
the behavior observed as well as the opportunities to do so. Then, the bottom of the panels shows the proportions,
their difference, and the t-statistics. Table 3 Panel A shows that, the difference in the proportions is statistically
significant at the one percent significance level (t-statistic are -24.2 and -22.6 for one year and one quarter,
6 The results in Table 2 Panel A are drawn under the assumption that investors and days of trading are independent. Violating this assumption may artificially inflate the t-statistics. However, since the t-statistics in our tests are considerable high, that should not compromise the robustness of the results. Nevertheless, to overcome the concern about investor independency, in Panel B we use an alternative test, by computing the preference ratios by investor and testing the difference in means.

14
respectively). On average, the proportion of repurchased prior winners is around 1.53 (1.46) times higher than the
proportion of repurchased prior losers for stock owned during the year (quarter) prior to the repurchase, respectively.
Therefore, we conclude that, in general, investors prefer to repurchase stocks previously sold for a gain. Table 2 Panel
B shows the results by investor. The difference of the mean of the proportions as well as its significance increase with
this version of the test because we are weighting all investors equally, thus infrequent traders will tend to be
overstated. This analysis ignores that accounts with more transactions provide estimations that are more accurate. It
also assumes that the PPLR and PPWR are homoscedastic when they are clearly heteroscedastic. However, as we do
not know the degree of independence of each account, the test serves its purpose. These findings suggest that
investors may exhibit differences in their preferences related to their intensity of trading7.
5.2 Preference for repurchasing stocks that dropped in price after being sold
Although in efficient markets, investors should be indifferent to purchase stocks, which price went up or down after
the last sell, in this section we test whether post-sell stock prices are anchors that affect investor repurchasing
behavior. Using the same windows, we determine whether the stock was repurchased at a higher, lower or the same
price, with respect to the last sell, based on the difference between selling price and repurchasing price. Then, we
calculate the opportunities to repurchase stocks up since being sold and the opportunities to repurchase stocks down
since being sold, by examining every stock that an investor could repurchase on that day. We check whether it could
be repurchased at higher or lower price by comparing the selling price of the last sell in the year (quarter) window to
the closing price of the repurchasing day. Finally, we aggregate the figures for each account over time and compute
the Proportion of Stocks Up Since being Sold that were Repurchased (PSUSSR) and the Proportion of Stocks Down
Since being Sold that were Repurchased (PSDSSR) similarly to the calculations of PPWR and PPLR.
Table 4 shows the ratios PSUSSR and PSDSSR and tests the differences for the one year/quarter windows. The results
are quite strong in both cases: the differences in the proportions are significant (t-stats of 27 and 29). Therefore, we
can conclude that investors prefer to repurchase stocks that have lost value, rather than gain, subsequent to a prior
sell. This behavior can be explain in terms of mental accounting: when the stock price goes up after the sell, investors
realize that they would be better off if they had held their position in that stock instead of selling it. Therefore, they
7 Moreover, the magnitude of gains/losses may also have a different impact on the repurchasing preferences, if, for instance, investors are repurchasing their small prior winners and their larger prior losers. Thus, we also test the preferences for repurchasing stocks previously sold for a gain/loss, in value (Euros), using the value of prior winners/Losers repurchased compared to the opportunities to do so and get results in the same line as those reported in Table 2. The magnitudes of gains/losses have no substantial impact: for a year (quarter) window, repurchased winners have had an average gain of 786€ (788€) and repurchased losers an average loss of 679€ (805€). With respect to the potential repurchases, these figures decrease substantially for both: winners that could have been repurchased (but that were not) have had an average gain of 361€ (361€) and losers and average loss of 426€ (386€).

15
will prefer to not buy the stock back later. On the contrary, when the price goes down after the sell, investors realize
that they made a good decision and if they decide to buy the stock again, they will be better off than if they had kept
the stock in account. Thus, the repurchase of stocks at a price lower than that for which they have sold it emphasizes
positive counterfactuals.
In Table 5 we compute the proportion of stocks up since being sold that were repurchased (PSUSSR) and the proportion
of stocks down since being sold that were repurchased (PSDSSR) for prior winners repurchased and for prior losers,
separately for prior winners and for prior losers. The preference of repurchasing stocks that have lost value after the
sell exists when the stock is either a prior winner or loser. However, the magnitude of the differences is much larger
for prior winners (differences of 0.0420 and 0.0720 for one-year and one-quarter windows, respectively) than prior
losers (with differences of only 0.0042 and 0.0190 for the one-year and one-quarter windows, respectively). Also, the
statistical significant is much stronger for prior winners (with corresponding t-statistics of 30.76 and 30.16) than prior
losers (with t-statistics of 2.77 and 6.18). This means that investors tracking on prices want both: prior winners that
increased in price after being sold. If the first does not happen their interest decreases considerably. These findings
are based on the assumption that investors keep the mental accounts opened, even when the stock is sold, and
continue monitoring the prices evolution after the sell. We find that the differences we test are larger across the board
when we consider the one-quarter window. This seems to indicate that past experiences may fade over time and the
most recent ones are expected to have a stronger impact on the current investor repurchasing behavior.
5.3 Repurchasing preferences of frequent traders and diversified investors
The preferences for past winners and stocks that dropped in price after being sold uncovered above may differ among
different groups of investors. A number of studies show that the levels of trading and diversification can affect investor
behavior. For instance, Graham, Harvey and Huang (2009) find that investors who feel more competent trade more
often. However, this sentiment of skill or knowledge is driven by overconfidence and results in poor performance
(Barber and Odean, 2000). Other studies also find that investors learn by trading (Seru, Shumway and Stoffman, 2010)
becoming more sophisticated and avoiding more behavioral biases. As Goetzmann and Kumar (2008), we observe that,
in general, investors in our sample are under-diversified and trade many times the same stock. However, we also find
considerable cross-section variation among investors in terms of diversification and trading activity that worth more
detailed analysis.
In particular, we raise the question of whether the most active or diversified investors have less control over their
accounts or are less prone to behavioral biases. In this section, we test whether the preferences for repurchasing past
winners or stocks that dropped in price after being sold differ between groups of investors according to their trading
activity and diversification. As measure of investor activity, we use the number of trades of an investor throughout the
entire sample period. As a measure of investor diversification, we use the average number of stocks the investor has

16
in his account. We used as cutoffs the percentiles 50, 75 to distinguish lower from upper groups. The percentiles are
calculated after netting all trades for the same investor in the same day. In this analysis, we only consider investors
who make repurchases of stocks that they have previously owned and sold in the past year. Panel A of Table 6 shows
that the preference for repurchasing past winners is more frequent among investors with lower trading activity and
less diversified. The differences are statistically significant at the 1%, independent on which cutoff (50th or 75th
percentile) we use. Similarly, in Panel A, we also find that the preference to repurchase stocks that dropped in price
after being sold is more frequent among investors who trade more and are more diversified. In Table 6 Panel B, we
estimate the difference in proportions per investor and then test the difference in means8, using the same cut-off
percentiles. The methodology now ponders the observations aggregated per investor instead of per action of
repurchasing. The stronger concentration of the preference for repurchasing past winners on bottom groups (less
active and under-diversified investors) keeps up. The magnitude of the difference in means between groups increases
(comparing to the difference between groups for the difference of proportions) although the significance remains
about the same. When measuring the differences in the preference of repurchasing stocks that decreased in price
after being sold, the difference between groups is reduced (not anymore statistically significant for the majority of the
cut-offs). Overall, we conclude that investor activity and diversification influence the trading behavior and that active
and more diversified investors pay less attention to past prices in their trading decisions. We believe that there are
two main reasons to explain this behavior. Firstly, as investors become more active, the keeping their mental
accounting becomes more difficult due to cognitive and memory limitations. Secondly, active investors accumulate
more experience and, therefore, they learn that their past prices may not be so important as anchors for future trading
decisions.
6. Investor-Specific and Stock-Specific Determinants of the Repurchasing Behavior
In this section, we continue our analysis focused only on the investors that have repurchases in the data period. We
perform a multivariate analysis to identify investor or stock characteristics that affect the likelihood of repurchasing a
stock that was previously owned by the investor. To do so, we estimate a probit model where the dependent variable
is one if the investor repurchases a stock and zero if he has the opportunity to repurchase the stock but does not do
it. Thus, for each day we identify not only the stock repurchases made by an investor, but also all the potential
repurchases that an investor could make, even if he does not do so.
8 We also test the Wilcoxon rank-sum and the difference in medians with similar results.

17
In Table 7 we present the estimation of the probit model. For each variable, the table reports the marginal effect on
the likelihood of repurchasing a stock given the pool of potential repurchases. We cluster standard errors by stock to
mitigate potential biases originated by an abnormal concentration of repurchases of the same stock by several
investors on the same day. Additionally, we include investor dummies to control for other non-identified investor-
specific factors.
In Panel A of Table 7 we show how the repurchasing decision is affected by investor anchors. In equations (1) and (2)
we analyze the repurchase of stocks previously sold for a gain versus loss, using a winner/loser dummy variable and
the repurchase of stocks for a higher or lower price than the prior selling price, using a up/down dummy. The results
are consistent with the ones shown in the univariate analysis: investors prefer to repurchase past winners and stocks
which price has dropped after the prior sell, as the coefficients of dummies “winner/loser” (“up/down”) are positive
(negative) and statistically significant. Not only the existence of a gain/ loss in a prior sell can affect the investor
repurchasing behavior, but more importantly the magnitude of that gain/ loss may affect the intensity of the
repurchasing behavior (e.g., Kahneman and Tversky, 1979; 1982). From regressions (3) to (13), we replace the dummy
variables by the actual percentage gain/ loss of the prior sell and the percentage change (up/ down) in stock price after
the prior sell. We use these percentages are in absolute terms and multiply them by a dummy variable, “Positive”
(“Negative”), that equals one if case the actual percentage is positive (negative), and zero otherwise. The results
indicate that the magnitude of gains/losses also matters. We find evidence that the more positive are the percent
gains of the prior sell, the higher is the probability that the stock is repurchased, as the coefficients of “Gain/loss (%)
* Positive” are all positive and statistically significant. As for the percent loss, we find some evidence that stocks with
larger losses when sold are less likely to be repurchased later. However, these results are not robust after controlling
for stock characteristics – although the coefficients of “Gain/loss * Negative” are negative, they are not statistically
significant in regressions (4) to (8). Thus, we can infer from these results that investors are more sensitive to the
magnitude of prior gains to make new repurchases than the magnitude of prior losses to avoid them. In untabulated
estimations, we replaced the percent gain/loss by the logarithm of the absolute value of the gain/loss. The results
remain statistically strong and the coefficients are 0.003 for gains and -0.001 for losses, reinforcing the conclusion that
the wish of past winners is stronger (about the triple) than the avoidance for past winners. These findings also suggest
that investors pay even more attention to absolute than relative values, as proposed by (Kahneman and Tversky,
1979). With respect to the stock price movement after the sell, as expected, there is a higher (lower) propensity to
repurchase stocks that dropped (increased) in price after the sell, respectively. However, the impact is much stronger
(the coefficients are much higher) for the first. These results suggest that narrow framing provided by mental
accounting and loss aversion, according to the prospect theory, play a critical role in determining attitudes towards
risk. The variable “log of trading days after the sell” controls for the time gap between the prior sell and the repurchase
18
date. As the time gap increases, the probability of repurchasing that same stock decreases9. For instance, if the time
gap (in days) between the sell and the repurchase doubles, the probability of repurchasing that stock decreases by
2%. We also analyze whether some historical time gaps have stronger impact than others by testing 12 different time
intervals, up to one year, between the sell and the repurchase. The results (untabulated) show a statistical strong
positive correlation up to the third day. After one week, the coefficients become negative and increase as the time
gap increases. This means that, after the sell, the probability of a repurchase up to the third day is very high and as the
time gap increases the probability of repurchasing decreases, compared to the opportunities to do so. This evidence
suggests that the stocks recently sold are the most likely to be repurchased, which means that the mental account for
the stock sold may be kept open for a while but soon it loses importance.
Regressions in Panel B include stock characteristics, by adding to the previous regressions several proxies for stock
visibility. In line with Barber and Odean (2008), we expect that individuals will more likely buy stocks that catch their
attention. We use the "Log of Daily Stock Volume, in Euros" as a proxy for visibility and changes in investor sentiment
and find a positive impact on the propensity to repurchase a stock against to pool of all possible repurchases – the
coefficients are about 0.005 and strongly statistically significant in all specifications10. Overall, we find clear evidence
of an investor preference for repurchasing larger and more visible stocks.
In addition, we also find that individuals are more likely to repurchase stocks that are denominated in Euros, from
Portuguese companies, and the ones that belong to the Portuguese main market index – PSI-20. We are aware that
these variables suffer from multicollinearity, so, we first include each one separately in the regressions, and then all
of them together, and conclude that being a Portuguese company is the prevailing effect. There are two competitive
motivations for the preference to repurchase domestic companies. One explanation is familiarity, a behavioral based
reason. Investors prefer stocks that are closer and familiar to them. Other possible explanation is that investors have
easier access to more accurate value-relevant information. We argue that familiarity is a strong reason. Even if
familiarity does not mean to be particularly better informed, it means easier and less costly access to the information,
without language and cultural barriers.
Panel C shows to what extent stock past returns affect the repurchasing decision, by including in the regressions
positive and negative stock market-adjusted returns in 12 historical intervals. We would expect that the signs of the
coefficients are negative for stock market-adjusted returns interacted with the dummy variable “Positive” and positive
9 The mean repurchase occurs 52 calendar days after the sell (standard deviation of 0.6639192), while the mean potential repurchase is 129 calendar days after the sell (standard deviation of 0.2118862). 10 Alternatively, we also estimate the same regressions using the “Log of the Mean Stock Volume, in Euros” (natural logarithm of the mean of the stock volume for the entire data period, expressed in Euros.) as a proxy for firm size and global visibility. The results (untabulated)
are very similar, but slightly smaller in magnitude – the coefficients are on average 0.003, statistically significant at 1%.
19
for stock market-adjusted returns interacted with the dummy “Negative”. However, we not observe this pattern. From
the first up to the third lagged trading day, before the actual or potential repurchase, positive past market-adjusted
returns are negatively related to the propensity of repurchasing. From the fourth up to the 119th lagged trading day,
positive market-adjusted past returns have no significant impact on the decision the repurchase a stock, whereas,
beyond the 120th lagged trading day, positive market-adjusted returns are significantly and positively correlated with
the repurchasing decision. On the contrary, the results show a strong preference for the repurchase of stocks with
recent negative performance. Up to the 59th lagged trading day, the more negative is the stock performance, the
higher is the propensity to repurchase, as the coefficients of the interaction between stock market-adjusted returns
and the dummy “Negative” are positive and statistically significant. This preference is very strong for stocks with
negative performance in the prior week (e.g. a negative performance of an additional 1% in the second lagged day
increases the propensity to repurchase by 36% on average) and decreases for longer lagged periods, becoming
negligible after 59 trading days. Overall, in line with the literature (Grinblatt and Keloharju, 2001b; Kaniel, Saar and
Titman, 2008), the more recent and higher is the negative adjusted stock return, the more likely is the investor to
repurchase that stock. Since negative returns beyond 59 lagged trading days appear to have little impact on the
repurchasing decision, we seem to find evidence of contrarian behavior up to trading days and momentum beyond
120 trading days. We can relate this short-term contrarian behavior with the preference for repurchasing in a
downward trend after the sell that we find in equations (1) and (2). Although, a stock with negative lagged
performance did not necessarily observe a downward movement after the sell, as the latter depends on the investor
timing, we can expect that many times these two situations overlap. From our results, we conclude that both effects
coexist: investors prefer to repurchase stocks with recent negative past performance and, particularly, those that
performed poorly after the sell.
In panel D, we add account characteristics to the regressions, namely, trading activity, diversification, performance
and, value of the stock holdings, and total account value. We measure investor trading activity by the logarithm of
investor total number of trades over the entire sample period and find that the more active investors tend to
repurchase less. For instance, doubling the number of trades reduces the repurchasing behavior, at least, by 15% on
average. In our sample investors trade, on average, 25 times in the period, but there are great differences among them
(standard deviation of 125 and the most active investor with 3,515 trades in the period). Thus we argue that the most
active investors have cognitive and memory constrains that prevent them from monitoring past experienced prices so
intensely. Additionally, these investors are more experienced and expectedly more sophisticated, therefore they
should disregard past experienced prices in their buying decision. In the regressions, we also include the Daily
Diversification Index (investor diversification on the day of the repurchase). We find that the investors who have more
underdiversified accounts at the moment of the decision repurchase significantly less (coefficient of -0.02). We argue
that if at a given time, an investor is particularly concentrated in few stocks, he may prefer to continue concentrated
(avoiding repurchasing) for that reasons that generated that choice for concentration. Particularly, investors that are
concentrated in one stock avoid the repurchase of others at that moment. On the contrary, when we, alternatively,

20
use the Mean of the Diversification Index (untabulated, due the high level of correlation with Daily Diversification
Index), we find that investors with more underdiversified accounts tend to repurchase more.
With respect to investor performance, we find that the larger the magnitude of the market-adjusted returns (positive
or negative), the more likely it is that the investor will repurchase11. Thus, we conclude that investors with more
extreme positive and negative average past market-adjusted returns are the ones more likely to repurchase. Using the
total period market-adjusted returns, we are relating the repurchasing decision to a return that is not completely
produced when the decision is made. Therefore, this variable proxies for real investor ability and skills but not
necessarily for perceived performance.
Finally, in the last two regressions we include variables that measure account value (the total Euro amount invested
in all securities in the investor’s account) and the value of investor stock holdings (total amount in Euro invested in all
stocks) . We find that both coefficients are not statistically significant to explain the repurchase behavior. We also
control for investor demographics (age, gender, status, occupation) and investor market adjusted returns before the
repurchase (over the same lagged intervals used for stock) and conclude that these variables are not significant to
explain preferences for repurchasing.
7. Conclusions
In the stock market, when it comes to deciding what to buy the possibilities are endless. Nevertheless, we observe,
for a sample of 5,128 investors, that repurchases represent 29% of all purchases. Still, the literature has paid little
attention to this subset of purchases. We present a comprehensive analysis of the determinants of the repurchasing
of stocks currently or previously owned. We describe similarities and heterogeneity in investor repurchasing behavior,
analyzing together numerous variables, and distinguishing their contributions.
Based on a unique database of 5,128 investors trading in the period from 1st August 2003 to 31st July 2007, we find
evidence of the preference for repurchasing stocks that were “prior winners” (i.e. stocks that were previously sold for
a gain) and also a preference for stocks which price has dropped after the prior sell. Our results are in line with
Strahilevitz, Odean and Barber (2011), not only at the aggregated level, as these authors, but also at the individual
level. These findings suggest that the decision to repurchase a stock is strongly behavioral and emotional-based,
11 We also test lagged investor market-adjusted returns for the same 12 intervals used for stock market-adjusted returns interacted with positive and negative dummies and find that the likelihood of repurchasing is not affected by the investor past performance (untabulated).

21
associated with mental accounting framing, counterfactual thinking, loss aversion and regret aversion (experienced or
anticipated).
Furthermore, we test the importance of stock and investor characteristics to explain this behavior. We find that
reference prices, prior stock returns, visibility, and investor performance and sophistication are determinants of the
repurchasing behavior. The propensity to repurchase versus a new stock purchase is positively related with firm size,
stock visibility, Euro currency stocks, prior positive stock performance, and unsophisticated investors.
When testing the likelihood of a repurchase from the entire set of all possible repurchases available to the investor,
we conclude that past experienced prices are strong anchors for the decision to purchase current or previous holdings.
Being a prior or current winner matters as well the price evolution after the sell. The magnitudes of these outcomes
also affect the decision. We find evidence that the larger the prior gain or the decrease in price after the sell, the more
likely the investor is to purchase the same stock again. Thus, the magnitude of the gain or loss matter for the
repurchasing decision-. Additionally, we find that the purchase of prior winners is more likely for domestic visible
stocks with negative market-adjusted returns, and particularly for less active, under-diversified and poor-performing
investors. Finally, we find that demographic characteristics (such as age, gender, marital status and profession) are not
relevant to explain investor repurchasing behavior.

22
Appendix I - List of variables
- Accounts’ age: Elapsed time since account opening in years, at the beginning of the data period. - Diversification: Average number of stocks in investor account, determined based on days that investor has holdings in account. - Daily Diversification Index: Herfindahl–Hirschman Index that takes into account the amount invested in each stock and
captures the degree of investor portfolio diversification, determined for each investor each day he has holdings in account, given by the following formula: 1 − 𝐻𝐻𝐼 = 1 − ∑ (𝑤𝑖)2𝑛
𝑖=1 , where HHI the Herfindahl–Hirschman Index for portfolio concentration; wi the proportion of portfolio value invested in security i, in decimal form; and n the number of securities in the portfolio.
- Diversification Index: Mean of the Daily Diversification Index by Investor, determined each day the investor has holding in account.
- Euro dummy: Dummy variable that equals 1 if the stock is denominated in Euro currency. - Gain/loss(%): Percentage outcome (gain or loss) previously obtained with the stock, determined by comparing the average
acquisition price with the selling price. - Gender: Dummy variable that equals 1 if the investor is a men and 0 she is a women. - Log of age: Natural logarithm of the investor age in years at the beginning of the data period. - Log of Daily Stock Volume, in Euros: Natural logarithm of the daily stock volume, expressed in Euros. It is determined every
stock trading day and is used as a proxy for stock visibility at that moment. - Log of gain/loss: Natural logarithm of the absolute value of the outcome (gain or loss) by comparing the average acquisition
price with the selling price, expressed in Euros. - Log of the mean of the stock account value: Natural logarithm of the mean of the stock account value, expressed in Euros.
Proxy of investor wealth. - Log of the mean of the stock total value: Natural logarithm of the total (stocks and other securities) account value, expressed
in Euros. Proxy of investor wealth. - Log of the Mean Stock Volume, in Euros: Natural logarithm of the mean of the stock volume for the entire data period,
expressed in Euros. Proxy of size and stock global visibility. - Log of total trading: Natural logarithm of the total number of investor trades (excluding day-trading) in the data period. - Log of trading days after the sell: Natural logarithm of the interval of trading days between the sell and the (real or potential)
repurchase. - Mean of Investor Daily Market-Adjusted Returns (MAR): mean of the investor daily market-adjusted return, on the days when
the investor has holdings in account. We use PSI20 index as the proxy for the market returns. - Occupation: Dummy variable that takes the value of 1 for the specified occupation category and zero otherwise. - PSI20 index dummy: Dummy variable that equals 1 if the stock belongs to the PSI20 index. - PT dummy: Dummy variable that equals 1 if the stock is Portuguese. - Status: Dummy variable that equals 1 for the specified status category and zero otherwise. - Stock MAR [day(s)]: Stock market-adjusted return in the given trading day, or interval of trading days, before de purchase
decision. We consider 12 historical intervals: current day (day 0), the four prior days (days -1, -2, -3 and -4) and series of multiday (trading days -9 to -5; -19 to -10; -39 to -20; -59 to -40; -119 to -60; -179 to -120 and -239 to -180, inclusive). We use PSI20 index as the proxy for the market returns.
- Up/down dummy: Dummy variable that equals 1 if the price has an upward movement between the prior sell and the (real or potential) repurchase and 0 otherwise.
- Up/Down(%): Percentage variation of the stock price in the interval between the prior sell and the (real or potential) repurchase.
- Winner/loser dummy: Dummy variable that equals 1 if the stock is a prior winner and 0 otherwise.

23
List of references
Ariely, D., G. Loewenstein and D. Prelec (2003). "Coherent Arbitrariness: Stable Demand Curves without Stable Preferences*." Quarterly Journal of Economics 118(1): 73-105.
Arkes, H. R., D. Hirshleifer, D. Jiang and S. Lim (2008). "Reference Point Adaptation: Tests in the Domain of Security Trading." Organizational Behavior and Human Decision Processes 105(1): 67-81.
Baker, M. and J. C. Stein (2004). "Market Liquidity as a Sentiment Indicator." Journal of Financial Markets 7(3): 271-299.
Baker, M. and J. Wurgler (2007). "Investor Sentiment in the Stock Market." Journal of Economic Perspectives 21(2): 129-152.
Barber, B. and T. Odean (2000). "Trading Is Hazardous to Your Health: The Common Stock Investment Performance of Individual Investors." Journal of Finance 55(2): 773-806.
Barber, B. and T. Odean (2001). "Boys Will Be Boys: Gender, Overconfidence, and Common Stock Investment*." Quarterly Journal of Economics 116(1): 261-292.
Barber, B. and T. Odean (2008). "All That Giltters: The Effect of Attention and News on the Buying Behavior of Individual and Institutional Investors." Review of Financial Studies 21(2): 785-818.
Barber, B., T. Odean and N. Zhu (2009). "Systematic Noise." Journal of Financial Markets 12(4): 547-569.
Bhushan, R. (1989). "Firm Characteristics and Analyst Following." Journal of Accounting and Economics 11(2-3): 255-274.
Calvet, L. E., J. Y. Campbell and P. Sodini (2007). "Down or Out: Assessing the Welfare Costs of Household Investment Mistakes." Journal of Political Economy 115 707–747.
Calvet, L. E., J. Y. Campbell and P. Sodini (2009a). "Fight or Flight? Portfolio Rebalancing by Individual Investors." Quarterly Journal of Economics 124(1): 301-348.
Calvet, L. E., J. Y. Campbell and P. Sodini (2009b). "Measuring the Financial Sophistication of Households." American Economic Review 99(2): 393–398.
Campbell, J. Y. (2006). "Household Finance." Journal of Finance 61(4): 1553-1604.
Choi, J. J., D. Laibson, B. C. Madrian and A. Metrick (2009). "Reinforcement Learning and Savings Behavior." Journal of Finance 64(6): 2515-2534.
De Bondt, W. F. M. (1998). "A Portrait of the Individual Investor." European Economic Review 42(3-5): 831-844.
Dhar, R. and N. Zhu (2006). "Up Close and Personal: An Individual Level Analysis of the Disposition Effect." Management Science 52(5): 726-740.
Feng, L. and M. S. Seasholes (2004). "Correlated Trading and Location." Journal of Finance 59(5): 2117-2144.
Feng, L. and M. S. Seasholes (2005). "Do Investor Sophistication and Trading Experience Eliminate Behavioral Biases in Financial Markets?" Review of Finance 9(3): 305-351.
Goetzmann, W. N. and A. Kumar (2008). "Equity Portfolio Diversification." Review of Finance 12(3): 433-463.
Graham, J. R., C. R. Harvey and H. Huang (2009). "Investor Competence, Trading Frequency, and Home Bias." Managment Science 55(7): 1094-1106.
Grinblatt, M. and M. Keloharju (2001a). "How Distance, Language, and Culture Influence Stockholdings and Trades." Journal of Finance 56(3): 1053-1073.
Grinblatt, M. and M. Keloharju (2001b). "What Makes Investors Trade?" Journal of Finance 56(2): 589-616.
Grinblatt, M. and M. Keloharju (2009). "Sensation Seeking, Overconfidence, and Trading Activity." Journal of Finance 64(2): 549-578.
Grinblatt, M., M. Keloharju and J. T. Linnainmaa (2012). "Iq, Trading Behavior, and Performance." Journal of Financial Economics 104(2): 339-362.
Huberman, G. (2001). "Familiarity Breeds Investment." Review of Financial Studies 14(3): 659-680.

24
Ivkovich, Z., C. Sialm and S. Weisbenner (2008). "Portfolio Concentration and the Performance of Individual Investors." Journal of Financial and Quantitative Analysis 43(3): 613-655.
Ivkovich, Z. and S. Weisbenner (2005). "Local Does as Local Is: Information Content of the Geography of Individual Investors' Common Stock Investments." Journal of Finance 60(1): 267-306.
Kahneman, D. and A. Tversky (1979). "Prospect Theory: An Analysis of Decision under Risk." Econometrica 47(2): 263-292.
Kahneman, D. and A. Tversky (1982). "The Psychology of Preferences." Scientific American 246(1): 160-173.
Kaniel, R., G. Saar and S. Titman (2008). "Individual Investor Trading and Stock Returns." Journal of Finance 63(1): 273-310.
Kaustia, M. and S. Knüpfer (2008). "Do Investors Overweight Personal Experience? Evidence from Ipo Subscriptions." Journal of Finance 63(6): 2679-2702.
Korniotis, G. M. and A. Kumar (2011). "Do Older Investors Make Better Investment Decisions?" Review of Economics and Statistics 93(1): 244-265.
Kumar, A. (2009). "Who Gambles in the Stock Market?" Journal of Finance 64(4): 1889-1933.
Linnainmaa, J. T. (2011). "Why Do (Some) Households Trade So Much?" Review of Financial Studies 24(5): 1630-1666.
Malmendier, U. and S. Nagel (2011). "Depression Babies: Do Macroeconomic Experiences Affect Risk Taking?*." Quarterly Journal of Economics 126(1): 373-416.
Massa, M. and A. Simonov (2005). "Behavioral Biases and Investment." Review of Finance 9(4): 483-507.
Nicolosi, G., L. Peng and N. Zhu (2009). "Do Individual Investors Learn from Their Trading Experience?" Journal of Financial Markets 12(2): 317-336.
Odean, T. (1998). "Are Investors Reluctant to Realize Their Losses?" Journal of Finance 53(5): 1775-1798.
Odean, T. (1999). "Do Investors Trade Too Much?" American Economic Review 89(5): 1279-1298.
Peng, L. and W. Xiong (2006). "Investor Attention, Overconfidence and Category Learning." Journal of Financial Economics 80(3): 563-602.
Roese, N. (1996). "Counterfactuals, Causal Attributions, and the Hingsight Bias: A Conceptual Integration." Journal of Experimental Social Psychology 32: 197-227.
Roese, N. (1997). "Counterfactual Thinking." Psychological Bulletim 121(1): 133-148.
Seru, A., T. Shumway and N. Stoffman (2010). "Learning by Trading." Review of Financial Studies 23(2): 705-739.
Statman, M. (2011). What Investors Really Want: Know What Drives Investor Behavior and Make Smarter Financial Decisions, MacGrawHill
Strahilevitz, M., T. Odean and B. Barber (2011). "Once Burned, Twice Shy: Naive Learning, Counterfactuals, and the Repurchase of Stocks Previously Sold." Journal of Marketing Research 48(SPL): S102-S120.
Thaler, R. (1985). "Mental Accounting and Consumer Choice." Marketing Science 4(3): 199-214.
Weber, M. and F. Welfens (2011). "The Follow-on Purchase and Repurchase Behavior of Individual Investors: An Experimental Investigation." Die Betriebswirtschaft 71: 139-154.
Woerheide, W. and D. Persson (1993). "An Index of Portfolio Diversification." Financial Services Review 2(2): 73-85.
Zeelenberg, M. (1999). "Anticipated Regret, Expected Feedback and Behavioral Decision Making." Journal of Behavioral Decision Making 12(2): 93-106.

25
Table 1: Summary Statistics
This Table describes the data after the process of daily account construction. Trades are determined ignoring the intra-day trading and sells with matching purchase. Purchases are classified as repurchases if the investor owned and sold the stock in the prior year (quarter). We start looking for repurchases as of August 1, 2004 (November 1, 2003), using a moving window of the prior 365 (91) calendar days.
# observations # investors Mean St. Deviation Maximum € value
Trades (buys and sells) 111,616 4,428 25.21 125.45 3,516 1,487,800,379
Different Stocks traded 1,604 4,428 4.73 12.14 287 1,487,800,379
Purchases 61,123 4,428 13.80 66.37 1,936 826,728,812
Repurchases (1Y) 13,143 651 20.19 43.26 481 9,907,340
Repurcahses (1Q) 13,848 742 18.66 38.82 416 10,974,980

26
Table 2: Determinants of the propensity to repurchase (versus new repurchases)
This Table reports the results of probit regressions that estimate the propensity to repurchase versus new purchase. The values in the Table are
marginal effects. The sample is for the period from 1-8-2003 to 31-07-2007. The dependent variable is a dummy representing the binary
outcome: 1 for repurchase and 0 for new repurchase. We consider 4,090 investors that purchase 1,508 stocks, which generates 16,471 unique
combinations of investor-stock for 46,504 observations (13,500 of them classified as repurchases). The variables generated by interaction with
“Positive” and “Negative” dummies are reported in absolute values. Independent variables are described in Appendix I. Robust z-stats are
adjusted for clustering by stock in equations (1) to (3) and (8) and for clustering by investor in equations (4) to (7). Equation (8) considers investor
dummies. *, **, and *** stand for statistical significance at 10%, 5%, and 1%, respectively.
(1) (2) (3) (4) (5) (6) (7) (8)
Panel A: Stock characteristics
Log of Daily Stock Volume, in Euros 0.023*** 0.021*** 0.021*** 0.018*** 0.018*** 0.020*** 0.020*** 0.019***
(5.78) (4.49) (4.88) (14.36) (14.60) (16.03) (16.52) (9.60)
PSI20 index dummy 0.040 0.045 0.049** 0.044** 0.044** 0.067*** 0.090***
(1.04) (1.31) (2.29) (2.11) (2.38) (3.49) (4.03)
PT dummy -0.073** -0.060* -0.052** -0.048** -0.040* -0.019 -0.053**
(-2.13) (-1.87) (-2.32) (-2.19) (-1.88) (-0.71) (-2.30)
EUR dummy 0.106*** 0.097*** 0.076** 0.073** 0.069** 0.105** 0.109***
(6.01) (5.52) (2.37) (2.30) (2.29) (2.34) (3.27)
Panel B: Stock Market adjusted return in the given interval before the purchase
Stock MAR day0*Positive 0.015 0.022 0.021 -0.004 -0.009 -0.004
(0.38) (0.60) (0.57) (-0.09) (-0.18) (-0.08)
Stock MAR day-1*Positive -0.060 0.067 0.052 -0.066 -0.058 -0.114
(-0.30) (0.73) (0.57) (-0.65) (-0.46) (-0.91)
Stock MAR day-2*Positive -0.004* -0.005** -0.004* -0.044 -0.134 -0.110
(-1.76) (-1.99) (-1.87) (-0.43) (-0.95) (-0.99)
Stock MAR day-3*Positive -0.005*** -0.006*** -0.005*** -0.007** 0.009 0.036
(-2.61) (-2.82) (-2.72) (-2.13) (0.10) (0.33)
Stock MAR day-4*Positive 0.393*** 0.339*** 0.328*** 0.227** 0.151 0.151
(3.08) (3.28) (3.24) (2.43) (1.49) (1.26)
Stock MAR days [-9,-5]*Positive -0.004 -0.001 -0.000 -0.001 0.000 0.002
(-1.32) (-0.54) (-0.09) (-0.22) (0.15) (0.66)
Stock MAR days[-19,-10]*Positive 0.246*** 0.210*** 0.209*** 0.172*** 0.150*** 0.173***
(6.25) (6.16) (6.14) (5.17) (4.35) (3.99)
Stock MAR days[-39,-20]*Positive 0.000 0.000 0.000 0.000 0.088*** 0.109***
(0.09) (0.08) (0.13) (0.07) (4.21) (3.58)
Stock MAR days[-59,-40]*Positive 0.150*** 0.131*** 0.128*** 0.107*** 0.114*** 0.132***
(5.14) (5.61) (5.54) (4.81) (4.21) (4.30)
Stock MAR days [-119,-60]*Positive 0.099*** 0.086*** 0.084*** 0.073*** 0.084*** 0.096***
(3.88) (4.30) (4.28) (3.77) (4.02) (3.96)
Stock MAR days[-179,-120]*Positive 0.068*** 0.061*** 0.060*** 0.052*** 0.066*** 0.076***
(3.67) (3.59) (3.59) (3.37) (3.10) (3.06)
Stock MAR days[-239,-180]*Positive 0.096*** 0.096*** 0.095*** 0.089*** 0.098*** 0.098***
(5.39) (6.25) (6.22) (5.86) (5.27) (4.07)
Stock MAR day0*Negative 0.064 -0.013 -0.019 -0.096 -0.208* -0.158
(0.45) (-0.15) (-0.21) (-1.09) (-1.77) (-0.88)
Stock MAR day-1*Negative -0.052 -0.098 -0.107 -0.236** -0.227* -0.251
(-0.44) (-0.89) (-0.98) (-2.31) (-1.72) (-1.45)
Stock MAR day-2*Negative -0.080 -0.077 -0.083 -0.099 -0.152 -0.151
(-0.73) (-0.77) (-0.83) (-1.16) (-1.39) (-1.01)
Stock MAR day-3*Negative -0.266** -0.307*** -0.313*** -0.365*** -0.363** -0.378**
(-2.10) (-2.64) (-2.69) (-3.18) (-2.56) (-2.25)
Stock MAR day-4*Negative -0.032 -0.084 -0.090 -0.177 -0.350* -0.370*
(-0.26) (-0.63) (-0.68) (-1.35) (-1.84) (-1.93)
Stock MAR days [-9,-5]*Negative -0.227*** -0.255*** -0.256*** -0.285*** -0.346*** -0.366***
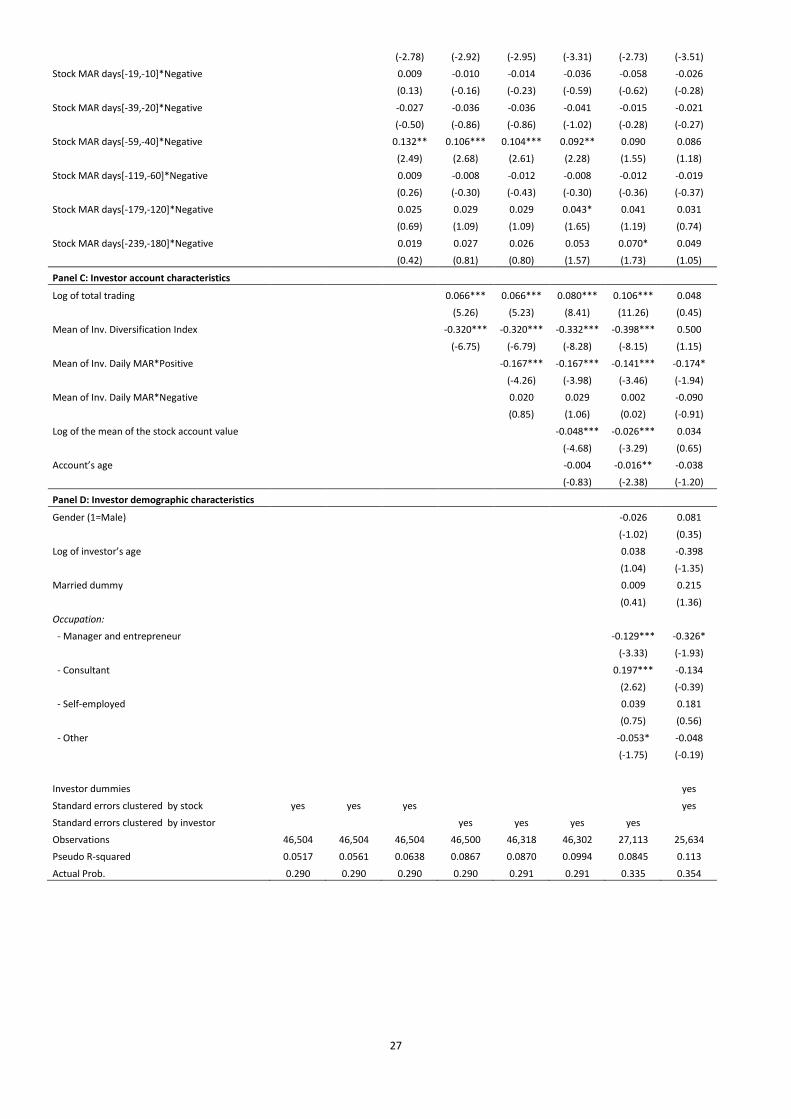
27
(-2.78) (-2.92) (-2.95) (-3.31) (-2.73) (-3.51)
Stock MAR days[-19,-10]*Negative 0.009 -0.010 -0.014 -0.036 -0.058 -0.026
(0.13) (-0.16) (-0.23) (-0.59) (-0.62) (-0.28)
Stock MAR days[-39,-20]*Negative -0.027 -0.036 -0.036 -0.041 -0.015 -0.021
(-0.50) (-0.86) (-0.86) (-1.02) (-0.28) (-0.27)
Stock MAR days[-59,-40]*Negative 0.132** 0.106*** 0.104*** 0.092** 0.090 0.086
(2.49) (2.68) (2.61) (2.28) (1.55) (1.18)
Stock MAR days[-119,-60]*Negative 0.009 -0.008 -0.012 -0.008 -0.012 -0.019
(0.26) (-0.30) (-0.43) (-0.30) (-0.36) (-0.37)
Stock MAR days[-179,-120]*Negative 0.025 0.029 0.029 0.043* 0.041 0.031
(0.69) (1.09) (1.09) (1.65) (1.19) (0.74)
Stock MAR days[-239,-180]*Negative 0.019 0.027 0.026 0.053 0.070* 0.049
(0.42) (0.81) (0.80) (1.57) (1.73) (1.05)
Panel C: Investor account characteristics
Log of total trading 0.066*** 0.066*** 0.080*** 0.106*** 0.048
(5.26) (5.23) (8.41) (11.26) (0.45)
Mean of Inv. Diversification Index -0.320*** -0.320*** -0.332*** -0.398*** 0.500
(-6.75) (-6.79) (-8.28) (-8.15) (1.15)
Mean of Inv. Daily MAR*Positive -0.167*** -0.167*** -0.141*** -0.174*
(-4.26) (-3.98) (-3.46) (-1.94)
Mean of Inv. Daily MAR*Negative 0.020 0.029 0.002 -0.090
(0.85) (1.06) (0.02) (-0.91)
Log of the mean of the stock account value -0.048*** -0.026*** 0.034
(-4.68) (-3.29) (0.65)
Account’s age -0.004 -0.016** -0.038
(-0.83) (-2.38) (-1.20)
Panel D: Investor demographic characteristics
Gender (1=Male) -0.026 0.081
(-1.02) (0.35)
Log of investor’s age 0.038 -0.398
(1.04) (-1.35)
Married dummy 0.009 0.215
(0.41) (1.36)
Occupation:
- Manager and entrepreneur -0.129*** -0.326*
(-3.33) (-1.93)
- Consultant 0.197*** -0.134
(2.62) (-0.39)
- Self-employed 0.039 0.181
(0.75) (0.56)
- Other -0.053* -0.048
(-1.75) (-0.19)
Investor dummies yes
Standard errors clustered by stock yes yes yes yes
Standard errors clustered by investor yes yes yes yes
Observations 46,504 46,504 46,504 46,500 46,318 46,302 27,113 25,634
Pseudo R-squared 0.0517 0.0561 0.0638 0.0867 0.0870 0.0994 0.0845 0.113
Actual Prob. 0.290 0.290 0.290 0.290 0.291 0.291 0.335 0.354

28
Table 3: Preferences for repurchasing stocks previously sold for a gain/loss
This Table shows the Proportion of Prior Winners Repurchased (PPWR) and the Proportion of Prior Losers Repurchased (PPLR) from 1-8-2003 to 31-07-2007. Panel A presents the figures aggregated across accounts and days and assumed to be independent. Panel B presents the same figures as a mean per investor and aggregated only across days. *, **, and *** stand for statistical significance at 10%, 5%, and 1%, respectively.
Panel A: at the aggregated level 1 year 1 quarter
Number of Prior Winners Repurchased 9,953 10,568
Number of Prior Losers Repurchased 2,897 2,986
Number of Opportunities to Repurchase Prior Winners 165,977 87,487
Number of Opportunities to Repurchase Prior Losers 73,992 36,047
Proportion of prior losers repurchased (PPLR) 0.0392 0.0828
Proportion of prior winners repurchased (PPWR) 0.0600 0.1208
PPLR-PPWR -0.0208 *** -0.0380 ***
t-statistic (-22.6010) (-20.8276)
Panel B: at the individual level
Mean of Prior Winners Repurchased by investor 15.312 14.262
Mean of Prior Losers Repurchased by investor 4.457 4.030
Mean of Opportunities to Repurchase Prior Winners by investor 255.266 118.009
Mean of Opportunities to Repurchase Prior Losers by investor 112.829 48.126
Mean of the Proportion of Prior Losers Repurchased (PPLR̅̅ ̅̅ ̅̅ ̅) 0.1597 0.1980
Mean of the Proportion of Prior Winners Repurchased (PPWR̅̅ ̅̅ ̅̅ ̅̅ ) 0.3049 0.4018
PPLR̅̅ ̅̅ ̅̅ ̅ − PPWR̅̅ ̅̅ ̅̅ ̅̅ -0.1452 *** -0.2038 ***
t-statistic (-110.4337) (-104.7371)
Table 4: Preferences for repurchasing stocks up/down since being sold
This Table shows the Proportion of stocks up since being sold that were repurchased (PSUSSR) and the Proportion of stocks down since being sold that were repurchased (PSDSSR) from 1-8-2003 to 31-07-2007. Panel A presents the figures aggregated across accounts and days and assumed to be independent. Panel B presents the same figures as a mean per investor and aggregated only across days. *, **, and *** stand for statistical significance at 10%, 5%, and 1%, respectively.
Panel A: at the aggregated level 1 year 1 quarter
Number of Stocks up since being sold that were repurchased 6,428 6,164
Number of Stocks down since being sold that were repurchased 6,278 7,139
Number of Opportunities to repurchase stocks up since being sold 146,277 70,454
Number of Opportunities to repurchase stocks down since being sold 87,657 50,487
Proportion of stocks down since being sold that were repurchased (PSDSSR) 0.0716 0.1414
Proportion of stocks up since being sold that were repurchased (PSUSSR) 0.0439 0.0875
PSDSSR-PSUSSR 0.0277 *** 0.0539 ***
t-statistic (27.0639) (28.6630)
Panel B: at the individual level
Mean of stocks up since being sold that were repurchased by investor 9.904 8.364
Mean of stocks down since being sold that were repurchased by investor 9.673 9.687
Mean of opportunities to repurchase stocks up since being sold by investor 224.468 94.855
Mean of opportunities to repurchase stocks down since being sold by investor 134.838 68.392
Mean of the proportion of stocks down since being sold that were repurchased
(PSDSSR̅̅ ̅̅ ̅̅ ̅̅ ̅̅ 0.3164 0.4189 Mean of the proportion of stocks up since being sold that were repurchased
(PSUSSR̅̅ ̅̅ ̅̅ ̅̅ ̅̅ ) 0.2106 0.2751
PSDSSR̅̅ ̅̅ ̅̅ ̅̅ ̅̅ − PSUSSR̅̅ ̅̅ ̅̅ ̅̅ ̅̅ ̅ 0.1058 *** 0.1439 ***
t-statistic (82.6477) (77.1315)
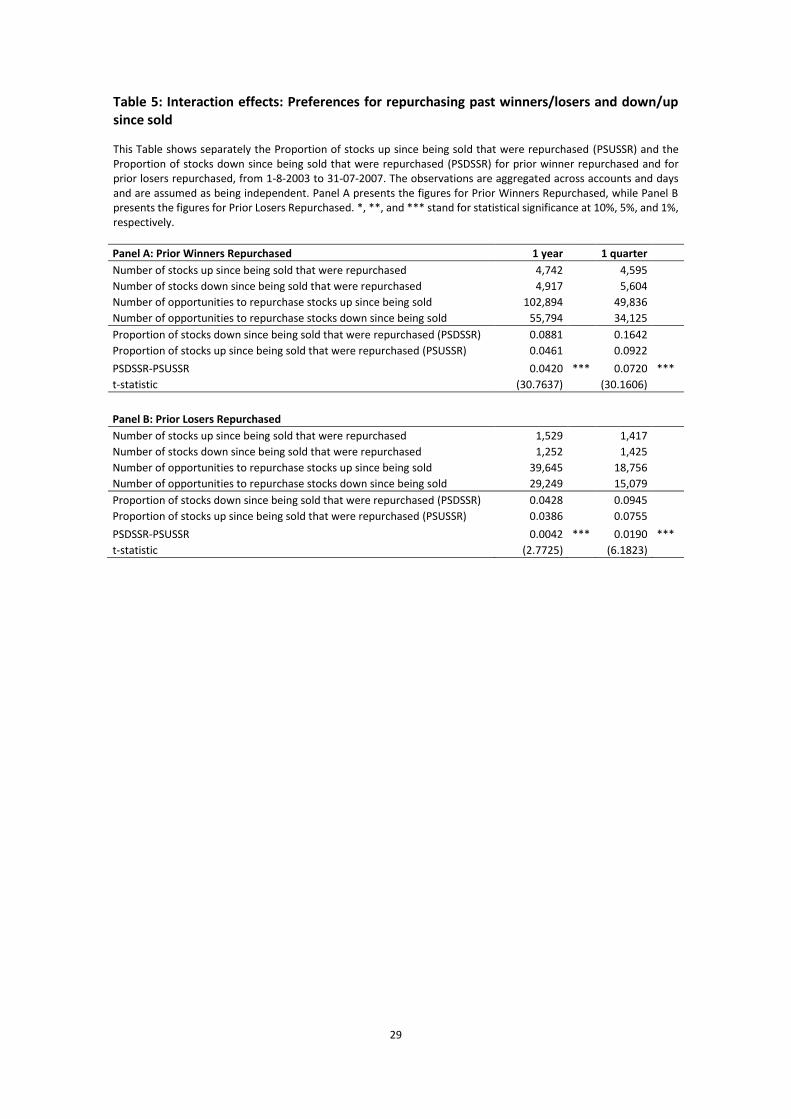
29
Table 5: Interaction effects: Preferences for repurchasing past winners/losers and down/up since sold
This Table shows separately the Proportion of stocks up since being sold that were repurchased (PSUSSR) and the Proportion of stocks down since being sold that were repurchased (PSDSSR) for prior winner repurchased and for prior losers repurchased, from 1-8-2003 to 31-07-2007. The observations are aggregated across accounts and days and are assumed as being independent. Panel A presents the figures for Prior Winners Repurchased, while Panel B presents the figures for Prior Losers Repurchased. *, **, and *** stand for statistical significance at 10%, 5%, and 1%, respectively.
Panel A: Prior Winners Repurchased 1 year 1 quarter
Number of stocks up since being sold that were repurchased 4,742 4,595
Number of stocks down since being sold that were repurchased 4,917 5,604
Number of opportunities to repurchase stocks up since being sold 102,894 49,836
Number of opportunities to repurchase stocks down since being sold 55,794 34,125
Proportion of stocks down since being sold that were repurchased (PSDSSR) 0.0881 0.1642
Proportion of stocks up since being sold that were repurchased (PSUSSR) 0.0461 0.0922
PSDSSR-PSUSSR 0.0420 *** 0.0720 ***
t-statistic (30.7637) (30.1606)
Panel B: Prior Losers Repurchased
Number of stocks up since being sold that were repurchased 1,529 1,417
Number of stocks down since being sold that were repurchased 1,252 1,425
Number of opportunities to repurchase stocks up since being sold 39,645 18,756
Number of opportunities to repurchase stocks down since being sold 29,249 15,079
Proportion of stocks down since being sold that were repurchased (PSDSSR) 0.0428 0.0945
Proportion of stocks up since being sold that were repurchased (PSUSSR) 0.0386 0.0755
PSDSSR-PSUSSR 0.0042 *** 0.0190 ***
t-statistic (2.7725) (6.1823)

30
Table 6: Differences in the preferences regarding repurchasing behavior for groups of investors segmented based on frequency of trading and diversification
This Table shows the difference in proportions, for groups of investors segmented by frequency of trading and diversification from 1-8-2003 to 31-07-2007. Percentiles are calculated after netting all trades for the same investor in the same day. Only investors that make repurchases (650 investors) are considered. An investor makes a repurchase when he buys a stock that he has previously owned and sold in the past 12 months. The percentile 50 in frequency of trading corresponds to 53.5 trades and percentile 75 corresponds to 139.5 trades, while percentile 50 in diversification corresponds to a mean of 2.2 stocks held and percentile 75 corresponds to 4. Both panels show the difference between the Proportion of Prior Winners Repurchased (PPWR) and the Proportion of Prior Losers Repurchased (PPLR) and between the Proportion of stocks up since being sold that were repurchased (PSUSSR) and the Proportion of stocks down since being sold that were repurchased (PSDSSR) for bottom and top groups. Panel A tests the difference in proportions determined based in observations aggregated across accounts and days and assumed to be independent. Panel B presents the same figures determined by investor and tests the difference in means. *, **, and *** stand for statistical significance at 10%, 5%, and 1%, respectively.
Panel A: at the aggregated level (difference in proportions t-test)
Frequency of trading Diversification
Cutoffs: Percentile 50 Percentile 75 Percentile 50 Percentile 75
Differences in the preference for repurchasing past winners/losers:
(PPLR-PPWR)bottom – (PPLR-PPWR)top -0.051*** -0.036*** -0.039*** -0.022***
t-statistic (-2.933) (-6.472) (-7.148) (-8.996)
Differences in the preference for repurchasing stocks that increased/decreased in price after being sold:
(PSDSSR-PSUSSR)bottom – (PSDSSR-PSUSSR)top 0.106*** 0.047*** 0.025*** 0.013***
t-statistic (6.461) (8.055) (4.190) (4.873)
Panel B: at the individual level (difference in means t-test)
Differences in the preference for repurchasing past winners/losers:
(PPLR − PPWR)̅̅ ̅̅ ̅̅ ̅̅ ̅̅ ̅̅ ̅̅ ̅̅ ̅̅ ̅̅ ̅bottom − (PPLR − PPWR)̅̅ ̅̅ ̅̅ ̅̅ ̅̅ ̅̅ ̅̅ ̅̅ ̅̅ ̅̅ ̅
top -0.256*** -0.195*** -0.172*** -0.159***
t-statistic (-7.7669) (-5.0123) (-5.0968) (-4.0622)
Differences in the preference for repurchasing stocks that increased/decreased in price after being sold:
(PPWDSSR − PPWDSSR)̅̅ ̅̅ ̅̅ ̅̅ ̅̅ ̅̅ ̅̅ ̅̅ ̅̅ ̅̅ ̅̅ ̅̅ ̅̅ ̅̅ ̅̅ ̅̅bottom − (PPWDSSR − PPWDSSR)̅̅ ̅̅ ̅̅ ̅̅ ̅̅ ̅̅ ̅̅ ̅̅ ̅̅ ̅̅ ̅̅ ̅̅ ̅̅ ̅̅ ̅̅ ̅̅
top 0.013 0.063** -0.039 0.001
t-statistic (0.378) (1.556) (-1.111) (0.029)

31
Table 7: Determinants of the propensity to repurchase (versus potential repurchases)
This Table reports the results of the probit regressions that estimate the propensity of a repurchase versus potential repurchases. The values in the table are marginal effects. The sample is for
the period from 1-8-2003 to 31-07-2007. The dependent variable is a dummy that equals 1 for repurchase and 0 for potential repurchase. The variables generated by interaction with “Positive”
and “Negative” dummies are reported in absolute values. Independent variables are described in Appendix I. Every equation considers investor dummies. Robust z-stats clustered by stock are
shown in parenthesis. *, **, and *** stand for statistical significance at 10%, 5%, and 1%, respectively.
(1) (2) (3) (4) (5) (6) (7) (8) (9) (10) (11) (12) (13)
Panel A: Past experienced prices anchors
Winner/loser dummy(w=1) 0.014*** 0.009***
(8.44) (8.31)
Up/down dummy(up=1) -0.025*** -0.011***
(-8.76) (-6.16)
Gain/loss(%)*Positive 0.012** 0.017*** 0.018*** 0.017*** 0.017*** 0.017*** 0.016** 0.015** 0.015* 0.015* 0.015*
(2.26) (2.80) (2.93) (2.77) (2.81) (2.79) (2.12) (1.98) (1.91) (1.91) (1.91)
Gain/loss(%)*Negative -0.043*** -0.006 -0.003 -0.003 -0.005 -0.003 -0.036*** -0.032** -0.032** -0.032** -0.032**
(-4.05) (-0.64) (-0.83) (-0.94) (-0.63) (-0.94) (-2.58) (-2.34) (-2.33) (-2.33) (-2.33)
Up/Down(%)*Positive -0.000*** -0.001*** -0.001*** -0.001*** -0.001*** -0.001*** -0.001*** -0.001*** -0.001*** -0.001***
(-3.43) (-6.22) (-6.12) (-6.20) (-5.57) (-5.77) (-4.81) (-4.84) (-4.84) (-4.84)
Up/Down(%)*Negative 0.044*** 0.058*** 0.061*** 0.062*** 0.058*** 0.062*** 0.021** 0.022** 0.022** 0.022**
(6.17) (7.48) (7.66) (8.15) (7.50) (8.14) (2.09) (2.11) (2.11) (2.11)
Log of trading days after the sell -0.020*** -0.021*** -0.021*** -0.021*** -0.021*** -0.021*** -0.021*** -0.019*** -0.019*** -0.019*** -0.019*** -0.019***
(-42.25) (-41.23) (-41.96) (-41.89) (-41.85) (-42.06) (-41.84) (-38.12) (-37.01) (-37.04) (-37.04) (-37.03)
Panel B: Stock characteristics
log of Daily Stock Volume, in euros 0.005*** 0.005*** 0.005*** 0.005*** 0.005*** 0.006*** 0.006*** 0.006*** 0.006*** 0.006***
(12.07) (12.04) (12.89) (11.93) (12.75) (11.51) (11.72) (11.64) (11.64) (11.64)
PSI20 index dummy 0.007*** -0.000
(3.03) (-0.08) PT dummy 0.010*** 0.010** 0.020*** 0.020*** 0.020*** 0.020*** 0.020***
(3.95) (2.40) (6.76) (6.66) (6.64) (6.64) (6.64)
Euro dummy 0.006** 0.005
(2.02) (1.42)
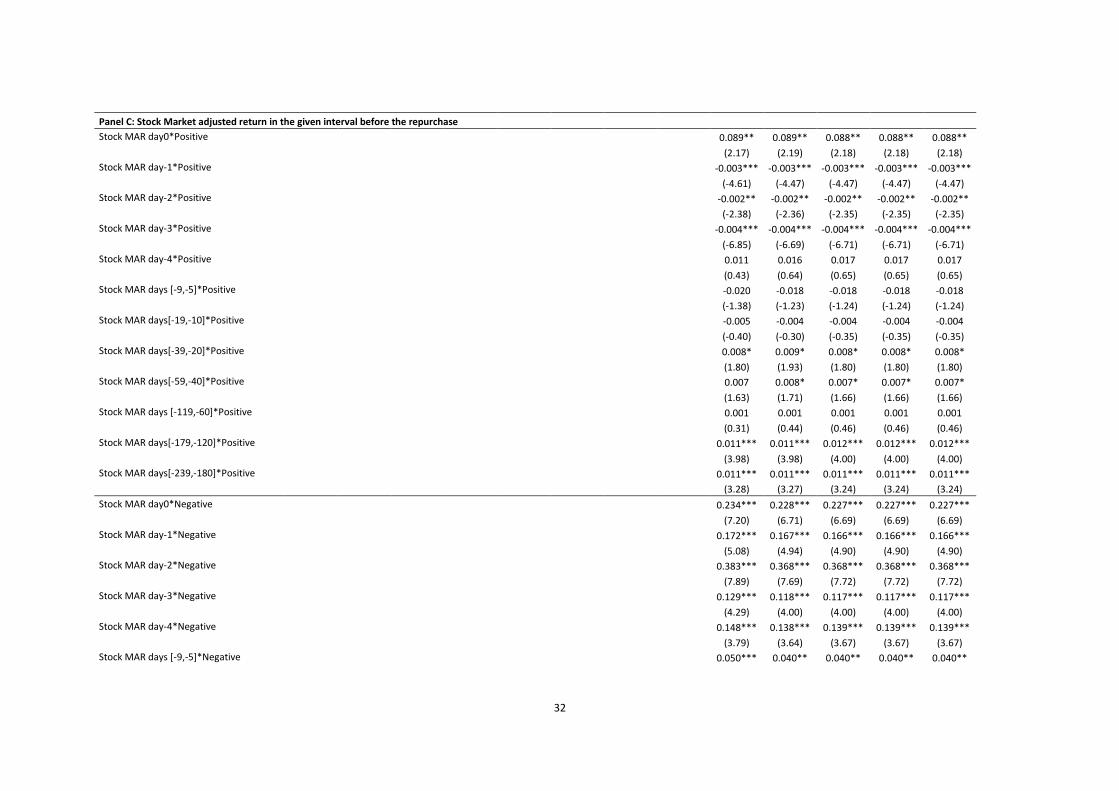
32
Panel C: Stock Market adjusted return in the given interval before the repurchase
Stock MAR day0*Positive 0.089** 0.089** 0.088** 0.088** 0.088**
(2.17) (2.19) (2.18) (2.18) (2.18)
Stock MAR day-1*Positive -0.003*** -0.003*** -0.003*** -0.003*** -0.003***
(-4.61) (-4.47) (-4.47) (-4.47) (-4.47)
Stock MAR day-2*Positive -0.002** -0.002** -0.002** -0.002** -0.002**
(-2.38) (-2.36) (-2.35) (-2.35) (-2.35)
Stock MAR day-3*Positive -0.004*** -0.004*** -0.004*** -0.004*** -0.004***
(-6.85) (-6.69) (-6.71) (-6.71) (-6.71)
Stock MAR day-4*Positive 0.011 0.016 0.017 0.017 0.017
(0.43) (0.64) (0.65) (0.65) (0.65)
Stock MAR days [-9,-5]*Positive -0.020 -0.018 -0.018 -0.018 -0.018
(-1.38) (-1.23) (-1.24) (-1.24) (-1.24)
Stock MAR days[-19,-10]*Positive -0.005 -0.004 -0.004 -0.004 -0.004
(-0.40) (-0.30) (-0.35) (-0.35) (-0.35)
Stock MAR days[-39,-20]*Positive 0.008* 0.009* 0.008* 0.008* 0.008*
(1.80) (1.93) (1.80) (1.80) (1.80)
Stock MAR days[-59,-40]*Positive 0.007 0.008* 0.007* 0.007* 0.007*
(1.63) (1.71) (1.66) (1.66) (1.66)
Stock MAR days [-119,-60]*Positive 0.001 0.001 0.001 0.001 0.001
(0.31) (0.44) (0.46) (0.46) (0.46)
Stock MAR days[-179,-120]*Positive 0.011*** 0.011*** 0.012*** 0.012*** 0.012***
(3.98) (3.98) (4.00) (4.00) (4.00)
Stock MAR days[-239,-180]*Positive 0.011*** 0.011*** 0.011*** 0.011*** 0.011***
(3.28) (3.27) (3.24) (3.24) (3.24)
Stock MAR day0*Negative 0.234*** 0.228*** 0.227*** 0.227*** 0.227***
(7.20) (6.71) (6.69) (6.69) (6.69)
Stock MAR day-1*Negative 0.172*** 0.167*** 0.166*** 0.166*** 0.166***
(5.08) (4.94) (4.90) (4.90) (4.90)
Stock MAR day-2*Negative 0.383*** 0.368*** 0.368*** 0.368*** 0.368***
(7.89) (7.69) (7.72) (7.72) (7.72)
Stock MAR day-3*Negative 0.129*** 0.118*** 0.117*** 0.117*** 0.117***
(4.29) (4.00) (4.00) (4.00) (4.00)
Stock MAR day-4*Negative 0.148*** 0.138*** 0.139*** 0.139*** 0.139***
(3.79) (3.64) (3.67) (3.67) (3.67)
Stock MAR days [-9,-5]*Negative 0.050*** 0.040** 0.040** 0.040** 0.040**

33
(3.20) (2.46) (2.44) (2.44) (2.44)
Stock MAR days[-19,-10]*Negative 0.032*** 0.024** 0.024** 0.024** 0.024**
(2.70) (2.02) (2.03) (2.03) (2.03)
Stock MAR days[-39,-20]*Negative 0.026*** 0.021*** 0.021*** 0.021*** 0.021***
(3.13) (2.60) (2.64) (2.64) (2.64)
Stock MAR days[-59,-40]*Negative 0.024*** 0.021** 0.021** 0.021** 0.021**
(2.72) (2.42) (2.41) (2.41) (2.41)
Stock MAR days[-119,-60]*Negative 0.008 0.006 0.006 0.006 0.006
(1.31) (0.98) (0.99) (0.99) (0.99)
Stock MAR days[-179,-120]*Negative 0.007 0.006 0.006 0.006 0.006
(0.89) (0.74) (0.81) (0.81) (0.80)
Stock MAR days[-239,-180]*Negative 0.008 0.006 0.007 0.007 0.007
(0.92) (0.74) (0.79) (0.79) (0.79)
Panel D: Investor account characteristics
Log of total trading -0.154*** -0.158*** -0.158*** -0.229***
(-10.40) (-10.73) (-10.72) (-13.91)
Daily Diversification Index 0.020*** 0.020*** 0.020***
(5.09) (5.09) (5.09)
Mean of Inv. Daily MAR*Positive 0.094*** 0.074***
(5.01) (4.99)
Mean of Inv. Daily MAR*Negative 0.077*** 0.043**
(3.77) (2.49)
Log of the mean of stock account -0.007
value (-0.54)
Log of the mean of total account 0.014
value (0.91)
Investor dummies yes yes yes yes yes yes yes yes yes yes yes yes yes
Standard errors clustered by stock yes yes yes yes yes yes yes yes yes yes yes yes yes
Observations 251,193 251,193 251,193 240,255 240,255 240,255 240,255 240,255 192,005 192,005 192,005 192,005 192,003
Pseudo R-squared 0.0952 0.192 0.190 0.198 0.199 0.199 0.198 0.199 0.212 0.213 0.214 0.214 0.214
Actual Prob. 0.0525 0.0525 0.0525 0.0544 0.0544 0.0544 0.0544 0.0544 0.0568 0.0568 0.0568 0.0568 0.0568