Embed Size (px)
Citation preview

Individual, home and neighborhood factors related to a childhood obesity intervention.
Fabiana Brito Silva
Dissertation submitted to the faculty of the Virginia Polytechnic Institute and State University in
partial fulfillment of the requirements for the degree of
Doctor of Philosophy
In
Human Nutrition, Foods, and Exercise
Committee:
Paul Estabrooks (chair)
Jennie Hill
Wen You
Korine Kolivras
Jamie Zoellner
Blacksburg, VA
Thursday, April 28 2016
Keywords: childhood obesity, clear communication, home environment, neighborhood
environment, intervention

Individual, home and neighborhood factors related to a childhood obesity intervention.
Fabiana Brito Silva
ABSTRACT
Obesity is one of the most pressing global population health issues, and importantly one
that affects racial/ethnic minorities and those of low socioeconomic status disproportionately.
Obesity tracks from childhood into adulthood and is related to serious medical and economic
consequences throughout the life course. Childhood obesity is well recognized as a complex and
multifaceted problem influenced by broader social, geographic and environmental factors. A
social ecological framework that is transdisciplinary is needed to address individual-level
influences and choices that lead to energy imbalance, but also to address the complex
interactions among home and neighborhood environmental features that provide the context for
health-related behavior change. The overall goal of this dissertation is to investigate multilevel
factors that could influence outcomes of an intervention program aimed at addressing childhood
obesity. Including studies that investigated the use of clear communication strategies to facilitate
parents’ comprehension, home media environment related to change in children weight status
and the neighborhood environmental context of families. This dissertation draws upon a social
ecological model that acknowledges multiple levels of human interaction with the environment
and represents a comprehensive approach to designing, implementing and evaluating
interventions that which target multiple influences on health behaviors. The iChoose is a 3-
month family-based childhood obesity treatment program developed under a community-based
participatory research approach led by the Partnering for Obesity Planning and Sustainability
(POPS) Community Advisory Board (CAB). The studies within this dissertation use clear
communication evaluation and qualitative feedback from focus groups, intervention outcome
data and home environmental surveys, as well as environmental audits of neighborhoods. To
investigate multilevel factors could influence intervention outcomes, we used both multiple
statistical analytical techniques and a Geographic Information System (GIS) spatial analysis to
evaluate the iChoose program

iii
TABLE OF CONTENTS
ACKNOWLEDGMENTS ........................................................................................................... iv
INTRODUCTION......................................................................................................................... 1
MANUSCRIPT 1: A participatory process to develop intervention materials using clear
communication strategies: The iChoose experience. ................................................................. 6
Introduction ................................................................................................................................. 6
Methods ....................................................................................................................................... 9
Results ....................................................................................................................................... 19
Discussion ................................................................................................................................. 23
Conclusion ................................................................................................................................. 26
MANUSCRIPT 2: Home media environment factors and change in child BMI in a family-
based childhood obesity .............................................................................................................. 32
Introduction ............................................................................................................................... 32
Methods ..................................................................................................................................... 35
Results ....................................................................................................................................... 41
Discussion ................................................................................................................................. 46
Conclusions ............................................................................................................................... 48
MANUSCRIPT 3: The neighborhood environment in the context of a childhood obesity
treatment intervention. ............................................................................................................... 50
Introduction ............................................................................................................................... 50
Methods ..................................................................................................................................... 52
Results ....................................................................................................................................... 59
Discussion ................................................................................................................................. 71
Conclusion ................................................................................................................................. 74
GENERAL CONCLUSIONS .................................................................................................... 76
REFERENCES ............................................................................................................................ 81
APPENDIX A: Institutional Review Board (IRB) Letter of Approval ................................. 89
APPENDIX B: Study’s Logic Model - Social Ecological Perspective .................................... 90
APPENDIX C: Focus Group Protocol and Semi-structure Script ........................................ 91
APPENDIX D: iChoose program’s Parent Home Environment Survey ............................. 101

iv
ACKNOWLEDGMENTS
I would like to thank my advisor Dr. Paul A. Estabrooks for his guidance and assistance
with all my projects and showing me endless possibilities in research and how to critically think
and apply knowledge in different areas. Thank you for the willingness to fund my time in
graduate school and your patience with my “Brazinglish”. I have gained much knowledge and
skills working with you. I would like to acknowledge my committee members, Drs. Jennie Hill,
Wen You, Korine Kolivras and Jamie Zoellner, for your amazing input and support throughout
this experience. I look forward to an exciting career and hope to follow in your footsteps.
I would like to express my appreciation to my family, especially to my beloved husband
Fabio Almeida. Our love brought me to the US and made this experience possible. You have
supported my career in all ways and encouraged me to take on each challenge while maintaining
my sanity. Thank you for being an inspiration for me to persist! I am also indebted to my family
in Brazil for their continued love and support, and for understanding my absence during this
period. A special thank you to my mom, Genilda de Almeida Brito (Nil), for inspiring me to
pursue my dreams. Thanks for the unconditional love and sacrifices you made for me. “Muito
mais do que mãe você é minha amiga. Obrigada por todos os momentos dedicados a mim, pelas
palavras, pelos conselhos, pelo amor, pela honestidade, pelo afeto, pela amizade. Saiba que
mesmo distante nunca deixarei de amar você”.
This acknowledgement would not be complete without a thank you to my POPS’
companions, in special Xiaolu, Ramine and Donna – you have each become dear friends and
taught me many things about life. I will miss our trips to Danville, we worked hard, but also had
a great time together. Finally, I would like to thank our community partners from the Dan River
Region and all of the study’s families without whom, this research would not be possible.

1
INTRODUCTION
Obesity is one of the most pressing global population health issues, and importantly one
that affects racial/ethnic minorities and those of low socioeconomic status disproportionately.
There is little doubt that environmental and social influences are important contributors to the
rapid rise in childhood obesity over the past few decades [1, 2]. Specifically, childhood obesity is
well recognized as a complex and multifaceted problem [3, 4] influenced by broader social,
geographic and environment factors. The challenge ahead is to identify obesogenic factors and
modify them so that healthier choices are clear communicated [5] “more available, easier to
access, and widely promoted to a large proportion of the community” [3]. A social ecological
framework that is transdisciplinary is needed to address individual-level influences, such as the
quality of writing materials that could interfere with participants ability to understand an
intervention’s main messages [5] to improve choices that lead to energy imbalance [6], as well as
the complex interactions among home and neighborhood environmental features that provide the
context for health-related behavior change [4].
Health literacy is important for public health [7] since it represents “the ability to obtain,
understand, communicate, and use information” [8]. However, 36% of adults in the USA have
limited HL [9] which disproportionately affects rural and low-income populations [10, 11].
There are a number of efficacious childhood obesity interventions, however few have been taken
to scale and there is concern that the written materials used in efficacy studies with select
populations may be too difficult for the intended audiences [9]. Thus, especially for these high-
risk communities, it is critical for obesity interventions to be culturally relevant and tailored to
the needs of the target population in order to improve health outcomes and reduce disparities
[12]. Tailoring health education materials may be an important tool for education in minority

2
groups and could be used as a strategy to bring individualization and personalization of health
messages to members of specific groups [13]. While a number of extensive resources and
toolkits exist to improve individual and institutional health literacy, there is an absence in the
current literature related to incorporating clear communication strategies when adapting
evidence-based interventions for new populations. Clear Communication strategies proposes to
use a comprehensive set of multiple methods of communication theories and models to guide
development, implementation and assessment of messages and written materials to make them
easier for people to read, understand, and use [14].
Effectively engaging community and research organizations in community-based
participatory research (CBPR) that reviews, adapts, implements, and evaluates interventions can
aid the translation of evidence-based interventions into community practice [6]. In this context,
the Dan River Partnership for a Healthy Community (DRPHC), a community-academic
partnership operating using CBPR principles in the health disparate DRR [15, 16], organized the
Partnering for Obesity Planning and Sustainability Community Advisory Board (POPS-CAB).
The POPS-CAB, over a 3-year period, identified an evidence and family-based childhood
obesity treatment program, Bright Bodies [17] and adapted the content and structure guided by
clear communication strategies [5, 18, 19] in an iterative systematic formative evaluation process
for local delivery in the form of a program called iChoose. The program included a number of
strategies including preparation of a healthy plate, family-based physical activity, goal setting
and feedback, and acknowledging the social ecology of behavior change - including strategies to
change the home environment by increasing opportunities for physical activity and healthful
eating. iChoose was then pilot tested with 3 waves of families (n=101) and demonstrated, on
average, a significant reduction in the weight status of participating children [20]. Even once an

3
evidence-based intervention is adapted for local implementation with a goal of sustained delivery
[6], there still appears to be wide variability among child outcomes with some losing weight,
some maintaining weight, and some gaining weight. This suggests that contextual factors related
to home and community environments may exert different influences on families that are
engaged in a childhood obesity program. The Social Ecological Model (SEM) describes
behavior as the outcome of the interaction between an individual and his/her environment [21]
and represents a comprehensive approach to designing, implementing and evaluating
interventions that target multiple influences on behaviors [22]. From a social ecological
perspective, the variability in child weight in response to family-based childhood obesity
programs may be due to home and neighborhood environment differences [2].
In fact, numerous studies have consistently demonstrated that environmental factors are
associated with physical activity, healthful eating, and childhood obesity [2]. For instance,
children from neighborhoods with better nutrition and physical activity environments were less
likely to be obese than children from neighborhoods low on both measures. Additionally, home
environmental factors such as availability and accessibility to healthful food items and physical
activity opportunities as well as parenting strategies have been related to reduced childhood
obesity [23]. However, there is little evidence that interventions targeting family lifestyle
changes can either enhance or disrupt the relationships between environments factors, physical
activity, eating, and weight management. In addition, it is unclear the degree to which home and
neighborhood factors may inhibit or support positive outcomes from childhood obesity
interventions, and predict changes in physical activity, nutrition, and weight [24]. Therefore,
there is a need to better understand the environmental context within which childhood obesity
treatment interventions are implemented [24, 25]. The purpose of this study is to determine if a

4
childhood obesity intervention that targets home environmental changes can disrupt the
relationship between the neighborhood environment and child physical activity, eating, and
weight.
Accordingly, the overall goal of this dissertation is to investigate multilevel factors that
could influence outcomes of an intervention program. Including studies of the use of clear
communication strategies to facilitate parents’ comprehension, home media environment related
to change in children weight status and the neighborhood environmental context of families. This
dissertation draws upon a social ecological model that acknowledges multiple levels of human
interaction with the environment and represents a comprehensive approach to designing,
implementing and evaluating interventions that target multiple influences on health behaviors.
The studies used clear communication evaluation and qualitative feedback from focus groups,
intervention outcome data and home environmental surveys, as well as environmental audits
collected from previous studies. To investigate multilevel factors that could influence
intervention outcomes, we used both multiple statistical analytical techniques and a spatial
analysis using a Geographic Information System (GIS).
The first study describes the development of a culturally relevant childhood obesity
workbook for parents of overweight children. The analysis used clear communication strategies
to address key learning objectives in order to fill the gap in the literature on processes to evaluate
and improve written intervention materials for an adapted evidence-based childhood obesity
intervention. The mixed methods process evaluation was used to develop and conduct a
formative evaluation of the iChoose workbook using a community-based participatory research
approach. Results describe the iterative and systematic approach to conduct a formative
evaluation of materials clear communication. Results of the remaining studies help explain the
5
variance in children’s changes in outcomes by testing interactions among multiple levels of
home and neighborhood environments with a contextual analysis. Specifically, the second study
explored short-term (post intervention) change in home media environment (HME) factors and
their association with change in BMI z-scores in children participating in a family-based
childhood obesity treatment intervention. We hypothesized that home media environment would
change after intervention and that those changes would correlate with a change in BMI z-scores.
In the third study, existing neighborhood environment audit data were used to examine
neighborhood environmental factors related to intervention reach including representativeness of
enrolled and not enrolled families and delivery location influences; and nutrition and physical
activity neighborhood environment (NE) factors as they relate to changes in eating, physical
activity, and weight status of children that participated in the iChoose program.
The three studies undertake different aspects of a multilevel social ecological perspective
that strives to be transdisciplinary, involving knowledge from different fields with an intention to
achieve intellectual integration that extends the concepts, theories, and methods [26] . Our main
goal was to advance framing obesity as a complex public health issue and provide data to further
reduce childhood obesity [3]. The knowledge gained with these studies can help fill the gap on
effective strategies to prevent and curb the growing childhood obesity epidemic in health
disparate areas [27].

6
MANUSCRIPT 1: A participatory process to develop intervention materials using clear
communication strategies: The iChoose experience.
INTRODUCTION
Health literacy among the general public has become progressively more important for
public health since many aspects of healthcare depend on understanding written information and
verbal instruction [7]. Health literacy includes addressing individual skill development as well as
providing the delivery of actionable information that is easily understood in a manner
appropriate to the audience [28]. A literature review demonstrated that health literary is a
stronger predictor of health outcomes than social-economic status, education, gender, and age
[29]. Therefore, providing Americans with clear information about health promotion and disease
prevention is a national priority [28]. However, over 90 million people have low literacy skills
[30] in that they have difficulties understanding and applying health information.
A number of activities have been developed to address patients with lower health literacy
across a variety of health sectors [18, 19]. In particular, initiatives such as the National Action
Plan to Improve Health Literacy [28], the federal Plain Writing Act [19], and the National
Institutes of Health’s (NIH) “Clear Communication” initiative [31] have all focused on
incorporating plain language approaches to provide information that is accessible based on the
audience’s cultural competence. The goal is to develop clear and effective written materials—
those that attract and hold the readers’ attention, make them feel respected and understood, and
motivate action [18]. Supported by those initiatives, a number of tools were created to guide the
development and evaluation of written materials for programs and interventions. Tools such as
the Toolkit for Making Written Material Clear and Effective [18] and Clear Communication

7
Index Score [32] are both examples that, despite being highly recommended [33, 34], are rarely
used in the research context to inform health promotion intervention materials.
The foundation of clear communication strategies to help produce “low barrier” material
health information includes the Centers for Disease Control and Prevention’s (CDC) “3 A’s
principles” (Accurate, Accessible, and Actionable), plain language, and a reader-centered
approach [18]. Plain language, as the name suggest, simplifies information without sacrificing
the content or compromising the meaning. This approach gives special attention to graphic
design and issues of cultural appropriateness thereby making materials appealing to readers at all
literacy levels. A reader-centered approach strives to understand the intended audiences by
taking the reader’s perspective in identifying possible barriers within written material.
Most clear communication guidelines derived from the social marketing framework and
seek to improve communication of health messages [14]. This framework proposes tailoring
messages fulfilling the interests of a defined group of both those who would benefit from a
behavior change and those who want to promote the desired behavior [35]. In this sense,
messages are implemented as a systematic, continuous process driven by decision-based research
in which feedback is used to adjust the message to ensure that all efforts are integrated and
consistent to support the intervention’s goals and objectives [36]. From a social marketing
research perspective, it is necessary to improve current and future communication evaluations to
base conclusions about success or failure of strategies used to inform and influence individual
and community decisions that enhance health [14].
Cultural assessment, relevance, and clear communication may be especially important in
the area of promoting healthful eating, physical activity, and weight control [12]. Lower HL is
associated with difficulty assessing how weight can affect health [37], and difficulty

8
understanding food labels [38], portion sizes [39], and growth charts [40]. Not surprisingly, both
low HL[10, 11] and childhood obesity [10, 11] disproportionately affect rural and low-income
populations, and obesity risk is increased in children whose parents have low HL [41-44].
Family-based treatment interventions have been developed to address childhood obesity [17, 45-
48] and, while all include written materials [49], there is limited evidence that those materials
have been adapted and or developed using clear communication strategies. Further, written
materials used in efficacy studies with select populations may be less clear for the intended
audiences [9]. Clear communication strategies that address lower health literacy can enhance the
uptake of information and skills, and be integrated into childhood obesity treatment programs;
however, the lack of clearly reporting these strategies highlights the potential low
generalizability of written materials used in efficacy trials. It is critical to determine the degree to
which written materials clearly and effectively communicate information when adapting
evidence-based childhood obesity interventions for families in health disparate communities.
Involving groups to develop and evaluate materials is a strategy to improve clear
communication. Those groups need to include members that reflect a broad range of expertise,
skills, and interests, and are familiar with cultural and linguistic patterns of the intended readers
[18]. In this context, effectively engaging community and research organizations in community-
based participatory research (CBPR) may be helpful. CBPR approaches that include the targeted
community in the review, adaptation, implementation and evaluation of interventions could
improve health communication and use of culturally appropriate materials [6, 50]. One benefit of
a CBPR approach is that it allows team members that interact with patients/participants on a
regular basis, and would ultimately deliver intervention content, to provide feedback on
communication styles that may be more or less effective within the target population. Finally,

9
obtaining feedback from members of the target population is an essential component in the
process to ensure participant-level relevance of the written materials [18].
This study used a community-academic partnership to adapt written materials for a
childhood obesity treatment program using clear communication strategies. This paper (1)
describes the development of a culturally relevant childhood obesity workbook for parents of
overweight children that used clear communication strategies to address key learning objectives
and (2) fills the gap in the literature on processes to evaluate and improve written intervention
materials for evidence-based childhood obesity interventions. Both the development and
assessment followed a mixed methods iterative and systematic formative evaluation to access
clear communication using a CBPR approach. Results describe readability tests and community-
academic materials’ evaluation using the CDC’s clear communication index (CCI) [32] and
suitability assessment of materials (SAM) [51]. As well, results from the intendent audience
testing and perceptions collected via parents’ surveys and focus groups, and delivery staff
feedback from classroom workbook’s use. We hypothesized that an iterative process that
included the engagement of program participants and community staff in the development,
evaluation, and revision of a program workbook would result in materials that were consistent
with local culture and clear communication strategies.
METHODS
The Setting and Intervention Description
The Dan River Region (DRR), where this project took place, is a predominantly rural,
health disparate and federally designated medically under-served area [52, 53] located in south-
central Virginia and north-central North Carolina. The region currently has some of the lowest
health literacy and highest rates of childhood obesity in the country [54]. In 2009, the Dan River

10
Partnership for a Healthy Community (DRPHC) was formed as a community-academic
partnership to address these concerns. The DRPHC operates using CBPR principles with a
primary mission to address obesity in the region [55]. Under the larger DRPHC umbrella,
clinical and community partners serving children in the region formed the Partnering for Obesity
Planning and Sustainability (POPS)-CAB to develop programming specifically to treat childhood
obesity [56]. The POPS-CAB, collaboratively identified an evidence and family-based childhood
obesity treatment program, Bright Bodies [17], and adapted the content and structure for local
delivery in the form of a program – the iChoose program.
iChoose is a 3-month family-based program that includes the following components: (1)
120 minute family sessions that would occur every other Saturday over the 12-week program,
broken into a nutrition lesson, exercise time, and behavioral skills training (2) 20-25 minute
telephone support calls to set goals, resolve barriers, and reinforce content using the 5 A’s, teach-
back and teach-to-goal strategies on weeks between family sessions, (3) two 60 minute exercise
sessions per week, (4) workbooks for the parent and the child based on clear communication
strategies, and (5) child newsletters that reinforced content and provided fun activities.
Participatory Approach
We used a CBPR approach to engage community and research organizations to review,
adapt, implement, and evaluate [6] written materials used in the intervention. This participatory
approach has been shown to reduce health disparities and enhance study relevance, validity,
effectiveness, cultural sensitivity, and translation into practice [57-60]. Additionally, the CBPR
process allows for the combination of unique knowledge and resources from community and
research partners to be applied synergistically towards shared goals to improve health outcomes
and reduce inequalities. The POPS community advisory board (CAB) was composed by an

11
academic research team and community partners from the Dan River Region. The academic
interdisciplinary research team is from the Fralin Translational Obesity Research Center (TOR)
at Virginia Tech. The community and clinic community partners are from the
Pittsylvania/Danville Health District (PDHD), Children’s Healthcare Center (CHC), Danville
Parks Recreation & Tourism, and Boys & Girls Club. The CBPR approach also aligned to an
important strategy to improve clear communication – the team approach [18]. The team approach
included members from the community, engaged delivery staff, parents from the intended
audience, and researchers.
Development and Evaluation Process of iChoose Workbooks.
One objective of the POPS-CAB was to create materials that would be relevant to local
families. Thus, we designed a mixed methods approach that would engage the POPS-CAB and
end-users of the workbook in a process to review and adapt materials. Accordingly, we
conducted a formative evaluation of the iChoose workbook using CBPR in a reader-centered
approach. Our systematic process included a multi-step process for each module to ensure that
materials were appropriate for a low health literate audience (Figure1).

12
Figure 1. Development of workbook content using clear communication strategies.
The overall research design for the development and evaluation of the iChoose
workbook was a participatory and iterative mixed method design. The mixed method data
collection was used to strengthen the validity of the conclusions reached by the study [61]. We
included triangulation of quantitative (CCI, SAM, readability tests and surveys) and qualitative
(interviews, classroom feedback and focus groups) methods from different sources (i.e.
community and academic partners, delivery staff, and parents) to increase the validity of the
findings. This triangulation is considered a useful means of capturing more detail, minimizing
the effects of bias, and ensuring a balanced interpretation of available data [62]. Thus, both
participatory research and formative evaluation approaches [50] were designed to involve the
POPS-CAB members and program participants, in multiple components [63] of the process,
including oversight of data collection, analyses, and dissemination of results. The intent was not
only to develop an evidence-based workbook but also incorporate health literacy best practice to
achieve a clear and effective communication for the target population. This case study occurred
over a period of 3 years and is part of a larger iterative project (NIMHD-R24MD008005). The
Institutional Review Board (IRB) at Virginia Tech approved this study, and all participants gave
written informed consent prior to participation.
Adaptation and Development
After the intervention selection process by the POPS-CAB members, community partners
identified that the written materials from the selected intervention (Bright Bodies) needed
adaptations to better fit their community profile, including more culturally relevant content and
images as well as the need to address different levels of health literacy. As the Bright Bodies
materials were under a copyright and could not be modified, the POPS-CAB identified the core

13
intervention objectives from the literature and used them to develop a parent workbook to
accompany the program. The POPS-CAB established a curriculum subcommittee (CS),
composed of both researchers and community partners, to develop the workbook, based on those
objectives, from evidence-based content review. Six chapters were created (Table 1), one for
each intervention module. Themes for the intervention modules were reviewed and incorporated
as individual chapters in the workbook. Following the family class format, the chapters were
divided into components of Nutrition, Physical Activity (PA), and Behavioral Strategies. Each of
the six chapters included the module objectives, educational content, a class activity, and
homework. The subcommittee presented a first version of the workbook to the POPS/CAB to
approve and/or make suggestions and followed this with two rounds of evaluation (Figure 1).
Tools for Workbook Evaluation
A readability evaluation of the workbook content was performed to assure that the
reading level was adequate to the proposed target population. The workbook writing aimed a 5th
grade reading level. To evaluate the reading level, we used five different measures of readability:
the Simple Measure of Gobbledygook (SMOG), the FRY method, Flesch-Kincaid Reading Level
(FKRL), Flesh Reading Ease Score (FRES), and the Coleman-Liau Grade Level. All the
measures were applied in a plain document, which means no pictures or tables were included in
the calculations. We decided to use different measures for readability since each one focused on
a different aspect of the text (e.g. word and/or syllable count, sentence lentgh). The SMOG is
considered the gold standard for measuring readability [64] with a formula that accounts for
polysyllable count to estimate the years of education a person needs in order to understand a
piece of writing [65]. It is widely used, particularly for checking health messages [66]. In the
FRY method [67], instead of using calculation formulas, the intersection of the average number

14
of sentences and the average number of syllables are plotted onto a graph where the results
determine the reading level of the content. The Fry graph is often used to provide a common
standard by which the readability of documents can be measured [68]. Both FKRL Index
formula and FRES take into account the sentence length, despite having different formulas,
where the “best text” should contain shorter sentences and words. In the FKRL, the result is a
number that corresponds with a grade level. In the FKES to draw a conclusion from the results,
the following scores are used: 90-100 very easy; 80-89 easy; 70-79 fairly easy; 60-69 standard;
50-59 fairly difficult, 30-49 difficult, 0-29 very confusing. FKLES Scores between 60 and 70 are
largely considered acceptable. The U.S Army uses the FKRL and the US Department of
Deffense uses the FKES for assessing the difficulty of technical manuals. Finally, while the other
readability tests use the number of syllables, the Coleman-Liau Grade Index (CLI) uses the
number of characters in words.
Since readability scores do not provide information on reading ease, prominence of main
messages, behavioral strategies to initiate action, or cultural relevance, they can be misleading
when determining the likelihood that the materials clearly and effectively deliver information.
Therefore, in addition to the readability tests the POPS-CAB performed a more comprehensive
assessment of written materials that explicitly address the degree to which information is clearly
communicated to intervention participants. After a literature review, we decided to use both the
Clear Communication Index (CCI) and the Suitability Assessment of Materials (SAM). Both the
CCI and SAM evaluation was conducted by the POPS/CAB members (n=14).
The Clear Communication Index (CCI) was developed using a comprehensive set of
multiple methods of communication theories and models to guide development, implementation
and assessment of messages and written materials to make them easier for people to read,

15
understand, and use. The CCI is a research-based tool to plan and assess public communication
materials [32]. The CCI is formed by items that represent the most important characteristics to
enhance clarity and aid people’s understanding of information drawn from the scientific
literature in communication and related disciplines. The Index supports the efforts of the CDC to
comply with the Plain Writing Act of 2010 and achieve goals set forth in the National Action
Plan to Improve Health Literacy and the CDC Action Plan to Improve Health Literacy [69].
Based on 20 items the CCI provides a numerical score on a scale of 100 to objectively assess
materials. The CCI assesses materials in seven key areas divided into four parts. Part A includes
the main message and call to action, language, information design and state of the science. Part B
evaluates the clarity of behavioral recommendations. Part C focuses on the use of numbers and
clarity of expressing numbers while Part D focuses on providing a clear description of associated
risks of taking or not taking a certain action. Not all parts of the CCI are applicable to all written
materials and depend on the presence or absence of information on behavioral goals, the use of
numbers, or if risk factors are presented in the materials. The scores from each part were tallied
to obtain an overall score (out of 100%), with a recommended standard of 90 or above to make
materials easy to understand and use [69].
The CCI does not include an assessment of cultural appropriateness so the Suitability
Assessment of Materials (SAM) tool was also used [51]. The SAM enables reviewers to consider
6 categories: content, literacy demand, graphics, layout and typography, learning stimulation,
and cultural appropriateness. The SAM’s score falls into one of three categories: superior,
adequate or not suitable. SAM has been widely used by many researchers [70-72] that attest to
its validity and reliability. The SAM identifies specific shortcomings that reduce the overall
suitability of materials for a particular audience, and were used in some studies to select patient

16
nutrition education materials [73] and evaluate childhood obesity intervention materials [49]. As
the SAM is redundant, in some areas, to other assessment tools used in this study, we used only
the SAM items related to cultural appropriateness, cultural images and examples, and strength of
recommendation, which were not covered by the CCI.
Training and Procedures for Workbook Evaluation and Refinement
POPS-CAB members (n=16) completed training on the CCI and SAM evaluations. A
daylong training was offered by a CDC expert and developer of the CCI instrument via
videoconferencing, and a SAM presentation hosted by academic partners targeted local capacity
development and shared learning between the partners. Trained POPS/CAB members (n=14)
were subsequently randomly assigned to conduct the evaluation individually on specific chapters
of the workbook (2 to 3 members per chapter). Six small groups composed of members of the
research team (n=7) and community partners (n=7) that had individually assessed the respective
chapters reconciled and consolidated their individual CCI ratings into a shared rating. During
these small group sessions, POPS-CAB members used the materials to resolve differences in
ratings. Across all groups, consensus on rating was achieved and used as the CCI value for the
given chapters. Individual and reconciled ratings were summarized and “within subjects” t-tests
were used to determine differences in individual overall CCI and SAM ratings and across the
CCI evaluation areas (Parts). Parts A and B were applied to all chapters. Part C was pertinent to
chapters 1 to 3 and Part D wasn’t pertinent to the material evaluated in this study. Though the
sample size of stakeholders was small, we also compared community and academic partner
ratings to determine if differences emerged in ratings.
Intended Audience Testing

17
The workbook versions were pilot tested in the first and second wave of iChoose program
implementation. On the first wave, we tested the workbook before revisions. On the second
wave, we tested the workbook after revisions based on material evaluation and perceptions. The
parents/caregivers that participated in the interventions’ waves 1 and 2 had an average age of 40
years (SD = 8.5 years), were predominantly female (95%), and nearly half had income less than
$25K (46%) and most had at least a high school education (91%). Additionally, the participants
completed the Newest Vital Sign (NVS) to assess health literacy and numeracy. The NVS
consists of a nutrition label with 6 accompanying questions meant to assess literacy and
numeracy skills ranging from parents of young children to older adults, among racial/ethnic
minorities [74]. It is reliable, has been validated [74] and demonstrated high sensitivity and
moderate specificity for detecting limited literacy [75]. NVS results in our sample indicated that
approximately 36% of the parent/caregivers had limited HL.
Summative evaluation interviews (n=38) and focus groups (FG; n=11) were used to
gather parent feedback on the workbook. Trained research personnel conducted both activities.
The summative evaluation was completed with all parents that completed a post program
assessment and included questions about satisfaction (e.g. “How satisfied were you with the
parent workbook?), and usability (e.g. “How often did you use the workbook outside of the
family class?”). For the FG, the curriculum subcommittee developed a script with CCI-based
questions to guide the discussions for each workbook chapter following their objectives (e.g.
“How well do you think these messages were explained in the workbook?”, “What things in the
workbook helped you to better understand these messages?”). Five to 10 participants were
considered necessary to complete the FG activities [76-78] and 11 of 14 invited parents agreed to
participate. To accommodate participant schedules, we conducted two small focus groups and

18
offered childcare. FGs were audio-taped and transcribed verbatim to provide information on
areas that contributed to potential workbook adaptations.
During the intervention period, fidelity check-lists were also completed for each family
class and included opportunities for staff to provide comments about how the workbook was
used and if there were adaptations suggested. We selected all comments (open ended) related to
the workbook from the fidelity check-lists across 2 waves of intervention delivery.
Revisions
Following the CCI evaluation, the curriculum subcommittee went through the FG
transcripts and field notes, delivery staff qualitative feedback, and CCI open ended questions,
selecting quotes that indicate proposed changes. The findings were then summarized as a
“proposed revision list” for each workbook chapter and chapter section. The curriculum
subcommittee then made adaptations to the workbook based on the revision list. The final
documents were presented and reviewed by the POPS-CAB using an iterative process. Feedback
from the POPS-CAB was used to confirm, correct or clarify the changes made to the workbook.
Analysis
The quantitative data from instruments and surveys was analyzed in SPSS version 21,
and analyses included frequencies, means, standard deviations, paired t-tests, with results
presented in tabular format. The transcripts from the focus groups and qualitative portion of the
forms were reduced to meaning units by the curriculum subcommittee and inductively
categorized across the areas used to evaluate and improve the workbook chapters - we provide
representative quotes within the results section indicated by quotation marks and italics (Table
3). All results are presented based on the initial version of the workbook used in Wave 1 (before)
and the revised workbook (after) used in Wave 2.

19
RESULTS
Material Evaluation
Readability Tests
Readability tests revealed an overall workbook mean reading level to be at 5th grade.
Variability between the measures showed results ranging from below 4th grade for SMOG (3.8)
when considering complexity of words (polysyllabic) and 7th grade for Coleman-Liau (6.8) when
considering length of words (character count). Also variability was found in the Flesh Reading
Score with the ease of reading ranging from standard (62) to easy (80-86). However the overall
result by chapters was found to be easy (80) to fairly easy (78). Table 1 shows results for all five
tests performed in which no statistically significant changes were observed between tests
conducted on the first version of the workbook (before revisions) and on the second version
(after revisions).
Table 1. Readability tests results before and after revisions.
SMOG
Grade Level
Score
Flesh-Kincaid
Grade Level
Score
Fry
Grade Level
Score
Coleman-Liau
Grade Level
Score
Flesh Reading
Ease Score (0 very confusing;
100 very easy)
Before After Before After Before After Before After Before After
Overall 3.8 3.8 5.1 5.1 5.8 5.8 6.7 6.8 80 78
Chapter 1 4.1 4.3 6.1 5.8 7.0 7.0 7.3 6.9 74 77
Chapter 2 4.2 3.8 6.1 6.0 7.0 7.0 7.1 7.5 75 62
Chapter 3 3.8 3.8 4.4 4.5 5.0 5.0 6.2 6.2 85 84
Chapter 4 3.8 3.8 4.3 4.6 5.0 5.0 5.8 6.3 86 83
Chapter 5 4.1 4.0 5.0 5.1 6.0 6.0 6.9 7.0 82 81
Chapter 6 3.0 3.0 4.4 4.3 5.0 5.0 6.9 6.9 80 81 No significant differences between revisions.
Clear Communication Index

20
The initial POPS-CAB CCI evaluation resulted in an overall score of 76 (Table 2).
Qualitative comments (e.g., need to address multiple main messages and include more ethnically
diverse pictures) demonstrated the need for a second revision. For the final product, the CAB
CCI evaluation resulted in a significant improvement in overall rating (88, p<0.01). Mean ratings
were nearly identical between community and academic partners, as well as individual and group
reconciled ratings. When considering results by the Index parts per workbook section, all overall
ratings showed improvement across chapters (Table 2). Results from Main message (Part A)
range went from 59-67 before revisions to 86-88 after revisions and Numbers (Part C) went from
58-67 to 60-92. Changes to the clarity of Main message showed larger improvement. Both before
and after revisions the workbook had strong Behavioral recommendations (Part B = 94-100
across chapters).
Table 2. CCI results before and after workbook revisions.
CCI SCORE
Before After
Overall 76** 90**
Community 77* 89*
Researchers 75 * 90*
Chapter 1 49 94
Chapter 2 73 88
Chapter 3 57 87
Chapter 4 69 87
Chapter 5 83 85
Chapter 6 93 88
Scores by CCI Sections
A - Core/Main Message B - Behavioral Recommendation C - Numbers
Before After Before After Before After
Overall 63** 87** 96** 98** 67** 80**
Nutrition 62* 88* 100 100 58 60
Physical Activity 67* 86* 94* 100* 75* 92*
Behavioral 59** 88** 94 94 67** 89** *p<0.1 **p<0.05

21
Suitability Assessment of Materials
SAM results are presented in Table 3, which shows that the cultural appropriateness of
material remained superior (µ=2) before and after for overall results and when considered by
research members. However, community partner ratings for the Cultural Image and Examples
went from adequate (µ=1) to superior (µ=2). Before the evaluation the majority of the comments
in the SAM’s comments section was related to improving pictures to “represent more
ethnicities”. This improvement can be exemplified by comments left by community members
after revision “Great improvement regarding different ethnicities/cultures”. Strength of
recommendation was strong overall for both revisions (before=8/10; after=9/10).
Table 3. SAM results before and after revisions.
SAM
1. Cultural Match in
Logic, Language and
Experience
2. Cultural Image and Examples 3. Suitable for your population?
Before After Before After Before After
Overall Superior Superior Superior** Superior** 8* 9*
Community Superior Superior Adequate* Superior* 7*** 9***
Researchers Superior Superior Superior Superior 9 9
*p<0.1 **p<0.05 *** p<0.01
Perceptions
Summative Evaluation
Data gathered from the parent/caregiver summative evaluation presented no significant
difference between waves. Results indicated that parents felt satisfied with the workbook
(μ=9.2/10, SD=1.08) and found it to be helpful (μ=9.3/10, SD=1.5), and agreed that was easy to
find information that they need in the workbook (μ=9/10, SD=1.4). Lower rates were found
about the usability, parents not often used the workbook outside the classes (μ=3.5/10, SD=1.4),
not often used the goal setting and tracking sheets (μ=3.4/10, SD=1.5), or think they will often

22
use it after the program ended (μ=2.8/10, SD=1.6). Qualitatively, parents indicated they liked
that it was easy to read and follow, used plain simple examples and thought the illustrations were
nice. Parents reported lack of time, often due to work or other commitments, as the primary
barrier to using the workbooks.
Fidelity Check-list
Delivery staff feedback revealed areas for improvement related to comprehension (e.g.,
difficulty in understanding energy balance) and format (e.g. Use “rounded” number to facilitate
calculations). Table 4 shows sample of selected quotes by chapter from the transcripts and from
the delivery staff feedback that influence changes in the workbook’s first version and Figure 2
provides a sample of changes.
Figure 2. Sample of change in Chapter 1 - Energy Balance section based on qualitative feedback.
Focus groups revealed that the workbook accomplished its objectives and was easy to
understand. They also reported that the workbook helped them rethink their behaviors and
influenced them to promote health changes. Furthermore, parents reported that the written
materials supported the other intervention components and was used as a reference resource.
Finally, focus groups also revealed areas that needed improvement in format (e.g. more visual

23
cues and separation of sections) and content (e.g. screen time focused in all types of media no
only on TV) were also highlighted (Table 4).
DISCUSSION
We have described an iterative and systematic formative evaluation using a CBPR
approach to develop, evaluate and improve an evidence-based culturally relevant childhood
obesity workbook for parents of overweight children that used clear communication strategies to
address key learning objectives. Because written materials are often used as an important
intervention component [49], the main objective of this study was to offer a process guide for the
development and evaluation written materials using a collaborative approach. The study also
adds to the current literature by providing a process to combine available health literacy tools
[49], such as the clear communication index evaluation system, SAM, and readability statistics
with a CBPR.
We documented that the intervention materials developed for this study were written at a
5th grade reading level which was below the average grade level required for our participants
(>9th grade [79]). This is consistent with research on written materials targeting parents to
prevent childhood obesity [49] were the findings from the SAM measure identified specific areas
related to cultural appropriateness that reduced the overall suitability of materials in their original
form. The SAM has been used in some studies to select patient nutrition education materials [73]
and to evaluate childhood obesity intervention materials [49]. The SAM ratings improved
following revision in our study, primarily due to changes in community partner assessments.
White and colleagues also documented superior ratings after making specific revisions in
response to SAM scores. Common revisions in response to these scores included re-wording

24
passive sentences, enhancing the color schemes, reframing of health information to better
coincide with typical reading patterns, and adding in culturally appropriate visuals [49].
This is the first study, to our knowledge, that incorporated the CCI in the evaluation of
childhood obesity treatment materials for parents. The CCI added evaluative factors for written
materials beyond readability statistics and cultural appropriateness and provided actionable
information to improve the original workbook materials. Consistent with Bauer and colleagues,
revisions based on the CCI resulted in written materials that were rated higher than original
materials. These changes are hypothesized to increase the likelihood of parents, regardless of
their educational level, to identify and understand the main message and behavioral strategy, and
interpret numbers in each workbook section. Unfortunately, this hypothesis cannot be directly
tested with the current study due to the multi-component intervention (e.g., changes in
comprehension could be due to adaptations made to in-person class or telephone support sessions
rather than due to workbook changes)—though this would be an excellent area for future
research.
The findings of our study also highlight the importance of moving beyond readability
statistics as a sole indicator of the appropriateness of written materials for a given audience. It is
of note that the results of the readability assessments did not change when comparing to the
original and revised materials—both were ~5th grade reading level. In contrast, both the CCI and
SAM assessments provided actionable information for revisions and demonstrated significant
improvements in ratings between the original and revised materials. Despite the finding that
approximately 36% of the parents in our sample had limited HL and that 18% of the adults in the
region lack basic literacy skills [80], readability assessments would have suggested that the
original materials were appropriate. However, readability scores do not provide information on

25
reading ease, prominence of main messages, behavioral strategies to initiate action, or cultural
relevance—as the CCI and SAM provide—and can be misleading when determining the
likelihood that the materials clearly and effectively communicate intervention information.
Therefore, the use of clear communication strategies has the potential to enhance program
efficacy, perceived cultural relevance from community members and satisfaction among
participants.
The CBPR approach that actively engaged community partners in the workbook planning
and adaptation process increased community capacity related to health literacy. Community
members of the POPS/CAB played a critical role in the design and implementation of the written
materials. Incorporating CAB feedback was important to develop clear and suitable materials for
the regional childhood obesity treatment program. Their involvement in the interpretation and
application of the evaluation findings also enhanced the quality of the materials. The engagement
of community partners in training on the CCI and SAM included the added value of increasing
capacity in community members and may also lead and contribute to improved organizational
health literacy [81]. Still, the participatory evaluation process also presented a significant time
commitment for community partners and we balanced this by determining the minimum data
necessary for the workbook development. This challenge is not unique to our study and has been
described in several papers reporting on CBPR research approaches (Israel et al).
Our study included a number of limitations. First, we did not conduct a final round of
focus groups to assess the final version of the parent workbook. Although the use of the focus
group interviews in phase 1 contributed to understanding of the problem from a reader-centered
point of view, it was extremely labor and time intensive, including time needed to conduct the
analysis collaboratively with community partners. Therefore, we decided not to conduct a second

26
round of focus groups after the final revisions since the materials showed a significant
improvement and reached acceptable clear communication and suitability levels. Second, the
sample size of CAB members that evaluated the documents before and after revisions was small.
This is due to the nature of the study and our goal to report on the process of assessment and
adaptation. Third, we developed the workbook and tested it within a multi-component
intervention, which does not allow for independent comparison of changes in the workbook with
comprehension and study outcomes. Still, the findings provide a process for developing clear
written materials for adults from an ethnically diverse, low income, and low literate community.
CONCLUSION
This article describes a CBPR approach to applying clear communication strategies in the
development of childhood obesity intervention materials. The approach is driven by and tailored
to community needs, and involved contributions from individuals who would ultimately deliver
the intervention and participants who have engaged with the intervention materials. We found
that a process that included the engagement of community members and program participants in
the development, evaluation, and revision of a program workbook to be both feasible to our CAB
and staff, as well acceptable to potential participants who represented the target population. Our
iterative process resulted in improved written materials that are written in an adequate grade
reading level, clearly communicated the objectives of the program, and were culturally relevant
while achieving a high satisfaction among users. The findings from this study suggest this is a
potentially generalizable process for improving the clear communication of written materials
from evidence-based interventions.

27
Table 4. Sample of Perceptions that leaded workbook changes and adaptation
Chapter Learning Objectives
POPS/CAB Feedback
From CCI open questions
Delivering Staff Feedback
From Summative Evaluation
Example of Participant’s feedback From Focus Group
Workbook’s Change - Adaptations
Overall
1. More than one message 2. Main message is not at the beginning of section. 3. Pictures could represent more ethnicities (people and food) 4. Some sentences are in passive voice
Include most of the intervention hand-outs in the workbook • Change activities – simplify to facilitate time management at classroom • Change activities – Use “rounded” number to facilitate calculation
1. “I think that the workbook was put together really well. It was organized and in sections, and explained each section thoroughly. It was easy to read…and we will continue to refer to it as needed.” 2. “Something that I think would be helpful is it has them in this book, but then it stays in this book … if it was on my refrigerator every time I opened it, I would be like, oh, okay.”
*Reorganized content to focus in one main message with is stated in the first paragraph * Changed pictures for include more diverse ethnicity. * Included most of the handouts as part of the workbook. * Made the tracking sheets and goal settings as “tear out” without compromising the content (blank back) * Added the Tips for You section * Changed remained passive voice sentences to active voice
Chapter 1
1. Describe energy balance and how it influences weight. 2. Identify the food groups included in MyPlate. 3. Identify that children should participate in 60 minutes of moderate to vigorous activity daily. 4. Set a specific, time-based, and achievable goal for eating and physical activity.
1. [Need to] focused on energy balance
1. Better discussion about calories and energy balance (make clear that they need imbalance) 2. Setting SMART goals were too intense for young kids next time have kids set 1 goal / SMART goal setting was “too much to digest” for kids
1. “Plain and simple.” 2. “This explained it in real details and everything.” 3. “[Had] anything that could be done to this section to make better” 4. Energy balance was hard [to understand], I mean… We need imbalance right?”
*Changed energy balance content language (energy “in-burned” to “in-out”), and pictures (changed scale to body outlines) *Reduced the SMART goals to kids

28
Chapter Learning Objectives
POPS/CAB Feedback
From CCI open questions
Delivering Staff Feedback
From Summative Evaluation
Example of Participant’s feedback From Focus Group
Workbook’s Change - Adaptations
Chapter 2
1. Choose foods to eat more often, and to cut back on foods to eat less often. 2. Identify how to be physically active in a way that fits their preferences and lifestyle. 3. Help their children to identify barriers and address them at daily bases without focusing overly on weight.
1. Pictures of sometime/ anytime foods might be more helpful than words alone (there are sometimes graphics - arrows + smiley face - but no food pictures on graphics in this section. 2. First statement could state the health foods are anytime food. 3. May need more diverse pictures - more non-white people. 4. [Heath snacks] Dried fruit and nuts can be expensive and people don’t know what hummus is.
Families were not using the tracking system.
1. “I think it could have been a little bit more with healthy foods and choices.” 2. “Maybe put the name of the food because that was kind of hard to tell [by the picture]” 3. “I actually like this [exercise] pyramid. I think it would be clearer and maybe if it was a tear-out and we could put in on the refrigerator it would be great” 4. “I would like to see on my fridge; that we could reference every day without having to go into a notebook (…) It would really make my kids more accountable and think about that.” 5. “I think the activity pyramid is helpful. But it’s just don’t make it so pixelated so we can actually read it. 6. “I like color and what I see is a whole bunch of black and white (…) this seems like schoolwork a lot of times (…) I look this part and think: Boring!” 7. “The information is great. I think it just should have been more visual pictures, and then maybe added a couple of extra pages and…it’s like all this information in one place.” 8. “They need to highlight some of the main points or something.” 9. “I think its [multiple choice] a good way to get started because I’ve never really set goals like this (…) And I think this was a good way to kind of get the ball rolling.”
* Made the tracking sheets and goal settings as “tear out” without compromising the content (blank back) * Changed layout to include more pictures, less text dense and more colorful. * Made a new adapted version of the excise pyramid which was more clear and included race variety images. *Added legend to food pictures * Added an annex section with health snacks options that are quick, easy and affordable.
Chapter 3
1. Define the appropriate portion sizes for parents and kids. 2. Recognize when they are hungry and when are enough. 3. Identify ways to cut back screen time to less than 2 hours per day. 4. Develop strategies to change home environment cues so that they support healthy eating and physical activity.
1. More active voice: screen time "it is recommended" is passive consider "we recommend" and take out "can" and make it clear. 2. Calories in food not rounded. 3. Consider breaking up the "cut back on screen time" paragraphs in bullets.
1. Discussion on home environment and goal sheets were good. 2. Change “hand portion activity” to match the instructions.
1. “Screen time focused in all no just TV”. 2. “My kids grasped it and they were able to really use it [hand measurement], you know, as far as even going out to eat, you know. They would say is this the right size for chicken? And we would say well look at your hand.” 3. “It [home environment] gets lost in the workbook. Because this is actually really good because, you know, then I’m looking at it again. It’s really, really a good thing to have. But like the other worksheet that they hand out, I use that and I put that on the refrigerator to schedule things, you know.”
* Changed “hand portion activity” to match the instructions and include race diverse pictures. * Changed the Screen time section including all screen types no just TV and added a screen time calendar for families. * Made the home environment quiz a “tear out”.

29
Chapter Learning Objectives
POPS/CAB Feedback
From CCI open questions
Delivering Staff Feedback
From Summative Evaluation
Example of Participant’s feedback From Focus Group
Workbook’s Change - Adaptations
Chapter 4
1. Understand and making sense of a food label. 2. Understand importance of games and how they can help them to improve health. 3. Identify appropriate rewards for healthy behaviors and weight loss. 4. Identify how they can be a role model for their family and friends.
Need to better outline ways to help to be successful.
1. “More information on the label part”. 2. “I think the food label message was really good. My son, he bought into that, you know, looking at calories and sugar and stuff like that, and my daughter as well (…) The one thing that I think we went over that I think we should have talked more about is the ingredients.” 3. “It broke it down really good for her [my daughter], and she even now does it on her own.” 4. “That’s something y’all should include is how much we need as far as our nutrients and sodium and how much a person should be taking in, because that really wasn’t in there.” 5. “I don’t know what I can do about sugar… I can’t just cut off all from my kids… I need an acceptable daily number…” 6. “I didn’t necessarily use the chart, but we learned from it; that making activity a reward is much better than ice cream, you know. And I learned, too, that my kids like it better. 7. “More pictures”
* Added more information on label section including sugar and sodium (the “5/10 rule”), and ingredients information. * Added more pictures illustrating recommended actions.

30
Chapter Learning Objectives
POPS/CAB Feedback
From CCI open questions
Delivering Staff Feedback
From Summative Evaluation
Example of Participant’s feedback From Focus Group
Workbook’s Change - Adaptations
Chapter 5
1. Reflect on eating choices in the last week and identify triggers to that lead to unhealthy eating. 2. Identify movements and intensity routines of activities using music & dance that can help them to improve their family’s health. 3. Identify strategies and resources to help their children to deal with bullying and teasing situations using the 5 step strategy AWARE.
None 1. “I think they were explained really well, especially this first page. It looks like a summary of everything, you know, with my plate and using their hand. The energy balance, you know, it was just a really nice summary before we moved on to the next section… I think that’s really important.” 2. “I would like to see more maybe pictures of some of the exercises. Some of the exercises that we did or maybe some that the program suggested that we do at home. That would be helpful.” 3. “I think the bullying part maybe, you know, just like the other part where you’re talking about elaborating on it a little more (...) Maybe a different picture or other pictures, because this triangle is good, but I think maybe we can do better, you know, to really drive home the whole bullying thing.” 4. “I like these iChoose [tracker] where you had the vegetables…well the fruit, vegetables, grain, protein, dairy, and sometimes food… I think that’s great because that kind of its one thing to just think you’re doing all right. Versus you see it in print and you’re thinking, oh, I thought I had more vegetables than that. You know, it just brings it home. So I think this was a really good tool.”
* Included an appendix which exercises that families did in the exercise class (circuit), and also which exercise that could be done at home. * Improved bulling section by reducing content and focusing in strategies. *Included in all sections a “recap” paragraph at the beginning of each chapter.

31
Chapter Learning Objectives
POPS/CAB Feedback
From CCI open questions
Delivering Staff Feedback
From Summative Evaluation
Example of Participant’s feedback From Focus Group
Workbook’s Change - Adaptations
Chapter 6
1. Describe relapse and recovery in a healthy eating and physical activity. 2. Identify and practice exercises that can help to decrease stress. 3. Identify strategies and resources to prevent relapse and to recovery after a relapse.
1. “I feel this should be more goal based + strategies to avoid relapse” 2. [X] suggested making title mention lapse/relapse more clear [Y] felt it was fine the way it was since the cycle graphic is just underneath. 3. Not sure why the image about "desserts is stress backwards". Seems counter to our main goals because the image with a cake did not support recommended behaviors and its purpose was unclear. 4. One list exceeded 7 bullets, but barely and the items in the list are short and easy to read.
Replace Desserts image with a culturally more appropriate image of health stress management methods such as those in the text next to the image.
1. “I think you used very familiar words that you’re used to hearing about if you listen to anything about weight loss and stuff; they do talk about lapses and those kinds of things and healthy habits. You know, recovery is probably not a word I’ve heard used before with like lapses and relapses. That’s not a word I would necessarily think of.” 2. “When we first got the book and I saw recovery, I’m like recovery? Is this talking about alcoholics?” 3. “My take on it is that I like strong language like that because it makes me…it motivates me to get back on the wagon or whatever. Get me back on the trail to doing what I personally need to do, you know, to reach my goals. It means something positive to me because of my background. So I guess you guys, you have to find a balance between me and [participant Y] is it?” 5. “I think it was proactive [plan]. It’s always important to be proactive because, once something happens, you react and you don’t always have the best thought process. But if you have a plan in place, then you’re like, okay, I did this. Let me go to this and let me figure out where I should do from here to fix it. 6. “I like that [stress management] ... And I like how you guys have this all set up, but I think maybe you could elaborate just a little bit more. Give us a little bit more tools of relaxation because, you know, us superwomen need all the help we can get, you know, to tackle the day.” 7. “I think this is helpful, you know, because it helps you to sustain, you know, all the lessons that you learned through the program. I have not actually cracked the book open and wrote down my strategies. I mean, I have it up in here and I have it in my heart. And I feel that I’m using the tools that you guys gave me. And this book is more of a reference for me, but I haven’t opened it up and started writing anything down.”
* Replaced images with a culturally more appropriate image of health stress management methods. * Review bullet list to contain less up to 7 items. * Reviewed content to be more goal based and focused in the family plan after the program. * Kept lapse and relapse (strong language) to motivate the family planning for maintenance phase. *Added more stress management tools for families. * Included a family contract to stimulate parents keeping changes after program ends.

32
MANUSCRIPT 2: Home media environment factors and change in child BMI in a family-
based childhood obesity
INTRODUCTION
Obesity tracks from childhood into adulthood [82] and is related to serious medical [83,
84] and economic consequences throughout the life course[85]. Childhood obesity continues to
be a leading public health concern, with 18% of 6-11 year olds qualifying as overweight, and an
additional 17% qualifying as obese [86]. Contributors to childhood obesity include high energy
intake and low energy expenditure, both of which have been linked to changes in the
environment [87]. Choices play a role in what children eat and do, but there are also
environmental influences - the likelihood that an individual will engage in a healthy behavior is
largest when the environment offers healthy opportunities [88].
In this context, family-based interventions have been implemented on the premise that
making changes in the home environment are important determinants of treatment outcomes[89,
90]. A recent systematic review of the literature [91] showed that interventions that used family-
based programs to promote change in the home environment to support physical activity
behavior, modify dietary intake, and reduce sedentary behaviors were more successful in helping
lower children’s weight. While these interventions have shown the ability to reduce and maintain
weight status, their translation into regular community or clinical practice is not apparent [4, 92].
Even once an evidence-based intervention is adapted for local implementation, holding great
promise for developing sustainable interventions[6], there still appears to be wide variability
among child outcomes with some losing weight, some maintaining weight, and some gaining
weight. Unfortunately, it is unclear the degree to which home environmental changes predict
changes in weight status [93] in a family-base intervention context.

33
The home environment has been documented as a factor that can either facilitate or
inhibit healthful behavior among children [3, 23, 94, 95]. Since it represents a substantial part of
the full environmental context in which a child grows, develops, eats, and behaves [94],
changing the home environment may improve a child's healthy behaviors and weight status in
the long term [89]. Both parenting practices and the physical environment are important factors
in helping children to eat more healthfully and be physically active [23, 89, 95]. However, there
is little evidence that multilevel interventions targeting multiple strategies including both social
(e.g. parent polices) and physical (e.g. availability) home factors related child's healthy behaviors
can either enhance or disrupt the relationships between the home environment and weight
management.
Knowing the influences of different home environment components on children's weight
status correlates may be important to improve the design of future initiatives to reduce childhood
obesity. Considering the home environment, evidence indicates that when more media
opportunities are available, children are more likely to engage in sedentary activities [96-99]. In
fact, studies often utilize media availability (e.g. numbers of televisions/computers in the home
and televisions in children's bedrooms) and media use (e.g. TV viewing, video gaming and
computer use) as a measure of children’s sedentary behavior [100-106]. An increase in media-
related sedentary behavior may result in a significant energy imbalance, because of increased
caloric intake and a decrease in energy expenditure, causing excess weight gain [102, 103]. Not
surprising, media-related sedentary lifestyle patterns have been associated with childhood
obesity [102]. The time spent with media is thought to be one of the most modifiable
environmental influences of obesity, and interventions that emphasize decreasing media use in
children improved weight indices [104]. Nevertheless, despite the mobile and online media

34
revolutions [107], which increase the accessibility of different types of media and use by
children (video games, hand held devices, smartphones), much attention has focused solely on
the role of television as a contributor to childhood obesity [108].
Kaiser Family Foundation’s study of children’s media use [107] reveled a radical
increase over the past five years both in the amount of time spent with media and the total
amount of media content consumed during that time. Children engage with media every day and
by some records, nearly 8 hours each day. Indeed, children also use multiple devices at the same
time—using the computer for school work, or time spent texting or talking on a cell phone.
However, in homes that limit children media opportunities (e.g. avoiding a TV in the bedroom,
turning the TV off during meals) or by imposing some type of media-related rules, children
spend substantially less time with media than children with more media-lenient parents [107].
The Kaiser’s study also highlights the effect of the mobile and online media revolutions on child
media consumption—making new ways for children to engage with television programming.
A better understanding of the modifiable risk factors for overweight and obesity among
children is of critical importance to reduce its prevalence [109]. The home media environment
may be an important determinant of treatment outcomes [89]. Yet, surprisingly we know very
little about specific home media environmental influences on children’s healthy behaviors [110].
And even less is known about those influences when related to outcomes of childhood obesity
treatment interventions [3]. As a result, it is unclear what home media environment (HME)
factors are most likely to result in a reduction by a multi strategy intervention, and whether this
will result in a decrease in obesity. The evaluation of interventions with home environmental
modification components can provide an opportunity to examine changes in weight outcomes
occurring in conjunction with changes in the HME [111].

35
Therefore, in this exploratory study, we aimed to examine short-term (post-intervention)
change in HME factors and test HME relationships with change in BMI z-scores in children
participating in family-based childhood obesity treatment intervention. We hypothesized that
HME would improve after intervention and those changes will correlate with a change in BMI z-
score. A secondary aim was to determine the relationship between the HME and screen time.
Finally, we examined the relationship between screen time changes and changes in BMI z-
scores. Determining HME changes and influence on children's outcomes resulting from an
intervention may provide useful information to developing strategies to address childhood
obesity and sedentary lifestyles.
METHODS
This study is part of a larger planning grant with the goal to increase local capacity to
develop, test, and sustain an evidence and family-based childhood obesity treatment program in
an area that provided services to low income and racially diverse audiences. The Partnering of
Obesity Planning and Sustainability-Community Advisory Board (POPS-CAB) produced the
iChoose program that included a number of strategies to change the home environment by
increasing opportunities for healthful eating and physical activity, and reduce sedentary
behaviors. Families were identified by local health providers and screened for eligibility
(N=586). Inclusion criteria for families included having an 8-12 year old child with BMI
percentile ranking greater than or equal to 85%, no major cognitive impairments or
contraindications for physical activity, living in the study region, English-speaking, and not
currently participating in a weight loss program (N=557). The intervention was pilot tested with

36
3 waves of families (n=101). Participants completed both baseline assessments and completed
the post-intervention (3-months) assessments (n=71) were included in the analyses.
iChoose combined healthful eating, physical activity, and behavioral strategies. Program
components included: (1) 90 minute family sessions that would occur every other Saturday over
the 12-week program, broken into a nutrition lesson, exercise time, and behavioral skills training
(2) 20-25 minutes telephone support calls to set goals, resolve barriers, and reinforce content
using the 5 A’s, teach-back and teach-to-goal strategies during weeks between family sessions,
(3) two 60 minute exercise sessions per week, (4) workbooks for both parent and child based on
clear communication strategies, and (5) child newsletters that reinforced content and provided
fun activities.
The iChoose curriculum contained a home environment behavior change element
targeting the family development of strategies to change home media environment cues so that
they support healthy eating and physical activity. Overall aims for media health behaviors were
reducing screen time and improving physical activity opportunities at home. Specifically, the
family’s home media environment component objectives focused on: (a) identifying media
environmental characteristics (barriers and facilitators) to promote healthy habits; (b)
establishing and/or reinforcing parental policies to monitor media use (e.g. family schedule for
media use); (c) reducing child media availability (e.g. removing TVs from children bedroom);
(d) avoiding eating in front of TV; (e) improving exercise opportunities while watching TV (e.g.
getting up to move and play during the TV commercials); and (e) media-related goal setting
focused on limiting media use to 2 hours or less per day for both parent and children (e.g. family
contract).
Measures

37
During in-person baseline and post-intervention assessments, parents completed a
sociodemographic and home environment survey, and children anthropometric measurements
(i.e. height and weight) and self-reported screen time were collected. Children’s weight was
measured to the nearest 0.1 kg using a medical weight scale (Tanita TBF 300), and height was
measured with a stadiometer, calibrated in 0.1-cm intervals. Parents completed the social-
demographic survey including, but not limited to, education level, income, age, race/ethnicity,
and gender.
To measure HME factors parents completed the Comprehensive Home Environment
Survey (CHES) [106], which has been tested for reliability and validity in a low-income
population of parents of children 5-17 years old [106]. Items and subscales assessed in this study
following the CHES scoring system are listed in Table 1. Variables and scales from the CHES
were selected based on their alignment with the iChoose media environment curriculum
objectives. Specifically, we assessed the HME as; (a) Parental Policies to Monitor Media scale
with 6 items and total score ranging from 0-6 points; (b) Media Availability scale with 7 items
and total score ranging from 0-7 points; (c) Eating In Front of the TV scale with one item and
score ranging from 0-1 point; and (d) Exercise Opportunities in the Media Area scale with 2
items and total score ranging from 0-2 points. Using the originally proposed scales from the
CHES, Parental Polices to Monitor Media, Eating in front of the TV and Media Availability, a
total score was calculated using the sum of the scores of the 3 scales, which included 14 items
and could range from 0-14 points. Higher total score on the scales indicates a home environment
more supportive to health media behaviors and a lower total score indicated a less supportive
HME.
38
In addition, two assessments of child screen time additional scales were completed—by
parental report (i.e. How many hours of television does your child watch? and How many hours
does your child spend on the computer or video games?; scored 0 =>7 hours; 1<7 hours) with a
possible score ranging from 0-2 points and by child self-report (On an average school day, how
many hours do you watch TV? and On an average school day, how many hours do you play
video or computer games or use a computer or laptop for something that is not school work?
[112]; scored 0 = > 4 hours or more; 1= <4 hours) with a possible score ranging from 0-2 points.
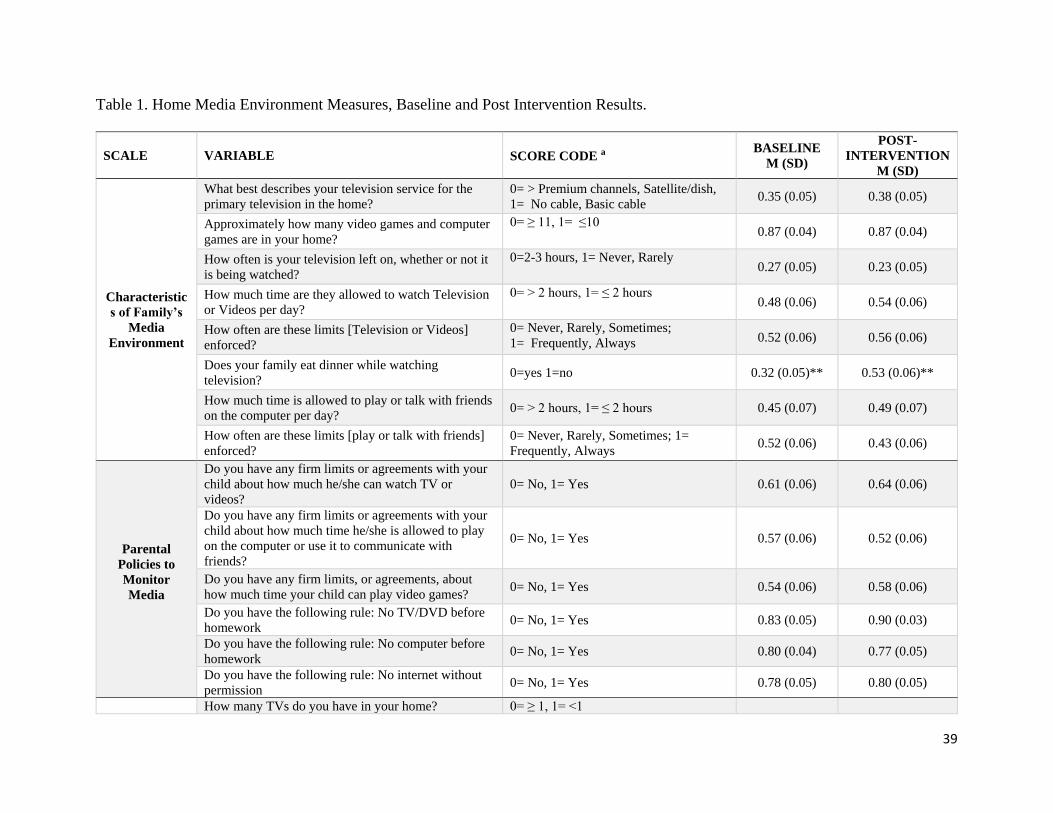
39
Table 1. Home Media Environment Measures, Baseline and Post Intervention Results.
SCALE VARIABLE SCORE CODE a BASELINE
M (SD)
POST-
INTERVENTION
M (SD)
Characteristic
s of Family’s
Media
Environment
What best describes your television service for the
primary television in the home?
0= > Premium channels, Satellite/dish,
1= No cable, Basic cable 0.35 (0.05) 0.38 (0.05)
Approximately how many video games and computer
games are in your home?
0= ≥ 11, 1= ≤10 0.87 (0.04) 0.87 (0.04)
How often is your television left on, whether or not it
is being watched?
0=2-3 hours, 1= Never, Rarely 0.27 (0.05) 0.23 (0.05)
How much time are they allowed to watch Television
or Videos per day?
0= > 2 hours, 1= ≤ 2 hours 0.48 (0.06) 0.54 (0.06)
How often are these limits [Television or Videos]
enforced?
0= Never, Rarely, Sometimes;
1= Frequently, Always 0.52 (0.06) 0.56 (0.06)
Does your family eat dinner while watching
television? 0=yes 1=no 0.32 (0.05)** 0.53 (0.06)**
How much time is allowed to play or talk with friends
on the computer per day? 0= > 2 hours, 1= ≤ 2 hours 0.45 (0.07) 0.49 (0.07)
How often are these limits [play or talk with friends]
enforced?
0= Never, Rarely, Sometimes; 1=
Frequently, Always 0.52 (0.06) 0.43 (0.06)
Parental
Policies to
Monitor
Media
Do you have any firm limits or agreements with your
child about how much he/she can watch TV or
videos?
0= No, 1= Yes 0.61 (0.06) 0.64 (0.06)
Do you have any firm limits or agreements with your
child about how much time he/she is allowed to play
on the computer or use it to communicate with
friends?
0= No, 1= Yes 0.57 (0.06) 0.52 (0.06)
Do you have any firm limits, or agreements, about
how much time your child can play video games? 0= No, 1= Yes 0.54 (0.06) 0.58 (0.06)
Do you have the following rule: No TV/DVD before
homework 0= No, 1= Yes 0.83 (0.05) 0.90 (0.03)
Do you have the following rule: No computer before
homework 0= No, 1= Yes 0.80 (0.04) 0.77 (0.05)
Do you have the following rule: No internet without
permission 0= No, 1= Yes 0.78 (0.05) 0.80 (0.05)
How many TVs do you have in your home? 0= ≥ 1, 1= <1

40
Media
Availability
Do you have a digital TV recorder (e.g., TiVo, Replay
TV, Sonic Blue) 0= Yes, 1= No 0.47 (0.06) 0.47 (0.06)
Does your child have a TV in his/her bedroom? 0= Yes, 1= No 0.12 (0.04) 0.15 (0.04)
Does your child have a video game station or
computer? 0= Yes, 1= No 0.09 (0.03) 0.10 (0.04)
Do you have a desktop or laptop computer in your
home? 0= Yes, 1= No 0.15 (0.04) 0.19 (0.05)
Does your child have a PSP, Nintendo DS, iTouch or
any other handheld video game? 0= Yes, 1= No 0.11 (0.04) 0.11 (0.04)
Do you have video games on your phone? 0= Yes, 1= No 0.35 (0.06) 0.34 (0.06)
Eating in front
of the TV How often does your child eat in front of the TV?
0= 2-3 times per week, and 4-5 times
per week, and every day
1= Never and 1 time or less per week
0.34 (0.06) 0.43 (0.06)
Exercise
Opportunities
in Media Area
Do you have exercise equipment (such as stationary
bikes, treadmills) in your main TV viewing area? 0= No, 1= Yes 0.07 (0.03)* 0.16 (0.04)*
Does your main TV viewing area have adequate space
for your child to play or exercise while watching
TV/Videos?
0= No, 1= Yes 0.88 (0.04) 0.94 (0.03)
a Higher total score indicates a home environment more supportive to health media behaviors * p<.05 **p<.001

41
Data Analysis
Multiple descriptive statistical tests were performed using Characteristics of Family’s
Media Environment variable values at baseline and post intervention to summarize the data,
including means and standard deviations. We excluded those who did not attend the post-
intervention (3 month) assessment. Data were entered and scored using SPSS®20 and analyzed
using statistical significance set at a value of p<0.05.
Using the CHES [106] scoring metrics each HME variable score was calculated as 0 or 1
as indicated in Table 1. For each scale, a total score was calculated for both baseline and post-
intervention using the sum of their containing variables scores (Table 1). Paired-samples t-tests
were conducted to evaluate the impact of the intervention on participants’ scores on each scale.
Paired-samples t-tests were conducted to evaluate the impact of the intervention on participants’
scores on both HME 3-Scale and 5-Scale totals. BMI z-scores were computed for the children
based on age and gender.
Change scores from baseline to post intervention were calculated for each of the scales.
Linear regression models tested if there was a relationship between change in children’s BMI z-
scores and the change in the HME scores. Model included as the independent variables the
change scores from the Parental Polices to Monitor Media, Eating in front of the TV and Media
Availability scales originally proposed by CHES.
RESULTS
The data are presented for the study participant population (70 parents and children) that
completed both baseline and the 3 month post-intervention assessment. The parent participants in
this study sample were on average 39.7 (±8.84) years of age, 93.6% female, and the majority of

42
individuals were black, non-Hispanics (54.4%). More than 58% of participants had at college
degree and nearly half were married (48%). Parent participants in the present study were mostly
employed (69.1%) and near half had a household income of less than $25K (48.8%). The
average age of children in the sample was 10 years of age (SD = 1.3 years), and there were
nearly equal numbers of males and females (51.5% and 48.5%, respectively). A larger proportion
of the children were black, non-Hispanics (61.4%). Child participant BMI z-scores were on
average 1.9±.43 which is equivalent to, on average, approximately the 98th percentile.
Characteristics of Family’s Media Environment
Baseline home media environment characteristics reported by parents presented on
average 3.7 (±1.48) TVs at home and the service for the primary television in the home was
satellite/dish (41.8%) or cable with premium channels (26.5%). Nearly half (54.5%) of homes
have a digital TV recorder (e.g., TiVo, Replay TV, Sonic Blue). The majority of homes have a
computer (85%). Eighty-eight percent of the children have a TV in their bedroom, 85%, own a
video game station or computer, and have handheld video game device (86%) such as PSP,
Nintendo DS or iTouch. Ninety-seven percent of the homes have at least one video game and
41% have 11-20 games. In just over half (52%) of the homes, the TV is often left on whether or
not it is being watched ,and 65% of the families reported eating dinner while watching TV. Each
day, children were allowed, on average, to watch TV or videos for 66 ±69 minutes, play video
games for 50 ±55 minutes, and play or talk with friends on the computer for 44 ±48 minutes.
Nearly half of parents reported having firm limits or agreement about how much time their
children are allowed to watch TV or videos (58%), play video games (53%), play or talk with
friends on the computer (57%) and 66%, 65%, and 55%, respectively, reported they enforced
those limits “always”. The majority of TV viewing areas had adequate space for child play or

43
exercise while watching TV/Videos (87%) but did not have exercise equipment in the area
(91%).
Home environment Change
When examining individual items scores change from baseline to post-intervention
(Table 1), there was a statistically significant difference in item scores for family television
viewing while eating dinner (t(67)=3.18, p=0.002), exercise equipment availability in the main
TV viewing area (t(67)=2.18, p=0.033), and from baseline to post-intervention. The eta square
statistic 0.04 and 0.03 respectively, indicated a small effect size. No other significant changes
were noted.
Computed sum scores for scales of parental policies to monitor media, eating in front of
the TV, media availability subscales, exercise opportunities in TV area and screen time are
presented in Table 2. There was a significant difference in scale for Exercise Opportunities in
TV Area from baseline (M=0.48, SD=0.22) to post-intervention (M=0.55, SD=0.23); t(67)=-2.3,
p=0.024. The eta square statistic (.06) indicated a small effect size. However, there were no
statistically significant (p < .05) changes from baseline to post-intervention for the scales
Parental Polices to Monitor Media, Eating in front of the TV, Media Availability and both parent
and children reported Screen Time from baseline to post-intervention, as seen in Table 2.
Table 2. Baseline to Post-Intervention Home Media Environment subscales scores.
Scale Scores a Range Baseline, M (SD) Post-Intervention, M (SD)
Parental Policies to Monitor Media 0-6 4.10 (0.23) 4.22 (0.21)
Media Availability 0-6 1.73 (0.15) 1.79 (0.14)
Eating in front of the TV 0-1 0.34 (0.06) 0.43 (0.06)

44
Exercise Opportunities in TV Area 0-2 0.96 (0.05)* 1.10 (0.06)*
a Higher total score indicates a home environment more supportive to health behaviors * p<.05
Parental polices to monitor media, eating in front of the TV and media availability scales
scores were used to calculate a 3-Scale overall score for HME. A paired-samples t-test was
conducted to evaluate the impact of the intervention on participants’ scores on HME scale. There
was a no statistically significant difference in total score of 3-Scale HME from baseline
(M=6.11, SD=0.28) to post-intervention (M=6.46, SD=0.24); t(67)=1.45, p=0.15.
Home environment and BMI
Children reduced their BMI z-scores by a mean of 0.04 (±0.18) and 64% of the children
(n =45) reduced their BMI z-scores during the 3-month intervention. Multiple regression
analyses were conducted to examine the relationship between change in children’s BMI z-scores
and the change in the Parental Policies to Monitor Media, Eating in front of the TV, and Media
Availability, Screen Time and Exercise Opportunities in Media Area scales scores. Table 3
summarizes the descriptive statistics and analysis for Model. The multiple regression with three
predictors explained a significant proportion of the variance in BMI z-score changes (R² = 0.139,
F (3, 63) = 3.38, p < 0.024). As can be seen in Table 3, the Eating in front of the TV scale
(higher score reflected less eating in front of the TV) had significant negative regression weights,
indicating children with higher scores on these scales had larger reductions in BMI z-score, after
controlling for the other variables in the Model. There were no statistically significant (p < .05)
relationships between BMI z-sores change from baseline to post-intervention and change scores
of Parental Policies to Monitor Media and Media Availability subscales.

45
Table 3. Summary statistics, correlations and results from the regression analysis
VARIABLE MODEL a
(Change in Score) M (SD) β (95% CI)
Parental Policies to Monitor Media 0.12 (1.60) 0.20 (-0.08, 0.01)
Media Availability 0.59 (0.90) 0.12 (-0.02, 0.73)
Eating in Front of the TV 0.09 (0.45)* -0.27 (-0.20, -0.01)*
a. R² = 0.139, F(3, 63) = 3.38, p < .024 * p<.05
Screen Time
Parents reported that 62% of the children watched more than 7 hours of TV per day and
32% play more than 7 hours of video game per day. On the other hand, the majority of children
reported 3 or less hours of watching TV and playing video games (73.3%). Multiple regression
analyses were conducted to examine the relationship between change in HME 3-scale scores
model and changes in screen time reported by both parents and children, and to examine the
relationship between change in children’s BMI z-scores and changes in screen time.
There was a statistically significant difference in variable scores for parental report in
how many hours of TV their child watched (t(67)=2.24, p=0.028) from baseline (M=0.76
SD=0.05) to post-intervention (M=0.90 SD=0.04). The eta square statistic 0.03 indicated a small
effect size. However, the scale combining combined TV and video game hours reported by
parents were not statistically significant t(67)=1.47, p=0.14) from baseline (M=1.71, SD=0.07) to
post intervention (M=01.82, SD=0.05). Moreover, there were no statistically significant (p <
0.05) relationships between BMI z-sores change, the HME 3-scale model and change scores of
parental report of child’s screen time.
Furthermore, there was no statistically significant difference in scores of children’s self-
reported screen time scale (t(53)=0.57, p=0.5) from baseline (M=0.78, SD=0.42) to post

46
intervention (M=0.81, SD=0.39). Moreover, there were no statistically significant (p < .05)
relationships between HME 3-scale model and change scores of child’s self-reported screen
time. However, the combined TV and video game hours reported by children were a predictor of
the BMI z-score change (R² =.094, F(1, 52) = 5.39, p=0.024, -0.047±(0.127) indicating that those
children that reported reducing their screen time tended to have a higher reduction in BMI z-
scores.
DISCUSSION
This study explored the home media environment of families participating in a family-
based childhood obesity treatment intervention that targeted improvements in media behaviors
from baseline to the post program (3 month) follow-up. Specifically, the methods of this study
were designed to explore changes in home media environment factors and their association with
change in BMI z-scores in participating children. The results provide support that the
intervention was able to improve aspects of the families HME (i.e. families avoiding eating
dinner in front of TV, reducing child hours of TV watching, and increasing the availability of
exercise equipment in TV viewing area) and that reducing child reported screen time and
avoiding eating in front of the TV was related to a higher reduction in their BMI z-scores. The
changes observed in families HME followed the intervention objectives for media behaviors to
reduce screen time and improve physical activity opportunities at home. These changes provided
the basis for the experimental evaluation of how home media environment can influence
outcomes in a multilevel childhood obesity intervention targeting multiple strategies.
The study findings were similar to the results from the Kaiser Family Foundation’s study
of children’s media use [30]. Families had a similar number of TVs, digital TV recorders, the
percent of homes with at least one video game, and percent of homes with a computer. Parents in

47
our sample reported having firm limits or agreement about how much time children were
allowed to watch TV or play video games (62%) when compared to 28% from the Kaiser study
that had time-related rules for media. Fewer families, however, had a satellite/dish or cable with
premium channels but almost twice as many study children had a TV in their bedroom (88%)
when compared to those in the Kaiser family study (54%).
Parents reported that majority of the children watched more than 7 hours of TV per day
(that included other electronic devices) with is compatible with an average of 7½ hours of media
use reported previously. On the other hand, the majority of children reported 3 or less hours of
watching TV and playing video games. This discrepancy may be due to the different measure
used. Parent report measures were from the CHES [106] with three possible options (<7, 7-14,
and >14 hors), while children self-report measures were from YRBSS [112] with six possible
options ranging from no TV to 5 or more hours. Still, parent reports of child TV time
significantly changed between baseline and follow-up while the child report measure did not. It
could be that children were more accurate in their assessment and the intervention activities that
drew parental attention to TV viewing resulted in parents become more aware of their children’s
TV time [27].
Overall, the results suggest that the intervention may have reduced the number of families
that eat dinner in front of the TV and increased the availability of exercise opportunities in the
TV viewing area. At baseline, a high proportion of families reported regularly eating in front of
the TV and none reported having exercise equipment in the TV area—both representing areas for
improvement. Our regression analyses found that changes in eating in front of the TV was a
significant predictor of change in BMI z-score. Research has shown children who routinely eat
while viewing television may be predisposed to childhood obesity due substantial increases in

48
energy intake [113] due to the frequency of meals and snacks [114] and the consumption higher
fat food items and fewer fruits and vegetables [115].
The generalizability of this study may be limited to the population tested in this
intervention because the subjects come from a demographically low income and health disparate
region. As well, considerations are due to the program and selection criteria were we can only
draw conclusions about HME in a sample of overweight/obese children. Further, all of the HME
measures were self-reported by parents and children. Future studies may choose to include in-
home observation assessments of media environment in addition to CHES self-reported items.
Additionally, future testing should investigate changing HME and media behaviors in the long
term to access wherever or not those changes were sustained by the families.
CONCLUSIONS
A family-based childhood obesity treatment program appears to be successful in
improving the home media environment. Specifically, participants reported reducing hours
watching TV and eating in front of the TV, as well as in improving physical activity
opportunities in TV viewing area at home. Initial findings indicate that child eating while in front
of a TV and reducing their reported screen time may be particularly important for child weight
change. The current study contributed to the literature on family-based childhood obesity
interventions by providing a better understanding of which home media environments factors
may be modifiable by a multilevel program that promotes changes in the home environment. Our
results not only demonstrated what home media environment (HME) factors may be improved
by a multi-strategy intervention but also related some of those changes to a reduction in child
weight status. This HME changes and influence on children's outcomes confirms information for

49
previous and future childhood obesity interventions—focusing on HME may contribute to
reduced child weight status.
However, we recognize that media is increasingly used in education for children and a
persistent part of daily life. Although the iChoose curriculum targeted the reduction of
recreational media use (e.g. sedentary screen time), a potential risk is that the media reduction
message may be confusing, given the use of technology, particularly computers and tablets/iPads
in educational settings. Thus intervention strategies that focus on recreational sedentary media
should be highlighted throughout the program, and examples given in the curriculum to ensure
that both parents and children understand the difference in using a media to complete an
assignment for school or work and using it to watch a television show or surfing the internet.

50
MANUSCRIPT 3: The neighborhood environment in the context of a childhood obesity
treatment intervention.
INTRODUCTION
Obesity is one of the most pressing global population health issues, and importantly one
that affects racial and ethnic minorities and those of low socioeconomic status disproportionately
[116]. Obesity tracks from childhood into adulthood [82] and is related to serious medical [83,
84] and economic consequences throughout the life course [85]. There is little doubt that
environmental influences are important contributors to the rise in childhood obesity [1, 2]. Other
contributors to childhood obesity include high energy intake and physical activity (PA)
environments [87]. The likelihood that an individual will engage in a healthy behavior is largest
when the environment offers healthy opportunities [88]. Accurate assessments of environmental
characteristics that support healthy eating and PA have become a topic of recent interest [117].
Unfortunately, it is unclear the degree to which neighborhood environments could inhibit or
support program participation and impact the reach of a program into a targeted area. Further,
studies testing the ability of contextual factors such as characteristics of neighborhood food and
physical activity environments to predict changes in physical activity, nutrition, and weight
status are equivocal [96, 118-120]. Thus, further investigation of what aspects of the
environment are more influential is needed to inform future interventions [24].
Numerous studies have demonstrated that environmental factors are associated with
physical activity, healthful eating, and childhood obesity [2, 119, 121]. For instance, children
from neighborhoods with better nutrition and physical activity environmental characteristics
were less likely to be obese than children from neighborhoods inferior on both measures [2].
Children’s weight status was found to be associated with availability and accessibility to fruits

51
and vegetables [122], neighborhood hazards [24], access to physical activity facilities and
availability of bicycle and walking trails [123], walkability[124] and community features (e.g.
parks and recreational facilities) [111]. Also the number of accessible destinations [125], safety
[126] and outdoor play spaces that feature shade, swings, water and cleanliness [127] contribute
to children's physical activity. Importantly, strong empirical evidence is not yet available for
modifiable and specific neighborhood environmental features due to the difficultly to implement
broad environmental changes [111]. Among both adults and children, most studies have not
simultaneously considered environmental factors on both physical activity and nutrition [96] and
there are no studies that also assess the home environment. Though there are research studies that
have examined the relationship between environmental factors, physical activity, and nutrition in
children [96], we are unaware of any that did so in the context of a childhood obesity treatment
intervention. There is a need to better understand the relationship between home and
neighborhood environment and children on eating, physical activity, and weight status outcomes
from family-based childhood obesity interventions.
Important aspects of programs and interventions that aim to address health behavior
promotion, such as reach and effectiveness, could influence their public health impact [128]. As
King and colleagues report the promotion of any health behaviors involves a geographic
component once the “where” influence program’s populations that are reached and their
outcomes [129]. Thus, family-based childhood obesity interventions could be aided by the use of
an evaluation framework that identifies both reach and effectiveness at it relates to neighborhood
environments. For instance, by identifying the reach aspects of the target population (e.g.
representativeness) related to settings (e.g. intervention's geographic location), as well
effectiveness of interventions related to geographic access to resources that could influence

52
health outcomes [129]. The present study proposes to opportunistically investigate enrollment
data with geodemographic aspects of the study area and then combine systematic environmental
audit data with individual-level child data before and after a family-based childhood obesity
intervention [55]. It is hypothesized that different neighborhood environmental factors may be
related to intervention enrollment and child changes in physical activity, eating, and weight. Of
particular importance will be the better understanding of how all of these factors impact
intervention reach and effectiveness.
To advance community-created models and assessments on environmental influences for
obesity [130], this study expands upon previous studies by identifying all physical activity
resources [131, 132], food outlets [132], and obesity disparities existing within the Dan River
Region (DRR) [27] in the context of the iChoose family-based program. The study was framed
in a social determinant of health and social ecological perspective that strives to be
transdisciplinary, involving researchers from different fields with an intention to achieve
intellectual integration that extends the concepts, theories, and methods [26]. This approach
involves the application of the social ecological theory [133] to help explain the variance in
children’s changes in physical activity and eating behavior, and weight status by testing
interactions among multiple levels of neighborhood environment combined with a contextual
analysis.
METHODS
This study is grounded in the social ecological framework [21, 134, 135] and uses a
mixed methods approach to examine (1) aspects of intervention reach including
representativeness of enrolled and not enrolled families and delivery location influences; and (2)
neighborhood environmental factors as they relate to changes in eating, physical activity (PA),

53
and weight status of overweight and obese children between 8 and 12 years old. Specifically, this
study opportunistically examines the degree to which both social and built environmental
neighborhood factors moderate the relationship between the home environment and the effect of
a childhood obesity treatment program - iChoose. It is hypothesized that different environmental
factors may differentially influence child changes in PA, eating, and weight as a result of the
family-based iChoose childhood obesity intervention.
Study Setting & Intervention
The DRR is a predominantly rural, health disparate and federally designated medically
under-served area [52, 53]. Located in south-central Virginia and north-central North Carolina,
the DRR includes the city of Pittsylvania, and Henry and Caswell Counties, and is anchored by
the small regional city of Danville. Danville residents experience high unemployment, low
educational attainment and have some of the highest rates of childhood obesity in the country
[54]. Regional data on childhood obesity are limited; data collected by school nurses in one local
school district showed 17% of 1st graders were overweight (i.e., BMI percentile 85th-94th) and
19% were obese. By 5th grade, in this same cohort, the prevalence increased to 19% overweight
and 36% obese. This rate of obesity is 3 times higher than state averages which estimate 12% of
Virginia high school students are obese [136]. Thus, the geographic profile, socio-demographic
characteristics, and current economic strain in the DRR create a vulnerable situation for
residents. In fact, the region currently ranks 126th out of 133 for health outcomes by county or
city in the Commonwealth of Virginia[79].
The iChoose intervention is a 3-month program. Program components included: (1) 90
minute family sessions that would occur every other Saturday over the 12-week program, broken
into a nutrition lesson, exercise time, and behavioral skills training (2) 20-25 minute telephone

54
support calls to set goals, resolve barriers, and reinforce content using 5 A’s (Ask, Advise,
Assess, Assist, and Arrange), teach-back and teach-to-goal strategies on weeks between family
sessions, (3) two 60 minute exercise sessions per week, (4) workbooks for both parent and child
based on clear communication strategies, and (5) child newsletters that reinforced content and
provided fun activities.
Data Collection Procedures
Data have been collected as part of the iChoose program that includes 3 waves of
families (n=101) who participated in the program between February 2014 and June 2015
iChoose inclusion criteria included children aged 8-12, a BMI of >85%, and English speaking.
The iChoose program was delivered at local facilities including a central parks and recreation
location for Wave 1 and a different parks and recreation facility for Wave 2 and 3. Different
locations were used for delivery of intervention. Wave 1 was delivered in the Parks and
Recreation of Danville main building; and Waves 2 and 3 were delivered in the Glenwood
Community Center. As a component of the program’s evaluation, reach data were collected
during the enrollment phase for the 3 waves including family location and demographic
characteristics. Reach was operationalized as the representativeness defined as similarity or
differences of the demographic characteristics, specifically race and income, and spatial
distribution between those who participate and those who are eligible but do not. Participants
completed 3 assessments (baseline, program completion at 3 months, and post program follow-
up at 6 months) as part of the study. The social-demographic survey included, but was not
limited to race/ethnicity, and household income.
Geographical data was acquired from US Census Bureau. Datasets used in this study
included TIGER/Line shapefiles, selected demographic and economic data, and cartographic

55
boundary shapefiles. Geoprocessing of data files from both states of VA and NC allowed for the
creation of a geodatabase for the DRR. Roads line shapefiles were then used to create an
Address Locator to georeference the delivery sites and families’ home locations. Family
neighborhoods were defined as an area within a buffer around each family's home location. We
created both a 400-meter (.25 mile) buffer around each family’s home, which was considered a
“walkable” distance [137, 138] and 1,600 meters (1 mile) buffer which was considered a short “
drivable” distance in their neighborhood (i.e. accessible to households with a vehicle) [138, 139]
around each family’s home location. Previous built environment studies have created
geodatabases of food establishments and physical activity resources [27, 140-144] to document
neighborhood environments was used in this study.
Retail food outlets and restaurants were identified, enumerated, and classified (stores or
restaurants) based on the Nutrition Environment Measures Survey (NEMS), which has been
shown to be a reliable and valid measure of the food environment [145, 146]. Further
classification and coding of data yielded a score regarding the availability (not available, limited
selection of one or two items, good variety/selection) and quality (not available, poor quality,
fresh and good quality) of fruits and vegetables [145] and restaurants were classified into three
categories (fast casual, fast food and sit down) [146]. Scores for Availability (0 to 30), price (-9
to 18) and quality (0 to 6) scores are accounted in a total summary score up to 54 points
(availability + price + quality) [145].
Enumeration of physical activity outlets are detailed in Hill et al. [141], but briefly it
includes identification of physical activity outlets by community partners, internet keyword
searches and drive by observation of outlets. For the physical activity environment, DRR public
and private indoor and outdoor recreation outlets were geocoded and mapped. The Physical

56
Activity Resource Assessment (PARA) tool [147] was used by trained auditors to systematically
audit physical activity outlets for features, amenities, and incivilities [131]. Researchers recorded
the availability of designated space and facilities for sports and other physical activity (e.g.,
basketball court); water features (e.g., ponds, fountains); trees and shade or partial shade in rest
areas; walking and bike paths, and the quality of these paths; available parking; amenities, such
as access to public transportation, BBQ grills, garbage cans, drinking fountains; and blight, such
as graffiti, vandalism, litter, and/or abandoned building(s). Operational Definitions of the
average of each characteristic were score as 0 = Not Present, 1 = Poor, 2 = Mediocre, 3 = Good
[147].
Exploratory analyses included the child PA, eating, and weight status (i.e., child
outcomes) data at baseline and program completion (3 months) data from the iChoose. The in-
person assessments included both child and parent interview-administered surveys on eating and
physical activity and anthropometric measurements (i.e. height, weight,). The measures are as
follows: Weight Status: (1) Weight was measured to the nearest 0.1 kg using a medical weight
scale (Tanita TBF 300). (2) Height was measured with a stadiometer, calibrated in 0.1-cm
intervals. BMI-z scores was calculated using the established formula and percentile rankings
were computed for the children based on age and gender. Eating behaviors: Fruit and Vegetable
Intake was assessed using the Youth Risk Behavior Surveillance System (YRBSS) questionnaire
[112]. Physical activity behaviors: the valid and reliable Godin leisure time exercise
questionnaire [148] was used to measure minutes of moderate to vigorous physical activity
(MVPA). This questionnaire shown to be reliable among children [148].
Data Analysis:
57
All data were entered and scored using SPSS®20, and spatial analyses were performed in
ArcGISTM 10.3.1 for Desktop. Data were analyzed using statistical significance set at a value of
p<0.5. Multiple descriptive statistical tests were run in order to summarize the data, including
means and standard deviations. Since the intervention changes between waves was minimal (e.g.
extending the family sessions to 2 hours, revised workbooks and delivery transition from
research to community partners/train-the-trainer model), we will combine the data from all 3
cohorts that participated in the iChoose program. Participant home location, food outlets most
commonly used by families (Parent survey: “Where do you typically shop for your groceries?”),
and PA resources were geocoded to assign longitude/latitude coordinate points for each address
and distance from the home was calculated using an ArcGIS extension (i.e. spider diagram tool).
To investigate aspects of reach, we analyzed data from families enrolled and not enrolled
in the iChoose program [149]. Results of reach data of enrolled or not families are compared
with race and income census data by block group in the same area. Census 5-year estimates of
household income and proportion of black residents was used to measure race distribution as an
indicator of neighborhood racial compositional. Spatial distribution was analyzed both related to
the family home location and its distance from the intervention delivery location. Proximity
analyses was performed using multiple ring buffer analyses; we created a 2-mile, 5-mile, 10-
mile, 15 mile, and 20-mile buffer around the delivery location and then calculated the number
and proportion of families that were enrolled and not enrolled that were located within each
buffer. A cluster analyses was performed to identify potential clustering related to enrolled and
not enrolled families. This analysis determines if the spatial patterns are clustered, dispersed or
random. To determine the statistical significance of each calculation, we calculated a pseudo p-
value based on different permutations of a dataset [150]. Overall, the iChoose program contacted

58
695 prospective participants, 581 having addresses. Eleven addresses were post-office box, not
an actual home location and were unable to be geocoded. After joining addresses with available
participant data, it was possible to match location for a total of 500 contacted families (86%), 99
enrolled (98%) and 401 not enrolled (86%).
We conducted a spatial analysis using the geocoded addresses of homes, and PA and
food outlets to determine the spatial relationships among neighborhood environment factors. For
calculating proximity to nutritional and physical activity resources, each facility was given an
individual resource identification (ID) number and mapped in ArcGISTM. Geocoded food outlets
most commonly used by families allowed us to analyze proximity, distance, availability and
quality, and outlet type accordingly; this analysis was used to determine if there is a significant
difference in the number of food establishments and PA outlets by children outcomes.
Continuous distance using the spider diagram tool to connect homes to the reported commonly
used grocery facility was mapped and calculated for each family participant.
Neighborhood characteristics were derived for the area within a buffer around each
family's home location. Proximity analyses were performed by creating both a 400-meter and
1,600 meters buffer around each family’s home, and then calculating the number of food/PA
outlets, availability, and quality by outlet type that were located within each buffer around the
home. To compare the level of a variable in one outcome to that of the second variable in
neighborhood, we conducted cluster analyses. Density was used to calculate the density of
food/PA outlets in the buffer around those families’ homes.
Analyses were performed to investigate the relationship between environmental factors
and child changes in physical activity, eating, and weight status. Additionally, multiple linear
regression were performed with change variables calculated from baseline to post intervention

59
data for child outcomes (i.e. eating, PA, and weight status) and with neighborhood
environmental factors (NE) variables measured at one point in time. All variables were used as
continuous variables (e.g. surveys, audits, BMI z-score). We examined the differences in
responsiveness to the intervention using the described outcomes and environmental parameters
as independent variables in multi-leveled regressions. Normality of the data was assessed and
multiple linear regressions were used for linear distribution. Specifically, analyses were
conducted first, to test relationships between NE nutrition and PA audits results (count,
availability and quality) and children change scores outcomes to conduct an overtime effect
analyses. To measure spatial correlations using feature locations and attribute values
(enrolled/not enrolled), we calculated Moran’s I to determine if data were clustered using weight
as a count of features (homes) in the DRR.
RESULTS
Spatial analysis of reach data
Sociodemographic characteristics
Overall analysis revealed that sociodemographic characteristic of enrolled families was
related to the general population by income but not by race. A higher proportion of black
families were enrolled both in the DRR and Danville City. Race characteristics’ results are
presented in maps (Figure 1-3) and tables (Tables 1 and 2). The majority of contacted families
were located in Danville city and the enrolled families had a 74% proportion of black (Table 2) a
higher proportion compared to 48% in the population for the same area (Table 1).
Figure 1: Enrolled and Not Enrolled families by DRR race

60
Table 1. DRR race: proportion of black
Area % Black Range SD
Danville City 48% 0-100 25%
Pittsylvania County 21% 0-59 15%
Henry County 24% 0-79 19%
Martinsville City 44% 0-99 29%
Caswell County 35% 5-55 18%
DRR (total) 32% 0-100 23%
Figure 3: Enrolled families of DRR by race.

61
Table 2. Enrolled race by DRR area
Area
Enrolled
Total Black White Not
Responded % Black
Danville City 53 39 14 0 74%
Pittsylvania County 33 12 13 5 36%
Henry County 0 0 0 0 0%
Martinsville City 0 0 0 0 0%
Caswell County 1 0 1 0 0%
Total 87 51 28 5 59%
Figure 4: Not enrolled families of DRR Area by race

62
Table 2. Not enrolled race by DRR area
Area
Not Enrolled
Total Black White Not
Responded % Black
Danville City 172 43 16 110 25%
Pittsylvania County 178 16 34 127 9%
Henry County 2 0 0 2 0%
Martinsville City 2 0 0 2 0%
Caswell County 8 1 3 4 13%
Total 362 60 53 245 17%
Income characteristics’ results are presented in Figure 5 and Table 3. Overall the DRR
presented a 36.2% (SD 15.6%) of the population with an income less than $25000 per year. Of
enrolled families 38% had an income less than $25,000 per year.

63
Figure 5: Enrolled families of Danville Area by Income
Table 3. Enrolled families of Danville Area by Income
Income Proportion
Less than 10K 10%
10-14K 28%
25-29K 26%
More than 55K 16%
Not Reported 20%
Spatial Distribution
Families contacted to participate in iChoose were concentrated in the Danville city area and
the non-enrolled families tended to be from outlying counties. The Figure 6 map sequence
shows the distribution of families’ locations. In the map showing all waves (Figure 6a) Henry

64
County (VA) has 4 not enrolled families and Caswell County (NC) has 9 not enrolled and only
one enrolled family. A similar pattern was repeated across waves.
Figure 6: iChoose DRR location of enrolled and not enrolled families:
All Waves
a. b.
c. d.
Pittsylvania County
Caswell County
Henry County

65
To investigate patterns in the location of contacted families by nearest program delivery
location, we performed a multiple ring buffer analysis. Multiple ring buffers showed a similar
pattern for all waves in which 52% of the contacted families are from a 5-mile radius and 78%
are in a 10-mile radius from the delivery location. The majority (66%) of enrolled families for all
waves were located 5 miles from the delivery location and 51% of not enrolled families were
from more than 10-miles away. Results are summarized in Table 4.
Table 4. Contacted families distribution in multiple rings buffer from the delivery location
Buffer
Distance
Wave 1 Wave 2 Wave 3 Total
Enrolled Not
Enrolled Enrolled
Not
Enrolled Enrolled
Not
Enrolled Enrolled
Not
Enrolled
2 Miles 8 21 2 8 0 12 10 41
5 Miles 15 16 11 50 16 65 42 131
10 miles 3 21 3 37 6 44 12 102
15 Miles 1 3 0 24 3 12 4 39
20 Miles 0 2 5 8 1 4 6 14
>20 Miles 0 0 4 23 1 5 5 28
Figure 7. Multiple rings buffer from the delivery location
Results showed that for enrolled families (a) in a Distance Threshold of 2800 Meters, the
Moran's Index was 0.027 (Expected Index=-0.013, Variance=0.001) (Figure 8a?). Given the z-
score of 1.236, the pattern does not appear to be significantly different than random (p-

66
value=0.216). However, in the same distance threshold not enrolled families (Figure 8b)
presented a Moran’s Index of 0.0148 (Expected Index= -0.003, Variance= 0.000090). Given the
z-score of 1.885, there is a less than 10% likelihood that this clustered pattern could be the result
of random chance (p-value= 0.059). Further investigations will be necessary to explore other
clustering possibilities such as by sociodemographic characteristics.
Figure 8. Clustered analyses of enrolled not-enrolled families
a. b.
Neighborhood Environment
Nutritional Environment
Figure 9 documents that enrolled families had more access to food resources if they were
in close proximity to Danville city. Families in the Pittsylvania and Caswell counties had fewer
food resources. Enrolled families traveled an average 3.7 miles (±3.7, Range 0-15.7) for their
grocery shopping. Figure 10 is a spider diagram that pictorially represents family residential
distance to grocery store location.

67
Figure 9. Spatial distribution of enrolled families, where families shop, and available food outlets
Figure 10. Spider diagram of family home location and groceries they shop
Pittsylvania County
Caswell County
Henry County
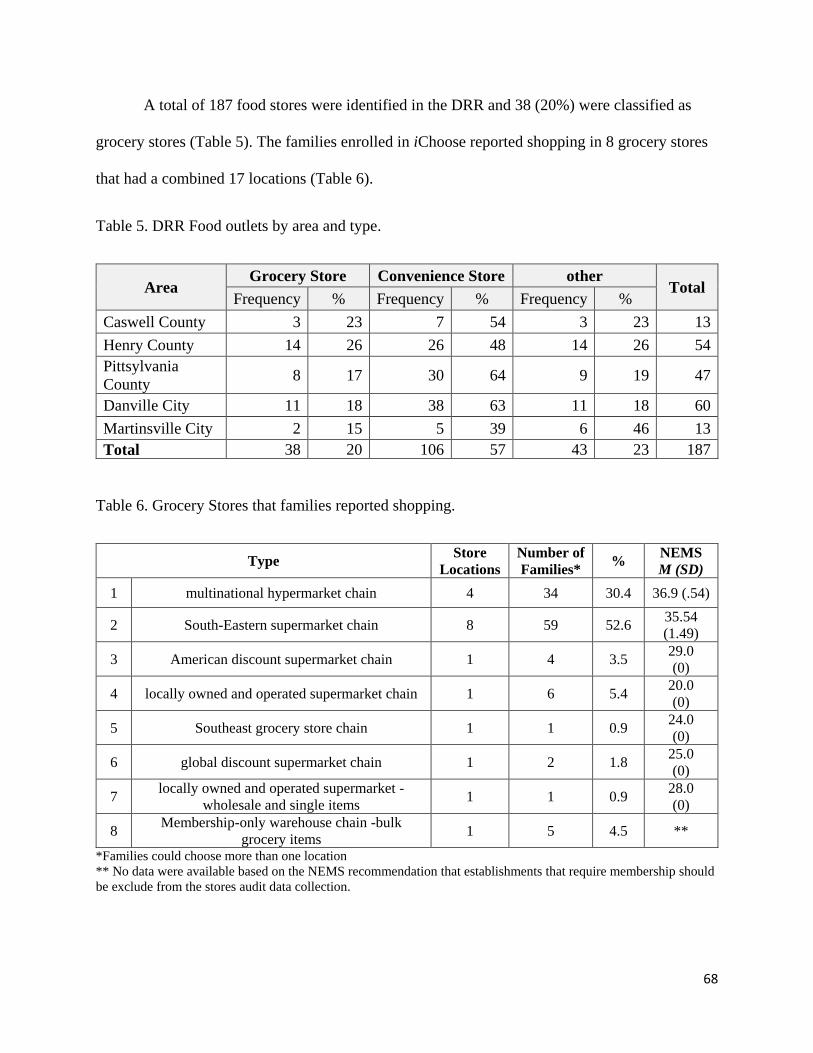
68
A total of 187 food stores were identified in the DRR and 38 (20%) were classified as
grocery stores (Table 5). The families enrolled in iChoose reported shopping in 8 grocery stores
that had a combined 17 locations (Table 6).
Table 5. DRR Food outlets by area and type.
Area Grocery Store Convenience Store other
Total Frequency % Frequency % Frequency %
Caswell County 3 23 7 54 3 23 13
Henry County 14 26 26 48 14 26 54
Pittsylvania
County 8 17 30 64 9 19 47
Danville City 11 18 38 63 11 18 60
Martinsville City 2 15 5 39 6 46 13
Total 38 20 106 57 43 23 187
Table 6. Grocery Stores that families reported shopping.
Type Store
Locations
Number of
Families* %
NEMS
M (SD)
1 multinational hypermarket chain 4 34 30.4 36.9 (.54)
2 South-Eastern supermarket chain 8 59 52.6 35.54
(1.49)
3 American discount supermarket chain 1 4 3.5 29.0
(0)
4 locally owned and operated supermarket chain 1 6 5.4 20.0
(0)
5 Southeast grocery store chain 1 1 0.9 24.0
(0)
6 global discount supermarket chain 1 2 1.8 25.0
(0)
7 locally owned and operated supermarket -
wholesale and single items 1 1 0.9
28.0
(0)
8 Membership-only warehouse chain -bulk
grocery items 1 5 4.5 **
*Families could choose more than one location
** No data were available based on the NEMS recommendation that establishments that require membership should
be exclude from the stores audit data collection.

69
In the 400-meter buffer, 74% of families didn’t have any type of food outlet within
walking distance (M=.66±1.61), and only 2 families had a grocery store (M=.023±.15). Sixteen
percent of families had a corner store (M=.22±.54), however corner stores (n=13) had a
significant (p<.05) lower availability of health options (M=.06±3.8), price (M=2.2±0.8), quality
(M=3±0) and overall NEMS score (M=5.8±5.2). In a 1600-meter buffer (Table 7), 30% of
families didn’t have any type of food outlet (M=.66±1.61), 53% didn’t have any grocery store
(M=.023±.15), and 47% had fast food outlets (M=.06±.32). Characteristics of grocery stores
from the 1600-meter buffer were significant lower in availability, price and overall NEMS score
than those where families reported actually shopping (NEMS).
Table 7. Grocery Stores from the Neighborhoods compared to families reported shopping.
Variable Neighborhood (1600m buffer)
Grocery store where the family
shops
Mean Std. Deviation Mean Std. Deviation
Availability 20.74** 5.53 27.13** 3.50
Price 0.73* 1.81 1.56* 1.71
Quality 5.97 0.16 6.00 0.0
NEMS score 27.05** 6.46 34.69** 4.43 Note: Higher scores indicate greater availability and better quality, and lower prices for healthful options compared to “regular”
choices.* p<.05 ** p<.001
The multiple regression models including neighborhood nutritional environment
predictors did not explain significant variance in changes in outcomes. There were no
statistically significant (p < .05) relationships between fruit and vegetable consumption or BMI
z-score change from baseline to post-intervention.
PA Environment
A total of 117 physical activity outlets were identified in the DRR. Figure 11 shows that
Danville city has a higher number of PA resources than Pittsylvania and Caswell counties. The
majority of resources were schools or parks (Table 8). Physical activity outlets in the study area

70
presented, on average, poor features (M=0.5±.33), limited amenities (M=1.15±.52), and high
incivilities (M=0.21±6.4).
Figure 12. PA resources and home location of families enrolled.
Table 8. DRR Physical Activity outlets by type and area.
Area
Fitness
club Park
Sport
facility Trail
Community
Center School Combination
Total
n % n % n % n % n % n % n %
Caswell
County - - 1 12 - - - - - - 7 88 - - 8
Henry
County 1 3 11 32 1 3 1 3 3 9 18 51 - - 35
Pittsylvania
County - - 3 17 1 5 - - - 14 78 - - - 18
Danville
City 2 5 17 44 2 5 - - 7 18 10 26 1 2 39
Martinsville
City 3 18 13 76 - - - - 1 6 - - - - 17
Total 6 5 45 39 4 3 1 1 11 9 49 42 1 1 117

71
The majority (70%) of families didn’t had any PA resources located within 400 meters of
their home (M=.31±.49). Those that did included resources rated as having poor features
(M=.38±.22), limited amenities (M=1.01±.35), and high incivilities (M=1.5±6.4). Additionally,
36% of families did not have a PA resource within 1600 meters of their home (M=2.8±3.0).
Similarly, the PA resources that were available were rated as having poor features (M=.43±.14)
and limited amenities (M=1.11±.27). Characteristics of PA resources from both the 400-meter
and the 1600-meter buffer were not significantly different from each other or from the overall
DDR area. The multiple regression models did not explain variance in weekly minutes of
moderate and vigorous physical activity or BMI z-scores change from baseline to post-
intervention.
DISCUSSION
The purpose of this study was to examine the potential role of neighborhood
environments on changes in child physical activity, eating, and weight status as the result of a
childhood obesity treatment intervention. The findings add to the literature related to the
geographic clustering of families that enroll in a childhood obesity intervention, the choice of
grocery shopping based on price and food quality rather than proximity, and the overall lack of
PA resources for program participants. However, we did not find that neighborhood
environmental variables were significantly related to changes in child weight status.
Assessment of sociodemographic characteristics and comparisons between enrolled and
non-enrolled eligible families suggested that the sample was representative of the low income
levels of the region, but was over represented with African American families. This latter lack of
representativeness was interpreted as a positive outcome based on the disproportionate impact
obesity has on African American populations [132]. Additionally, few studies report the

72
representativeness of the study sample [149] and typically racial minorities are under-represented
in research [151].
Geographic accessibility is a complex relationship between the spatial separation of
people from health-supporting resources—and this separation may be related to poorer health
outcomes [152] across different types of health interventions [153]. Still, there remains limited
quantitative information regarding its impact [154]. Our findings suggest that spatial separation
may not be a primary driver in a small geographic region where families choose to shop at
grocery locations that provide higher quality or less expensive foods when compared to locations
closer to the participants’ home. Conversely, spatial analysis of nearness indicates that both
contacted and enrolled families seem to be concentrated in the main city area from where
intervention was delivered in which more than 80% of enrolled families for all iChoose waves
were located at a 10 miles from the delivery while not enrolled were from more than that
distance from the delivery location. Location is essential to delivery of interventions; not
surprisingly, the World Health Organization (WHO) has been involved in a number of initiatives
using GIS to perform analysis to provide guidelines and tools to improve physical access to
specific health interventions worldwide [152]. When added to previous literature, our findings
suggest that spatial distance is important for where intervention services are provided, but may
not be as important for grocery store locations when families will travel past lower quality
resources to access higher quality food.
A systematic review [155, 156] of neighborhood differences in food and physical activity
outlets revealed that poor access was most often related to less healthful behaviors for residents
of low-income, minority, and rural neighborhoods. However, a previous study by block group in
the DRR showed that there were no differences in the number of food or PA outlets by income or

73
race [141]. Nutritional neighborhood environment analyses revealed that families participating in
the iChoose have more access to food resources at close proximity in the main city area
compared to counties. In walkable distance (400m) we found none or lower food resources,
including groceries and fast-food, however, fast-food outlets count were higher in a short
drivable distance (1600m). However, food resources were significantly lower in availability,
price and overall NEMS score than the ones families reported shopping at, which could explain
why families traveled an average 3.7 miles, sometimes even going to a different county. Also,
the majority of families participating in the intervention prefer to shop in a larger type of grocery
store, such as a supermarket. Consistent with studies of nutritional environment in which the
assumption is that a supermarket is the most reliable means to variety and quality at a reasonable
price [157]. An important point was that although the NEMS characteristics of grocery stores
were considerably lower for availability, quality and price, our sample still presented higher
scores than the ones found in the literature for both high and low income areas [145]. Physical
activity neighborhood environment revealed similar patterns as analysis of nutritional results for
distribution and access. However, characteristics of physical activity outlets from both the 400m
and the 1600m neighborhoods around homes were considered poor quality in all aspects and had
no difference from each other or from the overall DDR area.
Environmental influences are important contributors to childhood obesity [1, 2] and
weight gain in children has been linked to food and physical activity environment [87]. Even
though, our study did not find any nutritional or physical activity neighborhood factors
predicting change in child BMI z-scores, fruit and vegetable consumption, or minutes of
moderate to vigorous physical activity , similar results have been found by Burdette and
colleagues [158] where neighborhood proximity to playgrounds and fast food restaurants was not
74
associated with child overweight in an urban low-income population. It may be due to the fact
that childhood obesity is a complex and multifaceted issue [3, 4], which is influenced by
individual-level choices as well as a number of broader social and environmental factors [6] and
intricate interactions [4].
CONCLUSION
Spatial analysis techniques used to provide more information about obesity at the
neighborhood level showed to be feasible, and the use of mapping as a visualization tool aided in
efforts to communicate and better understand the results of the analysis that otherwise could not
been seen by tabular analysis. Results contribute to previous efforts in the region to understand
and explore the potential influence of the food and physical activity resource environment. Of
particular importance this study aided to better understanding of how neighborhood factors
impacted intervention reach but not effectiveness. Spatial analysis of both representativeness and
enrollment showed that geographic location is important when delivering an intervention in a
disparate rural community. However, any neighborhood environmental factors accessed were not
related to child changes in physical activity, eating, and weight as we hypothesized. Our study
did not find any nutritional or physical activity neighborhood factor that predicts change in child
outcomes of a family-based obesity intervention. Future research should investigate further other
obesogenic factors that influence families’ nutrition and physical activity choices, rather than the
food and PA neighborhood environment, especially those that could be more easily modifiable
and widely promoted to a large proportion of the community. Nutritional environment has been
identified to be realistic to presence of food outlets for rural area, however presented a higher
availability of quality food at reasonable prices. Both high quality level for groceries where
families shop and low for PA resources could explain why it did were predictors of intervention

75
change in child outcomes. Therefore could be a potential point different interventions/strategies
may be more appropriate/effective in different areas aiming change in built environment
intervention.
The attempt to measure the obesogeneity of neighborhood environments involved several
complex tasks beyond the scope of this study. Thus, future investigations could test several
different variables in a simulation sensitivity analysis to provide different practical scenarios to
rank environments with regard to children’s intervention outcomes. Finally, concerns may be rise
about preserving the confidentiality of participants’ individual records containing sensitive
information (i.e. home location), while also preserving, to the maximum degree possible, the
geographic properties of the data. In this study we used broad scale maps to mask individual-
level data to assure data validity as well protect participants’ identities while permitting many
important geographically-based analyses.

76
GENERAL CONCLUSIONS
The social ecological perspective allow us to consider different factors and levels of
influence of complex issues [21, 135] such as childhood obesity. Accordingly, the studies of this
dissertation draw upon a social ecological model that acknowledges those multiple levels of
human interaction and represents a comprehensive approach to evaluating different aspects of a
childhood obesity intervention which target multiple influences on health behaviors. This
includes the development of materials that clearly communicate multiple program objectives and
strategies, and the home and neighborhood environmental influences in children’s health
behaviors and weight status in a family-based childhood obesity treatment intervention.
The first aspect of the social ecological model (SEM) investigated in this dissertation was
related to an individuals’ ability to clearly understand the messages and strategies proposed, and
successfully apply key components of the intervention. Thus, materials developed and used in
the intervention need to clearly communicate its messages while being culturally appropriate for
the target population [12, 14]. Study 1 focused on the development of evidence-based materials
that were clear, concise and culturally relevant to participants, so can they could better
comprehend and retain information and strategies leading them to action to improve health
behaviors. Results of our iterative and systematic approach to conduct a formative evaluation
that involved academic-community partners and parents showed promising results regarding the
improvement of study materials for clear communication. This process led to materials with
appropriate reading level and proper clarity of messages, which are culturally suitable and rated
as highly satisfactory by the parents of participants in the intervention. Future studies need to

77
further investigate whether these materials lead to greater adherence to the proposed intervention
strategies.
The second aspect of SEM that this dissertation investigated in study 2 was to understand
the influence of the home media environment on children’s weight status. In particular, this
intervention used culturally relevant and suitable materials that clearly communicated messages
in order to better present strategies in how to improve the home media environment to promote
healthful behaviors regarding eating and physical activity. These strategies included a home
environment behavior change element related to media that targeted parental policy changes to
media usage in the home including reduction on screen time and improving availability of
exercise opportunities at home. Results suggest that the intervention was effective in improving
certain aspects of the home media environment. More specifically, families were less likely to
eat dinner in front of the TV, and parents reported reducing child’s TV watching time and
increasing the availability of exercise equipment in the TV viewing area by the end of the
intervention. Further, results showed that reducing child reported screen time across all media
and avoiding that they eat in front of the TV were associated with a higher reduction in their
BMI z-scores among those that made the greatest improvement in those areas. These results
demonstrate the promise of culturally relevant and suitable materials that clearly communicate
messages in providing information that are effective in changing the home media environment,
and these changes may potentially lead to greater weight loss. Future studies still need to
investigate others aspects of the home environment to better understand how these complex
components may influence overall weigh change among children.
While these changes to the home media environment hold promise to addressing
children’s weight status within their own home, children’s and parents’ health behaviors are still

78
influenced by larger environmental factors [2]. The third study of this dissertation sought to
better understand the influence of this broader aspect of the SEM on (a) children’s family
enrollment in a childhood obesity treatment program and (b) on children’s weight status. The
reach of an intervention is of utmost importance to its overall impact [128]. In other words, if
childhood treatment programs do not reach those who are most vulnerable and most at risk, its
overall public health impact will be limited. Our results, suggest that the location where a
childhood obesity treatment program is offered is of vital importance to its ability to reach those
most in need. In particular, we found that enrolled families were similar to the general population
by income (low) but not race were families enrolled presented higher proportion of black
families than the study area. Spatial analysis of enrollment showed that geographic location was
important when delivering an intervention in a health disparate rural community. More
specifically, both contacted and enrolled families seem to be concentrated within the main city
area where the intervention was delivered. More than 80% of enrolled families for all waves
lived within 10 miles of the delivery location, while families that did not enroll were more likely
to live much further away.
Additionally, once families enroll in a childhood obesity treatment program, their ability
to understand, follow, and engage in the strategies presented are key to their success in the
program [5]. Studies 1 and 2 of this dissertation demonstrated that an iterative, systematic,
participatory approach to the development of culturally relevant and literacy appropriate
intervention materials is feasible, leads to more parental satisfaction and has the potential to
improve the home media environment of these families. However, families can only engage in
healthier nutrition and physical activity behaviors if those opportunities are available to them [3].
The third study of this dissertation sought to investigate how the availability and quality of these

79
resources may influence children’s weight status. The food outlets closest to participant’s homes
were considered to have the worst quality in all aspects and this may have contributed to their
decision as to where to shop for food. Results indicated that families tended to bypass those
outlets closest to them and traveled on average 4 miles from their home to shop at higher quality
outlets. Additionally, families had very little access to high quality physical activity resources
close to their homes. Although these results were not associated with children’s overall change in
weight status, these are important factors to be considered by future interventions.
Finally, the results of these 3 studies demonstrate the importance that different aspects of
the social ecological model have on individual health behavior, in particular as it relates to
complex behaviors associated with childhood obesity. First, an individual’s ability to
comprehend, follow and engage in evidence-based strategies presented by an intervention is
heavily influenced by the cultural relevance, literacy appropriateness and clarity of the materials
and strategies presented [14]. An iterative, systematic participatory process holds promise to
developing such materials (study 1). Second, these culturally relevant and literacy appropriate
clear materials demonstrated effectiveness in improving certain aspects of the home media
environment (study 2), while also leading to an improvement in children’s weight status (study
2). Third, families can only participate and benefit from childhood treatment interventions if they
have access to them (study 3). Our results indicated that those at greater risk (i.e. Black families)
and most vulnerable (i.e. low income) in the study catchment areas enrolled in the program,
demonstrating the influence of location and access on families’ ability to join childhood obesity
treatment programs. Furthermore, to engage and follow the strategies promoted by these
interventions families need to have access to those resources (study 3). Most of the families
participating in the program had to travel farther to have access to quality food outlets (study 3),

80
and practically none had access to quality physical activity outlets in their walkable or drivable
neighborhood (study 3). In conclusion, changes in the home media environment seem to lead to
improvement in children’s weight status; however these changes can be influenced by the
parent’s ability to comprehend and engage with culturally relevant and literacy appropriate
materials, while having access to the location where these programs are offered and the
nutritional and physical activity resources needed to successfully engage in said behaviors.
Successful childhood obesity treatment programs must consider all of these factors in order to
have the greatest impact on children’s weight status.

81
REFERENCES
1. Hill, J.O., et al., Obesity and the environment: where do we go from here? Science, 2003. 299(5608): p. 853-855.
2. Sallis, J.F. and K. Glanz, Physical activity and food environments: solutions to the obesity epidemic. Milbank Quarterly, 2009. 87(1): p. 123-154.
3. Dehghan, M., N. Akhtar-Danesh, and A.T. Merchant, Childhood obesity, prevalence and prevention. Nutrition journal, 2005. 4(1): p. 24.
4. Huang, T.T.-K. and T.A. Glass, Transforming research strategies for understanding and preventing obesity. Jama, 2008. 300(15): p. 1811-1813.
5. Baur, C. and C. Prue, The CDC Clear Communication Index is a new evidence-based tool to prepare and review health information. Health Promot Pract, 2014. 15(5): p. 629-37.
6. Lytle, L.A., Examining the etiology of childhood obesity: The IDEA study. American journal of community psychology, 2009. 44(3-4): p. 338-349.
7. McCormack, L., et al., Measuring health literacy: a pilot study of a new skills-based instrument. Journal of health communication, 2010. 15(S2): p. 51-71.
8. Centers for Medicare and Medicaid Services. Toolkit for Making Written Material Clear and Effective. [cited 2013 Sep. 25]; Available from: http://www.cms.gov/Outreach-and-Education/Outreach/WrittenMaterialsToolkit/index.html?redirect=/WrittenMaterialsToolkit/.
9. U.S. Department of Health and Human Services and Office of Disease Prevention and Health Promotion. Health literacy improvement. [cited 2013 Sep. 20]; Available from: http://www.health.gov/communication/literacy/default.htm.
10. Paasche‐Orlow, M.K., et al., The prevalence of limited health literacy. J Gen Intern Med, 2005. 20(2): p. 175-184.
11. Zahnd, W.E., S.L. Scaife, and M.L. Francis, Health literacy skills in rural and urban populations. Am J Health Behav, 2009. 33(5): p. 550-557.
12. Wilson, D.K., New perspectives on health disparities and obesity interventions in youth. J Pediatr Psychol, 2009: p. jsn137.
13. Strolla, L.O., K.M. Gans, and P.M. Risica, Using qualitative and quantitative formative research to develop tailored nutrition intervention materials for a diverse low-income audience. Health education research, 2006. 21(4): p. 465-476.
14. Health, U.D.o. and H. Services, Making health communication programs work. NIH publication, 1992(92-1493).
15. Zoellner, J., et al., Engaging the Dan River Region to reduce obesity: application of the Comprehensive Participatory Planning and Evaluation process. Family & community health, 2012. 35(1): p. 44-56.
16. Motley, M., et al., Evaluating Community Capacity to Address Obesity in the Dan River Region: A Case Study. American journal of health behavior, 2013. 37(2): p. 208-217.
17. Bright Bodies. [cited 2015 July. 20]; Available from: www.brightbodies.org. 18. Medicare, C.f. and M. Services, Toolkit for making written material clear and effective. 2010:
Centers for Medicare & Medicaid Services, US Department, of Health & Human Resources. 19. plainlanguage.gov. Federal Plain Language Guidelines 2010; Available from:
http://www.plainlanguage.gov/. 20. Estabrooks PA, et al., Selection of an evidence-based pediatric weight management program in a
health disparate region: A CBPR case study., in Annual Meeting of the North American Primary Care Research Group. 2014: New York, NY.

82
21. Sallis, J.F., N. Owen, and E.B. Fisher, Ecological models of health behavior. Health behavior and health education: Theory, research, and practice, 2008. 4: p. 465-486.
22. Glanz, K. and D.B. Bishop, The role of behavioral science theory in development and implementation of public health interventions. Annual review of public health, 2010. 31: p. 399-418.
23. Golan, M. and A. Weizman, Familial approach to the treatment of childhood obesity: conceptual model. Journal of nutrition education, 2001. 33(2): p. 102-107.
24. Van der Horst, K., et al., A systematic review of environmental correlates of obesity-related dietary behaviors in youth. Health education research, 2007. 22(2): p. 203-226.
25. Krebs, N.F., et al., Assessment of child and adolescent overweight and obesity. Pediatrics, 2007. 120(Supplement 4): p. S193-S228.
26. Stokols, D., Toward a science of transdisciplinary action research. American journal of community psychology, 2006. 38(1-2): p. 63-77.
27. Hill, J.L., W. You, and J.M. Zoellner, Disparities in obesity among rural and urban residents in a health disparate region. BMC public health, 2014. 14(1): p. 1051.
28. Health, U.D.o., et al., National action plan to improve health literacy. Washington, DC: Department of Health and Human Services, 2010.
29. Parker, R.M., et al., Health literacy-Report of the Council on Scientific Affairs. Jama-Journal of the American Medical Association, 1999. 281(6): p. 552-557.
30. Kutner, M., et al., Literacy in Everyday Life: Results from the 2003 National Assessment of Adult Literacy. NCES 2007-490. National Center for Education Statistics, 2007.
31. (NIH), N.I.o.H. Clear Communication. 2015 [cited 2016 Feb. 9]; Available from: http://www.nih.gov/clearcommunication/.
32. CDC Office of the Associate Director for Communication (OADC). Clear Communication Index User Guide. 2013 [cited 2013 Sep. 20]; Available from: http://www.cdc.gov/healthcommunication/ClearCommunicationIndex/ClearCommunicationUserGuideMay2013.pdf
33. Brach, C., et al., Ten attributes of health literate health care organizations. 2012: Institute of Medicine of the National Academies.
34. Koh, H.K., et al., New federal policy initiatives to boost health literacy can help the nation move beyond the cycle of costly ‘crisis care’. Health Affairs, 2012: p. 10.1377/hlthaff. 2011.1169.
35. Maibach EW, Rothschild ML, and N. WD, Social marketing. , in Health behavior and health education: theory, research and practice., Glanz K, Rimer BK, and L. FM, Editors. 2002, Jossey-Bass: San Francisco (CA). p. 437–461.
36. Glanz, K. and B.K. Rimer, Theory at a glance: A guide for health promotion practice. 1997: US Dept. of Health and Human Services, Public Health Service, National Institutes of Health, National Cancer Institute.
37. Oettinger, M.D., et al., Color-coding improves parental understanding of body mass index charting. Academic pediatrics, 2009. 9(5): p. 330-338.
38. Rothman, R.L., et al., Patient understanding of food labels: the role of literacy and numeracy. American journal of preventive medicine, 2006. 31(5): p. 391-398.
39. Huizinga, M.M., et al., Literacy, Numeracy, and Portion-Size Estimation Skills. American journal of preventive medicine, 2009. 36(4): p. 324-328.
40. Ben-Joseph, E.P., S.A. Dowshen, and N. Izenberg, Do parents understand growth charts? A national, internet-based survey. Pediatrics, 2009. 124(4): p. 1100-1109.
41. Sanders, L.M., et al., Literacy and child health: a systematic review. Arch Pediatr Adolesc Med, 2009. 163(2): p. 131-140.

83
42. Ross, L., et al., Child and parental mental ability and glycaemic control in children with Type 1 diabetes. Diabetic Med, 2001. 18(5): p. 364-369.
43. Sanders, L., et al. Low parent health literacy is associated with poor glycemic control in children with type 1 diabetes mellitus. in Pediatric Academic Societies Meeting. 2008.
44. Chari, R., et al., Association between health literacy and child and adolescent obesity. Patient Educ Couns, 2014. 94(1): p. 61-66.
45. Savoye, M., et al., Long-term results of an obesity program in an ethnically diverse pediatric population. Pediatrics, 2011: p. peds. 2010-0697.
46. Savoye, M., et al., Effects of a weight management program on body composition and metabolic parameters in overweight children: a randomized controlled trial. Jama, 2007. 297(24): p. 2697-2704.
47. Estabrooks, P.A., et al., Automated telephone counseling for parents of overweight children: a randomized controlled trial. American journal of preventive medicine, 2009. 36(1): p. 35-42. e2.
48. Epstein, L.H., et al., Increasing fruit and vegetable intake and decreasing fat and sugar intake in families at risk for childhood obesity. Obesity research, 2001. 9(3): p. 171-178.
49. White, R.O., et al., A health literate approach to the prevention of childhood overweight and obesity. Patient education and counseling, 2013. 93(3): p. 612-618.
50. Israel, B., et al., eds. Methods in Community-Based Participatory Research for Health. Second ed. 2013, Jossey-Bass: San Francisco.
51. Doak, C., L. Doak, and J. Root, Suitability assessment of materials (SAM). Washington DC, 1994. 52. Virginia Department of Health, Virginia Medically Underserved Areas (VMUA), D.o.P.C.a.R.
Health, Editor. 2012. 53. Virginia Department of Health, Spatial Analysis and High Priority Target Areas, Minority Health
and Health Equity, Editor. 2008. 54. Virginia Department of Health, Virginia Health Statistics Annual Report, Division of Health
Statistics, Editor. 2012. 55. Dan River Partnership for a Healthy Community. DRHealthy Community. 2014; Available from:
http://www.drhealthycommunity.org/. 56. Zakocs, R.C. and E.M. Edwards, What explains community coalition effectiveness? A review of
the literature. American Journal of Preventive Medicine, 2006. 30(4): p. 351-361. 57. Economos, C.D., et al., A community intervention reduces BMI z‐score in children: Shape Up
Somerville first year results. Obesity, 2007. 15(5): p. 1325-1336. 58. Economos, C.D., et al., Shape Up Somerville two-year results: a community-based environmental
change intervention sustains weight reduction in children. Prev Med, 2013. 57(4): p. 322-327. 59. Coleman, K.J., et al., Prevention of the epidemic increase in child risk of overweight in low-
income schools: the El Paso coordinated approach to child health. Arch Pediatr Adolesc Med, 2005. 159(3): p. 217-224.
60. Choudhry, S., et al., Power-up: A collaborative after-school program to prevent obesity in African American children. Prog Community Health Partnersh, 2011. 5(4): p. 363-373.
61. Johnson, R.B. and A.J. Onwuegbuzie, Mixed methods research: A research paradigm whose time has come. Educational researcher, 2004. 33(7): p. 14-26.
62. Jakob, A. On the Triangulation of Quantitative and Qualitative Data in Typological Social Research: Reflections on a Typology of Conceptualizing" Uncertainty" in the Context of Employment Biographies. in Forum Qualitative Sozialforschung/Forum: Qualitative Social Research. 2001.
63. Minkler, M. and N. Wallerstein, Community-based participatory research for health: From process to outcomes. 2011: John Wiley & Sons.

84
64. Fitzsimmons, P., et al., A readability assessment of online Parkinson's disease information. The journal of the Royal College of Physicians of Edinburgh, 2010. 40(4): p. 292.
65. McLaughlin, G., Simple Measure of Gobbledygook Readability Calculator. 2009. 66. Wilson, M., Readability and patient education materials used for low-income populations.
Clinical Nurse Specialist, 2009. 23(1): p. 33-40. 67. Fry, E., A readability formula that saves time. Journal of reading, 1968. 11(7): p. 513-578. 68. Fry, E., Fry's readability graph: Clarifications, validity, and extension to level 17. Journal of
reading, 1977: p. 242-252. 69. Baur, C. The Clear Communication Index: A Research-Based Tool to Reduce Health Literacy
Barriers. in 2012 National Conference on Health Communication, Marketing, and Media. 2012. CDC.
70. Smith, P.T. and C.L. Cason, Suitability of patient education materials for cardiac catheterization. Clinical nurse specialist, 1998. 12(4): p. 140-144.
71. Eysenbach, G., et al., Empirical studies assessing the quality of health information for consumers on the World Wide Web. JAMA: The Journal of the American Medical Association, 2002. 287(20): p. 2691-2700.
72. Shieh, C. and B. Hosei, Printed health information materials: evaluation of readability and suitability. Journal of Community Health Nursing, 2008. 25(2): p. 73-90.
73. Clayton, L.H., Strategies for selecting effective patient nutrition education materials. Nutrition in Clinical Practice, 2010. 25(5): p. 436-442.
74. Weiss, B.D., et al., Quick assessment of literacy in primary care: the newest vital sign. The Annals of Family Medicine, 2005. 3(6): p. 514-522.
75. Osborn, C.Y., et al., Measuring adult literacy in health care: performance of the newest vital sign. American Journal of Health Behavior, 2007. 31(Supplement 1): p. S36-S46.
76. Morgan, D.L. and R.A. Krueger, Focus group kit: Volumes 1-6. 1997, Sage Publications. 77. Morgan, D.L., R.A. Krueger, and J.A. King, Analyzing and reporting focus group results. 1998:
Sage. 78. Krueger, R.A., Focus groups: A practical guide for applied research. 2009: Sage. 79. County Health Rankings & Roadmaps. County Health Rankings - Danville. 2015 [cited 2015
March 30, 2015]; Available from: http://www.countyhealthrankings.org/app/virginia/2015/rankings/danville-city/county/outcomes/overall/snapshot.
80. National Center for Education Statistics, 2003 National Assessment of Adult Literacy, U.S.D.o. Education, Editor.
81. Israel, B.A., et al., Community-based participatory research: policy recommendations for promoting a partnership approach in health research. Education for health, 2001. 14(2): p. 182-197.
82. Gordon-Larsen, P., et al., Five-year obesity incidence in the transition period between adolescence and adulthood: the National Longitudinal Study of Adolescent Health. The American journal of clinical nutrition, 2004. 80(3): p. 569-575.
83. Lee, Y.S., Consequences of childhood obesity. Ann Acad Med Singapore, 2009. 38(1): p. 75-77. 84. Daniels, S.R., The consequences of childhood overweight and obesity. The future of children,
2006. 16(1): p. 47-67. 85. Lobstein, T., L. Baur, and R. Uauy, Obesity in children and young people: a crisis in public health.
Obesity reviews, 2004. 5(s1): p. 4-85. 86. Ogden, C.L., et al., Prevalence of childhood and adult obesity in the United States, 2011-2012.
Jama, 2014. 311(8): p. 806-814.

85
87. Spiegelman, B.M. and J.S. Flier, Obesity and the regulation of energy balance. Cell, 2001. 104(4): p. 531-543.
88. Rothschild, M.L., Carrots, sticks, and promises: a conceptual framework for the management of public health and social issue behaviors. The Journal of Marketing, 1999: p. 24-37.
89. Golan, M. and S. Crow, Targeting Parents Exclusively in the Treatment of Childhood Obesity: Long‐Term Results. Obesity research, 2004. 12(2): p. 357-361.
90. Epstein, L.H., et al., Ten-year follow-up of behavioral, family-based treatment for obese children. Jama, 1990. 264(19): p. 2519-2523.
91. Van Sluijs, E.M., A.M. McMinn, and S.J. Griffin, Effectiveness of interventions to promote physical activity in children and adolescents: systematic review of controlled trials. Bmj, 2007. 335(7622): p. 703.
92. Huang, T.T., et al., A systems-oriented multilevel framework for addressing obesity in the 21st century. Preventing Chronic Disease, 2009. 6(3).
93. Wing, R.R., et al., Behavioral science research in diabetes lifestyle changes related to obesity, eating behavior, and physical activity. Diabetes care, 2001. 24(1): p. 117-123.
94. Rosenkranz, R.R. and D.A. Dzewaltowski, Model of the home food environment pertaining to childhood obesity. Nutrition reviews, 2008. 66(3): p. 123-140.
95. Golan, M., Parents as agents of change in childhood obesity‐from research to practice. International Journal of Pediatric Obesity, 2006. 1(2): p. 66-76.
96. Saelens, B.E., et al., Obesogenic neighborhood environments, child and parent obesity: the Neighborhood Impact on Kids study. American journal of preventive medicine, 2012. 42(5): p. e57-e64.
97. Timperio, A., et al., Family physical activity and sedentary environments and weight change in children. International Journal of Pediatric Obesity, 2008. 3(3): p. 160-167.
98. Van Zutphen, M., et al., Association between the family environment and television viewing in Australian children. Journal of paediatrics and child health, 2007. 43(6): p. 458-463.
99. Dennison, B., et al. Television viewing by preschool children is associated with obesity. in Obesity Research. 2000. NORTH AMER ASSOC STUDY OBESITY C/O DR MICHAEL JENSEN, MAYO MEDICAL CENTER, MAYO CLIN 200 FIRST ST, SW, ROCHESTER, MN 55905 USA.
100. Liao, Y., et al., Which type of sedentary behaviour intervention is more effective at reducing body mass index in children? A meta‐analytic review. Obesity Reviews, 2014. 15(3): p. 159-168.
101. Tremblay, M.S., et al., Systematic review of sedentary behaviour and health indicators in school-aged children and youth. Int J Behav Nutr Phys Act, 2011. 8(1): p. 98.
102. Rennie, K.L., L. Johnson, and S.A. Jebb, Behavioural determinants of obesity. Best Practice & Research Clinical Endocrinology & Metabolism, 2005. 19(3): p. 343-358.
103. Epstein, L.H., et al., Effects of manipulating sedentary behavior on physical activity and food intake. The Journal of pediatrics, 2002. 140(3): p. 334-339.
104. DeMattia, L., L. Lemont, and L. Meurer, Do interventions to limit sedentary behaviours change behaviour and reduce childhood obesity? A critical review of the literature. obesity reviews, 2007. 8(1): p. 69-81.
105. Pinard, C.A., et al., Measures of the home environment related to childhood obesity: a systematic review. Public health nutrition, 2012. 15(01): p. 97-109.
106. Pinard, C.A., et al., The validity and reliability of the Comprehensive Home Environment Survey (CHES). Health promotion practice, 2014. 15(1): p. 109-117.
107. Rideout, V.J., U.G. Foehr, and D.F. Roberts, Generation M [superscript 2]: Media in the Lives of 8-to 18-Year-Olds. Henry J. Kaiser Family Foundation, 2010.
108. Schneider, M., G.F. Dunton, and D.M. Cooper, Media use and obesity in adolescent females. Obesity, 2007. 15(9): p. 2328-2335.

86
109. Melkevik, O., et al., Are associations between electronic media use and BMI different across levels of physical activity? BMC Public Health, 2015. 15(1): p. 1-10.
110. Borzekowski, D.L. and T.N. Robinson, The remote, the mouse, and the no. 2 pencil: the household media environment and academic achievement among third grade students. Archives of Pediatrics & Adolescent Medicine, 2005. 159(7): p. 607-613.
111. Dunton, G.F., et al., Physical environmental correlates of childhood obesity: a systematic review. Obesity Reviews, 2009. 10(4): p. 393-402.
112. Kann, L., et al., Youth risk behavior surveillance—United States, 2013. MMWR Surveill Summ, 2014. 63(Suppl 4): p. 1-168.
113. Brown, A., Media use by children younger than 2 years. Pediatrics, 2011. 128(5): p. 1040-1045. 114. Christakis, D.A., et al., Television, video, and computer game usage in children under 11 years of
age. The Journal of pediatrics, 2004. 145(5): p. 652-656. 115. Dennison, B.A. and L.S. Edmunds, The role of television in childhood obesity. Progress in Pediatric
Cardiology, 2008. 25(2): p. 191-197. 116. Reidpath, D.D., et al., An ecological study of the relationship between social and environmental
determinants of obesity. Health & place, 2002. 8(2): p. 141-145. 117. Glanz, K., et al., Healthy nutrition environments: concepts and measures. American Journal of
Health Promotion, 2005. 19(5): p. 330-333. 118. Singh, G.K., M. Siahpush, and M.D. Kogan, Neighborhood socioeconomic conditions, built
environments, and childhood obesity. Health affairs, 2010. 29(3): p. 503-512. 119. Kipke, M.D., et al., Food and park environments: neighborhood-level risks for childhood obesity
in east Los Angeles. Journal of Adolescent Health, 2007. 40(4): p. 325-333. 120. Papas, M.A., et al., The built environment and obesity. Epidemiologic reviews, 2007. 29(1): p.
129-143. 121. Veugelers, P., et al., Neighborhood characteristics in relation to diet, physical activity and
overweight of Canadian children. International Journal of Pediatric Obesity, 2008. 3(3): p. 152-159.
122. Cullen, K.W., et al., Availability, accessibility, and preferences for fruit, 100% fruit juice, and vegetables influence children's dietary behavior. Health Education & Behavior, 2003. 30(5): p. 615-626.
123. Evenson, K.R., et al., Girls’ perception of neighborhood factors on physical activity, sedentary behavior, and BMI. Obesity, 2007. 15(2): p. 430-445.
124. Spence, J.C., et al., Influence of neighbourhood design and access to facilities on overweight among preschool children. International Journal of Pediatric Obesity, 2008. 3(2): p. 109-116.
125. Hume, C., J. Salmon, and K. Ball, Associations of children's perceived neighborhood environments with walking and physical activity. American Journal of Health Promotion, 2007. 21(3): p. 201-207.
126. Alton, D., et al., Relationship between walking levels and perceptions of the local neighbourhood environment. Archives of disease in childhood, 2007. 92(1): p. 29-33.
127. Tucker, P., J. Gilliland, and J.D. Irwin, Splashpads, swings, and shade: parents' preferences for neighbourhood parks. Canadian Journal of Public Health/Revue Canadienne de Sante'e Publique, 2007: p. 198-202.
128. Glasgow, R.E., T.M. Vogt, and S.M. Boles, Evaluating the public health impact of health promotion interventions: the RE-AIM framework. American Journal of Public Health, 1999. 89(9): p. 1322-1327.
129. King, D.K., R.E. Glasgow, and B. Leeman-Castillo, Reaiming RE-AIM: using the model to plan, implement, and evaluate the effects of environmental change approaches to enhancing population health. American Journal of Public Health, 2010. 100(11): p. 2076-2084.

87
130. Zoellner, J., et al., Engaging the Dan River Region to reduce obesity: application of the Comprehensive Participatory Planning and Evaluation process. Fam Community Health, 2012. 35(1): p. 44-56.
131. Hill JL, S.L., Chau C., Kolivras K, , Exploring the relationship between proximity to outlets, physical activity and BMI using an environmental justice framework. Under Review Oct. 2014.
132. Hill, J., et al., Does availability of physical activity and food outlets differ by race and income? Findings from an enumeration study in a health disparate region. International Journal of Behavioral Nutrition and Physical Activity, 2012. 9(1): p. 105.
133. Reifsnider, E., M. Gallagher, and B. Forgione, Using ecological models in research on health disparities. Journal of Professional Nursing, 2005. 21(4): p. 216-222.
134. Stokols, D., Establishing and maintaining healthy environments: toward a social ecology of health promotion. American Psychologist, 1992. 47(1): p. 6.
135. Stokols, D., Translating social ecological theory into guidelines for community health promotion. American journal of health promotion, 1996. 10(4): p. 282-298.
136. Prevention, C.f.D.C.a. Youth Risk Behavior Surveillance System. 2013 [cited 2015 March 30, 2015]; Available from: http://www.cdc.gov/healthyyouth/npao/data.htm.
137. Jago, R., et al., Observed Environmental Features and the Physical Activity of Adolescent Males. American Journal of Preventive Medicine. 29(2): p. 98-104.
138. Colabianchi, N., et al., Towards an understanding of salient neighborhood boundaries: adolescent reports of an easy walking distance and convenient driving distance. International Journal of Behavioral Nutrition and Physical Activity, 2007. 4(1): p. 1-4.
139. Bader, M.D.M., et al., Disparities in Neighborhood Food Environments: Implications of Measurement Strategies. Economic Geography, 2010. 86(4): p. 409-430.
140. Hill, J., et al., Exploring the relationship between proximity to outlets, physical activity and BMI using an environmental justice framework. Journal of Rural Health, Under review.
141. Hill, J.L., et al., Does availability of physical activity and food outlets differ by race and income? Findings from an enumeration study in a health disparate region. International Journal of Behavioral Nutrition and Physical Activity, 2012. 9(1): p. 105.
142. Chau, C.N., J.M. Zoellner, and J.L. Hill, Availability of Healthy Food: Does Block Group Race and Income Matter? Journal of Hunger & Environmental Nutrition, 2013. 8(1): p. 22-38.
143. CN, C., Z. JM, and H. JL, A picture of the food environment in a rural, health disparate region. J Hunger Environ Nutr, 2013. 8: p. 22-38.
144. Hill, J.L., et al., Lack of Healthy Food Options on Children’s Menus of Restaurants in the Health-Disparate Dan River Region of Virginia and North Carolina, 2013. Preventing chronic disease, 2015. 12.
145. Glanz, K., et al., Nutrition Environment Measures Survey in stores (NEMS-S): development and evaluation. American journal of preventive medicine, 2007. 32(4): p. 282-289.
146. Saelens, B.E., et al., Nutrition Environment Measures Study in restaurants (NEMS-R): development and evaluation. American Journal of Preventive Medicine, 2007. 32(4): p. 273-281.
147. Lee, R., et al., The Physical Activity Resource Assessment (PARA) instrument: Evaluating features, amenities and incivilities of physical activity resources in urban neighborhoods. International Journal of Behavioral Nutrition and Physical Activity, 2005. 2(1): p. 13.
148. Godin, G. and R.J. Shephard, A simple method to assess exercise behavior in the community. Can J Appl Sport Sci, 1985. 10(3): p. 141-6.
149. RE-AIM. Reach, Effectiveness, Adoption, Implementation, Maintenance (RE-AIM) website. March 21, 2015]; Available from: http://www.re-aim.hnfe.vt.edu/index.html.
150. Anselin, L., An introduction to spatial autocorrelation analysis with GeoDa. Spatial Analysis Laboratory, University of Illinois, Champagne-Urbana, Illinois, 2003.

88
151. Harris, K.J., et al., Successful recruitment of minorities into clinical trials: The Kick It at Swope project. Nicotine & Tobacco Research, 2003. 5(4): p. 575-584.
152. Black, M., et al., Using GIS to measure physical accessibility to health care. World Health Organization, 2004: p. 3-4.
153. Shengelia, B., C.J. Murray, and O.B. Adams, Beyond access and utilization: defining and measuring health system coverage. Health systems performance assessment: debates, methods and empiricism. Geneva: World Health Organization, 2003: p. 221-34.
154. Guagliardo, M.F., Spatial accessibility of primary care: concepts, methods and challenges. International journal of health geographics, 2004. 3(1): p. 1.
155. Larson, N.I., M.T. Story, and M.C. Nelson, Neighborhood environments: disparities in access to healthy foods in the US. American journal of preventive medicine, 2009. 36(1): p. 74-81. e10.
156. Gordon-Larsen, P., et al., Inequality in the built environment underlies key health disparities in physical activity and obesity. Pediatrics, 2006. 117.
157. Wrigley, N., D. Warm, and B. Margetts, Deprivation, diet, and food-retail access: Findings from the Leeds ‘food deserts' study. Environment and Planning A, 2003. 35(1): p. 151-188.
158. Burdette, H.L. and R.C. Whitaker, Neighborhood playgrounds, fast food restaurants, and crime: relationships to overweight in low-income preschool children. Preventive medicine, 2004. 38(1): p. 57-63.

89
APPENDIX A: Institutional Review Board (IRB) Letter of Approval

90
APPENDIX B: Study’s Logic Model - Social Ecological Perspective

91
APPENDIX C: Focus Group Protocol and Semi-structure Script
FOCUS GROUP PROTOCOL
This protocol was developed to provide consistent guidelines for data collection within the POPS
Program who plan to conduct focus groups.
There are three phases to conducting our focus group and these phases are explained below:
PHASE 1: OVERALL ORGANIZATION
1. Project plan
2. Focus groups:
a. Two focus groups - to enable to compare and identify themes which emerge from
each discussion.
b. Focus groups should run between 90 and 120 minutes.
c. 8 participants in each group. Each focus group should have between six and ten
participants (depend of enrolment). Fewer than six participants may limit the
conversation and yield poor data while more than ten can be unwieldy.
3. Participants:
a. Parents of families that participated in the POPS intervention.
b. The key attributes of the participants is their unique point of view as a subject of
the intervention. The experience in utilize the workbooks during the program is
essential based on the purpose of evaluate Clear Communication.
c. Secure names and contact information from the participants.
d. Send invitations by mail and/or telephone call. Also one additional call to
schedule convenient date and time for participant.
e. Collect informed consent – by an IRB trained Graduate Assistant Research.
f. Compensation: $ 25.00 gift card from a local grocery shop. One per parent
participant (one per family).
g. Supervised play time in a different room will be offer to their children during the
focus group.
h. Will be providing refreshments and snacks.
4. Questions:
a. Based on the purpose and goals of the focus group (attached).
b. Questions were adapted from the CDC Clear Communication Index (CCI) and
Suitability Assessment of Materials (SAM).
c. Questions are order from general to specific.
5. Script

92
a. Part one: welcome participants, explain purpose and context, explain what a
focus group is, and make introductions. Explain that information is confidential
and no names will be used. We will have a note-taker and record the proceedings.
b. Part two: ask questions; use probes and follow up questions to explore the key
concepts more deeply.
c. Part three: close the focus group – thank participants, give them contact
information for further follow up if requested, explain how you will analyze (by
group) and share the data (participants can ask for a copy of report).
6. Facilitator and Co-facilitator
a. One facilitator and one co-facilitator per focus group:
b. Both will be not someone who directly oversees the issue or topical area we are
exploring. This may make participants less open to sharing their thoughts or
concerns.
c. Both will be knowledgeable about the topic at hand, and can be a grad student or
staff member from the study.
d. Both will have the ability to keep the discussion going, deal tactfully with difficult
or outspoken group members, and make sure all participants are heard
e. Facilitator will ask the questions and co-facilitator the probes, but they not
participate in the dialogue or correct participants.
7. Location
a. Same location of the intervention delivering.
b. Location was choose because is familiar to participants, comfortable, easily
accessible, and where participants can see one another.
PHASE 2: CONDUCTING THE FOCUS GROUP
1. Materials:
a. Notebook to note taking and tape recorder to record proceedings
b. Consent forms
c. Copies of Parents workbooks
d. Focus group list of participants
e. Focus group script
f. Gift cards
g. Pencils
h. Markers for the withe board
i. Name tags
j. Clock
k. Snacks
2. Facilitator and co-facilitator
a. Arrive before the participants to set up room, refreshments, etc.
b. Introduce themselves and the note-taker (co-facilitator) and carry on the focus
group according to the script.
c. Set a positive tone.

93
d. Make sure everyone is heard; draw out quieter group members.
e. Probe for more complete answers.
f. Monitor questions and the time closely – make sure you are on track.
g. Don’t argue a point with a participant, even if they are wrong. Address it later if
you must.
h. Thank participants and tell them what your next steps are with the information.
i. Distribute the gift cards
PHASE 3: INTERPRETING AND REPORTING THE RESULTS
1. Summary (each meeting)
a. Immediately after the meeting, the facilitator together with the co-facilitator will
write up a quick summary of his/her impressions.
b. Transcribe the notes or audio recording of the focus group. This will be done as
soon as possible after the focus group has been conducted.
c. Facilitator and co-facilitator will discuss impressions with the other before
reviewing the transcript.
2. Analyze of summaries
a. Researchers will read the notes and look for themes/trends. Writing down any
themes which occur more than once.
b. Context and tone are just as important as words. If comments are phrased
negatively or triggered an emotional response, this should be noted in the
analysis.
c. Interpret the results
i. What are the major findings?
ii. What recommendations might you have?
3. Report
a. A report will be writing and presented for validation to the POPS/CAB members
and send to participants.
b. The report will include purpose, outcomes, process, findings, and
recommendations.
4. Adjustments/Action (based on what we have learned)
a. Schedule a meeting to discuss the implications and presented for validation to the
POPS/CAB members
b. Highlight the main themes, suggestions, issues, or problems that arose in the
focus groups. Discuss with the POPS/CAB how we will address these.
c. Prioritize the results and make action plans for the most important priorities.
d. A copy also will be send to focus group participants to give them opportunity to
context results.

94
FOCUS GROUP SEMI-STRUCTURE SCRIPT
Introduction
Good evening/morning. Thank you for taking the time to join our discussion about the iChoose
program.
Your opinion will help us to improve this program for the next families on the program.
My name is ___(Facilitator)____, and I’m __(Co-facilitator)____. We’re conducting research on
how to improve the iChoose program. The opinions you share with us today can help us to have
a better understanding of how to design better materials. We want to talk with you about your
experiences as participants in this program.
Before we get started, we’d like to explain the informed consent form to you. [Go over consent
form. Participants sign].
Before we begin, let me suggest some things to make our discussion more productive.
Because we’ll be recording for an accurate record, it is important that you speak up
And that you only speak one at a time. We don’t want to miss any of your comments.
We’ll only use first names here. No reports will link what you say to your name,
department, or institution. In this way, we will maintain your confidentiality.
In addition, we ask that you also respect the confidentiality of everyone here. Please don’t
repeat who said what when you leave this room.
During the two hours we’ll be here, I will ask you questions, and I will listen to what you have to
say. I will not participate in the discussion. So please, feel free to respond to each other and to
speak directly to others in the group. We want to hear from all of you. We’re interested in both
majority and minority viewpoints, common and uncommon experiences. So I may sometimes act
as a traffic cop by encouraging someone who has been quiet to talk, or by asking someone to
hold off for a few minutes.
Do you have any questions before we begin?
If it is OK with you, we will turn on the recorder and start now.
This parents focus group number ___ being conducted for the iChoose program on [DATE] by
__ and________. Start time _____________.

95
Focus Group Questions:
We are going to start with reviewing the workbooks [Pass out workbooks].
1. Let’s begin by going around the table and stating your first name and then telling us a
bit about how well the work book worked for your family and how your family use the
workbook.
Now we are going to put you in small groups to review certain sections of the workbook [Assign
groups based on attendance—go through as many blocks as time permits]. You will have about
10 minutes to review the workbook and reflect on the questions listed on this handout [Pass out
handout that was adapted from the Clear Communication Index]. Then we will ask the questions
out loud for the entire group to comment on each section of the workbook.

96
Focus Group Questions- HANDOUT BLOCK 1
1. Messages: These are the main messages for the first block of the workbook.
Parents will be able to:
1. Describe energy balance and how it influences weight.
2. Identify the food groups included in MyPlate.
3. Identify that children should participate in 60 minutes of moderate to vigorous activity
daily.
4. Set a specific, time-based, and achievable goal for eating and physical activity.
How well do you think these messages were explained in the workbook? What
things in the workbook helped you to better understand these messages?
Was there any information (words, ideas, or activities) in this part of the workbook
that was hard to understand? What could be done to make this information easier
to understand?
2. Images/pictures: What about the images and pictures in the first block of the
workbook?
What do you like about the images/pictures? Why? Did they help clarify the
messages of this block?
Are there any images/pictures that are hard to understand? Why? How can these
images/pictures be improved? Do we need different/more/less pictures?

97
Focus Group Questions- HANDOUT BLOCK 2
1. Messages: These are the main messages for the second block of the workbook.
Parents will be able to:
1. Choose foods to eat more often, and to cut back on foods to eat less often.
2. Identify how to be physically active in a way that fits their preferences and lifestyle.
3. Help their children to identify barriers and address them at daily bases without
focusing overly on weight.
How well do you think these messages were explained in the workbook? What
things in the workbook helped you to better understand these messages?
Was there any information (words, ideas, or activities) in this part of the workbook
that was hard to understand? What could be done to make this information easier
to understand?
2. Images/pictures: What about the images and pictures in the second block of the
workbook?
What do you like about the images/pictures? Why? Did they help clarify the
messages of this block?
Are there any images/pictures that are hard to understand? Why? How can these
images/pictures be improved? Do we need different/more/less pictures?

98
Focus Group Questions- HANDOUT BLOCK 3
1. Messages: These are the main messages for the third block of the workbook.
Parents will be able to:
1. Define the appropriate portion sizes for parents and kids.
2. Recognize when they are hungry and when are enough.
3. Identify ways to cut back screen time to less than 2 hours per day.
4. Develop strategies to change home environment cues so that they support healthy
eating and physical activity.
How well do you think these messages were explained in the workbook? What
things in the workbook helped you to better understand these messages?
Was there any information (words, ideas, or activities) in this part of the workbook
that was hard to understand? What could be done to make this information easier
to understand?
2. Images/pictures: What about the images and pictures in the third block of the
workbook?
What do you like about the images/pictures? Why? Did they help clarify the
messages of this block?
Are there any images/pictures that are hard to understand? Why? How can these
images/pictures be improved? Do we need different/more/less pictures?

99
Focus Group Questions- HANDOUT BLOCK 4
1. Messages: These are the main messages for the fourth block of the workbook.
Parents will be able to:
1. Understand and making sense of a food label.
2. Understand importance of games and how they can help them to improve health.
3. Identify appropriate rewards for healthy behaviors and weight loss.
4. Identify how they can be a role model for their family and friends.
How well do you think these messages were explained in the workbook? What
things in the workbook helped you to better understand these messages?
Was there any information (words, ideas, or activities) in this part of the workbook
that was hard to understand? What could be done to make this information easier
to understand?
2. Images/pictures: What about the images and pictures in the fourth block of the
workbook?
What do you like about the images/pictures? Why? Did they help clarify the
messages of this block?
Are there any images/pictures that are hard to understand? Why? How can these
images/pictures be improved? Do we need different/more/less pictures?

100
Focus Group Questions- HANDOUT BLOCK 5
1. Messages: These are the main messages for the fifth block of the workbook.
Parents will be able to:
1. Reflect on eating choices in the last week and identify triggers to that lead to unhealthy
eating.
2. Identify movements and intensity routines of activities using music & dance that can
help them to improve their family’s health.
3. Identify strategies and resources to help their children to deal with bullying and teasing
situations using the 5 step strategy AWARE.
How well do you think these messages were explained in the workbook? What
things in the workbook helped you to better understand these messages?
Was there any information (words, ideas, or activities) in this part of the workbook
that was hard to understand? What could be done to make this information easier
to understand?
2. Images/pictures: What about the images and pictures in the fifth block of the
workbook?
What do you like about the images/pictures? Why? Did they help clarify the
messages of this block?
Are there any images/pictures that are hard to understand? Why? How can these
images/pictures be improved? Do we need different/more/less pictures?

101
APPENDIX D: iChoose program’s Parent Home Environment Survey
Module 6: Questions About Your Child and Home Environment
[DATA COLLECTOR Initials]: | || |
[READ TO PARENT]: The next set of questions are about the child that is here with you today
and enrolled in the iChoose Program. Please answer the questions related to that child only. ]
I will also be asking you some questions about the home in which you live.
|____| 6.1 Is your child taking any prescription medicines?
[note this is child selected for the iChoose Program]
(0)No
(1) Yes
Yes - Please tell me the medicines or I brought my child’s medicines.
No. My child does not take any prescription medicines.
Name of medicine Reason for taking medication
Amount /
size of pill
How many pills or doses does your child take at
Example:
Dexadrine
10 mg
1 morning noon dinner 1bed
morning noon dinner bed
morning noon dinner bed
morning noon dinner bed
morning noon dinner bed
(Please use the back of this form if you have more prescription medicine.)

102
6.2. Think about who prepares the food in your home, which of the following best indicates your
role?
[circle participant response]
Food preparation is
primarily my
responsibility
I prepare food
sometimes but it is
not primarily my
responsibility
I share food
preparation equally
with another family
member
I rarely prepare food
in our house
6.3. Think about who plans family activities in your home, which of the following best reflects your role? [circle participant response]
Activity planning is
primarily my
responsibility
I plan family
activities but it is not
primarily my
responsibility
I share family activity
planning equally with
another family
member
I rarely plan family
activities
6.4. Think about the foods your child eats, which of the following best describes you? [circle participant response]
I am the one who
has the most
knowledge about
what my child eats
I have some
knowledge about
what my child eats
but I am not the one
who knows the most
I share equally in my
knowledge of what
my child eats with
another family
member
I do not usually
know what my child
eats
6.5. Think about the activities your child participates in, which of the following best describes you? [circle participant response]
I am the one who has
the most knowledge
about my child’s
activities
I have some
knowledge about my
child’s activities but I
am not the one who
knows the most
I share equally in my
knowledge of my
child’s activities with
another family
member
I do not usually know
about most of my
child’s activities
6.6. What best describes your home? [circle participant response]

103
Apartment
Condominium Multi-family house
Single
Family
House
Mobile
Home
Shelter
6.7. How often does your family eat fruits and vegetables that you have grown? [circle participant response]
Not at all
Rarely Some of the
time
Most of the
time
All of the time
6.8. What is the average time that you spend preparing the evening meal? [circle participant response]
0-15 minutes 16-30 minutes 31-45 minutes 46-60 minutes >60 minutes
6.9. Where do you typically shop for your groceries?
[circle participant response]
Corner Store Farmers Market Grocery Store (e.g.,
Food Lion, Walmart)
Other: ________
6.10. Write in name of store _______________; general location ________________________ (i.e. 7th & piney forest in Danville)

104
PART B: Think about the things that are currently in your home and circle your response for each
question.
6.11. Please indicate if you have the following areas in or around your home or apartment. If you have an area but it is not suitable for your child to play/exercise in please answer “No”
Inside playroom/area Yes No
Workout/exercise room Yes No
Outside Play area/yard Yes No
6.12. What is the approximate size of your yard? [Circle Participant Response]
We do not have a
yard
Small Medium Large
6.13. Which of the following things does your child have? [Circle Participant Response] NOTE: If there is more than one child indicate in the margin if there is a difference in access for either child.
a. Jungle-gym/swing set Yes No
If yes, is it in working condition? Yes No
b. Size-appropriate bicycle Yes No
If yes, is it in working condition? Yes No
c. Rollerblades/skates Yes No
If yes, are they in working condition? Yes No
d. Skateboard/scooter Yes No
If yes, is it in working condition? Yes No
e. Jump rope Yes No

105
If yes, is it in working condition? Yes No
f. Basketball hoop Yes No
If yes, is it in working condition? Yes No
g. Baseball equipment (At least one of
the following: ball, bat or mitt)
Yes No
If yes, is it in working condition? Yes No
h. Tennis/racquetball racket
Yes No
If yes, is it in working condition? Yes No
i. Hockey Equipment (at least a hockey
stick)
Yes No
If yes, is it in working condition? Yes No
j. Ball of any kind (Volleyball, soccer,
football, fitness ball, foam balls etc.)
Yes No
If yes, is it in working condition? Yes No
k. Pedometer (step counter) Yes No
If yes, is it in working condition? Yes No
l. Winter Sports Equipment (at least one
of the following: sled, skis, snowboard,
ice skates)
Yes No
If yes, is it in working condition? Yes No
m. Home aerobic equipment (e.g.,
treadmill, cycle)
Yes No
If yes, is it in working condition? Yes No
n. Yoga/exercise mat Yes No
If yes, is it in working condition? Yes No
o. Hiking shoes Yes No
If yes, are they in working condition? Yes No
p. Running shoes (athletic or “tennis”
shoes)
Yes No
If yes, are they in working condition? Yes No
q. Sandbox Yes No
If yes, is it in working condition? Yes No
r. Trampoline Yes No
If yes, is it in working condition? Yes No

106
6.14. How often, in an average week, do you attend a gym, YMCA, or community center to exercise?
[Circle Participant Response]
Not at all 1 time 2 times 3 times 4 times 5 times More than 5 times
PART D: Think about the media equipment that is currently in your home and circle your response for each question
6.15. How many TVs do you have in your home? ________ (If none, skip to question 6.21)
6.16. Do you have a digital TV recorder (e.g., TiVo, Replay TV, Sonic Blue) [Circle Participant Response]
Yes No Don’t know
6.17. What best describes your television service for the primary television in the home? [Circle Participant Response]
No cable Basic cable Cable + premium channels Satellite/Dish
6.18. Do you have exercise equipment (such as stationary bikes, treadmills) in your main TV viewing area? [Circle Participant Response]
Yes No
6.19. Does your main TV viewing area have adequate space for your child to play or exercise while watching
TV/Videos? [Circle Participant Response]
Yes No
6.20. Does your child have a TV in his/her bedroom? [Please answer for the child in this program; Circle
Participant Response] NOTE: If there is more than one child indicate in the margin if there is a difference for either child.
Yes No

107
6.21. Does your child have a video game station or computer? [Circle Participant Response] NOTE: If there is more than one child indicate in the margin if there is a difference for either child.
Yes No Don’t know
6.22. Do you have a desktop or laptop computer in your home? [Circle Participant Response]
Yes No Don’t know
6.23. Does your child have a PSP, Nintendo DS, iTouch, iPad (iPad mini) or any other handheld video game?
[Circle Participant Response] NOTE: If there is more than one child indicate in the margin if there is a difference for either child.
Yes No Don’t know
6.24. Do you have video games on your phone? [Circle Participant Response]
Yes No Don’t know
6.25. Approximately how many video games and computer games are in your home? (Include items that are owned, rented and borrowed) [Circle Participant Response]
0 1-10 11-20 21-30 31-40 41-50 >50
6.26. How often is your television left on, whether or not it is being watched? [Circle Participant Response]
Never Rarely
Sometimes Frequently Always

108
PART F: Based on the last 30 days, thinking about your parenting regarding time spent watching television, playing
video games, and on the computer, please circle your answers.
NOTE: If there is more than one child indicate in the margin if there is a difference for either child.
6.27. Do you have any firm limits or agreements with your child about how much he/she can watch TV or Videos?
No (If no, go to Question 6.28) Yes (If yes, go to Question 1a)
1a. How much time are they allowed to watch Television or Videos per day? ________________
1b. How often are these limits enforced?
Never Rarely Sometimes Frequently Always
6.28. Do you have any firm limits or agreements with your child about how much time he/she is allowed to play on the computer or use it to communicate with friends?
No (If no, go to Question 6.29) Yes (If yes, go to Question 2a)
2a. How much time is allowed to play or talk with friends on the computer per day? __________
2b. How often are these limits enforced?
Never Rarely Sometimes Frequently Always
6.29. Do you have any firm limits, or agreements, about how much time your child can play video games?
No (If no, go to question 6.31) Yes (If yes, go to Question 3a)
3a. How much time are they allowed to play video games per day? ________________

109
3b. How often are these limits enforced?
Never Rarely Sometimes Frequently Always
6.30. How often does your child eat in front of the TV?
Never 1 time or less per
week
2-3 times per
week
4-5 times per
week Everyday
6.31. Do you have the following rules…. (please circle your response)
a. No TV/DVD before homework Yes No
b. No computer before homework Yes No
c. No internet without permission Yes No
Part G. For each category, circle the description that best fits your child or your family. It is
important to indicate the most common or typical pattern and not what you would like to
happen.
NOTE: If there is more than one child indicate in the margin if there is a difference for either child.
In a typical week…
6.32. Does your family eat dinner while watching television? Yes No
6.33. Do you use food as a reward for good behavior? Yes No
6.34. Do you restrict how much your child eats potato chips, cookies, and candy?
Yes No
6.35. Do you have a routine or schedule for bedtime for your child?
Yes No
6.36. How many hours of sleep does your child usually get each night?
<8 8-9 9-10 >10
6.37. How many hours of television does your child watch? <7 7-14 >14
6.38. How many hours does your child spend on the computer or video games?
<7 7-14 >14
6.39. Do you monitor the amount of television your child watches?
Yes No
6.40. How often does your child eat breakfast? Almost
never
Sometimes Often Almost
always
6.41. How often does your family eat at least one meal together each day?
Almost
never
Sometimes Often Almost
always

110
6.42. How often does your family eat fast food during the week? Almost
never
Sometimes Often Almost
always
6.43. How often does your family eat fruits and/or vegetables with your main meal?
Almost
never
Sometimes Often Almost
always
6.44. How often do you use prepackaged foods (like frozen pizza) for your main meal?
Almost
never
Sometimes Often Almost
always
6.45. How often does your family freshly prepare food (like chicken, pasta) for your main meal?
Almost
never
Sometimes Often Almost
always
6.46. How often does your family play games outside, ride bikes, or walk together?
Almost
never
Sometimes Often Almost
always
6.47. How often does your child participate in physical activity during their free time?
Almost
never
Sometimes Often Almost
always
6.48. In the past year how many organized sports with a coach or leader (e.g. soccer) or in organized group activities involving physical activity (e.g. swim lessons) has your child participated in?
0-1 1-2 3-4 5+