Embed Size (px)
Citation preview

Individual Cell Based Traits Obtained by Scanning Flow-Cytometry Show Selection by Biotic and AbioticEnvironmental Factors during a Phytoplankton SpringBloomFrancesco Pomati1,2*, Nathan J. B. Kraft3, Thomas Posch4, Bettina Eugster4, Jukka Jokela2,
Bas W. Ibelings1,5
1Department of Aquatic Ecology, Swiss Federal Institute of Aquatic Science and Technology (Eawag), Dubendorf, Switzerland, 2 ETH-Zurich, Institute of Integrative
Biology (IBZ), Department of Environmental Systems Science, Zurich, Switzerland, 3Department of Biology, University of Maryland, College Park, Maryland, United States
of America, 4 Limnological Station, Institute of Plant Biology, University of Zurich, Kilchberg, Switzerland, 5Universite de Geneve, Institut F.-A. Forel, Versoix, Switzerland
Abstract
In ecology and evolution, the primary challenge in understanding the processes that shape biodiversity is to assess therelationship between the phenotypic traits of organisms and the environment. Here we tested for selection on physio-morphological traits measured by scanning flow-cytometry at the individual level in phytoplankton communities under atemporally changing biotic and abiotic environment. Our aim was to study how high-frequency temporal changes in theenvironment influence biodiversity dynamics in a natural community. We focused on a spring bloom in Lake Zurich(Switzerland), characterized by rapid changes in phytoplankton, water conditions, nutrients and grazing (mainly mediatedby herbivore ciliates). We described bloom dynamics in terms of taxonomic and trait-based diversity and found thatdiversity dynamics of trait-based groups were more pronounced than those of identified phytoplankton taxa. Wecharacterized the linkage between measured phytoplankton traits, abiotic environmental factors and abundance of themain grazers and observed weak but significant correlations between changing abiotic and biotic conditions and measuredsize-related and fluorescence-related traits. We tested for deviations in observed community-wide distributions of focaltraits from random patterns and found evidence for both clustering and even spacing of traits, occurring sporadically overthe time series. Patterns were consistent with environmental filtering and phenotypic divergence under herbivore pressure,respectively. Size-related traits showed significant even spacing during the peak of herbivore abundance, suggesting thatmorphology-related traits were under selection from grazing. Pigment distribution within cells and colonies appearedinstead to be associated with acclimation to temperature and water chemistry. We found support for trade-offs amonggrazing resistance and environmental tolerance traits, as well as for substantial periods of dynamics in which our measuredtraits were not under selection.
Citation: Pomati F, Kraft NJB, Posch T, Eugster B, Jokela J, et al. (2013) Individual Cell Based Traits Obtained by Scanning Flow-Cytometry Show Selection by Bioticand Abiotic Environmental Factors during a Phytoplankton Spring Bloom. PLoS ONE 8(8): e71677. doi:10.1371/journal.pone.0071677
Editor: Diego Fontaneto, Consiglio Nazionale delle Ricerche (CNR), Italy
Received February 7, 2013; Accepted July 2, 2013; Published August 12, 2013
Copyright: ! 2013 Pomati et al. This is an open-access article distributed under the terms of the Creative Commons Attribution License, which permitsunrestricted use, distribution, and reproduction in any medium, provided the original author and source are credited.
Funding: This research was funded by the Swiss National Science Foundation (SNSF) R’Equip program (project no. 316030_121331), EAWAG (to F.P.), and Schure-Beijerinck Popping Fonds (to B.W.I.). The funders had no role in study design, data collection and analysis, decision to publish, or preparation of the manuscript.
Competing Interests: The authors have declared that no competing interests exist.
* E-mail: [email protected]
Introduction
The study of trait-environment relationships is fundamental forunderstanding the evolution of phenotypic characters andecological dynamics among species. Modern concepts of commu-nity ecology, for example, propose that the diversity of naturalcommunities is driven by traits characterizing species strategiestolerating and exploiting the environment, differences in compet-itive ability or enemy-resistance traits, as well as by stochasticprocesses that are trait-neutral [1–5]. Trait-based approachesfocus on the phenotypic traits of individuals, populations or speciesto understand structure and functioning of natural communities[6–8]. One aim of trait-based approaches is to offer a ‘‘commoncurrency’’ by which to compare taxa, in order to illuminategeneral rules of community dynamics, in contrast to species-
specific studies which often reveal idiosyncratic responses [9].Trait-based approaches provide the opportunity to study factorsthat determine changes in community structure and functioning,or infer potential mechanisms of selection in complex communitiesby comparing observed trait patterns to predictions from theory[4,6,10–12] (Table 1).We can expect, for example, that when selection by abiotic
environmental filters is in operation on a trait associated withhabitat specificity, its community-wide distribution would con-verge on similar values (mean trait values of species would beshifting to the same direction), or filtering would reduce the rangeof the trait distribution [11,13,14] (Table 1). A clustered pattern inthe distribution of habitat-related traits, however, can be alsoobtained when strong negative interactions (like competition) leadto species exclusion (e.g. reducing community trait range) [4]
PLOS ONE | www.plosone.org 1 August 2013 | Volume 8 | Issue 8 | e71677

(Table 1). Conversely, when species interactions such as compe-tition for resources or grazing/predation/parasitism from special-ists dominate, we expect that species would show dissimilarenemy-resistance or resource-acquisition traits (dispersion ofstrategies), resulting in more evenly spaced traits along communitytrait axes [10,11,14,15] (Table 1). Finally, we expect that generalistenemies or predators will cluster the community around selectedspecies interaction traits or trait values [10,15,16]. When multipleselection processes such as environmental filtering and enemymediated selection are co-occurring on a community, its structuremay be explained by trade-offs between different ecologicalstrategies mediated by environmental tolerance, resource acquisi-tion and enemy resistance traits [10,17,18].Here, we studied trait changes in a phytoplankton community
during a spring bloom composed of a succession of environmentalconditions, phytoplankton species and their grazers in LakeZurich, Switzerland. Phytoplankton is a classical ecological modelsystem with much knowledge about key ecological traits. Examplesinclude cell size, shape and coloniality (which influence motility,grazing resistance, and nutrient uptake through surface area/volume ratio - SA/V), photosynthetic pigment type and concen-tration (which relates to photosynthetic performance and adapta-tion to different light environments), N2-fixation and mixotrophy(which define nutrient uptake strategies) [18]. Traits derived fromlaboratory studies appear to retain predictive power to explain thedynamics of natural populations [19], however empirical evidenceof trait-environment relationships from phytoplankton undernatural community dynamics in the field is lacking.In this study we aimed at identifying relationships between traits
and their environment during the phytoplankton spring bloom,and evaluating selection gradients caused by relevant interactionssuch as competition or grazing (Table 1) [20,21]. The springbloom is considered as a prime example of the importance ofphysio-morphological traits in shaping community dynamics. Thesuccession starts with the buildup of a community of small celledphytoplankton taxa with a high SA/V, which benefit from amplenutrients and improving light conditions at the end of the winter[22]. This spring bloom increases the fecundity of zooplankton,which become abundant and graze down the phytoplankton.Next, grazing resistance is gained by large cell size or by colonyformation, which both decrease nutrient competitive ability due toreduced SA/V, thus creating a possible trade-off that may allowspecies co-existence or turnover [22–24]. Most evidence for therole of physio-morphological traits in this generally well knownecological succession is, however, derived from theory orlaboratory evidence [18,25].
Our specific objectives were to investigate how phytoplanktongroups and their expressed trait values respond to environmentalselection before, during and after the grazing period. Naturalcommunities pose methodological constraints on empirical work,including measuring traits accurately and at the relevant spatialand temporal scale. Scanning flow-cytometry allows to monitor -at the level of individual particles - a relatively large number ofimportant physio-morphological features such as size, coloniality,pigment type and content, pigment distribution within cells orcolonies in natural populations, and to classify phytoplankton intogroups based on these measured traits [26–29]. Here we used thefourth corner method [30] to test for links between averagepopulation trait values derived by flow-cytometry, populationabundance and environmental variables. The aim was to screenseveral traits and identify those that were under selection (shifts inmean values) over the entire period of study. This set of focal traitswas then studied for their community wide trait patterns [14] ateach day of the temporal series in relation to the hypothesizedselection processes as outlined in Table 1.
Materials and Methods
Sample Collection and Limnological MethodsWe sampled the peri-alpine mesotrophic Lake Zurich (Switzer-
land) from the 23rd of March to the 6th of May 2009 every 2 to 4days at 10 a.m., offshore from Kilchberg (maximum depth 100 m,47u19.3’N 8u33.9’E). No specific permission was required forsampling since the lake is a public water body, and the study didnot involve any endangered or protected species. Eawag and theUniversity of Zurich are Federal and Cantonal institutions,respectively, and have the mandate from the government tosample and monitor lakes in Switzerland. Profiles (0 to 40 m) ofpressure (depth), oxygen, turbidity, temperature and conductivitywere obtained using a 6600 YSI multiprobe (YSI Inc., YellowSprings, OH, USA). Water samples were taken with a five litersampler (Uwitec, Mondsee, Austria) at the depth of maximumchlorophyll-a (Chl-a) concentration, measured on site over thewater column with a fluoroprobe (TS-16-12, bbe-MoldaenkeGmbH, Kiel, Germany). This depth reflected the area ofmaximum productivity and biomass for the plankton community.Abundance of ciliates was determined via Protargol-staining offixed samples (300 mL), while plankton net (mesh size 30 mm) livesamples were used for taxonomic determination [31]. Dissolvedorganic carbon (DOC), dissolved reactive phosphorous (P-PO4)and nitrate (N-NO3) were measured on collected water samplesusing standard methods [32]. We determined and counted
Table 1. Predicted influence of selection processes on trait community structure, assuming that the community includes only onehabitat.
Trait patterns
Process Habitat-occupancy traitsa Species-interaction traitsb
Environmental filtering clustered random
Competition clustered evenly dispersed
Grazing/predation random evenly dispersed or clustered
Random patterns are expected in all cases when focal traits are not under selection. Adapted from [4,10,14,15].aEnvironmental tolerance and resource use strategy traits: allow species to establish themselves and thrive in a community due to compatibility with environmentalconditions and resources [4,10]. In the case of this study, examples include type and cellular levels of active pigments [18].bEnemy resistance or resource acquisition traits that provide an advantage over competitors, predators or parasites: they drive competitive exclusion through the abilityof exploiting common limiting resources or convey resistance to grazers, predators and parasites [1,4,10]. In the case of this study, examples include size, coloniality,shape and cell volume [17,18].doi:10.1371/journal.pone.0071677.t001
Selection on Phytoplankton Traits
PLOS ONE | www.plosone.org 2 August 2013 | Volume 8 | Issue 8 | e71677

phytoplankton taxa using inverted microscopy from 100 mLLugol-acetic preserved samples. For flow-cytometry analysis,50 mL of sampled water were fixed with a filter-sterilized solutionof paraformaldehyde and glutaraldehyde (0.01 and 0.1% finalconcentration, pH 7) and stored at 4uC in the dark. Macro-zooplankton was sampled monthly during the routine monitoringcampaign of Lake Zurich in the center of the lake (in front ofThalwil, circa 3.5 Km from the Kilchberg sampling site), by net-collection (mesh size 95 mm) from bottom (136 m) to top (0 m).
Flow-cytometryWe used a scanning flow-cytometer from Cytobuoy (Woerden,
the Netherlands; http://www.cytobuoy.com) for counting, char-acterization and classification of phytoplankton [27–29,33]. Thisinstrument is designed to analyze the naturally occurring sizerange from small (e.g. picoplankton) to large (e.g. colonial)plankton species (0.5 to 900 mm in diameter and a few mm inlength). Each particle was intercepted by a coherent solid-stateSapphire 488 nm laser beam (15 mW) at the speed of 2 m s21.More details on the instrument can be found elsewhere [27].Digital data acquisition was triggered by the sideward scatter(SWS) signal with a trigger-level of 20 mV, which excludesparticles smaller than 0.5 mm. The light scattered (908 nm) fromeach passing particle was measured at two angles, forward scatter(FWS) and SWS, to provide information on size and shape ofparticles. The fluorescence (FL) emitted by photosyntheticpigments in algal cells was detected at three different wavelengths:red (FLR), orange (FLO) and yellow (FLY) signals were collectedin ranges of 668–734 (Chl-a), 601–668 (phycocyanin andphycoerythrin) and 536–601 nm (decaying pigments), respectively[34]. Laser alignment and calibration were done before analysisusing yellow fluorescence beads of 1 and 4 mm. In this study, wescanned roughly 30,000 particles for each sample.
Data Preparation and Clustering of PhytoplanktonParticlesData manipulation, analysis and graphics were performed with
the R statistical programming language [35]. The Cytobuoyallows the analysis of pulse-signals providing, in the structuralconfiguration used for this study, 45 descriptors of 3D structureand FL profile for each particle [33]. Raw Cytobuoy data werevisually inspected for the distribution of FL signals in order to setthreshold levels to extract FL particles (phytoplankton) with a sizelarger than 2 mm. Phytoplankton concentrations were calculatedby inferring the number of cells from the number of humps in theSWS signal of each particle to account for colonial species [34].Phytoplankton biovolumes were estimated for each particleassuming an ellipsoid shape and based on Total FWS signal usingthe formula Biovolume2 = 0.0017 Total.FWS –0.013 [29,36].Cytobuoy particle descriptors are expressed in different unitsand some are cross-correlated (data not shown). Particle descrip-tors were therefore standardized and, by principal componentanalysis (PCA), reduced to 28 orthogonal vectors covering 99% ofthe total variance in the data (for factor loadings of PCA see TableS1).Different approaches have been previously used in phytoplank-
ton to organize species into categories based on ecological andfunctional characteristics [37,38], on purely morphological traits[39], and on both ecological and morphological characters [40]. Inthis study we relied on unsupervised model-based clustering togroup phytoplankton, applying maximum likelihood estimationand Bayesian criteria to identify the most likely model and numberof clusters, using principal components (PCs) of Cytobuoy particledescriptors [29]. Specifically, we used the R package mclust in
which the optimal model is selected according to BayesianInformation Criterion initialized by hierarchical clustering forparameterized Gaussian mixture models [41]. To accommodatefor computational issues, we limited the final clustering dataset to10,000 phytoplankton particles (out of a total of 25,000), randomlyextracted from the database. The optimal model in our studycorresponded to 22 ellipsoidal, equally shaped clusters. For thedetermination of presence/absence of cytometry-derived groups,we applied a concentration threshold (1 cell/mL) below which agroup was considered as virtually not present. This threshold (andthe cut-off of particles smaller than 2 mm) was implemented forcomparison of flow-cytometry data with microscopic counts sincepicoplankton and small nano-phytoplankton, in particular, arecommonly not efficiently counted by microscopy when rare [42].
Linking Flow-cytometry Derived Traits to theEnvironmentWe used the two-step fourth corner method [30] to test the
correlation between Cytobuoy-derived phytoplankton traits andenvironmental variables, weighed by the abundances of phyto-plankton clusters. This method allows to test for selection byenvironmental filters on focal traits by statistically linking a speciesabundance matrix (L, abundance for phytoplankton trait-basedgroups at different days in this study), with a matrix (R) consistingof the environmental variables of the sites and a matrix (Q)containing average trait values for each group [30]. Our traitmatrix included selected flow-cytometry signal parameters and thefirst axis of the PCA (40% of variance in the data, Table S1). Thelink between quantitative phytoplankton traits and environmentalvariables was measured by a Pearson correlation coefficient andthe significance was tested by comparing results of two permuta-tion models (999 iterations): model A (permutes values of days, i.e.rows of L) and model B (permutes values of species, i.e. columns ofL) [30]. Model A tests H0 (no link between R, L and Q) against H1
(L and R are linked), and model B tests H0 against H2 (L and Qare linked). Combining results allows a test of H0 against H3
(matrices R, L, and Q are linked): the significance of the H3 test(final p-value) was extracted as the maximum of individual p-values for H1 and H2 tests [43]. We computed the autocorrelationfunction for all our variables to assess serial autocorrelation in ourdata, finding weak signs of temporal autocorrelation. To test forpotential interference of temporal autocorrelation in our analysis,we included the series of sampling dates as one of theenvironmental variables in the fourth-corner method finding nosignificant results (data not shown).
Linking Trait Distributions to Selection ProcessesTo detect non-random patterns in phytoplankton community-
wide trait distributions over each day of our time-series, we appliedtrait-based community tests using flow-cytometry derived groupsof phytoplankton [11,14]. Trait means for each phytoplanktongroup were matched to the groups present in each day of the seriesto calculate a community-wide frequency distribution of traitvalues. For this analysis we focused on three phytoplankton traits:length by SWS (particle size), Fill factor (pigment distributionwithin particle) for FLR (Chl-a) and FLO (phycocyanin). We chosethese traits because of their possible influence on motility, grazingresistance, pigment strategy and acclimation to light and waterchemistry. Length and FLR were Log10 transformed in order toaccount for non-normal distribution. We also included PC1(accounting for circa 40% of total multivariate trait variance) as anaggregated index of phytoplankton morphology (Table S1). SWSlength, Fill factor FLR and FLO loads on PC1 were 0.172, 20.08and 20.09, respectively (Table S1).
Selection on Phytoplankton Traits
PLOS ONE | www.plosone.org 3 August 2013 | Volume 8 | Issue 8 | e71677

We used community trait mean and range, and the standarddeviation of successive neighbor distances along trait axes dividedby range (SDNDr), to measure the effects of habitat filtering andspecies interactions on our focal traits (Table 1) [11,13,14].SDNDr quantifies how regularly spaced the trait-based groups areacross a given range of trait values [14] (Table 1). For each day,the observed metrics were compared to a null expectationgenerated by creating 999 random communities of equal richnessby drawing groups from the entire time-series weighted by theirseries-wide frequency of occurrence (the fraction of days in whicheach group was present), irrespective of trait values [14]. As ameans of assessing the significance of each metric, we judged eachdatum as significantly non-random if the observed metric fell intothe extreme 5% of the null distribution for that day of the time-series. One-tailed and two-tailed tests were used to assess changesin mean values and in the other metrics, respectively [11,14].
Results
Spring Bloom Dynamics in Lake ZurichWe observed the onset of phytoplankton growth when the
surface water temperature reached 7uC (the 7th of April - day 15 ofour study period, Fig. 1A). The fast and intense springphytoplankton proliferation caused a rapid decrease in dissolvednutrients (Fig. 1B). The bloom was initially characterized by ashallow Chl-a maximum (2 to 3 meters), which increased inmagnitude and depth along with the progression of bloomdynamics (Fig. 1C). The peak of maximum phytoplanktonproductivity was reached between day 18 (9th of April) and 24(15th of April) of the series (Fig. 1C–D). At the depth of the Chl-amaximum, the spring bloom was characterized by a succession oftaxa belonging to the classes Cryptophyceae, Chrysophyceae andBacillariophyceae over a 15 day time interval (from the 7th to the22nd of April). This was followed by a period of dominance by thecyanobacterium Planktothrix rubescens (Table S2), which accountedfor 92% of all phytoplankton cells (Table S2) in the communitycharacterized by a metalimnetic Chl-a maximum.Phytoplankton abundance and biovolume peaked between day
16 and 26 (between the 7th and the 17th of April) and at the end ofthe time series (Fig. 2A). The spring phytoplankton bloom wascoupled to a parallel increase in the density of herbivorousplanktonic ciliates (Fig. 2B). These were mainly taxa of the ordersOligotrichida and Prostomatida, which preferentially prey on Cryp-tomonads and small diatoms. The density of herbivorous ciliatesshowed a peak just after phytoplankton reached the maximumabundance on day 23 of the time series, and phytoplankton densityconcomitantly declined (Fig. 2B). Meso- and macro-zooplankton(Copepoda and Cladocera), which increased in abundance inMay-June, may have been responsible for grazing at the end of thespring bloom succession (Fig. 2B).The peak of phytoplankton biomass and herbivore ciliate
density was associated with the highest phytoplankton richness atthe depth of maximum Chl-a, both in terms of species and flow-cytometry derived groups (Fig. 2C). The number of phytoplanktontaxa was higher than flow-cytometry derived groups throughoutthe bloom and grazing period, during which they reached amaximum of 22 and 20 units, respectively, at maximum. After theperiod of intense grazing, the dynamics of phytoplankton taxa andtrait-based groups appeared to be slightly de-coupled, with largernumbers of taxa associated with lower levels of trait-based richness(Fig. 2C). Patterns of turnover of phytoplankton taxa and trait-based groups, assessed as pairwise measurements of Bray-Curtisdissimilarity among adjacent time points, showed that microscopicand flow-cytometry based analyzes captured similar trends, with
the dynamics of trait-based groups being more pronounced(Fig. 2D).
Trait-environment RelationshipsOverall, trait-environment relationships assessed in this study
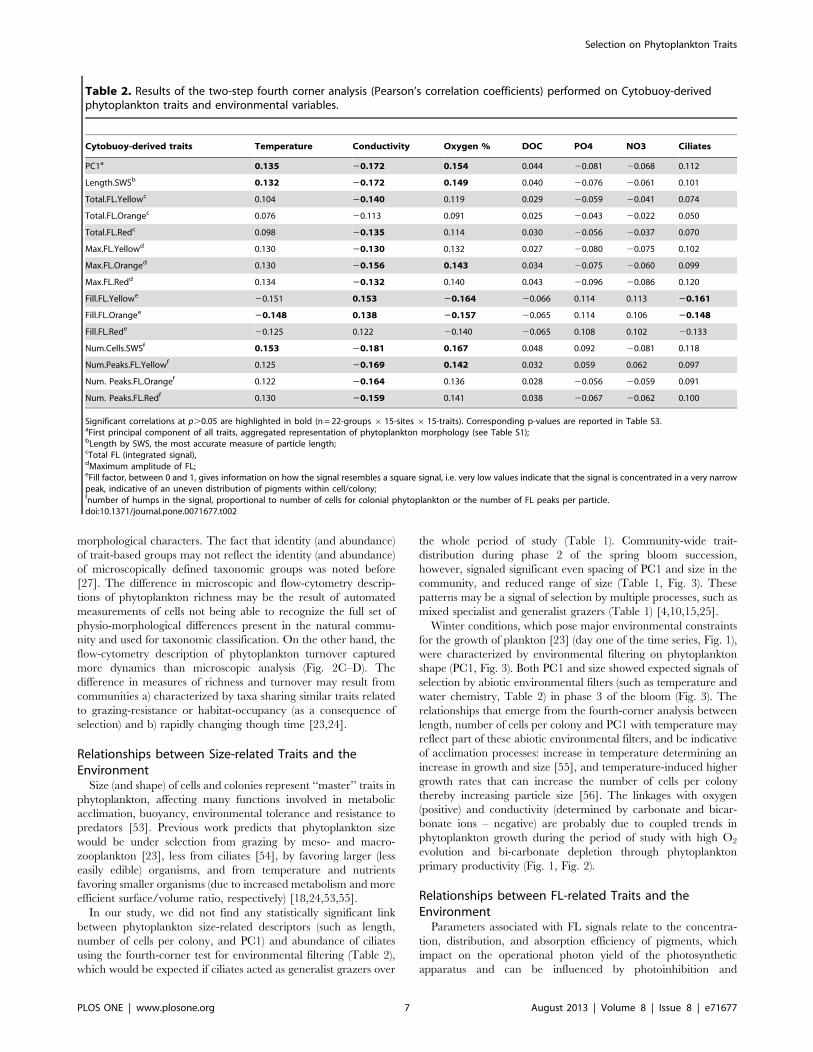
appeared to be rather weak (Table 2 and Table S3), with Pearson’scorrelation values ranging from –0.181 to +0.166. Measuredphytoplankton traits appeared to correlate more significantly withconductivity, oxygen and temperature (Tables 2 and S3). PC1 (anaggregated descriptor of particle morphology, Table S1), numberof cells per colony, total (integrated) and maximum levels of FLsignals all directly co-varied with the size (length) of phytoplanktonparticles (data not shown) and therefore responded similarly toenvironmental variables with regards to the significance of therelationship, albeit with slightly different correlation coefficients(Table 2). These size-related traits showed a positive correlationwith temperature and oxygen levels, and a negative correlationwith conductivity (Table 2). The Fill factor of FL signals (withinparticle distribution of pigments) showed opposite relationships toenvironmental conditions compared to size-related traits (Table 2).No significant linkage between traits and nutrients was found ata=0.05. For a=0.1, the Fill factor of FL signals appeared to beweakly and positively linked to free available PO4 (Table S3). TheFill factor of orange (phycocyanin) and yellow (decaying pigments)fluorescence also showed to be negatively related to the abundanceof herbivore ciliates in the community (Table 2).
Patterns in Community Wide Trait-distributionsWe chose four phytoplankton descriptors as representative for
size- and FL-related traits: length by SWS, PC1, Fill factor for Chl-a (Fill.FLR) and phycocyanin (Fill.FLO). To assess deviations fromrandom patterns in their distributions in the phytoplanktoncommunity, we considered three distinct phases in the period ofstudy: (1) before start of the spring bloom (day 1 to 16, between the23rd of March and the 7th of April); (2) the actual spring bloomsuccession of producers and their grazers (day 18 to 31, betweenthe 9th and the 22nd of April); (3) the period after the bloomcharacterized by the outcome of dynamic community interactionsfrom phase 2 and the dominance of P. rubescens (day 33 to 45,between the 24th of April and the 6th of May).Before the spring bloom and the period of grazing (phase 1),
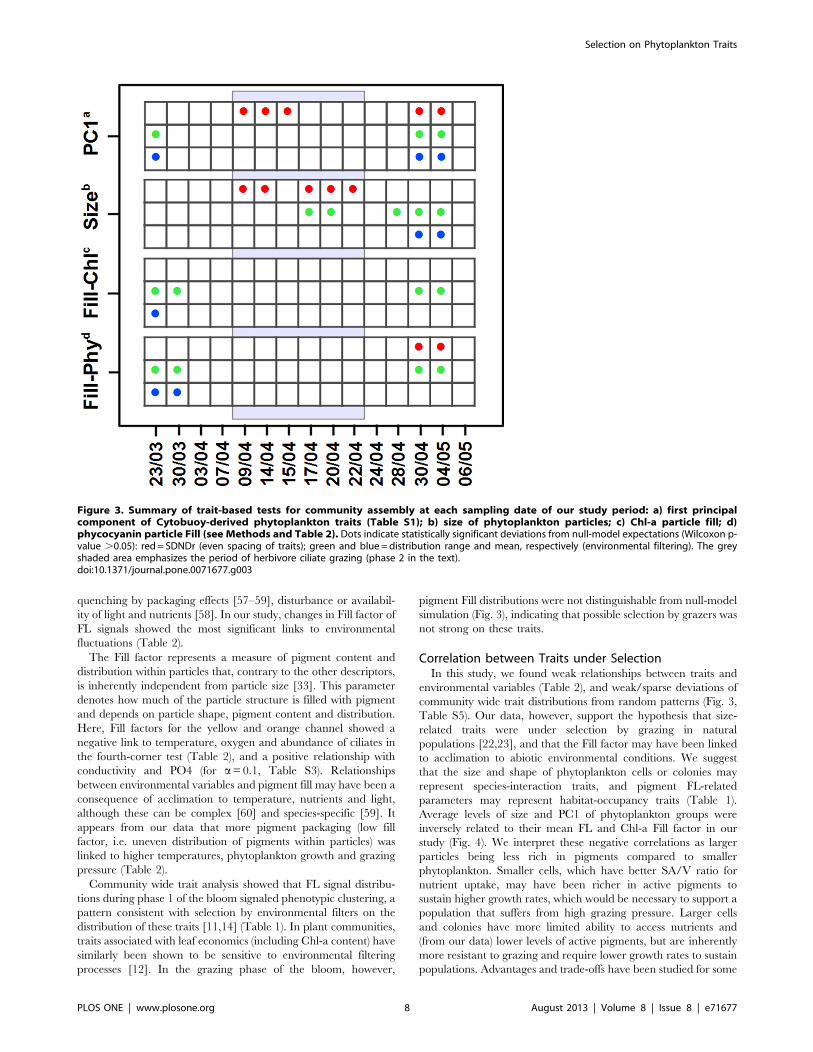
Chl-a and phycocyanin Fill factors showed statistically significantevidence for a shift in mean values, and a reduced range comparedto the null-model expectation in the first and second days of ourtime-series (Fig. 3 and Table S4–S5). This initial period,characterized mainly by low algal proliferation, appeared to beassociated with phytoplankton size distributions that were notdistinguishable from null-model expectations (Fig. 3 and TablesS4–S5). PC1, a multivariate phytoplankton descriptor that hasboth size, shape, and FL related components, showed significantsignals of environmental filtering in day 1 (Fig. 3).The second phase was characterized by significant evidence for
even spacing of PC1 and size of phytoplankton particles (Fig. 3). Inthe phytoplankton size distributions, we also found evidence forreduced range during herbivore grazing (Fig. 3). During grazing,community-wide distributions in Chl-a and phycocyanin Fillfactors were not significantly different from random expectations(Fig. 3).After the peak in density of ciliate herbivores (phase 3), all the
chosen traits showed some significant reduction in range withinthe community, with PC1 and size also displaying shifts in meanvalues comparing to null model expectations (30th of April and 4th
of May, Fig. 3). At the same time SDNDr of PC1 and phycocyaninFill factor signaled non-random patterns of even spacing of traits
Selection on Phytoplankton Traits
PLOS ONE | www.plosone.org 4 August 2013 | Volume 8 | Issue 8 | e71677

Figure 1. Spring bloom dynamics in Lake Zurich over the period of study (45 days between March 23 and May 6, 2009). (A) watertemperature (black solid line) and conductivity (grey dashed line); (B) free available phosphorus (black solid line) and nitrates (grey dashed line); (C)depth of the Chl-a maximum (the sampled community, black solid line) and oxygen levels (grey dashed line); (D) Chl-a concentration (black solid line)and dissolved organic carbon (grey dashed line).doi:10.1371/journal.pone.0071677.g001
Selection on Phytoplankton Traits
PLOS ONE | www.plosone.org 5 August 2013 | Volume 8 | Issue 8 | e71677

(Fig. 3). PC1 and phycocyanin Fill, therefore, showed significantevidence for trait clustering and even dispersion, respectively, atthe same time. Overall, however, standard effect sizes computedfor our statistics were relatively small (Table S5), suggesting modestdeviations from null model expectations.
Discussion
Spring Bloom DynamicsIn temperate lakes, spring blooms are commonly triggered by
the transition from strong to weak vertical mixing and theassociated onset of thermal stratification of the water column, dueto heat flux increase [44,45]. The bloom and the succession thatfollows are summarized by the broadly accepted Plankton EcologyGroup (PEG) model [22,23]. The original PEG model suggeststhat the main drivers of spring phytoplankton communities arephysics (responding to the weather), grazing, and water chemistry[23]. Ciliates are the first herbivores appearing in spring and thefirst to graze on the phytoplankton community, and theirimportant role in spring-bloom dynamics has become increasinglyrecognized [22,46,47]. Our data suggest ciliates were the maingrazers of the phytoplankton community during the early spring-bloom, and were followed by multicellular larger zooplanktonspecies [46,47] (Copepods and Cladocera) that may have played a
role as grazers after the ciliate bloom was over (Fig. 2B) [23,46][47]. Mixotrophic algae, such as some Chrysophytes, Crypto-phytes and Dinophytes that are able to eat bacteria and smallereukaryotic algae and were present in the spring phytoplanktoncommunity (Table S2), may have played a minor role in thegrazing phase of the bloom [24]. The outcome of the grazingperiod was the dominance of P. rubescens, which is inedible, toxic[48,49] and known to dominate the Lake Zurich phytoplanktoncommunity for extended periods of the year [48,49] [50].In our study, the descriptions of the phytoplankton spring
bloom obtained by flow-cytometry and microscopy appeared to besimilar. Cytobuoy-derived phytoplankton concentrations weresimilar to microscopic counts throughout the bloom period,except from the peak of phytoplankton abundance in which flow-cytometry counts exceeded microscopic counts by a factor of 2(data not shown). Biovolume levels obtained by Cytobuoy analysisfall within the range expected for the spring community in lakeZurich [51,52]. Previous work has highlighted how phytoplanktonrichness derived by using flow-cytometry based groups can becomparable with the total number of taxa detected by microscopy[27,28].In this study flow-cytometry derived richness appeared to
deviate from species richness (Fig. 2C). Cytobuoy trait-basedclasses may include more than one species sharing similar physio-
Figure 2. Spring bloom dynamics in Lake Zurich over the period of study (45 days between March 23 and May 6, 2009) at the depthof Chl-a maximum (Fig. 1). (A) Total biovolume of phytoplankton cells measured by flow-cytometry (black solid line) and phytoplanktonconcentration obtained by microscopic counts (grey line). (B) Concentration of pelagic herbivore ciliates (black line) and counts for Cladocerans (#)and Copepods (e). Richness (C) and pairwise Bray-Curtis dissimilarity (calculated for adjacent time points, D) of phytoplankton groups derived byflow-cytometry analysis compared to taxonomic groups obtained by microscopy.doi:10.1371/journal.pone.0071677.g002
Selection on Phytoplankton Traits
PLOS ONE | www.plosone.org 6 August 2013 | Volume 8 | Issue 8 | e71677
morphological characters. The fact that identity (and abundance)of trait-based groups may not reflect the identity (and abundance)of microscopically defined taxonomic groups was noted before[27]. The difference in microscopic and flow-cytometry descrip-tions of phytoplankton richness may be the result of automatedmeasurements of cells not being able to recognize the full set ofphysio-morphological differences present in the natural commu-nity and used for taxonomic classification. On the other hand, theflow-cytometry description of phytoplankton turnover capturedmore dynamics than microscopic analysis (Fig. 2C–D). Thedifference in measures of richness and turnover may result fromcommunities a) characterized by taxa sharing similar traits relatedto grazing-resistance or habitat-occupancy (as a consequence ofselection) and b) rapidly changing though time [23,24].
Relationships between Size-related Traits and theEnvironmentSize (and shape) of cells and colonies represent ‘‘master’’ traits in
phytoplankton, affecting many functions involved in metabolicacclimation, buoyancy, environmental tolerance and resistance topredators [53]. Previous work predicts that phytoplankton sizewould be under selection from grazing by meso- and macro-zooplankton [23], less from ciliates [54], by favoring larger (lesseasily edible) organisms, and from temperature and nutrientsfavoring smaller organisms (due to increased metabolism and moreefficient surface/volume ratio, respectively) [18,24,53,55].In our study, we did not find any statistically significant link
between phytoplankton size-related descriptors (such as length,number of cells per colony, and PC1) and abundance of ciliatesusing the fourth-corner test for environmental filtering (Table 2),which would be expected if ciliates acted as generalist grazers over
the whole period of study (Table 1). Community-wide trait-distribution during phase 2 of the spring bloom succession,however, signaled significant even spacing of PC1 and size in thecommunity, and reduced range of size (Table 1, Fig. 3). Thesepatterns may be a signal of selection by multiple processes, such asmixed specialist and generalist grazers (Table 1) [4,10,15,25].Winter conditions, which pose major environmental constraints
for the growth of plankton [23] (day one of the time series, Fig. 1),were characterized by environmental filtering on phytoplanktonshape (PC1, Fig. 3). Both PC1 and size showed expected signals ofselection by abiotic environmental filters (such as temperature andwater chemistry, Table 2) in phase 3 of the bloom (Fig. 3). Therelationships that emerge from the fourth-corner analysis betweenlength, number of cells per colony and PC1 with temperature mayreflect part of these abiotic environmental filters, and be indicativeof acclimation processes: increase in temperature determining anincrease in growth and size [55], and temperature-induced highergrowth rates that can increase the number of cells per colonythereby increasing particle size [56]. The linkages with oxygen(positive) and conductivity (determined by carbonate and bicar-bonate ions – negative) are probably due to coupled trends inphytoplankton growth during the period of study with high O2
evolution and bi-carbonate depletion through phytoplanktonprimary productivity (Fig. 1, Fig. 2).
Relationships between FL-related Traits and theEnvironmentParameters associated with FL signals relate to the concentra-
tion, distribution, and absorption efficiency of pigments, whichimpact on the operational photon yield of the photosyntheticapparatus and can be influenced by photoinhibition and
Table 2. Results of the two-step fourth corner analysis (Pearson’s correlation coefficients) performed on Cytobuoy-derivedphytoplankton traits and environmental variables.
Cytobuoy-derived traits Temperature Conductivity Oxygen % DOC PO4 NO3 Ciliates
PC1a 0.135 20.172 0.154 0.044 20.081 20.068 0.112
Length.SWSb 0.132 20.172 0.149 0.040 20.076 20.061 0.101
Total.FL.Yellowc 0.104 20.140 0.119 0.029 20.059 20.041 0.074
Total.FL.Orangec 0.076 20.113 0.091 0.025 20.043 20.022 0.050
Total.FL.Redc 0.098 20.135 0.114 0.030 20.056 20.037 0.070
Max.FL.Yellowd 0.130 20.130 0.132 0.027 20.080 20.075 0.102
Max.FL.Oranged 0.130 20.156 0.143 0.034 20.075 20.060 0.099
Max.FL.Redd 0.134 20.132 0.140 0.043 20.096 20.086 0.120
Fill.FL.Yellowe 20.151 0.153 20.164 20.066 0.114 0.113 20.161
Fill.FL.Orangee 20.148 0.138 20.157 20.065 0.114 0.106 20.148
Fill.FL.Rede 20.125 0.122 20.140 20.065 0.108 0.102 20.133
Num.Cells.SWSf 0.153 20.181 0.167 0.048 0.092 20.081 0.118
Num.Peaks.FL.Yellowf 0.125 20.169 0.142 0.032 0.059 0.062 0.097
Num. Peaks.FL.Orangef 0.122 20.164 0.136 0.028 20.056 20.059 0.091
Num. Peaks.FL.Redf 0.130 20.159 0.141 0.038 20.067 20.062 0.100
Significant correlations at p.0.05 are highlighted in bold (n = 22-groups 6 15-sites 6 15-traits). Corresponding p-values are reported in Table S3.aFirst principal component of all traits, aggregated representation of phytoplankton morphology (see Table S1);bLength by SWS, the most accurate measure of particle length;cTotal FL (integrated signal),dMaximum amplitude of FL;eFill factor, between 0 and 1, gives information on how the signal resembles a square signal, i.e. very low values indicate that the signal is concentrated in a very narrowpeak, indicative of an uneven distribution of pigments within cell/colony;fnumber of humps in the signal, proportional to number of cells for colonial phytoplankton or the number of FL peaks per particle.doi:10.1371/journal.pone.0071677.t002
Selection on Phytoplankton Traits
PLOS ONE | www.plosone.org 7 August 2013 | Volume 8 | Issue 8 | e71677
quenching by packaging effects [57–59], disturbance or availabil-ity of light and nutrients [58]. In our study, changes in Fill factor ofFL signals showed the most significant links to environmentalfluctuations (Table 2).The Fill factor represents a measure of pigment content and
distribution within particles that, contrary to the other descriptors,is inherently independent from particle size [33]. This parameterdenotes how much of the particle structure is filled with pigmentand depends on particle shape, pigment content and distribution.Here, Fill factors for the yellow and orange channel showed anegative link to temperature, oxygen and abundance of ciliates inthe fourth-corner test (Table 2), and a positive relationship withconductivity and PO4 (for a=0.1, Table S3). Relationshipsbetween environmental variables and pigment fill may have been aconsequence of acclimation to temperature, nutrients and light,although these can be complex [60] and species-specific [59]. Itappears from our data that more pigment packaging (low fillfactor, i.e. uneven distribution of pigments within particles) waslinked to higher temperatures, phytoplankton growth and grazingpressure (Table 2).Community wide trait analysis showed that FL signal distribu-
tions during phase 1 of the bloom signaled phenotypic clustering, apattern consistent with selection by environmental filters on thedistribution of these traits [11,14] (Table 1). In plant communities,traits associated with leaf economics (including Chl-a content) havesimilarly been shown to be sensitive to environmental filteringprocesses [12]. In the grazing phase of the bloom, however,
pigment Fill distributions were not distinguishable from null-modelsimulation (Fig. 3), indicating that possible selection by grazers wasnot strong on these traits.
Correlation between Traits under SelectionIn this study, we found weak relationships between traits and
environmental variables (Table 2), and weak/sparse deviations ofcommunity wide trait distributions from random patterns (Fig. 3,Table S5). Our data, however, support the hypothesis that size-related traits were under selection by grazing in naturalpopulations [22,23], and that the Fill factor may have been linkedto acclimation to abiotic environmental conditions. We suggestthat the size and shape of phytoplankton cells or colonies mayrepresent species-interaction traits, and pigment FL-relatedparameters may represent habitat-occupancy traits (Table 1).Average levels of size and PC1 of phytoplankton groups wereinversely related to their mean FL and Chl-a Fill factor in ourstudy (Fig. 4). We interpret these negative correlations as largerparticles being less rich in pigments compared to smallerphytoplankton. Smaller cells, which have better SA/V ratio fornutrient uptake, may have been richer in active pigments tosustain higher growth rates, which would be necessary to support apopulation that suffers from high grazing pressure. Larger cellsand colonies have more limited ability to access nutrients and(from our data) lower levels of active pigments, but are inherentlymore resistant to grazing and require lower growth rates to sustainpopulations. Advantages and trade-offs have been studied for some
Figure 3. Summary of trait-based tests for community assembly at each sampling date of our study period: a) first principalcomponent of Cytobuoy-derived phytoplankton traits (Table S1); b) size of phytoplankton particles; c) Chl-a particle fill; d)phycocyanin particle Fill (see Methods and Table 2). Dots indicate statistically significant deviations from null-model expectations (Wilcoxon p-value .0.05): red= SDNDr (even spacing of traits); green and blue =distribution range and mean, respectively (environmental filtering). The greyshaded area emphasizes the period of herbivore ciliate grazing (phase 2 in the text).doi:10.1371/journal.pone.0071677.g003
Selection on Phytoplankton Traits
PLOS ONE | www.plosone.org 8 August 2013 | Volume 8 | Issue 8 | e71677

important phytoplankton physiological and morphological traitsrelated to nutrient and light acquisition/utilization and predatoravoidance, which impact on access to resources, growth, survivaland reproduction [17,18,53]. Our data support laboratory studieshighlighting the role of size and shape related traits for growth andresistance to grazing with evidence from natural phytoplanktoncommunities, and suggest a tradeoff between environmentaltolerance (in this case related to photosynthetic performance andacclimation to different depths) and grazing resistance traits(Fig. 4).
Conclusions and OutlookIn this study we presented an approach to study phytoplankton
biodiversity based on scanning flow-cytometry, allowing tomeasure individually expressed phytoplankton physio-morpholog-ical traits and to test their response to environmental changes. Ourapproach is different from previously employed trait-basedapproaches (relying on species-averaged traits, qualitative infor-mation and/or laboratory acclimated populations) since it allowsto classify individually scanned particles into categories thatreflected the physiological and morphological state of theorganisms in their natural environment [29]. It should be noted,however, that Cytobuoy data lack physiological traits directlyassociated with nutrient uptake and metabolism, as well as generalbehavioral and life-history traits which may be important inunderstanding ecological interactions and community dynamics.Integration of scanning flow-cytometry data with additional traitinformation can broaden the list of possible traits under ecologicalselection, and may allow finer studies in the future targetingcoexistence mechanisms, such as testing for niche and neutralprocesses in natural phytoplankton communities.Overall, during a dynamic spring bloom succession of producers
and their grazers, we detected evidence for selection on a set ofphytoplankton physio-morphological traits in natural communi-ties. Our data support the hypothesis that size- and morphology-related traits are those under the strongest selection from grazingand suggest that FL signals, and in particular pigment Fill, may beimportant traits linked to phytoplankton acclimation to the abioticenvironment. A distinction of these traits into habitat differencesand competitive ability differences (as in Table 1) may allow in thefuture a better understanding of species coexistence mechanisms[1,3,4]. Our data suggest a trade-offs among key competitive traitssuch as size, shape and coloniality (which influence grazingresistance), and active pigment levels, which relate to photosyn-thetic performance and acclimation to different habitats over thevertical structure of a deep lake.Our study, however, has limitations and more work is needed to
truly characterize Cytobuoy-derived traits. We relied on availabletests that are based on trait-means per group, and recent evidencesuggests that accounting for within-group trait variation increasesthe power of trait-based tests [12,61]. Additionally, previous workhas suggested that fourth-corner results and null model based traitdispersion analyses can be sensitive to a) low number of species, b)if the investigated species have wide environmental tolerance, oralternatively c) if data are affected by the presence of backgroundrandom noise, which is expected in complex scenarios [14,30]. Allthese factors may have affected our ability to detect and correctlyinterpret trait-patterns. An additional limitation of our study laysin analysis of a single bloom event, not replicated across seasons orover different years. Ecological events like spring blooms may beextremely context dependent and sensitive to the contingentweather and water conditions. Recent developments in automatedaquatic ecosystem monitoring may aid in this direction, allowingto track changes in phytoplankton morpho-physiological catego-ries and their traits under selection relative to their growthenvironment across seasons and years [27].
Supporting Information
Table S1 Factor loadings of PCA on Cytobuoy-derivedparameters.(DOCX)
Table S2 Microscopic counts (cells/mL) and taxonomicaffiliation of Lake Zurich phytoplankton during theperiod of study.
Figure 4. Correlations between average values of hypothesizedhabitat-occupancy and species-interaction traits for the 22groups derived in this study by flow-cytometry. A) relationshipbetween average size and PC3 (phytoplankton FL); B) relationshipbetween PC1 (phytoplankton morphology) and Chl-a pigment fill. ForPC loadings see Table S1. Dashed lines represent linear regressionmodels (all fits and coefficients were significant at p,0.05). Thetriangular data point in A and B represents a group characterized bylarge P. rubescens filaments (data not shown), which appeared to be anoutlier in all trait correlations and was excluded from the correspondingregression models.doi:10.1371/journal.pone.0071677.g004
Selection on Phytoplankton Traits
PLOS ONE | www.plosone.org 9 August 2013 | Volume 8 | Issue 8 | e71677

(DOCX)
Table S3 Results of the two-step fourth corner analysis(p-values) performed on Cytobuoy-derived phytoplank-ton traits and environmental variables.(DOCX)
Table S4 Results of trait-based tests (p-values) ofcommunity assembly for Cytobuoy-derived traits ateach sampling date of our study period.(DOCX)
Table S5 Results of trait-based tests (standardizedeffect sizes) of community assembly for Cytobuoy-derived traits at each sampling date of our study period.
(DOCX)
Acknowledgments
The authors would like to thank Regula Illi for phytoplankton microscopiccounts and O. Koster for discussion and availability of zooplankton data.
Author Contributions
Conceived and designed the experiments: FP BWI. Performed theexperiments: FP TP BE. Analyzed the data: FP NJK TP BE JJ.Contributed reagents/materials/analysis tools: TP BWI. Wrote the paper:FP NJK TP JJ BWI.
References
1. Chesson P (2000) Mechanisms of maintenance of species diversity. AnnualReview of Ecology and Systematics 31: 343–366.
2. Hubbell SP (2001) The Unified Neutral Theory of Biodiversity andBiogeography. Princeton: Princeton University Press.
3. Adler PB, Hillerislambers J, Levine JM (2007) A niche for neutrality. Ecologyletters 10: 95–104.
4. Mayfield MM, Levine JM (2010) Opposing effects of competitive exclusion onthe phylogenetic structure of communities. Ecology letters 13: 1085–1093.
5. Vellend M (2010) Conceptual synthesis in community ecology. The Quarterlyreview of biology 85: 183–206.
6. Weiher E, Keddy PA (1995) Assembly rules, null models, and trait dispersion :new questions from old patterns. Oikos 74: 159–164.
7. McGill BJ, Enquist BJ, Weiher E, Westoby M (2006) Rebuilding communityecology from functional traits. Trends in ecology & evolution 21: 178–185.
8. Weiher E, Freund D, Bunton T, Stefanski A, Lee T, et al. (2011) Advances,challenges and a developing synthesis of ecological community assembly theory.Philosophical transactions of the Royal Society of London Series B, Biologicalsciences 366: 2403–2413.
9. Suding KN, Goldstein LJ (2008) Testing the Holy Grail framework: usingfunctional traits to predict ecosystem change. New Phytologist 180: 559–562.
10. Chesson P, Kuang JJ (2008) The interaction between predation andcompetition. Nature 456: 235–238.
11. Kraft NJB, Valencia R, Ackerly DD (2008) Functional traits and niche-basedtree community assembly in an Amazonian forest. Science 322: 580–582.
12. Paine CET, Baraloto C, Chave J, Herault B (2011) Functional traits ofindividual trees reveal ecological constraints on community assembly in tropicalrain forests. Oikos 120: 720–727.
13. Cornwell WK, Ackerly DD (2009) Community assembly and shifts in plant traitdistributions across an environmental gradient in coastal California. EcologicalMonographs 79: 109–126.
14. Kraft NJB, Ackerly DD (2010) Functional trait and phylogenetic tests ofcommunity assembly across spatial scales in an Amazonian forest. EcologicalMonographs 80: 401–422.
15. Cavender-Bares J, Kozak KH, Fine PVa, Kembel SW (2009) The merging ofcommunity ecology and phylogenetic biology. Ecology letters 12: 693–715.
16. Brose U (2008) Complex food webs prevent competitive exclusion amongproducer species. Proceedings of The Royal Society of London B 275: 2507–2514.
17. Litchman E, Klausmeier CA, Schofield OM, Falkowski PG (2007) The role offunctional traits and trade-offs in structuring phytoplankton communities:scaling from cellular to ecosystem level. Ecology letters 10: 1170–1181.
18. Litchman E, Klausmeier Ca (2008) Trait-Based Community Ecology ofPhytoplankton. Annual Review of Ecology, Evolution, and Systematics 39:615–639.
19. Edwards KF, Litchman E, Klausmeier CA (2012) Functional traits explainphytoplankton community structure and seasonal dynamics in a marineecosystem. Ecology Letters: In press.
20. Ackerly DD, Cornwell WK (2007) A trait-based approach to communityassembly: partitioning of species trait values into within- and among-communitycomponents. Ecology letters 10: 135–145.
21. Merico A, Bruggeman J, Wirtz K (2009) A trait-based approach for downscalingcomplexity in plankton ecosystem models. Ecological Modelling 220: 3001–3010.
22. Sommer U, Adrian R, De Senerpont Domis L, Elser JJ, Gaedke U, et al. (2012)Beyond the Plankton Ecology Group (PEG) Model: Mechanisms DrivingPlankton Succession. Annual Review of Ecology, Evolution, and Systematics 43:429–448.
23. Sommer U, Gliwicz ZM, Lampert W, Duncan A (1986) The PEG-model ofseasonal succession of planktonic events in fresh waters. Archiv fur Hydro-biologie 106: 433–471.
24. Reynolds CS (2006) Ecology of Phytoplankton; Reynolds CS, editor. Cam-bridge: Cambridge University Press.
25. Tirok K, Bauer B, Wirtz K, Gaedke U (2011) Predator-prey dynamics driven byfeedback between functionally diverse trophic levels. PloS one 6: e27357.
26. Collier JL (2000) Flow Cytometry and the Single Cell in Phycology. Journal ofPhycology 36: 628–644.
27. Pomati F, Jokela J, Simona M, Veronesi M, Ibelings BW (2011) An AutomatedPlatform for Phytoplankton Ecology and Aquatic Ecosystem Monitoring.Environmental science & technology 45: 9658–9665.
28. Malkassian A, Nerini D, van Dijk Ma, Thyssen M, Mante C, et al. (2011)Functional analysis and classification of phytoplankton based on data from anautomated flow cytometer. Cytometry Part A : the journal of the InternationalSociety for Analytical Cytology 79: 263–275.
29. Pomati F, Nizzetto L (2013) Assessing triclosan-induced ecological and trans-generational effects in natural phytoplankton communities: a trait-based fieldmethod. Ecotoxicology: Published online ahead of print.
30. Dray S, Legendre P (2008) Testing the species traits-environment relationships:the fourth-corner problem revisited. Ecology 89: 3400–3412.
31. Pfister G, Sonntag B, Posch T (1999) Comparison of a direct live count and animproved quantitative protargol stain (QPS) in determining abundance and cellvolumes of pelagic freshwater protozoa. Aquatic Microbial Ecology 18: 95–103.
32. Standard Methods for the Examination of Water and Wastewater. 22nd ed(2012): American Water Works Association/American Public Works Associa-tion/Water Environment Federation.
33. Dubelaar GBJ, Tangen PL (1999) Design and first results of CytoBuoy: Awireless flow cytometer for in situ analysis of marine and fresh waters. Cytometry37: 247–254.
34. Dubelaar GBJ, Geerders PJF, Jonker RR (2004) High frequency monitoringreveals phytoplankton dynamics. Journal of Environmental Monitoring 6: 946–952.
35. R-Development-Core-Team (2013) R: A Language and Environment forStatistical Computing. R Foundation for Statistical Computing. Available:http://www.R-project.org/. Accessed July 2013.
36. Foladori P, Quaranta A, Ziglio G (2008) Use of silica microspheres havingrefractive index similar to bacteria for conversion of flow cytometric forwardlight scatter into biovolume. Water research 42: 3757–3766.
37. Reynolds CS (2002) Towards a functional classification of the freshwaterphytoplankton. Journal of Plankton Research 24: 417–428.
38. Padisak J, Crossetti LO, Naselli-Flores L (2008) Use and misuse in theapplication of the phytoplankton functional classification: a critical review withupdates. Hydrobiologia 621: 1–19.
39. Kruk C, Huszar VLM, Peeters EHMTHM, Bonilla S, Costa L, et al. (2010) Amorphological classification capturing functional variation in phytoplankton.Freshwater Biology 55: 614–627.
40. Salmaso N, Padisak J (2007) Morpho-Functional Groups and phytoplanktondevelopment in two deep lakes (Lake Garda, Italy and Lake Stechlin, Germany).Hydrobiologia 578: 97–112.
41. Fraley C, Raftery AE (2002) Model-based Clustering, Discriminant Analysis andDensity Estimation. Journal of the American Statistical Association 97: 611–631.
42. Sosik HM, Olson RJ, Armbrust EV (2010) Flow Cytometry in PhytoplanktonResearch. In: Suggett DJ, Prasil O, Borowitzka MA, editors. Chlorophyll aFluorescence in Aquatic Sciences: Methods and Applications. Dordrecht:Springer Netherlands. 171–185.
43. ter Braak CJF, Cormont A, Dray S (2012) Improved testing of species traits-environment relationships in the fourth cirner problem. Ecology: In Press.
44. Peeters F, Straile D, Lorke A, Livingstone DM (2007) Earlier onset of the springphytoplankton bloom in lakes of the temperate zone in a warmer climate. GlobalChange Biology 13: 1898–1909.
45. Peeters F, Straile D, Lorke A, Ollinger D (2007) Turbulent mixing andphytoplankton spring bloom development in a deep lake. Limnology andOceanography 52: 286–298.
46. Tirok K, Gaedke U (2006) Spring weather determines the relative importance ofciliates, rotifers and crustaceans for the initiation of the clear-water phase in alarge, deep lake. Journal of Plankton Research 28: 361–373.
Selection on Phytoplankton Traits
PLOS ONE | www.plosone.org 10 August 2013 | Volume 8 | Issue 8 | e71677

47. Tirok K, Gaedke U (2007) Regulation of planktonic ciliate dynamics andfunctional composition during spring in Lake Constance. Aquatic MicrobialEcology 49: 87–100.
48. Kurmayer R, Juttner F (1999) Strategies for the co-existence of zooplankton withthe toxic cyanobacterium Planktothrix rubescens in Lake Zurich. Journal ofPlankton Research 21: 659–683.
49. Walsby AE, Dubinsky Z, Kromkamp JC, Lehmann C, Schanz F (2001) Theeffects of diel changes in photosynthetic coefficients and depth of Planktothrixrubescens on the daily integral of photosynthesis in Lake Zurich. AquaticSciences 63: 326–349.
50. Anneville O, Souissi S, Gammeter S, StraileD, Straile D, et al. (2004) Seasonaland inter-annual scales of variability in phytoplankton assemblages : comparisonof phytoplankton dynamics in three peri-alpine lakes over a period of 28 years.Freshwater Biology 49: 98–115.
51. Pomati F, Matthews B, Jokela J, Schildknecht A, Ibelings BW (2012) Effects ofre-oligotrophication and climate warming on plankton richness and communitystability in a deep mesotrophic lake. Oikos 121: 1317–1327.
52. Posch T, Koster O, Salcher MM, Pernthaler J (2012) Harmful filamentouscyanobacteria favoured by reduced water turnover with lake warming. NatureClimate Change 2: 809–813.
53. Litchman E, de Tezanos Pinto P, Klausmeier Ca, Thomas MK, Yoshiyama K(2010) Linking traits to species diversity and community structure inphytoplankton. Hydrobiologia 653: 15–28.
54. Miiller H, Schlegel A (1999) Responses of three freshwater danktonic ciliateswith different feeding modes to cryptophyte and diatom prey. Aquatic MicrobialEcology 17: 49–60.
55. Atkinson D, Ciotti BJ, Montagnes DJS (2003) Protists decrease in size linearlywith temperature: ca. 2.5% degrees C(21). Proceedings of The Royal Society ofLondon B 270: 2605–2611.
56. Takabayashi M (2006) The effect of nutrient availability and temperature onchain length of the diatom, Skeletonema costatum. Journal of Plankton Research28: 831–840.
57. Ibelings BW, Kroon BMA, Mur LR (1994) Acclimation of photosystem II in acyanobacterium and a eukaryotic green alga to high and fluctuatingphotosynthetic photon flux densities, simulating light regimes induced by mixingin lakes. New Phytologist 128: 407–424.
58. Toepel J, Langner U, Wilhelm C (2005) Combination of Flow Cytometry andSingle Cell Absorption Spectroscopy To Study the Phytoplankton Structure andTo Calculate the Chl a Specific Absorption Coefficients At the Taxon Level1.Journal of Phycology 41: 1099–1109.
59. Hancke K, Hancke TB, Olsen LM, Johnsen G, Glud RN (2008) TemperatureEffects on Microalgal Photosynthesis-Light Responses Measured By O 2Production, Pulse-Amplitude-Modulated Fluorescence, and 14 C Assimilation.Journal of Phycology 44: 501–514.
60. Ross o, Geider RRJ (2009) New cell-based model of photosynthesis and photo-acclimation: accumulation and mobilisation of energy reserves in phytoplankton.Marine Ecology Progress Series 383: 53–71.
61. Clark JS (2010) Individuals and the variation needed for high species diversity inforest trees. Science 327: 1129–1132.
Selection on Phytoplankton Traits
PLOS ONE | www.plosone.org 11 August 2013 | Volume 8 | Issue 8 | e71677

![Advances in Water Resources · using laser scanning confocal microscopy [37]. Pore- and throat-size distributions have also been obtained from analysis of 2D scanning electron microscopy](https://img.dokumen.tips/doc/110x75/5f08efb57e708231d4247165/advances-in-water-resources-using-laser-scanning-confocal-microscopy-37-pore-.jpg)