Embed Size (px)
Citation preview

Indicators of Social andFamily Functioning
May 2000ISBN 0 642 44986 4

Indicators of Social and
Family Functioning
SR Zubrick, AA Williams, SR Silburn, (TVW Telethon Institute for ChildHealth Research, Perth, Western Australia) and
G Vimpani (Child and Youth Health Network, University of Newcastle)
May 2000
Department of Family and Community Services.

i i
© Commonwealth of Australia 2000
ISBN 0 642 44986 4
This work is copyright. Apart from any use as permitted under the Copyright Act1968, no part may be reproduced by any process without prior written permissionfrom the Commonwealth, available from AusInfo. Requests and inquiries concerningreproduction and rights should be addressed to the Manager, Legislative Services,AusInfo, GPO Box 1920, Canberra ACT 2601.
The views expressed in this paper are those of the authors and do not represent theviews of the Minister for Family and Community Services or the Department ofFamily and Community Services.
www.facs.gov.au
For information contact the Department of Family and Community Services on1300 653 227. People with a hearing or speech impairment can contact theDepartment on its telephone typewriter (TTY) on 1800 260 402.

TABLE OF CONTENTS
Acknowledgements vi
Glossary vii
Executive summary ix
Terms of reference x
Project background x
Findings x
1. Introduction 1
Background 2
Terms of reference 3
Scope 4
2. Methods 5
Defining the project 5
Searching the literature 5
Conducting a national workshop 6
3. The relationship between social and family functioning and child health 7and well-being
Characteristics of health and well-being outcomes 8
Child health and social/family functioning: Ecological links 10
Distinguishing indicators of social and family functioning from 11health and well-being outcomes
4. Resource domains which influence social and family functioning 14
Income 16
Time 21
Human capital 24
Psychological capital 27
Social capital 30
The mix and interaction of family resources 32
The accumulation and loss of family resources 33
Availability of data 34
Associating indicators of social and family functioning with outcomes 35of interest
i i i

5. A reference instrument for measuring indicators of social and 38family functioning
The ISAFF reference instrument 39
Using the ISAFF Reference Instrument 43
6. Conclusion and recommendations 50
Where to from here? 50
Conclusion 51
Recommendations 51
References 53
Appendices 59
Appendix A: A summary of international and national activity 59relevant to the development of indicators
Appendix B: A summary of international and national activity 61relevant to the development of indicators
Appendix C: Participants at the National Workshop on Indicators 66of Social and Family Functioning
i v

TABLES AND FIGURES
Tables
Table 1 Child health and well-being outcomes: problems of 13developmental health
Table 2 Possible indicators defined in terms of the proposed measurement framework 17
Table 3 Proposed core indicators of social and family functioning 37
Table 4 Key words/sites used in the web search 59
Figures
Figure 1 Ecological contexts shaping child development 11
Figure 2 Relationship between number of risk factors and verbal IQ at 4 years 15
Figure 3 Comparison of Family Income with Children’s Academic 20Competence and Mental Health
Figure 4 Comparison of Caregiver Employment Arrangements Status with 23Children’s Academic Competence and Mental Health
Figure 5 Comparison of Level of Parental Education with Children’s 26Academic Competence and Mental Health
Figure 6 Comparison of Family Conflict with Children’s Academic 30Competence and Mental Health
Figure 7 Comparison of Perceptions of Neighbourhood Violence 32with Children’s Academic Competence and Mental Health
v
I N D I C A T O R S O F S O C I A L A N D F A M I LY F U N C T I O N I N G

ACKNOWLEDGEMENTS
This project was made possible by a grant from the former CommonwealthDepartment of Health and Family Services, now the Commonwealth Departmentof Family and Community Services. Work proceeded in collaboration with theDepartment of Health and Aged Care from November 1998 to June 1999.
We would like to thank the members of our steering committee, in particularChristine Kilmartin, Graham Vimpani, Richard Eckersley, Barbara Wellesley, SuzySaw, Victor Nossar, Stephen Zubrick, Sven Silburn, Margaret Dean and AlisonStanford, for constructive input at all stages of this work.
Our appreciation also goes to Barbara Dunlop and Andrew Webster, from theAustralian Bureau of Statistics, and Lynelle Moon, from the Australian Institute ofHealth and Welfare, for their contribution to the national workshop and continuedsupport of the project. We would also like to thank Lisa Wood and the WesternAustralian Health Promotion Foundation for their comprehensive contribution tothe review on social capital, and Ian Rouse for his valuable contribution infacilitating the workshop.
I N D I C A T O R S O F S O C I A L A N D F A M I LY F U N C T I O N I N G
v i

GLOSSARY
causal pathway framework The specification of relationships betweencauses and outcomes.
causal factor A causal factor is any factor that modifies, asdistinct from being merely associated with, therisk of disease of poor outcome. Modifying acausal factor produces a change in thelikelihood of developing a disease or pooroutcome.
disability adjusted life year Expresses years of life lost to premature(DALY) death and years lived with a disability of
specified severity and duration. One DALY isone lost year of health life.
discretionary control The amount of personal control an individualcan assert in meeting demands in a particularsetting (e.g. at work). Also referred to asdemand latitude.
health A state of complete physical, mental and socialwell-being, and not merely the absence ofdisease and infirmity.
indicators Risk and protective factors that increase ordecrease outcomes. In this document theindicators of interest are those of social andfamily functioning which are of relevance tochild health and well-being outcomes.
outcomes see problems of developmental health
problems of developmental These are health and well-being outcomeshealth that involve higher frequency/lower intensity
problems encompassing health, learning,behaviour and socialisation that interfere withdevelopment, adaptation, and coping in lifesituations. Examples include intrauterinegrowth retardation, conduct disorders, schoolfailure, teenage pregnancy and drug abuse.These were previously referred to as the ‘newmorbidities’.
v i i
I N D I C A T O R S O F S O C I A L A N D F A M I LY F U N C T I O N I N G

protective factors Those characteristics, variables or hazards that,if present for a given individual, make it lesslikely that this individual, rather than someoneselected at random from the generalpopulation, will develop a disorder or adverseoutcome.
proxy measures Measures that are substituted for or thatrepresent other measures. Proxy measures areusually more indirect measures of acharacteristic, property or phenomenon whichis difficult to measure directly. For example,child abuse behaviours are difficult to measuredirectly by asking questions about suchbehaviours and their occurrence. Measuressuch as the occurrence of childhood injury orburns may be sometimes used as proxymeasures of child abuse.
risk factors Those characteristics, variables or hazards that,if present for a given individual, make it morelikely that this individual, rather than someoneselected at random from the generalpopulation, will develop a disorder or adverseoutcome.
I N D I C A T O R S O F S O C I A L A N D F A M I LY F U N C T I O N I N G
v i i i

EXECUTIVE SUMMARY
According to a recent OECD Forum report (January, 1997),
‘pressures on social cohesion are likely to evolve over the next two decades asunemployment, earnings inequality, demographic shifts, technologicalprogress, open trade, and greater competition in less constrained marketplaces, continue to contribute to economic and social turbulence.’
Australia is no less immune to these pressures, with a perceived decline in socialcohesion which has placed stress on family and social functioning. Rapideconomic and social change can manifest as serious problems in thedevelopmental health and well-being of children, young people and their families.These problems include child abuse, early school failure, truancy, depression andsuicide, alcohol and drug abuse, teenage pregnancy, juvenile offending, violence,relationship and family breakdown.
Many families where the adults have experienced unhappy childhoods and poormodelling by their own parents face other difficulties such as lack of support,loneliness, isolation and an inability to participate in mainstream society.Breaking this cycle by investing in social and human capital within families hasbeen shown to be a net financial benefit to a community.
There is strong bipartisan support for investing in social capital and strengtheningcommunities to more effectively tackle some of Australia’s current problems.Families, schools and community leaders are now expressing alarm and concernat the impact of change on families and communities. This concern is beingexpressed in demands for strategies to deal with early school drop out, truancy,depression and suicide, alcohol and drug abuse, juvenile offending, violence,crime, unemployment, homelessness, and child abuse and neglect.
The high prevalence and persistence of these problems are indicative of thegrowing burden shared by education, health, justice, and family and children’sservices. Their impact imposes substantial economic, personal and social costs togovernments, families, and communities who are seeking ways to prevent orreduce them.
Current information systems do not collect adequate prevalence and risk factordata at the population level to inform government decision-making in tacklingthese societal problems. The lack of relevant indicators of social and familyfunctioning as key determinants of these outcomes is a serious impediment to thecapacity of departments to produce the relevant information to guide governmentpolicy and the development of preventive strategies.
i x
I N D I C A T O R S O F S O C I A L A N D F A M I LY F U N C T I O N I N G

Terms of reference
The project focussed on these issues:
• which measures of social and family functioning have been shown to bevalid and reliable in Australian circumstances;
• which of these measures are the most useful in interpreting the impact ofchanges in family and social life on developmental health outcomes foryoung Australians; and
• what is the feasibility of including any of these in routine population-widesurveys such as the Census, the Australian Health Survey or other socialsurveys undertaken by the Australian Bureau of Statistics (ABS).
Project background
Several government initiatives form the background of this project:
• the 1992 Commonwealth report on Health Goals and Targets for AustralianChildren and Youth which specified as one of its five goals the enhancementof family and social functioning;
• the 1995 release of the national policy on The Health of Young Australiansand the 1996 release of the National Health Plan for Young Australians. Thisplan called for a national information strategy for measuring and reportingon the health of young Australians; and
• a 1998 workshop on the National Child Health Information Framework whichrecommended that indicators of social and family functioning be identified forroutine use in national, state and local health and related data collections.
Findings
A 1999 workshop on Indicators of Social and Family Functioning with 40 leadingscientists and policy makers in Australian research and government developed aframework for indicators of social and family functioning. The frameworkproposed in this report was supported by those attending the national workshop.
• Within government and research there is a need to analyse the link betweenserious outcomes in child health and well-being on one hand and indicatorsof social and family functioning on the other, and to do this across differentpopulations within Australia.
• At present the analysis of the link between outcomes in child health/well-being and indicators of social and family functioning is not possible. This isbecause either indicator data are not being collected or are collected in non-standard ways. Data sources cannot be compared or combined.
I N D I C A T O R S O F S O C I A L A N D F A M I LY F U N C T I O N I N G
x

• The rationale for selecting indicators of social and family functioning shouldbe based on the principle of causal pathways. Such a rationale identifiesopportunities to modify risks which have been associated with increases anddecreases in the prevalence of problems of developmental health and well-being. This allows the development of prevention strategies and betterintervention.
• Indicators should be chosen from the five 'resource' domains of family andsocial functioning: income, time, human capital, psychological capital andsocial capital (see Table 3, p.37). While there may be some limitations intheir usage, these indicators and their items represent the best method tosecure better data to describe current Australian family and socialfunctioning.
It is recommended that
1. A set of indicators of social and family functioning be selected on the basis oftheir capacity to measure risk exposures known to be on the causal pathwaysof poor health, educational, social and criminological outcomes. Theseindicators should be included in the regular social and health surveypublications of key government agencies on children, young people and theirfamilies. Population health researchers should also be encouraged toincorporate these indicators into research designs.
2. The set of indicators of social and family functioning developed by the nationalworkshop be accepted. They cover five key resource domains for social andfamily functioning relevant to child health and well-being outcomes:
• time
• income
• human capital
• psychological capital
• social capital.
3. The ‘Indicators of Social and Family Functioning Reference Instrument’ (ISAFF-RI) (see Chapter 5) be used as an indicative measure to assess theacceptability and usefulness of such indicators.
4. A technical advisory group be established, drawn from key agencies—theAustralian Bureau of Statistics (ABS), the Australian Institute of Health andWelfare (AIHW) and the Australian Institute of Family Studies (AIFS)—togetherwith leading scientists and information managers, to trial, review and refine thisand similar instruments capable of describing population and large sampletrends and characteristics for use in government and research settings.
x i
I N D I C A T O R S O F S O C I A L A N D F A M I LY F U N C T I O N I N G

5. Once appropriately developed, these indicators be considered in the currentNational Health and Medical Research Council (NHMRC) review of the nationalsurveillance and screening of children and young people.
These findings and recommendations represent important achievements. Many ofthe key agencies responsible for reporting national, state and regional trends havesought direction for their collection of data on Australian family and socialfunctioning.
This report, supported by an analysis of the current health and social scienceliterature, combined with a process of comprehensive consensus building amongleading Australian health and social scientists and policy makers, makes a uniquecontribution in directing attention and specifying actions to improve theseessential data collections.
Current Australian efforts to address many of the problems that children andyoung people experience can only be evaluated over time through theimplementation of better measures of social and family functioning.
This report directs a more concerted effort in the collection and reporting of bothoutcomes and indicators of social and family functioning. The broad frameworkprovided by the indicators can be applied across a range of government and non-government activity that supports families and children.
I N D I C A T O R S O F S O C I A L A N D F A M I LY F U N C T I O N I N G
x i i

1: INTRODUCTION
The heart of why we are developing indicators of social and familyfunctioning is not only to tell the world what the current and past profile ofchild and family well-being is, but also to predict the nature, extent andduration of possible patterns of future impacts on child well-being, if certaincourses of action aren’t taken or stopped (1).
It is now increasingly recognised that the physical and mental health, coping skillsand competence of human populations arise in large part as a function of theoverall quality of the social environment during their developmental years (2).However, data that describe the developmental health and well-being and the socialcircumstances in which Australian families are living are in short supply (3, 4).
Much is known and regularly published that describes Australia’s economicproductivity and standard of living. In contrast, surprisingly little is known andpublished that describes the well-being of Australian families, or how Australiansview their social and family circumstances.
These observations have been given further impetus from strong bipartisansupport for investing in social capital and strengthening communities as a way ofeffectively tackling some of Australia’s current problems. The decline in socialcapital seemingly affects the capacity of the community to counter the growingburden of these problems.
‘As societies become more complex, supplies of social capital can tend todiminish. People can feel that they are losing sight of what it means to bepart of a community. They may feel that somehow, they are missingsomething; that they cannot trust and rely on others as much as they did inthe past … When communities start to disintegrate, they need something tohelp regenerate community spirit … The Government is committed tofostering an environment in which all can play a part in building up socialcapital … A price cannot be put upon the rich networks, social cohesion andexpanded opportunities that strategic partnerships create’ (5).
Social capital refers to the quality and depth of relationships between people in afamily or community. Social capital is defined ‘as the processes and conditionsamong people and organisations that lead to accomplishing a goal of mutualbenefit. Those processes and conditions are manifested by four interrelatedconstructs: trust, cooperation, civic engagement, and reciprocity’ (6).
The concept of social capital has been given prominence by Putnam (7) whoexamined the association between the strength of communities and their economicwell-being. It was popularised in Australia by Eva Cox in the 1995 ABC BoyerLectures (8). Since then, there has been considerable support for the developmentof social capital building policies by current Federal and State Governments.
1
I N D I C A T O R S O F S O C I A L A N D F A M I LY F U N C T I O N I N G

In the systematic monitoring and reporting of social and family functioning severalquestions may be answered. Just how do families see themselves managing?What do they do with the resources that they have and how are these managedon behalf of children and other family members? What is the impact of economicand social policy on family and social functioning?
Just as the economic circumstances of Australia are regularly reported over time,how might we characterise social and family functioning and report this in waysthat are helpful to families, communities and the many sectors that seek to supportthem? These are some of the important questions that need to be answered inorder to monitor, promote and support the health and well-being of children,families and communities.
Background
This project has its origins in the 1992 Commonwealth report on Health Goals andTargets for Australian Children and Youth (9). This report specified five key goalsand targets that would, if implemented, seek to:
• reduce the frequency of preventable premature mortality;
• reduce the impact of disability;
• reduce the incidence of vaccine-preventable disease;
• reduce the impact of conditions occurring in adulthood, but which havetheir origins or early manifestations in childhood or adolescence; and
• enhance family and social functioning.
(9, p.11)
The singling out of the enhancement of family and social functioning as an areafor particular intervention in the 1992 report was notable. For example, at thattime there was increasing evidence showing the benefits of improving parentingas a strategy to reduce child abuse (9, p.83).
By 1995 the release of the national policy entitled The Health of Young Australians: Anational policy for children and young people represented the first formal commitmentby Commonwealth, State and Territory Governments to work cooperatively topromote, maintain and improve the health status of all Australian children and youngpeople (10). This was a significant policy commitment and was soon followed in1996 by the release of The National Health Plan for Young Australians (11).
In this plan, two key action areas acknowledged the importance of familyfunctioning. The first action area, ‘Health and Supportive Environments’, specifiedinter-sectoral action to improve and maintain the health of young Australians with aspecific focus on family functioning and support. The other action area of ‘Research,Information and Monitoring’ called for the development of a national information
I N D I C A T O R S O F S O C I A L A N D F A M I LY F U N C T I O N I N G
2

strategy for measuring and reporting on the health of young Australians. This wouldmean developing measures suitable for monitoring the social determinants of health.Many of these measures relate to social and family functioning.
In March 1998 the AIHW convened a workshop on the ‘National Child HealthInformation Framework’. (4) This workshop was specifically convened to addressthe research, information and monitoring needs that arose from the NationalHealth Plan for Young Australians. The aims of the workshop were to:
• evaluate the scope for monitoring and reporting on child health;
• identify gaps and deficiencies in available information on child health;
• outline a framework for identifying possible indicators for national childhealth reporting; and
• seek input for a developmental plan for child health information.
Workshop participants recognised that a variety of indicators of family and socialfunctioning had been considered or were in use by different research groupsaround Australia. However, routinely reported national health statistics did notinclude specific measures of family and social functioning as either outcomemeasures or explanatory variables.
Some proxy measures were in current use (such as single parent family) but thesewere seen to be inadequate. It was therefore agreed that funding should besought to try and identify a set of indicators that could be included in routinecollections, as well as used by researchers in child and youth health research.Hopefully, other domains of research and policy that involved children, such aswelfare and justice, would also see these as desirable and move to use them.
In mid-1998 the former Commonwealth Department of Health and FamilyServices, now the Commonwealth Department of Family and Community Services,awarded a grant to the TVW Telethon Institute for Child Health Research to furtherthe collaborative development of indicators of social and family functioning.
Terms of Reference
The terms of reference and broad objectives of this project were to determine:
• which measures of social and family functioning had been shown to be validand reliable in Australian circumstances;
• which of these measures were the most useful in interpreting the impact ofchanges in family and social life on health outcomes for young Australians; and
• what was the feasibility of including any of these in routine population-widesurveys such as the Census, the Australian Health Survey or other socialsurveys undertaken by the ABS.
3
I N D I C A T O R S O F S O C I A L A N D F A M I LY F U N C T I O N I N G

Scope
This report addresses the above objectives. It contains a rationale and frameworkto meet the emergent demand within Australia for measurement indicators ofsocial and family functioning. This report details core indicators for measuringtrends in, and the social circumstances of, children, families, and communities.These indicators have been assembled through a review of national andinternational scientific and policy initiatives in social indicators. Additionally anational workshop of leading scientists, government agencies and policy makerswas held to develop a consensus on these indicators.
It should be noted here that the formulation of a proposed framework to measuresocial and family functioning is centred on outcomes for child health and well-being. However, the measures proposed and described in this document shouldalso properly inform a wider appreciation of Australian well-being. As such, theproposed indicators describe important aspects of Australia’s social capital, and inso doing extend and balance the measures of economic capital that are routinelyused to chart national progress and capacity.
I N D I C A T O R S O F S O C I A L A N D F A M I LY F U N C T I O N I N G
4

2: METHODS
We should look for indicators in a comprehensive search of the knowledgebase (12).
The methodology was guided by the key objectives for this project. The broadobjective was to identify which indicators of social and family functioning weremost useful in interpreting the impact on health of changes in family and social life.
Specific outputs of the process included:
• an audit of key international and Australian activity in the area of indicatordevelopment (see appendix B*);
• dissemination of key articles/reports on indicator development toparticipants in a national workshop (see appendix B);
• a two-day national workshop on indicators of social and family functioning;
• distribution of a workshop report to workshop participants; and
• presentation of a final report to the Commonwealth Department of Familyand Community Services.
In achieving these, the project methods were staged as follows:
• an initial exercise to determine and define the parameters of the project forthe time available;
• a literature search and search of the World Wide Web on indicator use anddevelopment; and
• a national workshop for key stakeholders to process the findings of the literaturesearch and to reach consensus on indicators of social and family functioning.
Defining the projectThe initial phase of the project included:
• contacting key researchers and centres in Australia and New Zealand forinformation on current research activities, suggested indicators of social andfamily functioning, and useful reference sources;
• reviewing key background documents (3-4, 9-12);
• reviewing the nature and extent of child and adolescent morbidity andmortality (13-17);
• reviewing the risk and intervention research to identify the risk andprotective factors on causal pathways to health and well-being (18-31); and
• reviewing comparative national family policies (32-35).
Searching the literature
The major purpose of the literature search was to identify possible indicators of
5
I N D I C A T O R S O F S O C I A L A N D F A M I LY F U N C T I O N I N G

social and family functioning and to develop a measurement framework thatwould assist the development of public policy and practice.
The search strategy relied significantly on both a literature search and search ofthe World Wide Web. The search was limited to research since 1990. There wasa particular emphasis on seeking current work and work in progress. Theprincipal search engines for the web were the Northern Light Search Engine,Dogpile, and Beaucoup, although others were used. A summary of findings ofkey international and national initiatives and activities is presented in appendix B.The key search words/sites used to locate information may be found in Table 4in appendix A.
In addition to the web search and literature search, several key Australian andNew Zealand researchers identified by the project steering committee werecontacted personally and by letter. They were asked to provide input andfeedback in regard to developing indicators of social and family functioning.Their responses identified areas of local, national and international activity, as wellas issues of concern, which subsequently informed project development andworkshop proceedings.
Conducting a national workshop
The second stage required the engagement and enrolment of key Australianleaders and academics in the process of indicator development. This wasachieved through the active participation of stakeholders in a two-day nationalworkshop sponsored by the Commonwealth Department of Family andCommunity Services. Three weeks before the workshop, selected key readingsand articles from the review of the research were distributed to participants,together with a discussion paper outlining the emerging need for indicators ofsocial and family functioning.
The workshop process allowed for evidence-based discussion, debate and decision-making, and maximised the opportunity for consensus on indicators of social andfamily functioning. It developed the rationale for the selection, development anduse of indicators of social and family functioning at the national, state and regionallevels, and reached consensus on core indicators that measure basic aspects of time,income, human capital, psychological capital and social capital.
This consensus view was achieved across major government agencies, namely theAIHW, the AIFS and the ABS, as well as key stakeholders, researchers, policymakers and practitioners.
Appendix C lists the participants of the workshop, which was held on 12–13 April1999. The workshop report was distributed to all workshop participants andinformed the preparation this report.1
I N D I C A T O R S O F S O C I A L A N D F A M I LY F U N C T I O N I N G
6
1 Copies of the workshop report are available from the Commonwealth Department of Family and Community Services.

3: THE RELATIONSHIP BETWEEN SOCIAL AND FAMILYFUNCTIONING AND CHILD HEALTH AND WELL-BEING
Now, more than ever, families are faced with an increased range of choicesabout how they organise and manage their work and family responsibilities.These decisions are made in a social context that includes: the compositionof the family; the resources available in terms of employment, income andtime; their knowledge and skills in parenting; the supports available fromfamily, friends and neighbours; and the extent to which these are backed upby broader community support and services and environmental factors suchas 'family friendly' industrial relations policies, and access and entitlementto child care and other benefits (17).
The interaction between children’s health on one hand and their family and socialenvironments on the other is a focus of this chapter. Understanding aspects ofthis interaction is important in deciding first, which child health outcomes shouldbe measured and, second, which family and social factors are important inpreventing, reducing or increasing the health outcome of interest.
There is a prodigious national and international effort underway to specifyindicators of social and family functioning (36-44)2. Researchers and policymakers have identified significant challenges in specifying a framework formeasuring social and family functioning. These challenges include:
• selecting from the quantity of what might be measured;
• identifying the value base underpinning such measurements;
• determining the feasibility of collecting such information;
• assessing the reliability and validity of the measures;
• establishing the stability of measures over time; and
• describing the theoretical basis for linking indicators to outcomes of interest.
Within Australia, the ABS has had a major role in the provision of social statisticsas well as in the development of social indicators over the past 20 years. Centralto the idea of monitoring social well-being is the importance of developingappropriate social indicators. Social indicators are the statistical constructs whichare presumed to measure social well-being. They measure aspects of people’slives which we care about directly. The ABS defines social indicators as
‘measures of social well-being which provide a contemporary view of socialconditions and monitor trends in a range of areas of social concern over time’ (45).
7
I N D I C A T O R S O F S O C I A L A N D F A M I LY F U N C T I O N I N G
2 Readers should also note Appendix B which contains major Internet sites for the development of indicators of social and family functionand social capital.

The objectives of the ABS social reporting program are to:
• provide a broad description of Australian society;
• monitor changes in social conditions over time;
• provide policy makers and planners (both government and private) with abasis for decision making;
• provide information to enable progress towards social goals to be monitored;
• promote understanding and informed discussion in the community aboutthe directions in which society is going and about the policies pursued bygovernments; and
• add value to and increase the use of social, demographic and labour dataheld by the ABS.
In 1995 the ABS created the Family Statistics Unit (FSU) as part of the itsCommunity Statistics Section. The FSU provides a focus for family statistics bothwithin and outside the ABS. It specifically works to increase the quality, rangeand relevance of ABS family data. It does so by engaging in regular consultationwith data users about their statistical requirements; collecting survey data onfamilies; working towards the integration of family statistics across the ABScollections; and undertaking analytical research and report writing activities aimedat disseminating family-related data. The FSU will play a primary role infurthering the development of ABS social indicators, particularly as they relate tofamily functioning and the well-being of children (45).
In addition to the ABS, the AIHW also has a major role in the development andmonitoring of health outcomes and of indicators of social and family functioning(13). As noted in Chapter 1, the AIHW is responsible for the current NationalChild Health Information Framework and participated in the workshop for thedevelopment of this report.
In 1998 the AIHW published the first national statistical report on the health ofAustralian children. This report presented information on both the health statusof Australian children and on the determinants of health (13). Significantly, itnoted that information on the interaction between children’s health and familyand social environmental factors needed to be developed further to allowcomprehensive reporting at the national level (13, p.3).
Characteristics of health and well-being outcomes
Governments in developed countries around the world have been confrontedwith increasing rates of complex psychosocial problems. Keating and Hertzman(2) have identified them as problems of ‘developmental health’. These problemsarise as a result of the interaction between changes in the social environment andhuman biology, a process which frequently leads to the phenomenon of‘biological embedding.’
I N D I C A T O R S O F S O C I A L A N D F A M I LY F U N C T I O N I N G
8

Outcomes of biological embedding are seen in the systematic differences inpsychosocial/material circumstances from conception onward. These differencesare so embedded in human biology that they can account for the gradients indevelopmental health across socioeconomic status.
These outcomes are associated with significant personal, social and economiccosts. Across the developmental lifespan, problems include maternal depression(especially postnatal), foetal growth retardation associated with poor nutrition andsubstance abuse, developmental and learning problems, bullying, aggression andantisocial behaviour, teenage pregnancy, child abuse and neglect, alcohol anddrug abuse, eating disorders, suicide, and depression. Many of these problemsare not new, however. What is new is their increasing prevalence and burden,visibility, complexity and persistence, particularly in association withsocioeconomic inequality.
Prevalence and burden. Using measures of disability adjusted life years (seeglossary), Murray and Lopez (46) have shown that mental health disorders emergeas a highly significant component of global disease burden when disability, aswell as death, is taken into account. Their projections show that mental healthconditions could increase their share of the total global burden by almost half,from 10.5% to almost 15% in 2020. This is a bigger proportional increase than forcardiovascular diseases (46).
In Australia there is evidence of high rates of poor parental mental health (17.7%),particularly maternal depression (47). The rates of mental health problems inchildren and adolescents are nearing the adult rates at earlier developmentalperiods (i.e. there is an earlier onset).
The increase in the prevalence and earlier onset of these disorders is almostcertainly driven by changes over time in rates of biological risk exposure (e.g.nicotine, substance abuse) as well as large societal changes in basic economic,political and social environments (48).
Visibility. Not only are these problems extensive, but they are also very visibleand of increasing concern to sectors other than health—criminology, education,public health, child, adolescent and adult mental health, and family and children’sservices. Key concerns shared across sectors are child abuse, early school leaving,truancy, depression, alcohol and drug abuse, juvenile offending, unemployment,teenage pregnancy, violence, crime and youth suicide.
Complexity and persistence. Most of the psychosocial problems are complexproblems which involve a complex interplay of a number of causal risk factors.Importantly, large populations of individuals are being exposed to multiple risks.These multiple risks have both latent and cumulative effects on outcome (2, *49).
9
I N D I C A T O R S O F S O C I A L A N D F A M I LY F U N C T I O N I N G

Latent effects may result from adverse exposures early in life. They are associatedwith poorer outcomes regardless of intervening circumstances (e.g. lowbirthweight and the subsequent risk of heart disease). Consequently these typesof problems are particularly resistant to change and pose significant challenges forresearchers and planners in designing programs of intervention and prevention.The reduction of these problems will entail extended time frames due to their verycomplexity, and because many of them emerge over long periods.
Socio-economic gradients and inequality. There is now a widening disparitybetween economic prosperity and the well-being of families and communities(50). Social inequality and disadvantage contribute significantly to differences inpeople’s health, influencing factors such as stress levels, smoking, diet andexercise. These affect people’s sense of self worth, sense of control andoptimism, and social attachment.
The extent to which this disparity is matched by unequal distribution in measuresof national social capital and well-being is unknown because national measures ofeconomic capital growth and productivity do not extend to cover these dimensions.
Child health and social/family functioning: Ecological links
In considering the causes of child health problems, it is important to appreciatethe contexts in which children live their lives—the family, the school, and thecommunity—and the interaction between them. These settings are inter-relatedand interdependent. They are set within a wider social, economic, cultural andpolitical context. Changes in one context have the capacity to influence changesin others.
Of particular interest are the influences these contexts have on health and otheroutcomes (24). Also of interest is the manner in which these contexts define,enhance and/or limit opportunities for healthy development. Because of thecomplexity of the relationships between children, families and communities thissystem has been described as an ‘ecological’ system (see Figure 1).
I N D I C A T O R S O F S O C I A L A N D F A M I LY F U N C T I O N I N G
1 0

There is increasing acceptance for the idea that an ecological perspective providesthe best framework for understanding the processes by which many of Australia’smost burdensome conditions develop and persist into the next generation (1, 24).This ecological context influences and defines the mechanisms that link individualand family life to particular health outcomes. At present, current health anddemographic information systems do not contain reliable and valid measuresdescribing these contexts and the changes affecting them.
A measurement framework is needed to enable a better estimation of the quantumand mix of resources characteristically available to families and communities.Regular measurement of these resources over time will then permit a betterassessment of their causal relationship to subsequent outcomes of interest. Theseoutcomes may be in areas such as health, education, community services andjustice. For example, changes in the economic environment in whichcommunities are set will simultaneously exert changes on the matrix of work,attachment, care and support in which families and individuals operate. In turn,these changes are likely to be causally related to the well-being of individuals infamilies in communities. So, in selecting measures of social and familyfunctioning, a causal pathways framework is proposed for guiding decisionsabout the relative utility of any given indicator. This causal framework will reflectthe ecological contexts in which children live and will include the wider social,economic, cultural and political contexts.
Distinguishing indicators of social and family functioning from healthand well-being outcomes
Two forces principally drive the emerging demand for indicators of social andfamily functioning. The first is the increasing diversity, prevalence and burden of
1 1
I N D I C A T O R S O F S O C I A L A N D F A M I LY F U N C T I O N I N G
The larger social stuctural,
Family School
Children
Neighbourhood
and Cultural Environment
Economic Political
Figure 1: Ecological contexts shaping child development

problems of developmental health (48, 51). These problems (see Table 1) are theoutcomes. These outcomes are of interest to several government and non-government sectors. Among these sectors are health, education, welfare and justice.
The second is the absence of measures of social and family functioning that areknown to be on the causal pathways of these serious outcomes. These measuresare the indicators of interest in this report.
Table 1 lists the major disorders that comprise those serious child health problems,or ‘problems of developmental health’, that are the outcomes of interest. Theyare organised around the broad areas of physical health outcomes, mental healthoutcomes, risk behaviours, academic outcomes, and social outcomes. Theseproblems reflect the acknowledged burden now facing health, education, welfare,justice and other agencies, and for which the prevalence in Australia has beenwell documented in recent years (13-17). It is these outcomes for which aframework of social and family indicators is needed.
The connection between cause and outcome is implicit in any discussion ofindicators. Unfortunately, the specification of indicators frequently occurs in theabsence of any clearly articulated causal framework. When this happens theindicator becomes an end in itself rather than a means to an end (32).Distinguishing indicators of social and family functioning from health and well-being outcomes is a critical task as it underpins the development of a usefulmeasurement framework.
It is now recognised that most of the diseases that represent a significant burdento human populations are caused by multiple factors. Many diseases are causedby the joint action and interaction of genes and environment. Psychosocialproblems are prominent ‘diseases’ that comprise what Keating and Hertzman (2)have called the problems of developmental health. Consequently, it is seldompossible to identify a single principal cause similar to an infectious agent.Therefore a causal factor is properly viewed as being any factor that modifies (asdistinct from being merely associated with) the risk of disease (52). It is thisconcept of risk modification or prevention that requires distinguishing indicatorsfrom outcomes.
I N D I C A T O R S O F S O C I A L A N D F A M I LY F U N C T I O N I N G
1 2

Table 1
Child health and well-being outcomes: problems of developmental health
Physical health outcomeslow birth weight/premature birthmaternal depression (esp. postnatal)Sudden Infant Death Syndromeunintentional injuryfailure to thrive
Developmental and learning outcomespoor attachment/bonding/connectednesspoor cognitive developmentspeech and language
Mental health outcomesattention problems- irritability- inattention- impulsivityaggressiondelinquencysocial problemsemotional problems- anxiety- depression- suicidal ideation/completion
Risk behaviourssubstance use- alcohol- smoking- illicit drugseating disordersearly sexual activityteenage parenting
Academic outcomestruancyearly school leavingpoor academic achievementlow participation in school activitiesattachment to a deviant peer groupalienation
Social outcomesfamily breakdownchild abuse and neglect children in institutionschildren in caredetached youthcriminal behaviour
1 3
I N D I C A T O R S O F S O C I A L A N D F A M I LY F U N C T I O N I N G

4: RESOURCE DOMAINS WHICH INFLUENCE SOCIAL AND FAMILY FUNCTIONING
Indicators of social and family functioning are statistical measures ofobservable features in our economic, social and cultural environment thatare known to be on the causal pathways that lead to outcomes of interest. Anoutcome is the statistical measure of a desired result. This result may bereflected in an increase in resiliency or capacity on one hand, or, as a seriouspsychosocial problem on the other.
The 1999 National Workshop on Indicators of Social and Family Functioningbrought together leading scientists, policy makers and practitioners to review anddevelop a consensus position regarding, principally, a theoretical framework forthe measurement of these indicators (75). In addition, and contingent upon anagreed theoretical framework for such measurements, workshop participants wereasked to consider proposing items and/or scales for use in measuring anddescribing social and family functioning. This chapter presents the theoreticalbasis for the adoption of a framework for the measurement of social and familyfunctioning. Chapter 5 then presents a Reference Instrument for use in themeasuring and monitoring of social and family function.
National Workshop participants adopted a broad theoretical framework for themeasurement of indicators of social and family functioning as developed byBrooks-Gunn (24) and the earlier work of Haverman and Wolfe (25, 26) andColeman (53). This framework takes as its point of reference those family andsocial ‘resources’ to which children, in theory, have access and which are relevantto developmental health outcomes. There are five major categories of resourcesthat might be mobilised on behalf of children:
• Income
• Time
• Human capital
• Psychological capital
• Social capital.
Resource domains need not all be of a similar level and it is important toappreciate that for any individual child these resource areas may be relativelywell-endowed or relatively impoverished. Indeed, the value of this theoreticalframework resides in the necessity to look across the resource domains, ratherthen focussing on a single measure. For example, children may live in familieswhich are rich in income but poor in the amount or quality of time they haveavailable for their children (i.e. families described as being ‘cash rich and timepoor’). Such a scenario may arise for two-income families where both parents are
I N D I C A T O R S O F S O C I A L A N D F A M I LY F U N C T I O N I N G
1 4

working full-time, where work demands and personal stress are high, and wherethere are reduced opportunities for interacting with children. Similarly, Australia’sIndigenous community presents an example of accumulated risk exposure, whereresources of income, human capital and psychological capital are poor, and wheresocial capital has been eroded, cumulatively impacting on the health and well-being and academic outcomes for Indigenous people.
It is important to keep in mind that individuals, families and communities mayaccumulate resources, or they may experience considerable impoverishment andaccumulate risk in one, a few, or all domains. Such patterns of multiple riskexposure, in turn, have a cumulative effect on outcome. Figure 2 for exampleshows the relation between number of risk factors and verbal IQ at 4 years.
Figure 2: Relation between number of risk factors and verbal IQ at 4 years
The interaction of these resource domains is also important. Families andcommunities often attempt to make decisions and trade-offs among resource areasin attempts to be better off. For example, a dual income family may resort to oneparent working part-time in order to provide more time to care for and supportthe children. Similarly, erosion in one resource area may ultimately lead tocompensations that result in impoverishment in another with a negative effect onoutcomes. For example, loss of income may result in increased stress, increasedmarital conflict and a change in parental discipline style, all of which mayaccelerate the child’s development of conduct disorders. These resourcescumulatively interact and contribute to whether the child feels a sense ofbelonging, a sense of being valued, and a sense of being supported throughdevelopmental life stages.
1 5
I N D I C A T O R S O F S O C I A L A N D F A M I LY F U N C T I O N I N G
Sameroff & Chandler, 1975 (54)
Number of risks
8.007.006.005.004.003.002.001.00.00
IQ
120
115
110
105
100
95
90
85
80

Participants at the National Workshop were asked to consider the range ofpossible indicators within each of the domains of this framework. Table 2 showsthe full range of measurements initially considered by the workshop participants.Some discussion of each of these domains is warranted here.
Income
Income has traditionally been a key indicator used to describe families and inferhow they are managing. Whether one sees income as the primary measure of theeconomic base of the family or as defining a standard below which issues of basicsubsistence and survival dominate, income remains a critical family resource thatmay be used on behalf of children.
Governments judge their policies with great care where they are seen to affectincreases or decreases in family income. Importantly, income may purchaseresources from the other resource areas. For example, a family that chooses tohire home help may do so in order to purchase time to spend with familymembers or to purchase childcare in order to maintain employment.
Of course, the underlying reason for collecting information on income may be toassess the accumulation of income (i.e. wealth), or the instrumental uses of it.Income details may be offset against debt information. Nevertheless, in order toassess these domains, basic information on income must be requested. Too oftenbasic data collections in health, welfare and education avoid obtaining this criticalinformation.
There are many purported proxies of income. They include educational level andoccupation. However, these proxies confound several other resource areas, andin the main, if income is the desired indicator, then the data gathered should bedrawn directly from questions and information about income (see Example 4.1).
I N D I C A T O R S O F S O C I A L A N D F A M I LY F U N C T I O N I N G
1 6

17
IND
ICA
TOR
S O
F S
OC
IAL A
ND
FAM
ILY F
UN
CT
ION
ING
Table 2: Possible indicators defined in terms of the proposed measurement framework
Sources: Eurosocial Report 62/1997; Eurosocial Report 56/1995; Federal Interagency Program on Child and Family Statistics (USA); Indicators of Children’s Well-being (USA); National Longitudinal Survey of Youth (USA); Survey of Income and Program Participation (USA); Integrating Federal Statistics on Children (USA);National Longitudinal Survey of Children and Youth (Canada); Dunedin Study (NZ); Healthway—Social Capital Constructs (WA); Survey of Community Groups &Organizations in the Western Suburbs of Adelaide; Measuring Social Capital in Five Communities in NSW (NSW); ACER Social Development Objectives ofEducation (Australia); Report of the Scientific Committee on Families and Mental Health (University of Queensland).
1. TIME
PARENTAL EMPLOYMENT• Maternal - in labour force/full-time/part
time/casual• Paternal - in labour force/full-time/part
time/casual• Hours of paid work• Hours of unpaid labour
Parent/child activities & interactions• Amount of time spent by parents with child
Activities between parent and childMeals togetherOutingsSchool related activitiesReading to childHelping with homeworkTotal time together
• Frequency of time with dad• Frequency of meals with two parents• Amount of time spent with child on a typical
weekday 7am-9pm• Amount of time spent with child on a typical
weekend day• Time spent with child on leisure activities• Time child spends watching television, playing
video games, internet etc• Time spent with spouse• Time spent in housework per day
2. INCOME
MATERIAL RESOURCES• Family income – total/by source/most detailed• Summary measures of family income• Sources of family income• Income data on a monthly/yearly/every few
years basis• Family assets• Disposable family income• Financial strain (ratio of debts to assets)• Poverty - current/sustained/lifetime• Welfare receipt - current/sustained/ lifetime• Health insurance coverage • Fringe benefits received• Tenure: rent or own home
3. HUMAN CAPITAL
PARENTAL/CARER EDUCATION• Highest grade/qualification completed
Parental/carer physical healthParenting• Disciplinary techniques• Rules of behaviour• House rules for child regarding homework, TV
watching, bedtime, dating• Monitoring behaviour• Parent/child communication• Communication frequency, styles and/or
content of communication between parent andchild
• Positive interaction• Warmth• Acceptance/punitiveness• Hostility• Aversive parenting• Consistent parenting• Modeling
Culturally acquired knowledge, beliefs,attitudes, values and traditions• Participation in religious activities• Participation in traditional/cultural practices• Knowledge of the world gained through
personal life experience

IND
ICA
TOR
S O
F S
OC
IAL A
ND
FAM
ILY F
UN
CT
ION
ING
18 Table 2
4. PSYCHOLOGICAL CAPITAL
• Parent/child conflict• Conflict between parents• Family cohesion• Reports of physical violence within the family• Family dysfunction • Parental mental health• Parental depression measures• Satisfaction with parenting • Job satisfaction• Stressful life events• Perceived stress• Perceived level of social support• Parental self efficacy• Number of job changes• Living in crowded conditions• Four or more children at home • Occupational complexity• Residential mobility history• Strain/gains of work to parenting• Strain/gains of work to marriage
5. SOCIAL CAPITAL
• Trust - see WHO/EURO Working group,potential indicators Table 1
• Civic involvement - see WHO/EURO Workinggroup potential indicators Table 2
• Social engagement - see WHO/EURO Workinggroup potential indicators Table 3
• Reciprocity - see WHO/EURO Working grouppotential indicators Table 4
• Participation in local community• Proactivity in a social context• Feelings of trust and safety• Neighbourhood connections• Neighbourhood violence and crime• Family and friends connections• Tolerance of diversity• Social or cultural discrimination• Value of life• Work connections• Measures of school and classroom characteristics
(curriculum, student body demographics)• Sense of neighbourhood• Neighbourliness• Sense of community• Social participation
Participation in sportsMembership in clubsMember of a club or group
• Civic participationCivic involvementParticipation local community activitiesParticipation in school activities
• Social Trust• Availability of support services• Philanthropy
6. OTHER CONFOUNDING FACTORS
Family Type Within Household• Biological vs step parent• Divorced vs never married single parent• Cohabiting parent - parental status of other
parent also identified• Foster parent• Adoption• Other adult family members in household • Family size• Teenage parent familyOutside household• Non resident parents• Relations with relatives outside household• Children in institutionsParental marital histories• Availability and involvement of
non-resident parent
Child Care• Longitudinal history of child care arrangements• Type of care arrangement• Ratio of child to adult caregivers• Caregivers training• Caregivers educational background• Number of child care changes over a year• Number of child care arrangements in a week• Hours in child care per week• Type and characteristics of provider• Costs of child care
Early Childhood Experiences• Ever in child care arrangement• Age at first child care arrangement• Hours in first child care arrangement

Example 4.1 – A question about individual income
In which of these groups was your gross income before tax in the financial year 1998/99?
* Include family allowance and other benefits, child support, superannuation, wages and salaries,overtime, dividends, business income, interest.
* Do not deduct tax, superannuation payments, health insurance payments.)
a. <$58 (<$3001 per year) 1
b. $58–$96 ($3001 – $5000 per year) 2
c. $97–$154 ($5001 – $8000 per year) 3
d. $155–$230 ($8001 – $12000 per year) 4
e. $231–$308 ($12001 – $16000 per year) 5
f. $309–$385 ($16001 – $20000 per year) 6
g. $386–$481 ($20001 – $25000 per year) 7
h. $482–$577 ($25001 – $30000 per year) 8
I. $578–$673 ($30001 – $35000 per year) 9
j. $674–$769 ($35001 – $40000 per year) 10
k. $770–$961 ($40001 – $50000 per year) 11
l. $962–$1154 ($50001 – $60000 per year) 12
m. $1155–$1346 ($60001 – $70000 per year) 13
n. >$1346 (>$70000 per year) 14
o. Don’t know 15
p. Refusal 16
after (17)
Several models describe how parental income might affect children’s life chances(43). The ‘resource investment’ model suggests that higher family income leadsto greater child well-being through increased parental purchasing power to investin food, housing, medical care, and education. An alternative model examinesthe indirect effects of economic deprivation on child well-being via increases infamily stress, which diminish the caregiver’s ability to provide stability, adequateattention, supervision, and cognitive stimulation to their children. A third modelfocuses on the effects of caregiver norms and values on children. This theorysuggests that children’s success in the world is affected by caregiver norms andvalues, which are dependent on a caregiver’s type of employment, communityand position in the social hierarchy. Each of these models assumes that greatereconomic resources will improve the well-being of children either directly orindirectly (43).
1 9
I N D I C A T O R S O F S O C I A L A N D F A M I LY F U N C T I O N I N G

There are extensive associations between income and many of the child healthoutcomes in Table 1. A recent Canadian report charted no less than 27associations between direct measures of income and outcomes that range fromlow functioning families on one hand to older teens who are neither employednor in school (56). Figure 3, taken from the Western Australian Child HealthSurvey (15), demonstrates the impact of income on child mental health problemsand academic competency.
Figure 3: Comparison of Family Income with Children’s Academic Competence and Mental Health
after (15)
Income information is frequently cited as perilous to collect. However, as Duncanand Petersen (57) demonstrate, there are many ways of collecting these data thatare acceptable to respondents and that secure good quality information withoutjeopardising the data quality, interview or interviewer (see Example 4.2). InAustralia, income data comprise some of the basic measures collected by the ABS.
I N D I C A T O R S O F S O C I A L A N D F A M I LY F U N C T I O N I N G
2 0
0
5
10
15
Perc
enta
ge o
f chi
ldre
n w
ith p
robl
ems
20
25
30
<$20,000 $20,000-$30,000
$30,000-$40,000
$40,000-$60,000
$60,000+
Family Income
Low Academic Competence Mental Health Problem

Example 4.2 – A question about family income
What was the total combined income of all members of this family in 1999? Please includemoney from jobs, net income from business, farm or rent, pensions, dividends, interest,social security payments and any other money income received by you or any other familymember.
$___________ In 1999.
IF DON’T KNOW OR REFUSED:
Would it amount to $30,000 or more?
IF YES: Would it amount to $50,000 or more?
IF YES: Would it amount to $75,000 or more?
IF NO: Would it amount to $40,000 or more?
IF NO: Would it amount to $15,000 or more?
IF YES: Would it amount to $20,000 or more?
IF NO: Would it amount to $10,000 or more?
(57)
Time
Time is a commodity and is identified as such by most families. Indeed, whiletime is frequently characterised along dimensions of both quality and quantity, itis also regularly understood by placing a value on it in economic and social terms.Along with income, time represents one of the most commonly used and reportedindices of family and social function.
Time as a family resource for children generally refers to the time that caregivershave available for themselves and other family members. Time utilisation measuresmay need to include both the amount of time and the quality of the time available.Time is needed for the mobilisation of other family resources and to provide anopportunity to use resources on behalf of self and other family members.
Examples of measures of quantity (as opposed to quality) of time might includeparental hours in paid employment (see Example 4.3), hours of formal child care,or hours engaged in parent-child activities (e.g. supporting homework, readingwith or to the child, involvement in family outings or in sporting, leisure orrecreational activities).
2 1
I N D I C A T O R S O F S O C I A L A N D F A M I LY F U N C T I O N I N G

Example 4.3 – A question about time
In your main job, how many hours per week do you usually work, including paid overtime?
(Interviewer: round upwards to nearest hour) _______________ hours
How many hours a week are you available to spend time doing things with your partnerand/or family (count waking hours only)?
(Interviewer: round upwards to nearest hour) _______________ hours
after (17)
Employment may affect the time available to the mother and father for familyactivities and may limit leisure time. A mother’s time in the labour force is oftentaken as a problematic indicator of time not available for parenting. The totalnumber of parental hours available to children is dependent on how many parentsare in a family and how much they work outside the home. As more children arebeing raised in households with only one parent or in households where bothparents are employed full time, these households have fewer hours available forboth child care and employment. Collection of data on these effects for bothdual-parent or single-parent households is much needed (58).
Measures of time and time use are many and varied. The Australian Bureau ofStatistics has traditionally collected information on time use by householdmembers. Similarly, the Australian Institute of Family Studies has assessed thesignificance of time to families and detailed the manner in which families attemptto balance the complex demands of work and family (59).
These studies show that work is a major barrier to the amount and quality of timeavailable for family use. Practically speaking, there is only so much time in aweek and so many hands that can supply the care a family needs. Employmenterodes the energy available for the care of all family members and disruptscontinuity in family caring. In the past, the traditional roles for couple familieswere of a father who worked and a mother who stayed home. In effect thisarrangement tied the father's time and energy to securing family income and themother's time and energy to the care of the family. While this arrangement is achoice that many families still make today, data sources show this choice beingmade less and less (17).
The effect of such choices for children is illustrated in Figure 4. This chart usesdata from the 1996 WA Child Health Survey to show the percentage of WesternAustralian children living in various family circumstances (i.e. one or two parenthouseholds) and parental working arrangements (i.e. one or both parents in full-
I N D I C A T O R S O F S O C I A L A N D F A M I LY F U N C T I O N I N G
2 2
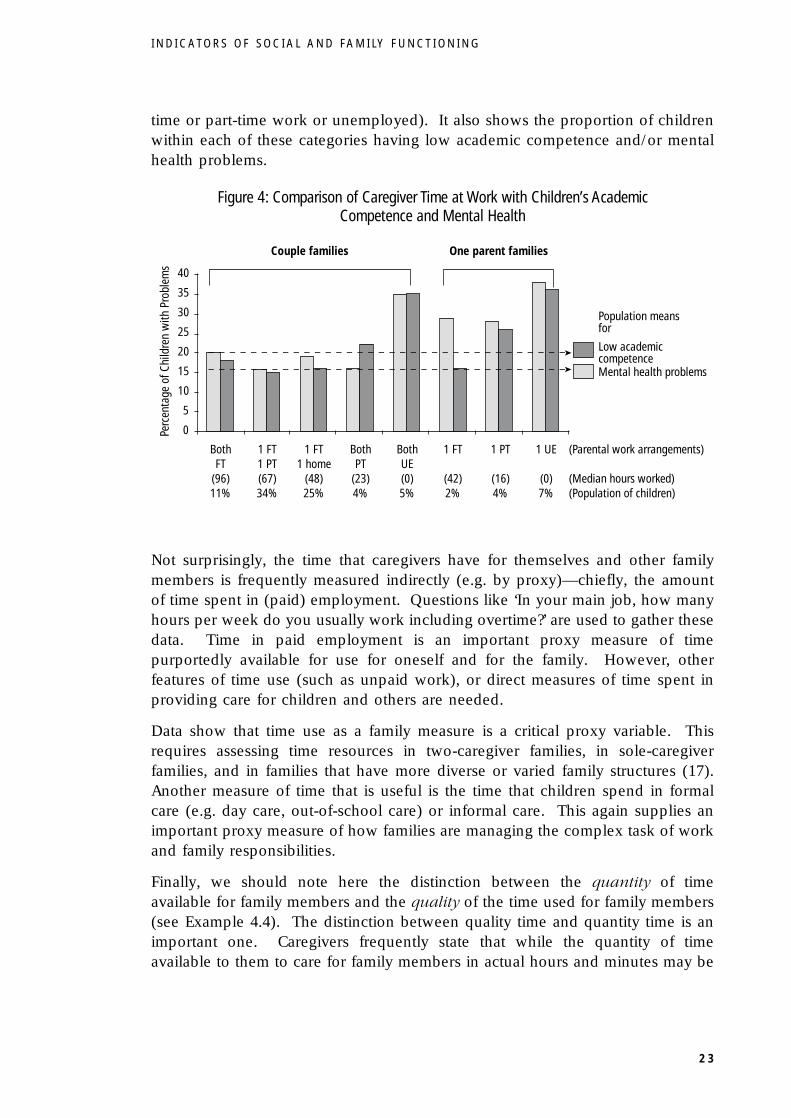
time or part-time work or unemployed). It also shows the proportion of childrenwithin each of these categories having low academic competence and/or mentalhealth problems.
Figure 4: Comparison of Caregiver Time at Work with Children’s Academic Competence and Mental Health
Not surprisingly, the time that caregivers have for themselves and other familymembers is frequently measured indirectly (e.g. by proxy)—chiefly, the amountof time spent in (paid) employment. Questions like ‘In your main job, how manyhours per week do you usually work including overtime?’ are used to gather thesedata. Time in paid employment is an important proxy measure of timepurportedly available for use for oneself and for the family. However, otherfeatures of time use (such as unpaid work), or direct measures of time spent inproviding care for children and others are needed.
Data show that time use as a family measure is a critical proxy variable. Thisrequires assessing time resources in two-caregiver families, in sole-caregiverfamilies, and in families that have more diverse or varied family structures (17).Another measure of time that is useful is the time that children spend in formalcare (e.g. day care, out-of-school care) or informal care. This again supplies animportant proxy measure of how families are managing the complex task of workand family responsibilities.
Finally, we should note here the distinction between the quantity of timeavailable for family members and the quality of the time used for family members(see Example 4.4). The distinction between quality time and quantity time is animportant one. Caregivers frequently state that while the quantity of timeavailable to them to care for family members in actual hours and minutes may be
2 3
I N D I C A T O R S O F S O C I A L A N D F A M I LY F U N C T I O N I N G
Couple families One parent families
BothFT
(96)11%
1 FT1 PT(67)34%
1 FT1 home
(48)25%
1 FT
(42)2%
1 PT
(16)4%
1 UE
(0)7%
(Parental work arrangements)
(Median hours worked)(Population of children)
BothPT
(23)4%
BothUE(0)5%
Low academiccompetenceMental health problems
Population meansfor
Perc
enta
ge o
f Chi
ldre
n w
ith P
robl
ems
0
5
10
15
20
25
30
35
40

small, their use of this time (i.e. its quality) may be directed to achieve quiteparticular outcomes for individual family members.
While, on the face of it, these assertions appear reasonable, data to better describewhat constitutes the quality dimension of time are rare. Quality as opposed toquantity of time available to children may be better distinguished as a function ofthe human capital and psychological capital available to the child within the timeavailable for any parent/child interaction.
Example 4.4 – Some questions measuring quality time
The following questions may be administered to young people.
Not like him/her Somewhat like Very much like
him/her him/her
This parent shares many activities with me 1 2 3
This parent likes to talk and be with me 1 2 3
This parent spends time with me 1 2 3
This parent talks with me very much 1 2 3
This parent enjoys doing things with me 1 2 3
(60)
Quality time, that is, the quality of an interaction, may be directly related to theopportunities that exist for contribution, for learning new skills and competencies,and receiving recognition or feedback. There also may be a point where thequantity of time available to give care to oneself and others becomes so restrictedthat both the subjective and practical effects of this erode the quality component.
Whatever the nature of it as a family resource, aspects of time should be measuredto better describe its characteristics and its role as a commodity. Regular andbetter measurement of the time dimension in family functioning will also allow afuller development of a model of family functioning that encompasses the fullrange of resources used by family members to support and care for themselvesand others.
Human capital
Time and income are the most commonly referred to of the resources that familymembers have to meet the tasks of caring for themselves and others. However,they are not the only resources that families may have.
I N D I C A T O R S O F S O C I A L A N D F A M I LY F U N C T I O N I N G
2 4

Human capital refers to those resources that families may be able to use on behalfof children (including a caregiver’s knowledge, skills and experience about howthe world works). These resources include such things as a caregiver’s owneducation and training, their employment, their culturally-acquired knowledge,beliefs, attitudes and aspirations for their children, and values and traditionsconcerning parenting and family life (58).
The most accessible measures of human capital are the caregiver’s educationallevel, training and experience, and their employment status. Most of thesemeasures are measured directly in the national population census of Australia andin regular Australian labour force statistics (see Example 4.5).
Example 4.5 – Parental education – a measure of human capital
How old were you when you left school?
Did not go to school 114 years or younger 215 years 316 years 417 years 518 years 619 years or older 7Don’t know 8
What was the highest grade or year completed at school by you?(Interviewer: estimate nearest equivalent if education was not in Australia)
Primary school 1Year 8 2Year 9 3Year 10 4Year 11 5Year 12 6Don’t know 7
Please indicate the highest level of education you have completed:
Never attended school 1Primary school 2Some high school 3Completed high school (year 12 or equivalent) 4Some study toward a tertiary degree or diploma 5Completed tertiary degree or diploma 6Completed other qualification (e.g. trade certificate) 7
after (17)
A proxy measure that is frequently used as a measure of human capital isoccupation. However, there are more hazards than advantages in usingoccupation as a measure of human capital, as it confounds measures of education,with levels of training, experience, social status and income. For example, as canbe seen in Figure 5, the WA Child Health Survey (15) found that the prevalenceof child mental health problems and low academic competence was significantlyassociated with the level of parental education.
2 5
I N D I C A T O R S O F S O C I A L A N D F A M I LY F U N C T I O N I N G

Figure 5: Comparison of Level of Parental Education with Children’s Academic Competence and Mental Health
after (15)
The knowledge and skills that parents have in rearing their children compriseanother important human capital resource. These skills have been measured inmany studies by asking parents and/or young people to assess parenting practicesand skills (16, 59-64). Some of the most important skills include monitoring andsupervision, setting rules and limits, positive role modelling of communicationskills, problem-solving and decision-making skills, and providing engaging age-appropriate activities (Example 4.6). Knowing where children are, who they arewith, and what they are doing is important information for positively managingand monitoring their behaviour.
All of these skills have been shown to be empirically associated with child well-being (58). A more extensive measure of parenting style administered to parentshas been developed by Arnold et al (65) and is used widely in Australian contexts.The style in which parents carry out these activities also spans another familyresource area—that of psychological capital.
I N D I C A T O R S O F S O C I A L A N D F A M I LY F U N C T I O N I N G
2 6
0
5
10
15
20
Perc
enta
ge o
f Chi
ldre
n w
ith p
robl
ems
25
30
35
<10 yrs 10-12 yrs >12 yrs
Years of Parental Education
Low Academic Competence Mental Health Problems

Example 4.6 – A measure of parenting Tick the number box for each statement that best fits the way you feel your parents acted
My parents (or step parents or foster parents)…
Never Sometimes Often Very often
a. Smile at me ~1 ~2 ~3 ~4b. Want to know exactly where I am and ~1 ~2 ~3 ~4
what I am doingc. Soon forget a rule they have made ~1 ~2 ~3 ~4d. Praise me ~1 ~2 ~3 ~4e. Let me go out any evening I want ~1 ~2 ~3 ~4f. Do tell me what time to be home when ~1 ~2 ~3 ~4
I go outg. Nag me about little things ~1 ~2 ~3 ~4h. Only keep rules when it suits them ~1 ~2 ~3 ~4i. Make sure I know I am appreciated ~1 ~2 ~3 ~4j. Threaten punishment more often than ~1 ~2 ~3 ~4
they use itk. Speak of the good things I do ~1 ~2 ~3 ~4l. Do find out about my misbehaviour ~1 ~2 ~3 ~4m. Enforce a rule or do not enforce a rule ~1 ~2 ~3 ~4
depending upon their moodn. Hit me or threaten to do so ~1 ~2 ~3 ~4o. Seem proud of the things I do ~1 ~2 ~3 ~4
(61)
Psychological capital
Families also have access to psychological capital resources that can be used onbehalf of children and young people. Psychological capital includes parents’mental health, the level of family cohesion, the perceived level of family supportand the level of stress and conflict within the family (Example 4.7). Theestablishment of a non-threatening and non-violent emotional climate and level ofcontrol or coercion are also critical components of the family psychologicalcapital. Many of these factors have been shown empirically to be associated withchild well-being.
Other resources include a sense of personal control, self-direction and autonomy,and the availability of others to provide emotional support. An important aspectof psychological capital that is not regularly measured is self-efficacy. Self-efficacyrefers to how well individuals believe that they can manage and meet thedemands and tasks of daily living (17).
2 7
I N D I C A T O R S O F S O C I A L A N D F A M I LY F U N C T I O N I N G

Example 4.7 – A question about emotional support
Do you have anyone in particular to whom you can talk or confide in about yourself oryour problems?
Yes 1No 2
Example 4.7a – Some questions about potential family stressorsHave any of the following events happened in your family during the past 12 months?(Note the term ‘close family member’ means a parent, child, grandparent or relative living in thehousehold)
a. A close family member was very ill or had been hospitalised 1b. Unemployment/financial problems 1c. Serious family arguments 1d. A close family member was away from home a lot 1e. A favourite family pet died 1f. A close relative died 1g. Child’s best friend moved away 1h. Family member in drug/legal strife 1I. Close family member had serious emotional problems 1j. Parents were separated or divorced 1k. A close family member was robbed 1l. Trouble with child care 1m. New household members 1n. Child frightened by someone’s behaviour 1o. Struggled to provide the necessities 1p. High family mobility 1q. Unsafe neighbourhood 1r. Close family member has a physical handicap 1s. House is very crowded 1t. Child witnessed bad injury 1
after (17)
Another aspect of psychological capital is occupational complexity. Occupationalcomplexity refers to the amount of self-direction and autonomy available toindividual workers on the job. Self-direction and autonomy are dimensions of theparental working environment that have been shown to have a critical impact onchild-rearing values and behaviours (66). Importantly the amount of autonomyand discretionary control (see glossary) that individuals have in their work has asignificant impact upon their health (eg. rates of coronary heart disease, generalwell-being) (67). For men particularly, changes in job complexity have beenshown to have significant positive effects on their adult personality thatsubsequently influence aspects of parenting (68). Parents in high complexityoccupations place less emphasis on direct methods of parental control. Insteadtheir parenting style encourages the child’s internalisation of parental norms andthe development of personal responsibility.
It should also be noted that jobs which encourage autonomy and self-directionhave been shown to affect the parent’s intellectual flexibility and sense of self-efficacy and positively affects parent/child interactions at home (Example 4.8).
I N D I C A T O R S O F S O C I A L A N D F A M I LY F U N C T I O N I N G
2 8

The lack of opportunity for less educated women to acquire jobs that encourageautonomy and self-direction has ramifications for the mother’s role satisfaction, aswell as for the quality of the home learning environment she provides for herchildren (58). These aspects of family resources have attracted considerableattention in the study of the causes of serious behaviour problems in children andyoung people.
Example 4.8 – Some questions about job controlWhich best describes your present job? (Circle one)
My supervisor decides what I do and how I do it. 1My supervisor decides what I do but I can decide how I do it. 2I have some freedom in deciding both what I do and how I do it. 3I am my own boss so long as I stay within the general policies ofthe business/organisation/department 4
The speed at which you work in your present or last job might be determined entirely bythe company, or boss or supervisor. Or, it might be controlled by just you or maybe abouthalf and half between you and the supervisor.
Who controls the speed at which you work? (Please circle one number)
__________|__________|__________|__________|__________|__________
1 2 3 4 5
Controlled entirely by About half and Controlled entirelythe company half by methe bossthe supervisor
(68)
Psychological capital is not commonly measured in large scale population surveys;however, parental mental health has been a current focus of Australian statisticalcollections self-efficacy (15-17, 47). Marital breakdown, maternal depression andpaternal alcoholism in particular, have a significant impact on parent–childbonding and attachment, and the human and psychological capital available to thechild (e.g. parental monitoring and responsiveness to the child’s needs). Thesevariables have been measured in large Australian studies. Families have generallyunderstood the importance of these measures and found them to be acceptable (4,15-17, 47). Other key measures such as parental self-efficacy and family discordare less often measured but show significant associations with many of the seriousproblems shown in Table 1 (15, 17). For example, children in the WA Child HealthSurvey families who reported high levels of family conflict had almost double therates of mental health problems or low academic competence (Figure 6).
2 9
I N D I C A T O R S O F S O C I A L A N D F A M I LY F U N C T I O N I N G

Figure 6: Comparison of Family Conflict with Children’s Academic Competence and Mental Health
Social capital
Social capital is a concept that has received considerable attention in recent times(3, 7, 8, 68). In the context of a community setting, the term ‘social capital’ refersto the specific processes among people and organisations, working collaborativelyin an atmosphere of trust, that lead to accomplishing a goal of mutual socialbenefit (69). Social capital does not refer to individuals, the means of productionor to the physical infrastructure. Instead it is a relational term that connotesinteractions among people through systems that enhance and support thatinteraction. Kreuter, Lezin and Koplan (70) identified four constructs of socialcapital: trust, civic involvement, social engagement and reciprocity. Theseconstructs can be described as follows:
• trust is the belief that an individual, group, or organisation can be reliedupon to act in a consistent, fair, rational and expected manner—criteria thatare of course shaped by the individual’s own values and beliefs.
• civic involvement is participation in activities that directly or indirectlycontribute to a community’s well-being. These include solitary activities suchas voting or newspaper readership, as well as interactive activities, e.g.joining organisations that have civic improvement agendas.
• social engagement refers to the interactions that foster connections amongcommunity members or organisations. These connections include not onlythe organised groups that characterise many types of civic involvement, butalso informal connections that have no organised or specific purpose, e.g.knowing one’s neighbours or socialising with them.
• reciprocity refers to the expectation of a return on one’s investment—thefaith that an action or good deed will be returned in some form in the future.
I N D I C A T O R S O F S O C I A L A N D F A M I LY F U N C T I O N I N G
3 0
0
5
10
15
Perc
enta
ge o
f Chi
ldre
n w
ith P
robl
ems
20
25
30
Not Conflicted Conflicted
Family Conflict
Low Academic Competence Mental Health Problems

Individuals, of course, may have access to resources outside of the immediatefamily. For example, networks of relatives, friends and work colleagues mayprovide caregivers and important resources that interact with those available inthe wider community. A father whose daughter needs a job may know a friendin the local community who can arrange one. Here the father’s knowledge aboutthe world of work and his access to a friend or acquaintance (i.e. human capital)interacts with community employment resources and reciprocity (i.e. socialcapital) to secure a job opportunity.
Just as importantly though, there are other domains of social capital that may berequired to keep families healthy, that instil a sense of well-being and future, andkeep them productive and engaged. Together with domains already mentioned,support within the neighbourhood, trust in others and in governments;volunteerism, reciprocity and social engagement may allow for safer environmentsand improvements in infrastructure. These interactions may provide the ‘glue’ thatkeeps communities together (71).
They have also been shown to be context specific. For example, Silburn et al (17)showed significant variations in neighbourhood support for families living inWestern Australia’s urban and rural areas (Example 4.9). Neighbourhood supportwas generally higher for families living in rural areas. Another example has beenreported by Weatherburn and Lind (72) showing that the likelihood of juvenilesfrom crime-prone neighbourhoods being involved in crime is twice as great as thatfor juveniles from neighbourhoods without crime problems. These observationstake into account the level of parental supervision and the age and gender of thejuvenile. Finally, using Australian data, Onyx and Bullen (73, 74) have shown thatsocial capital is generally higher in rural areas than in urban areas and that it isgenerally available regardless of individual material wealth or income level.
Example 4.9 – An example of a question that measures some aspect of social capital
Do you know any of your neighbours well enough to do any of the following:
(Tick if applicable)
a. have a child minded for an hour in an emergency? ~b. have a child minded regularly? ~c. borrow $5 until you go to the bank? ~d. borrow something else? ~e. water the garden for you if you are away? ~f. feed your pets if you are away? ~g. have a talk with you if you are feeling down? ~h. get small items of shopping if you are ill? ~I. keep an eye on your home if you go away? ~
after (17)
The measurement of social capital is currently the focus of much interest andactivity (69). A comprehensive review of the area is beyond the scope of this
3 1
I N D I C A T O R S O F S O C I A L A N D F A M I LY F U N C T I O N I N G

report although there are several Australian reviews available as well as otherwork in progress (69, 71, 73, 74). More research on social capital is needed anda core set of social capital measures as they relate to families and children needsto be assessed for their relevance and relationship to particular outcomes ofinterest. An example of this from the WA Child Health Survey shows an increasedproportion of children with mental health problems and low academiccompetence among those living in areas characterised by higher rates ofperceived neighbourhood violence (Figure 7).
Figure 7: Comparison of Perceptions of Neighbourhood Violence with Children’s Academic Competence and Mental Health
Finally, as Baum has noted, social capital is not a ‘panacea for socio-economichardship’ nor is it the case that all social capital is necessarily good or health-promoting(75). The current interest in and focus on social capital is important, however, becauseit calls attention to the social context in which families live and operate.
The mix and interaction of family resources
The family resource domains discussed above have included time, income, andhuman, psychological and social capital. At any point a family may have a mixof resources available to them that may or may not be mobilised on behalf offamily members. For example, income might be used to purchase human capital(e.g. house cleaning) to offset losses in time that is needed or desired for otherpurposes (e.g. recreation, employment). Family networks might be used as ahuman capital domain to lower losses in income associated with the need for paidformal child care. These examples call attention to and define the dynamic natureof family resources. Such a description moves beyond the traditional economiccharacterisation of the family as merely a unit of ‘time and income’.
I N D I C A T O R S O F S O C I A L A N D F A M I LY F U N C T I O N I N G
3 2
0
5
10
15
20
25
30
Perc
enta
ge o
f Chi
ldre
n w
ith P
robl
ems 35
No Yes
"Worried about child abuse in your neighbourhood?"
Low academic competence Mental health problem

Frequently policy decisions by governments and agencies alter one or moreaspects in the family resource mix affecting other resources. For example, changesthat decrease eligibility for child care payments (i.e. a form of income) may leadto a decrease in educational or employment opportunities (e.g. a decline in humancapital) by sole parents who must stay home and care for children. From thechild’s point of view this dynamic nature of family resources illustrates animportant concept: that the family does not exclusively control children’s access tothe full set of resources likely to enhance their health and well-being. Instead, themix of family resources for children is influenced directly by government,community and neighbourhood sectors as well as the personal circumstances andhistories of the caregivers. The pattern of interaction among the resource domainsmay therefore promote better (or worse) outcomes for children.
Finally, we should note here that there is no ‘one best’ indicator of social andfamily functioning when these resource domains are taken into account. Forexample, increases in the amount of time a family has to spend together may beof little value in a family whose resource mix is characterised by low income andlow human or psychological capital. Similarly, increases in income may not befollowed by increases in the psychological capital of a family.
Because of the way in which resources mix and interact, a selection of indicatorsfrom each of the resource domains is needed, to enable a more comprehensivedescription of social and family functioning.
The accumulation and loss of family resources
Just as income may accumulate and be consumed or lost, so may some or all ofthe other family resource domains. These resources may also be transmittedintergenerationally. For example, Figure 5 shows the relationship betweenparental education on one hand and childhood outcomes such as mental healthproblems and low academic competence on the other (14). This finding iscommon in both cross-sectional and longitudinal research.
In general, where parents are better educated, their children tend to achievehigher levels of education, and indeed lower levels of many other problems. Inthis way the human capital of a family (e.g. parental education) is also movedintergenerationally to other family members. It may move intergenerationallywithin the same resource domain (i.e. better education for the children) and/or todifferent resource domains (i.e. better mental health for the children). This smallexample can be applied across the family resource domains in considering theaccumulation of each of the various resources, whether it be the accumulation ofincome, time, human capital, psychological capital, or social capital—somefamilies may accumulate these resources both in the present andintergenerationally.
3 3
I N D I C A T O R S O F S O C I A L A N D F A M I LY F U N C T I O N I N G

Of course, families can experience impoverishment in any of these five resourcedomains. The use of the indicator framework proposed in this report allowsattention to be focussed on the question of ‘impoverishment of what?’ Manyfamilies experience considerable or profound levels of poverty across all resourcedomains. This can be a challenge for individuals, communities and governmentswho seek to intervene and assist families in breaking the cycle of poverty.Increases in income may not always be translated into improvements in child andfamily outcomes if the family resource base has low human or psychologicalcapital also requiring improvement.
Similarly, families in some communities (e.g. rural) may be confronted bysignificant economic downturns and a marked decline in the sustainability of thelocal community and its social capital base. This may place excessive demands onthe other family resources. Thus, a chain of events may result that lowers familyincome, leads to excessive compensation with time at work, and results in highlevels of individual and marital breakdown (i.e. decrease in psychological capital).
These few examples are used to illustrate the way in which family resources maybe accumulated or lost. This resource base is dynamic and responsive to forceswell beyond the boundary of the immediate family. For some families, their settingwithin a particular community may result in significant barriers to the access ofimportant family resources. For other families, a history of poverty across theseresource domains may have resulted in major difficulties in their capacity to renewor develop particular resource domains and to move the family out of a cycle ofintergenerational poverty. Still other families may be seen to move from strengthto strength, weathering adversity and responding with resilience.
Evidence is now emerging that addressing adverse developmental healthoutcomes will require comprehensive strategies that target more than one of theresource dimensions available for families. This concept is incorporated in thenotion of mutual commitment, which acknowledges that money is not all that isrequired to address the problem associated with disadvantage. This is animportant rationale for seeking a better measurement of a range of indicators ofsocial and family functioning.
Availability of data
As previously indicated, the availability of data that describe the indicators ofincome, time, and human, psychological and social capital is variable. Part of thisvariability reflects the ease of collection while some is due to the absence of ageneral framework for understanding family resources and linking them tooutcomes of interest. Participants at the 1999 National Workshop on Indicators ofSocial and Family Functioning discussed both the theoretical framework for datacollection in this area and the availability of such information. The frameworkproposed in this report was supported by those attending the national workshop(see appendix C).
I N D I C A T O R S O F S O C I A L A N D F A M I LY F U N C T I O N I N G
3 4

Workshop participants were asked to review the individual items and scalespresented in Table 2 with a view to suggesting which of these could or should bedeveloped for wider use. Importantly, participants were asked to identify thosemeasures currently in use within Australia and which could be developed forfurther use and or greater reporting. A general summary of those items or scaleswithin the proposed framework of indicators of social and family functioning ispresented in Table 3. Indicators that are available in current collections by theABS, the AIHW and the AIFS are highlighted. Table 3 also contains examples ofindicators that overlap resource domains and that confuse one resource domainwith another, making it virtually impossible to assess the effect that the indicatorhas on the outcome of interest.
Note that the indicators of social and family functioning presented in Table 3 arenot designed to be all-inclusive. Instead, they are a distillation of those indicatorspresented in Table 2. As such Table 3 presents a relatively small ‘reference’framework of indicators that may be workable in the short to medium term andthat would allow some meaningful longitudinal measurements.
Associating indicators of social and family functioning with outcomes of interest
Finally, and before turning the presentation of a reference instrument (see Chapter 5), we should comment here that one of the major challenges facingpolicy makers and those who wish to implement and evaluate policies is thedisassociation of indicators of social and family functioning from the measurementof targeted outcomes. For example, health professionals may wish to implementinterventions in mental health that seek to reduce or prevent serious behaviouraldisturbances in children. Health data may allow a regular assessment of thenumber of children who are referred and treated within health facilities for theseserious conditions. However, it is usual for health information systems to onlycollect information about the presenting problem (i.e. diagnosis) and perhaps theresources used to treat the problem (i.e. length of stay). Little if any additionalinformation is collected and reported on the determinants of either the onset orthe persistence of the problem.
While some agencies and services collect indicator data of the type described inthis report, the practice is not commonplace. In general it is not usual for healthservices to collect and retain as part of their health information system any of theindicators in Table 2.
This causes two problems. First, it prevents identification of the relationshipsbetween possible social and family determinants and the outcomes of interest (inthis case, serious behaviour problems). Secondly, it prevents the assessment of theimpact of policies or other events that seek to prevent or reduce these problems.
3 5
I N D I C A T O R S O F S O C I A L A N D F A M I LY F U N C T I O N I N G

A small set of indicators of social and family functioning regularly associated withkey outcome data would greatly improve this situation and assist in the provisionof accurate and timely information for policy and planning needs. In practicalterms, families presenting at services would need to be approached for these datain ways that secure their consent and ensure that they understand the need forthis information, in monitoring population health. This is not without challengeor cost, but without these data, the costs of planning, program implementationand evaluation are likely to be higher.
I N D I C A T O R S O F S O C I A L A N D F A M I LY F U N C T I O N I N G
3 6

37
IND
ICA
TOR
S O
F S
OC
IAL A
ND
FAM
ILY F
UN
CT
ION
ING
Table 3: Proposed core indicators of social and family functioning
Measures that confound resource domains
Family type (original, step & blended, sole parent)Available non resident parent(s)
Stability and quality of care
NOTE: Shaded areas represent indicators currently available or accessible in National and/or State collections
Time
Parental hours in paidemployment
Hours in unpaid labour
Parental employment status(full-time, part time, casual)
Hours of formal child care
Hours engaged inparent–child activities(supervising homework,outings, recreational &leisure activities)
Time child spends watchingtelevision (playing videogames/internet)
Human Capital
Parental/carer education
Parental/carer physical health
Culturally acquiredknowledge, attitudes, beliefs,values & traditions
Parental/carer skills andcompetencies
Social Capital
Neighbourhood, violence &crime
Social or culturaldiscrimination
Availability of supportservices
Trust
Social supports/extended kin& community contacts
Social participation andengagement
Reciprocity
Civic involvement
Income
Total family income
Disposable family income
Level of welfare benefits(current, sustained & lifetime)
Financial strain (ratio of debts to assets)
Psychological Capital
Stressful life events
Parental mental health
Level of self-efficacy,mastery/personalcontrol/autonomy & self-direction
Family conflict(discord, violence, abuse)
Family cohesion
Perceived level of socialsupport
Parenting/carer style(encouraging, detached,coercive, inconsistent)

5: A REFERENCE INSTRUMENT FOR MEASURING INDICATORS OFSOCIAL AND FAMILY FUNCTIONING
. . . . writing sufficiently clear and ‘simple’ questions is hard-won, heavyduty work for survey researchers. It requires special measures to castquestions that are clear and straightforward in four important respects:simple language, common concepts, manageable tasks, and widespreadinformation (79).
In this Chapter we present a small and restricted set of items and scales that canbe used to derive indicators of social and family functioning. At the outset weshould comment that several considerations guide this selection.
First, the items and scales are principally designed to be used in populationmonitoring or in settings where there is a need to describe large samples rather thanindividual families or individuals within families. As such they are not designedto be used to assess risk exposures for a single individual. Instead, they aredesigned to assess population characteristics and risk exposures of largepopulations and samples. These risk exposures operate over time withinpopulations and, despite demonstrated and so called ‘weak causal’ associations,they in fact produce a substantial burden for individuals, families andcommunities (51).
Second, the proposed items and scales allow both the measurement and reportingof changes in social and family functioning over time (i.e. monitoring trend) aswell as permit defining samples or populations who are exposed to risks that arerelatively higher or more numerous (i.e. targeting). While it would be temptingto characterise a given item or scale as being either primarily a ‘trend indicator’ oran ‘indicator for targeting intervention or prevention’ this is a distinction of use orintent rather than a distinction that is intrinsic to the item or scale itself.Participants at the National Workshop on Social and Family Functioning held theview that there was an urgent need for population monitoring of trends over timein social and family functioning. However it was also acknowledged that if theitems and scales needed for monitoring trends were selected with care, then theywould have considerable use in defining populations and samples suitable for thetargeting of interventions – particularly as these interventions related toprevention. Readers should note that the theoretical framework for preventionintervention is currently the subject of considerable Commonwealth developmentunder the National Mental Health Strategy and the National Public HealthPartnership where prevention intervention is seen to span three key settings:whole populations (i.e. universal interventions), populations with elevated risks(i.e. selected interventions), and populations with early emergent problems orsymptoms (i.e. indicated interventions).
I N D I C A T O R S O F S O C I A L A N D F A M I LY F U N C T I O N I N G
3 8

Third, the technical development and presentation of item reliabilities, scalereliability and validity, and associated correlates in some (but not all) of theseareas remains to be done. This development is the subject of a specificrecommendation regarding future work.
In general the indicator items and scales that appear here have been selected to:
• be easily and readily understood by the public;
• assess both positive and negative aspects of well-being;
• have a stable meaning over time;
• anticipate the future and provide baseline data for subsequent trends;
• provide complete coverage of the population or event being monitored;
• assess dispersion across given measures of well-being, the duration thatchildren spend in a given status, and assessment of cumulative risk factorsexperienced by children;
• measure progress in meeting social goals for child well-being at the national,state and local levels;
• be available for relevant population subgroups (37).
In presenting the items for the reference instrument it is important to note that theparticipants at the1999 national workshop on indicators of social and familyfunctioning were of the view that the number and range of indicators should belimited to a few standard variables. This does not prohibit the collection of otherdata in these domains; indeed, this is seen as desirable. However, a few standarditems, if routinely collected across Australian settings and populations, would greatlyenhance the comparability of data and permit tracking of changes over time.
Finally, as noted in Chapter 4, the data from many (but not all) of these items andscales are already collected through the work of the Australian Bureau of Statistics,the Australian Institute of Health and Welfare and the Australian Institute of FamilyStudies. Readers of this document may wish to review Tables 2 and 3. Indistilling the information in Table 2 to produce Table 3 the National Workshopparticipants were mindful of the work already under way in Australia. Thereference instrument produced here reflects many of the priorities listed in Table 3. It is seen as an effort to value add to the data currently being collectedwithin Australia. As such, the proposed reference instrument is a beginning pointfor further use and development.
The ISAFF Reference Instrument
The questionnaire presented in this section is called ‘The Indicators of Social andFamily Functioning Reference Instrument’ (ISAFF-RI). We have deliberatelytermed it a ‘reference’ instrument to denote it as an indicative instrument rather
3 9
I N D I C A T O R S O F S O C I A L A N D F A M I LY F U N C T I O N I N G

than an instrument in final form. Our intent in the design of this instrument is tosuggest a minimal data set as a beginning point for the more rigorousdevelopment of an instrument capable of describing population and large sampletrends and characteristics.
The instrument has been designed on the assumption that a caregiver (e.g. amother or a father) is the respondent. This is as much for convenience ofpresentation as it is to acknowledge that the presentation of the items isinfluenced by the mode of their collection. We have assumed that this instrumenthas been given to the caregiver of a specific child. Our focus on collecting thesedata from a caregiver has been selected by way of illustration and is in keepingwith the general approach adopted in this monograph: namely a focus on socialand family factors that influence the developmental health and well-being ofchildren. Of course, other modes of collection are possible. Where required thisinstrument would need to be revised and modified to make it appropriate andsuitable for other modes of collection.
We acknowledge that both in design and science the selection of items and scalespresented below will need to be assessed for their acceptability and usefulness.Many of the items and scales have had an extensive use. Some have not. Others(notably those in the social capital domain) are the subject of intensedevelopment within Australia and it would be expected that the ones suggestedhere would be replaced with measures of known validity and reliability as theybecome available. We should stress that these data should be collectedconcurrently with information about outcomes of interest (see Table 1). Each ofthe sections of the instrument are explained below.
Section A: About your family
Item 1. Section A contains a single item (item 1) that provides minimal contextualinformation about the structure of the family. It avoids the historical tendency ofgrouping families into ‘one parent’ and ‘two parent’ families and insteadacknowledges that family transitions occur when families move from beingoriginal families to sole parent families and, for many, re-form into step andblended families. There is also scope for caregivers to describe their familycomposition as being ‘extended’ or ‘other’. This is a general indicator item thatsupplies a broad demographic description and enables analysis of trends overtime in the rate of family re-formation. As noted in Chapter 4, this item confoundsseveral resource domains affecting child and family outcomes and on its own isof limited use.
Section B: About your family income
The two items (and an additional probe item) in this section comprise theindicators for income.
I N D I C A T O R S O F S O C I A L A N D F A M I LY F U N C T I O N I N G
4 0

Item 2. This is a five-point scale that does not request a direct estimate of familyincome. It is used to estimate ‘financial strain’. A similar question has been usedin ABS surveys of household expenditure.
Item 3. In contrast to item 2, item 3 requests direct information about combinedfamily income. For respondents uncertain about their actual level of income, aprobe is offered allowing some estimate of income category. Item 3 is generallymodelled from ABS census questions, while the probe for those who areuncertain, is taken from suggestions by Duncan and Petersen (57). Together datafrom these items would permit adequate descriptions of median gross income insamples and populations as well as estimating proportions of families affected byfinancial strain.
Section C: About your time
Two measures of time are used in this section: the amount of time a caregiver isin paid employment, and the amount of time a child is in day care.
Items 4 and 5. These items identify and sequence caregivers who areunemployed or out of the labour force beyond item 6.
Item 6. This item requests caregivers to estimate the amount of time spent in paidemployment. It is measured in hours.
Items 4, 5 and 6 are designed to be asked of both caregivers thereby allowing anestimate of the total time a family unit allocates to work. These items aregenerally modelled after ABS questions. While not as precise as the questionsroutinely asked in labour force surveys, the data from these questions wouldallow adequate comparisons with national labour force statistics or permit the ABSto respond to requests for custom tables from their data in order to match theseindicator items.
Item 7. Caregivers are asked to estimate the time that a given child in the familyspends in child care.
In seeking to measure some aspect of time allocation in families the participantsat the National Workshop agreed that these items were more likely to be ‘proxies’of more direct estimates of time spent caring for oneself and one’s family.However, they were none-the-less important indicators – particularly if collectedconcurrently with the other information in the ISAFF Reference Instrument.
Section D: About your well-being
The items in this section are measures of psychological capital.
Item 8 contains 12 items probing for specific life stresses. These include deathand problems with health, relationships, money and the law and represent someof the most stressful events reported by Australian families (16, p 45). The scale
4 1
I N D I C A T O R S O F S O C I A L A N D F A M I LY F U N C T I O N I N G
is a simple count of the number of stresses a family reports in the span of the past12 months.
Item 9 asks the caregiver if they have been treated for an emotional or mentalhealth problem. This item has been used in Australian population studies (14, 15, 16) and is a general indicator of an existing or previously existing mentalhealth concern affecting the caregiver(s).
Item 10 is the general scale of the McMaster Family Assessment Device (76, 77).It has an extensive use in studies of Australian populations (14, 15, 16) and canbe scored, following the reverse coding of relevant items, by summing theresponse categories. It is considered a reliable and valid estimate of generalfamily functioning.
Item 11 measures the degree of control the respondent has in a given jobenvironment. It is modelled after work by Kohn (68) and, while largely untestedin Australian settings, its theoretical support and relationship to health and well-being outcomes is well documented (79).
Section E. About your neighbourhood
The questions in this section measure some aspect of social capital in the form ofconnectedness to the immediate neighbourhood and the experience of crime inthe area.
Item 12. The items in the short scale comprise questions about connectedness tothe immediate neighbourhood environment. They have been used in Canadianand Australian population surveys (16) where rural and urban variations havebeen shown.
Items 12 and 13 probe for experiences of theft, assault or property damage andif so, inquire if these have happened in the immediate neighbourhood.
At the time of the National Workshop on Social and Family Indicators workshopparticipants acknowledged that the domain of social capital was under intensivedevelopment in Australia and that, at present, no ‘optimal’ indicator questions forsocial capital had been tested and validated in the Australian context. This wasseen to be an area for further development.
Section F. About your education, health and parenting style
These questions gather information about human capital within families.
Item 15 measures the primary and secondary educational level of the caregiver.Measures of education are generally acknowledged to be among some of the mostpowerful estimates of human capital and are closely associated with health andother outcomes in developed and developing countries.
I N D I C A T O R S O F S O C I A L A N D F A M I LY F U N C T I O N I N G
4 2

Item 16 complements the measure of caregiver education by requestinginformation about the experience of tertiary education.
Item 17. This is a general indicator of caregiver health. It has been usedextensively in Australian population studies where it has been shown to beassociated with other health and social outcomes.
Items 15, 16 and 17 should be requested of both caregivers (where present in thefamily). This allows a more comprehensive estimate of human capital (in the formof caregiver education) in the family unit.
Item 18. This is the 30 item Arnold Parenting scale (65). Responses to this scalecan be used to describe various parenting styles and practices. It has been usedextensively in Australian studies of both large samples and populations where ithas been shown to be acceptable to families and a valid and reliable estimate ofparenting style.
This is the largest single scale in the ISAFF Reference Instrument. A smaller,measure of parenting style was the subject of a considerable search, but failed toproduce an instrument that had acceptable properties. Other parenting scaleshave been used (16, 17) however, the respondents were adolescents, not parents.As the general focus of the ISAFF Reference Instrument is on data collected fromadult caregivers, the Arnold Parenting Scale was selected. The scale may becoded and, with appropriate reverse coding, scored to describe caregiverparenting style.
As data are collected with this scale it will become possible to assess the internalreliability and validity of the scale for possible reduction to a fewer number ofitems. In the meantime, given the importance of parenting style and practices asa critical feature of the human capital of families, the Arnold is the scale of choicefor this.
Using the ISAFF Reference Instrument
The ISAFF Reference Instrument (ISAFF-RI) is designed to illustrate the minimumitem domains that should be considered in the measurement of social and familyfunctioning. Thus, we would contend that if social and family functioning is tobe measured then the minimum domains to be considered for measurement are:time, income, and human, psychological and social capital. We have selectedspecific items and illustrated them here (see below). In the first instance wewould suggest that they should be used. This will allow an assessment of theiracceptability and usefulness. It will also allow sufficient data to be collected tofurther assess reliability and validity.
The ISAFF-RI is also designed to illustrate a minimum data set of items and scales.Social and family functioning is a vast topic offering a multitude of theories andopportunities for their development and measure. We have opted to restrict the
4 3
I N D I C A T O R S O F S O C I A L A N D F A M I LY F U N C T I O N I N G

ISAFF-RI in its overall size and burden to the respondent. This instrument is areference instrument. The items are not ‘set in stone’ and we would expect thisinstrument to be used and developed. What is critical are the concepts underlyingthe choice of the domains and the specific choice of these items and scales as theinitial ones to use.
In what settings should the scales be used? Participants at the National Workshopon Social and Family Functioning held the view that key agencies – among themthe Australian Bureau of Statistics, the Australian Institute of Family Studies, andthe Australian Institute of Health and Welfare – should consider this instrumentand its content from their perspectives as national agencies that are in a positionto collect and report these data. Similarly, state health, education and family andcommunity services may wish to consider the ISAFF-RI and its use within largesamples of their client populations. There is also scope for the use of the ISAFF-RI in specific projects or interventions where an accurate description of the socialand family characteristics of participants is needed. Finally, researchers arecritically positioned to consider the measurement domains and their use in avariety of research applications: epidemiological studies, clinical trials, andinterventions where characteristics of social and family functioning may be critical.
In closing this chapter we would comment that the real value in themeasurements we are suggesting will emerge through their collection over time.This will allow comparisons of trends and a fuller description of their associationwith other data gathered routinely: notably economic and health data. This willpermit a more comprehensive understanding of the associations between socialand family functioning on one hand and, for example, economic and healthtrends and outcomes on the other.
I N D I C A T O R S O F S O C I A L A N D F A M I LY F U N C T I O N I N G
4 4

IntroductionISAFF Reference Instrument
Institute for Child Health ResearchPerth, Western Australia
These questions seek information about your familyand about your social circumstances. By having abetter description of how families function and thenature of their social circumstances improvementscan be made in a variety of health and communityservices. This information will also allow a betterunderstanding of how families and communitieschange over time. Your participation in completingthese questions is voluntary and the answers youprovide are confidential. No information will bereleased that would identify individuals orindividual families.
A. About your family
1. How would you describe your family (tickone that best applies)?
[ ] Original family (i.e. children with both biological or adoptive parents)
[ ] Step/ blended family (i.e. step relationshipsexist within the family)
[ ] Sole parent family
[ ] Extended family: (please describe):
[ ] Other: (please describe):
B. About your family income
2. Which words best describe your family’smoney situation (tick one that best applies)?
[ ] We are spending more money than we get
[ ] We have just enough money to get usthrough to the next pay day
[ ] There’s some money left over each weekbut we just spend it
[ ] We can save a bit every now and again
[ ] We can save a lot
3. What was the total combined income of allmembers of this family (this past year)?Please include money from jobs, net incomefrom business, farm or rent, pensions,dividends, interest, social security paymentsand any other money income received byyou or any other family member.
$___________ (this past year)
[ ] DON’T KNOW OR UNSURE?
Would you say that the total combined incomeof all members of this family this past yearmight be:
a. [ ] Less than $20,000
b. [ ] Between $20,000 and 29,999
c. [ ] Between $30,000 and 39,999
d. [ ] Between $40,000 and 49,999
e. [ ] Between $50,000 and 59,999
f. [ ] Between $60,000 and 69,999
g. [ ] $70,000 or more
C. About your time (to be asked ofeach caregiver)
4. Are you currently in paid employment?
[ ] No GO TO Q5
[ ] Yes GO TO Q6
5. I want employment and cannot find it.
[ ] No GO TO Q8
[ ] Yes GO TO Q8
6. How many hours a week do you work inpaid employment?
_________ hours per week
4 5
I N D I C A T O R S O F S O C I A L A N D F A M I LY F U N C T I O N I N G
ISAFF REFERENCE INSTRUMENTVersion 1 - April 2000

7. In total, how many hours each week is (thischild) usually in child care?
Hours:_______________per week
[ ] Is not in child care
[ ] Not sure
D. About your well-being
8. Have any of the following events happenedin your family during the past 12 months(tick all that apply)?
Note: The term ‘close family member’ means a parent, child,grandparent or relative living in the household.
NO YES
a. A close family member had aserious medical problem(illness or accident) and wasin hospital
b. A close family member wasbadly hurt or sick (but wasnot in hospital)
c. A close family member wasarrested or in jail
d. Our child or children wereinvolved in or upset by familyarguments
e. A parent/caregiver losthis/her job or wasunemployed
f. A close family member had analcohol or drug problem
g. Our family had seriousfinancial problems
h. A close family member has aphysical handicap
i. A parent, brother or sisterdied
j. Parents were separated ordivorced
k. We have been very crowdedwhere we live
l. Other, please specify:
9. Have you ever been treated for anemotional or mental health problem?
[ ] No
[ ] Yes
10. Below are statements about families andfamily relationships. For each one, circlethe category (1-4) which best describes yourfamily.
Strongly StronglyAgree Agree Disagree Disagree
a. Planningfamilyactivities isdifficultbecause wemisunderstandeach other.
b. In times ofcrisis we canturn to eachother forsupport.
c. We cannot talkto each otherabout sadnesswe feel.
d. Individuals (inthe family) areaccepted forwhat they are.
e. We avoiddiscussing ourfears andconcerns.
f. We expressfeelings to eachother.
g. There are lotsof bad feelingsin our family.
h. We feelaccepted forwhat we are.
i. Makingdecisions is aproblem in ourfamily.
j. We are able tomake decisionsabout how tosolve problems.
k. We don't get onwell together
l. We confide ineach other
I N D I C A T O R S O F S O C I A L A N D F A M I LY F U N C T I O N I N G
4 6
[ ] [ ]
[ ] [ ]
[ ] [ ]
[ ] [ ]
[ ] [ ]
[ ] [ ]
[ ] [ ]
[ ] [ ]
[ ] [ ]
[ ] [ ]
[ ] [ ]
[ ] [ ]
1 2 3 4
1 2 3 4
1 2 3 4
1 2 3 4
1 2 3 4
1 2 3 4
1 2 3 4
1 2 3 4
1 2 3 4
1 2 3 4
1 2 3 4
1 2 3 4

11. Which statement below best describes yourcurrent job? (tick one)
a. [ ] I am not in a job at the moment
b. [ ] My supervisor decides what I do and how I do it
c. [ ] My supervisor decides what I do butI can decide how I do it
d. [ ] I have some freedom in deciding both what I do and how I do it
e. [ ] I am my own boss so long as I stay within the general policies of the business/organisation/ department.
E. About your neighbourhood
12. Do you know any of your neighbours wellenough to do any of the following (tick ifapplicable):
a. have a child minded for an hourin an emergency?
b. have a child minded regularly?
c. borrow $5 until you go to thebank?
d. borrow something else?
e. water the garden for you if youare away?
f. feed your pets if you are away?
g. have a talk with you if you arefeeling down?
h. get small items of shopping if youare ill?
i. keep an eye on your home if yougo away?
13. Have any of the members of this householdbeen the victim of theft, assault, propertydamage or any other crime in the last 12months?
[ ] No GOTO Q15
[ ] Yes GOTO Q14
14. Did this crime happen in thisneighbourhood or community?
[ ] No
[ ] Yes
F. About your education, health andparenting (to be asked of eachcaregiver)
15. What was the highest level of schooleducation obtained by you?
a. [ ] Did not go to school
b. [ ] Primary school
c. [ ] Year 8
d. [ ] Year 9
e. [ ] Year 10
f. [ ] Year 11
g. [ ] Year 12
16. What is the highest qualification obtainedby you since leaving school?
a. [ ] No post school qualification
b. [ ] Trade/apprenticeship
c. [ ] Certificate from college, TAFE
d. [ ] Diploma (beyond Year 12)
e. [ ] Bachelors degree
f. [ ] Postgraduate diploma/higher degree
g. [ ] Don’t know
h. [ ] Other—Please specify:
17. In general, how would you describe yourhealth?
a. [ ] Excellent
b. [ ] Very good
c. [ ] Good
d. [ ] Fair
e. [ ] Poor
[ GO TO NEXT PAGE]
4 7
I N D I C A T O R S O F S O C I A L A N D F A M I LY F U N C T I O N I N G
[ ]
[ ]
[ ]
[ ]
[ ]
[ ]
[ ]
[ ]
[ ]

Below are a series of items that refer to your parenting style during the past TWO MONTHS3. Please circle the one number between A and B that is nearest to what you do with (this child).
Statement A Circle one number only Statement B
1. When my child misbehaves…
I do something right away 1 2 3 4 5 6 7 I do something about it later
2. Before I do something about a problem…
I give my child several reminders 1 2 3 4 5 6 7 I use only one reminder oror warnings warning
3. When I’m upset or under stress…
I am picky and on my child’s back 1 2 3 4 5 6 7 I am no more picky than usual
4. When I tell my child not to do something...
I say very little 1 2 3 4 5 6 7 I say a lot
5. When my child pesters me…
I can ignore the pestering 1 2 3 4 5 6 7 I can’t ignore the pestering
6. When my child misbehaves…
I usually get into a long argument 1 2 3 4 5 6 7 I don’t get into an argumentwith my child
7. I threaten to do things that…
I am sure I can carry out 1 2 3 4 5 6 7 I know I won’t actually do
8. I am the kind of parent that…
sets limits on what my child 1 2 3 4 5 6 7 lets my child do whatever he or is allowed to do she wants
9. When my child misbehaves…
I give my child a long lecture 1 2 3 4 5 6 7 I keep my talks short and to the point
10. When my child misbehaves…
I raise my voice or yell 1 2 3 4 5 6 7 I speak to my child calmly
11. If saying no doesn’t work right away…
I take some other kind of action 1 2 3 4 5 6 7 I keep talking and trying to get through to my child
12. When I want my child to stop doing something…
I firmly tell my child to stop 1 2 3 4 5 6 7 I coax or beg my child to stop
13. When my child is out of my sight…
I often don’t know what my 1 2 3 4 5 6 7 I always have a good idea of my child is doing child is doing
14. After there’s been a problem with my child…
I often hold a grudge 1 2 3 4 5 6 7 things get back to normal quickly
15. When we’re not at home…
I handle my child the same way I 1 2 3 4 5 6 7 I let my child get away with a lot moredo at home
16. When my child does something I don’t like…
I do something about it every time 1 2 3 4 5 6 7 I often let it goit happens
I N D I C A T O R S O F S O C I A L A N D F A M I LY F U N C T I O N I N G
4 8
3 From Arnold et al, 1993 (63).

Statement A Circle one number only Statement B
17. When there’s a problem with my child…
things build up and I do things 1 2 3 4 5 6 7 things don’t get out of handI don’t mean to do
18. When my child misbehaves, I spank, slap, grab, or hit my child…
never or rarely 1 2 3 4 5 6 7 most of the time
19. When my child doesn’t do what I ask…
I often let it go or end up 1 2 3 4 5 6 7 I take some other actiondoing it myself
20. When I give a fair threat or warning…
I often don’t carry it out 1 2 3 4 5 6 7 I always do what I said
21. If saying no doesn’t work…
I take some other kind of action 1 2 3 4 5 6 7 I offer my child something nice so he/she will behave
22. When my child misbehaves…
I handle it without getting upset 1 2 3 4 5 6 7 I get so frustrated or angry that my child can see I’m upset
23. When my child misbehaves…
I make my child tell me why 1 2 3 4 5 6 7 I say ‘No’ or take some other actionhe/she did it
24. If my child misbehaves and then acts sorry…
I handle the problem like I 1 2 3 4 5 6 7 I let it go that timeusually would
25. When my child misbehaves…
I rarely use bad language or curse 1 2 3 4 5 6 7 I almost always use bad language
26. When I say my child can’t do something…
I let my child do it anyway 1 2 3 4 5 6 7 I stick to what I said
27. When I have to handle a problem…
I tell my child I am sorry about it. 1 2 3 4 5 6 7 I don’t say I’m sorry
28. When a child does something I don’t like. I insult my child, say mean things, or call my child names…
never or rarely 1 2 3 4 5 6 7 most of the time
29. If my child talks back or complains when I handle a problem…
I ignore the complaining and stick 1 2 3 4 5 6 7 I give my child a talk about notto what I said complaining
30. If my child gets upset when I say ‘No’…
I back down and give into my child 1 2 3 4 5 6 7 I stick to what I said
[NO MORE QUESTIONS]
4 9
I N D I C A T O R S O F S O C I A L A N D F A M I LY F U N C T I O N I N G

6: CONCLUSION AND RECOMMENDATIONS
It is recommended that…whatever conceptual framework is developed to explicatechild well-being, that it be an ecological framework, and that it associate child well-being with family and community quality of life and resiliency (1).
The 1999 National Workshop on Indicators of Social and Family Functioningreached a broad consensus on the rationale for and framework of indicatorspresented in this document. The main conclusions were:
• Within government and research there is a need to analyse the link betweenserious outcomes in child health and well-being on one hand and indicatorsof social and family functioning on the other, and to do this across differentpopulations within Australia.
• At present the analysis of the link between serious outcomes in childhealth/well-being and indicators of social and family functioning is notpossible. This is because either indicator data are not collected or arecollected in non-standard ways. This prohibits comparing and/or combiningdata sources and thus impedes progress.
• The rationale for selecting indicators of social and family functioning shouldbe based on the principle of causal pathways. Such a rationale identifiesopportunities for risk modification and intervention.
Where to from here?
The immediate next steps to implement indicators of social and family functioningwill require:
• refining individual items of the proposed core indicators for use in a varietyof data collection formats (eg. face-to-face surveys, interviews, paper andpencil questionnaires) and from a variety of informants (eg. differentcaregivers, young people, teachers);
• bringing together what is known about psychometric and sociometricproperties of Australian populations (eg. reliabilities, validities, andcorrelates);
• publishing the indicators and their properties in paper and electronicformats; and
• promoting their use in government and research settings.
In reaching a consensus, participants at the national workshop recognised that toimplement a standard set of indicators would require sustained direction andleadership. A technical advisory group drawn from the key agencies (ABS, AIHWand AIFS) along with leading scientists and information managers could progressthis work in a timely fashion.
I N D I C A T O R S O F S O C I A L A N D F A M I LY F U N C T I O N I N G
5 0

Conclusion
Great attention is paid to the rise and fall of national indicators of economicproductivity and to patterns of investment for the future. And yet, the keyresource on which so much of this is based, the Australian family, remainsremarkably unknown and rarely charted. Many of the current outcomes ofconcern to families, communities and governments are outcomes that havedeveloped over long periods of time. Family breakdown, drug abuse, juvenileoffending and poor school retention represent outcomes that substantially reflectfundamental changes in the matrix of family resources described in this report.
The time span to improve most of these outcomes is long and extends over theterms of governments. Neither families nor governments alone can achieveimprovements in these outcomes. Just as a variety of partnerships are needed inthe lives of children and families to achieve good health and well-being, so tooare partnerships needed within and between governments, communities andindividuals to achieve these same goals.
Developing measures of how well families are doing and the impact of changesin the social, economic and cultural environments in which families live has beenthe focus of this report. Regular reporting of indicators of social and familyfunctioning is needed. Many of the basic indicators are either already availablein current national collections or, with relatively modest investment, could becollected in national collections of data or at local levels.
Such data would provide a solid foundation for policy development and programsof intervention.
RecommendationsIt is recommended that
1. a set of indicators of social and family functioning be selected on the basis oftheir capacity to measure risk exposures known to be on the causal pathwaysof poor health, educational, social and criminological outcomes. Theseindicators should be included in the regular social and health surveypublications of key government agencies on children, young people and theirfamilies. Population health researchers should also be encouraged toincorporate these indicators into research designs.
2. the set of indicators of social and family functioning developed by the nationalworkshop be accepted. They cover five key resource domains for social andfamily functioning relevant to child health and well-being outcomes:
• time
• income
5 1
I N D I C A T O R S O F S O C I A L A N D F A M I LY F U N C T I O N I N G

• human capital
• psychological capital
• social capital.
3. ‘The Indicators of Social and Family Functioning Reference Instrument’ (ISAFF-RI) (see Chapter 5) be used as an indicative measure to assess the acceptabilityand usefulness of such indicators.
4. a technical advisory group be established, drawn from key agencies—the ABS,AIHW and the AIFS—together with leading scientists and informationmanagers, to trial, review and refine instruments capable of describingpopulations and large sample trends and characteristics for use in governmentand research settings.
5. once appropriately developed, these indicators be considered for inclusion inthe current National Health and Medical Research Council (NHMRC) review ofthe national surveillance and screening of children and young people.
I N D I C A T O R S O F S O C I A L A N D F A M I LY F U N C T I O N I N G
5 2

REFERENCES
1. Asher BA & Wintersberger H. (1997) Eurosocial Report 62/1997. Monitoring TheState Of Children—Beyond Survival. International Workshop Jerusalem, Israel22–25 January 1996. European Centre for Social Welfare Policy Research,Vienna.
2. Keating DP & Hertzman C. (1999) Developmental Health and the Wealth ofNations. Guilford Press, New York.
3. Vimpani G & Zubrick SR. (1998) The Collaborative Development Of IndicatorsOf Social And Family Functioning: Project Proposal. CommonwealthDepartment Of Family Services.
4. Australian Institute of Health & Welfare. (1998) National Child HealthInformation Framework: Workshop Proceedings. AIHW, Canberra.
5. Warwick Smith. Address to Business Partnerships Round Table, February, 1998.
6. Green LW & Kreuter MW. (1999) Health Promotion Planning: An Educationaland Ecological Approach. Mayfield Publishing Company, Mountain View, CA.
7. Putnam RD. (1995) Bowling Alone: America’s Declining Social Capital.Journal Of Democracy, 1: 65–78.
8. Cox E. (1995) A Truly Civil Society: 1995 Boyer Lectures. AustralianBroadcasting Commission, Sydney.
9. Commonwealth Department of Health, Housing and Community Services.(1992) Health Goals and Targets for Australian Children and Youth ProjectReport. Commonwealth Department of Health, Housing and CommunityServices, Canberra.
10. Commonwealth Department Of Human Services And Health. (1995) TheHealth Of Young Australians: A National Policy For Children And YoungPeople. Commonwealth Department Of Health And Human Services,Canberra.
11. Commonwealth Department Of Human Services And Health. (1996) TheNational Health Plan For Young Australians: A National Policy For ChildrenAnd Young People. Commonwealth Department Of Health And FamilyServices, Canberra.
12. Garbarino J. (1997) Social Indicators: Searching For A Public Policy Grail. In CMcclintock (Ed). Making Social Indicators Useful For Policy And ProgramManagement In New York State. <Http:/ /www.human.cornell.edu/faculty/summrpt_s97.html>(Accessed 16 February 1999).
13. Moon L, Rahman N, & Bhatia K. (1998) Australia’s Children: Their Health AndWell-Being 1998. AIHW, Canberra (AIHW Cat.No PHE 7).
5 3
I N D I C A T O R S O F S O C I A L A N D F A M I LY F U N C T I O N I N G

14. Australian Bureau of Statistics. (1999) Children, Australia: A Social Report.Australian Bureau of Statistics, Canberra.
15. Zubrick SR, Silburn SR, Gurrin L, Teoh H, Shepherd C, Carlton J & LawrenceD. (1997) The Western Australian Child Health Survey: Education, Health andCompetence. Australian Bureau of Statistics and the Institute for Child HealthResearch, Perth, WA.
16. Zubrick SR, Silburn SR, Garton A, Burton P, Dalby R, Carlton J, Shepherd C &Lawrence D. (1995) The Western Australian Child Health Survey: DevelopingHealth and Well-being in the Nineties. Australian Bureau of Statistics and theInstitute for Child Health Research, Perth, WA.
17. Silburn SR, Zubrick SR, Garton A, Gurrin L, Burton P, Dalby R, Carlton J,Shepherd C & Lawrence D. (1996) The Western Australian Child HealthSurvey: Family and Community Health. Australian Bureau of Statistics and theInstitute for Child Health Research, Perth, WA.
18. Farrington DP, Loeber R, & Van Kammen WB. (1990) Long Term CriminalOutcomes Of Hyperactivity—Impulsivity, Attention Deficit And ConductDisorders In Childhood. In L N Robins & M Rutter (Eds) Straight And DeviousPathways From Childhood To Adulthood. Cambridge University Press,Cambridge. (pp. 62–81).
19. Mrazek PJ & Haggerty RJ. (1994) Reducing Risks for Mental Disorders:Frontiers for Preventive Intervention Research. National Academy Press,Washington, D.C.
20. Resnick MD, Bearman PS, Blum RW, Bauman KE, Harris KM, Jones J, Tabor J,Beuhring T, Sieving RE, Shew M, Ireland M, Bearinger LH & Udry JR. (1997)Protecting Adolescents From Harm: Findings From The National LongitudinalStudy On Adolescent Health. Journal American Medical Assocation,278:823–832.
21. Rutter M. (1995) Relationships Between Mental Disorders In Childhood AndAdulthood. Acta Pædiatrica Scandinavica 91:73–85.
22. Rutter M & Smith DJ. (1995) Psychosocial Disorders In Young People: TimeTrends And Their Causes. John Wiley & Sons, New York.
23. Samaroff AJ, Baydar N & Brooks-Gunn J. (1991) Effects Of MaternalEmployment And Child-Care Arrangements In Infancy On Preschoolers’Cognitive And Behavioural Outcomes. Evidence From The Children Of TheNLSY. Developmental Psychology 27(6):932–945.
24. Brooks-Gunn J. (1995) Children In Families In Communities: Risk AndIntervention In The Bronfenbrenner Tradition. In: Moen P, Elder GH, &Lüscher K (Eds) Examining Lives In Context: Perspectives On The Ecology OfHuman Development American Psychological Association, Washington, D.C.(Pp 467–519).
I N D I C A T O R S O F S O C I A L A N D F A M I LY F U N C T I O N I N G
5 4

25. Haverman R & Wolfe B. (1991) Childhood Events And CircumstancesInfluencing High School Completion. Demography, 28, 133–157.
26. Haverman R & Wolfe B. (1994) Succeeding Generations: On The Effects OfInvestments In Children. Russell Sage Foundation, New York.
27. Pollard J, Catalano R, Hawkins JD & Arthur M. (1998) Communities That CareYouth Survey. Development Of A School-Based Survey Measuring Risk AndProtective Factors Predictive Of Substance Abuse, Delinquency And OtherProblem Behaviours In Adolescent Populations. Developmental ResearchPrograms, Inc. Seattle WA.
28. Greenwood PW, Model K, Hydell CP & Chiesa J. (1998) Diverting ChildrenFrom A Life Of Crime. Rand. USA.
29. Simeonsson RJ. (Ed.) (1994) Risk , Resilience And Prevention – Promoting TheWell-Being Of All Children. Paul H. Brookes. USA.
30. National Crime Prevention. (1999) Pathways To Prevention; DevelopmentalAnd Early Intervention Approaches To Crime In Australia. Attorney-General’sDepartment, Canberra.
31. Carnegie Council On Adolescent Development. (1995) Great Transitions:Preparing Adolescents For A New Century, Carnegie Corporation, New York.
32. Lazarus W & Gonzalez M. (1989) California: The State Of Our Children WhereWe Stand And Where We Go From Here. Report Card & Briefing Book.Children Now, Los Angeles.
33. O’ Hara K. (1998) Comparative Family Policy: Eight Countries’ StoriesCanadian Policy Networks, Ottawa.
34. Wilkinson R & Marmot M. (1998) Social Determinants Of Health: The SolidFacts. World Health Organisation, Europe.
35. Jehl J. (1998) The Measure Of Success. What Are The Policy Implications Of TheNew National Indicators Of Child Wellbeing? Special Report #11, The PolicyExchange. The Institute For Educational Leadership. Washington, D.C.
36. Zubrick SR, Silburn SR, Vimpani G & Williams A. (1999) Emergent DemandFor Measurement Indicators Of Social And Family Functioning. PaperPresented At A Workshop Convened By The Commonwealth Department OfFamily And Community Services. Canberra, 25 March 1999.
37. Moore KA. (1995) Eurosocial Report 56. New Social Indicators Of ChildWellbeing.: European Centre For Social Welfare Policy & Research,Washington, D.C.
38. Edgar D. (1998) The New Marriage: Changing Rules For Changing Times.Threshold, 22:9.
5 5
I N D I C A T O R S O F S O C I A L A N D F A M I LY F U N C T I O N I N G

39. Ben-Arieh A. (1996) Eurosocial Report 62/199 Monitoring and measuring TheState Of Children—Beyond Survival European Centre For Social Welfare Policy& Research, Vienna.
40. Canadian Council On Social Development. (1996) Measuring Well-being:Proceedings From A Symposium On Social Indicators, November 1996.Canadian Council On Social Development, Ottawa.
41. Statistics Canada. (1997) Canadian Children In The 1990’s: Selected FindingsOf The Longitudinal Survey Of Children And Youth. Canadian SocialTrends—Spring 1997. Statistics Canada, Ottawa.
42. Federal Interagency Program On Child And Family Statistics. (1998) America’sChildren: Key National Indicators Of Well-Being. US Government PrintingOffice, Washington, D.C.
43. Hauser RM, Brown BV & Prosser WR. (1997) Indicators Of Children’s Well-Being. Russell Sage Foundation, New York.
44. Webster A. ABS Statistics On Children And Child Indicators. Paper PresentedTo Australian Population Association Conference, Brisbane, October 1998.
45. Dunlop B & Pearson V. (1999) Measuring Social And Family Functioning: ABSRole, Activities And Directions. Paper Presented To The National Workshop OnIndicators Of Social And Family Functioning, Canberra, April 1999.
46. Murray CJL & Lopez AD. (1996) The Global Burden Of Disease: AComprehensive Assessment Of Mortality And Disability, Injuries And RiskFactors In 1990 And Projected To 2020. WHO, Cambridge, Mass.
47. Australian Bureau Of Statistics. (1998) Mental Health And Well-Being ProfileOf Adults—Australia. Australian Bureau Of Statistics, Canberra. PublicationNo.4326.
48. Mccain M & Mustard FJ. The Early Years Study—Reversing The Real BrainDrain. Report From The Canadian Institute For Advanced Research To TheOntario Government, April, 1999.
49. Doll R. (1996) Weak Associations In Epidemiology: Importance, Detection,And Interpretation. Journal Of Epidemiology, S11–S20.
50. Acheson D. (1998) Independent Inquiry Into Inequalities In Health Report: TheStationery Office. UK.
51. Zubrick SR, Silburn SR, Burton P & Blair E. (In Press). Mental Health DisordersIn Children And Adolescents: Scope, Cause And Prevention. Royal Australian& New Zealand Journal Of Psychiatry.
52. Susser E & Susser M. (1989) Familiar Aggregation Studies: A Note On TheirEpidemiologic Properties. American Journal Of Epidemiology, 129: 302–3.
53. Coleman, JS. (1988) Social Capital In The Creation Of Human Capital.American Journal Of Sociology, 94, 95–120.
I N D I C A T O R S O F S O C I A L A N D F A M I LY F U N C T I O N I N G
5 6

54. Sameroff AJ & Chandler MJ. (1975) Reproductive Risk And The Continuum OfCaretaking Casualty. In FD Horowitz, Mhetherington, Scarr-Salapatek & GSlegal (Eds) Review Of Child Development Research (Vol.4). University OfChicago Press, Chicago.
55. Commonwealth Department Of Family And Community Services. (1999)Report Of A National Workshop On Indicators Of Social And FamilyFunctioning, 12-13 April. Commonwealth Of Australia: Canberra.
56. Ross DP & Roberts P. (1999) Income And Child Well-Being: A New PerspectiveOn The Poverty Debate. Canadian Council On Social Development, Ottawa.
57. Duncan GJ & Petersen E. (1997) The Long And Short Of Asking QuestionsAbout Income, Wealth And Labor Supply On Surveys.<http/famchild.wsu.edu/publications/howto.htm>. Accessed 18 January 1999.
58. Parcel T & Menaghan. (1994) Early Parental Work, Family Social Capital andEarly Childhood Outcomes. American Journal of Sociology, 99; 972–1009.
59. Wolcott I & Glezer H. (1995) Work and Family Life: Achieving Integration.Australian Institute of Family Studies, Melbourne.
60. Barber BK & Thomas DL. (1986) Multiple Discussions Of Parental SupportiveBehaviour. The Case Of Physical Affection. Journal Of Marriage And TheFamily, 48, 783–794.
61. Lempers J D, Clark-Lempers D, & Simons RL. (1989) Economic Hardship,Parenting, And Distress In Adolescence. Child Development, 60, 25–39.
62. Sanders MR & Markie-Dadds C. (1992) Toward A Technology Of PreventionOf Disruptive Behaviour Disorders: The Role Of Behavioural FamilyIntervention. Behaviour Change, 9:186–200.
63. Sanders MR, Connell S, & Markie-Dadds C. (1994) Triple P Goes Bush: AnEvaluation Of A Self Directed Program For Parents Of OppositionalPreschoolers In A Rural Setting. Paper Presented At The Social Learning AndThe Family Meeting, San Diego.
64. Sanders MR & Markie-Dadds CL. (1996) Triple P: A Multilevel FamilyIntervention Program For Children With Disruptive Behaviour Disorders. In PCotton & H Jackson (Eds) Early Intervention And Prevention In Mental HealthApplications Of Clinical Psychology. Australian Psychological Society,Melbourne (Pp.59–87).
65. Arnold DS, O’Leary SG, Wolff LS & Acker MM. (1993) The Parenting Scale: AMeasure Of Dysfunctional Parenting In Discipline Situations. PsychologicalAssessment, 5(2), 137–144.
66. Brooks-Gunn J, Brown B, Duncan G, And Moore KA. (1995) Child DevelopmentIn The Context Of Family And Community Resources: An Agenda For NationalData Collection. Washington, DC: National Academy Press.
5 7
I N D I C A T O R S O F S O C I A L A N D F A M I LY F U N C T I O N I N G

67. Syme SL. (1996) To Prevent Disease: The Need For A New Approach. In DBlane, E Brunner & RG Wilkinson (Eds) Health And Social Organisation.Routledge, London.
68. Kohn M. (1995) Social Structure And Personality Through Time And Space. InGH Elder & K Luscher (Eds) Examining Lives In Context: Perspectives On TheEcology Of Human Development. American Psychological Association,Washington, D.C.
69. Wood L. (1999) Healthy Communities: A Review Of Relevant Projects AndFeasibility For Healthway. Unpublished Report To Healthway, Perth WA.
70. Coleman J. (1990) Foundations Of Social Theory. Harvard University Press,Cambridge, Mass.
71. Kreuter M, Lezin N & Koplan A. (1997) National Level Assessment OfCommunity Health Promotion Using Indicators Of Social Capital. WHO/EUROWorking Group On Evaluating Health Promotion Approaches And Division OfAdult & Community Health National Centers For Disease Control &Prevention, Atlanta.
72. Weatherburn D & Lind B. (1999) The Developmental Antecedents Of Crime-Prone Neighbourhoods. New South Wales Bureau Of Crime Statistics &Research, Sydney, NSW.
73. Onyx, J & Bullen, P. (1997) Measuring Social Capital In Five Communities. AnAnalysis CACOM Working Paper Series No 41, UTS, Sydney.
74. Bullen, P & Onyx, J. (1998) Measuring Social Capital In Five CommunitiesPractitioners Guide. Management Alternatives, Sydney.
75. Baum F. (1999) Social Capital And Health: Implication For Health In RuralAustralia. Paper Presented At The 5th National Rural Health Conference:Leaping The Boundary Fence. Using Evidence And Collaboration To BuildHealthier Rural Communities, 14–17 March 1999, Adelaide.
76. Epstein NB, Baldwin LM & Bishop DS. (1993) The Mcmaster FamilyAssessment Device. Journal Of Marital And Family Therapy, 9, 171-180.
77. Byles J, Byrne C, Boyle MH & Offord DR. (1998) Ontario Child Health Study:Reliability And Validity Of The General Functioning Subscale Of The McmasterFamily Assessment Device. Family Process, 27 (March), 97-104.
78. Marmot MG, Smith G, Stansfeld S, Patel C, North F, Head J, White L, BrunnerE, AND Feeney A.(1991) Health Inequalities Among British Civil Servants: TheWhitehall 11 Study. Lancet, 337, 1387-1393.
79. Converse JM And Presser S. (1986) Survey Questions: Handcrafting TheStandardized Questionnaire. Sage Publications: Beverly Hills.
I N D I C A T O R S O F S O C I A L A N D F A M I LY F U N C T I O N I N G
5 8

APPENDICES
Appendix A: A summary of international and national activity relevantto the development of indicatorsTable 4: Key words/sites used in the web search
Healthy communities Risk Factors
Communities that care Marital conflict
Caring communities Child well-being
Who.dk.healthy cities Psychosocial risk factors
Measuring social capital Protective factors
Oregon option Measuring self efficacy
Oregon option indicators Resiliency
Social indicators Family assessment
Social reporting Adolescent health
Attachment/connectedness Alienation
Long term outcomes/early childhood Child development database
Social Indicators
Social Functioning Family Structure
Indicators of Well-being Family Functioning
Social Indicators and Social Reporting: Evaluating the National Outcomes: Parent/Family-The International Experience Parents; Understand
European Centre Publications: Eurosocial Reports Evaluating the National Outcomes: Parent/Family-Parents; Motivate Measures
Symposium on Social Indicators—Final Report Family Assessment Bibliography
Social Indicators Site Evaluating the National Outcomes: Community-Policy Development; Introduction
State Profiles of Child Well-Being Evaluating the National Outcomes: National Outcome Work Groups
CCSD Press Release: The Progress of Canada's Income and Child Well-being: A new perspective Children 1998 on the poverty debate
Measuring Key Family Processes/Kindness- Long-Term Outcomes of Early Childhood ProgramsSupport/distance regulation/supervision
Measuring Key Family Processes/Definition Home Visitor Programs
Carnegie Corporation of New York—Starting Points Assessing Quality in Child Care Settings
The National Longitudinal Study of Summary List of IndicatorsAdolescent Health
5 9
I N D I C A T O R S O F S O C I A L A N D F A M I LY F U N C T I O N I N G

I N D I C A T O R S O F S O C I A L A N D F A M I LY F U N C T I O N I N G
6 0
OMH-RC Database Record: Kids Count Data Book School-Based Violence Prevention in Canada: Results of a National Survey of Policies and Programs
National Survey of Child and Adolescent Well-being Assessment/Measurement/Indicators
NCAVAC | Publications | Reports Canadian Policy Research Network-CPRN
California: The State of Our Children Conducting Evaluating National OutcomesAn Adolescent Health Survey
National Youth Development Information Teens, Crime, and the Community NationalCenter (NYDIC) Database Outcomes Study on Social Responsibility
NNCC Child Development Database Teens, Crime, and the Community National Outcomes Study on Social Responsibility
Evaluating the National Outcomes: Children NNCC Child Care Evaluation and Assessment Tools
Evaluating the National Outcomes: Youth Research Tools Child Development

61
IND
ICA
TOR
S O
F S
OC
IAL A
ND
FAM
ILY F
UN
CT
ION
ING
APPENDIX B: A summary of international and national activity relevant to the development of indicatorsEUROPE
WEBSITE
http://www.euro.centre.org/causa/ec/ec_1.htm
http://www.un.org/depts/unsd/statcom/docs/xgrp2.htm
http://ecdgroup.harvard.net/assessme.html
http://www.unesco.org/educprog/ecf/html/base/base.htm
http://www.unesco.org/education/educprog/ecf/html/chart/pcistat.htm
http:ecdgroup.harvard.net/researh.html
TITLE
* Asher BA and Wintersberger H. (1997) Eurosocial Report 62/1997. Monitoring The State OfChildren-Beyond Survival. International Workshop Jerusalem, Israel 22-25 January 1996. Vienna:European Centre For Social Welfare Policy Research.
* Moore KA. (1995) New Social Indicators of Child Well-Being. Washington: European Centre forSocial Welfare Policy and Research. Eurosocial Report 56.
Heilio P-L, Lauronen E and Bardy M. (1993) Eurosocial Report 45. Politics of Childhood andChildren at Risk. Provision-Protection-Participation. Kellokski, Finland: European Centre for SocialWelfare Policy Research.
Qverortup, J. (1990) Childhood as a Social Phenomenon - An Introduction to a Series of NationalReports. Vienna, Austria: European Centre for Social Welfare Policy and Research. Eurosocial Report36. 36/1: Norway: 36/2 Italy: 36/3 Denmark: 36/4 USA: 36/5 Israel: 36/6 Canada: 36/7 Finland: 36/8Ireland: 36/9 Scotland: 36/10 Federal Republic Of Germany: 36/11 Switzerland: 36/12 Greece:36/13 Yugoslavia: 36/14 Czechoslovakia: 36/15 Sweden: 36/16 England and Wales: 36/17 DoChildren Count? A Statistical Compendium.
United Nations Economic and Social Council. Working Group on International StatisticalProgrammes and Coordination. Social Statistics: Follow up to the World Summit for SocialDevelopment.
UNICEF Current Trends in Measuring Early Childhood Development. Sheldon Shaeffer, RegionalEducation Adviser East Asia And Pacific Regional Office. UNICEF Presentation made at theworkshop 01/23/98.
UNESCO Early Childhood Databases
UNESCO Early Childhood Care and Education: Basic Indicators on Young Children
UNESCO Early Childhood Research: Research Relevant to Early Childhood Care and Development

IND
ICA
TOR
S O
F S
OC
IAL A
ND
FAM
ILY F
UN
CT
ION
ING
62 CANADA
WEBSITE
Social Indicators Sitehttp://ccsd.ca
http://ccsd.ca/pcc98/pcc98hle.htm.
http://ccsd.ca/pcc98/pcc98hle.htm
http://www.drp.org/survey.html
TITLE
Canadian Council on Social Development. (1996) Measuring Wellbeing: Proceedings From aSymposium on Social Indicators. Final Report. Ottawa: Canadian Council on Social Development.
Human Resources Development Canada. (1996) Growing up in Canada: National LongitudinalSurvey of Children and Adolescents. Ottawa: Human Resources Development Canada.
* Statistics Canada. (1997) Canadian Children in the 1990's: Selected findings of the LongitudinalSurvey of Children and Youth Canadian Social Trends - Spring 1997. Ottawa: Statistics Canada.
Canadian Council on Social Development. The Progress of Canada’s Children 1998 Highlights.
Developmental Research Programs. (1993) Communities that Care. Risk and Protective Factor-Focused Prevention Using the Social Development Strategy. An Approach to Reducing AdolescentProblem Behaviours. Seattle: Developmental Research Programs, Inc.
Pollard J, Catalano R, Hawkins J D Arthur M. (1998). Communities That Care: Youth Survey.Development of a school based survey measuring risk and protective factors predictive ofsubstance abuse, delinquency and other problem behaviours in adolescent populations.
USA
WEBSITE
http://childstats.gov
http://www.aecf.org/kc1997/summary.htm
http://www.omhrc.gov/mhr2/docs/95D2364.htm
http://www.policyexchange.iel.org
http://famchild.wsu.edu/index.htm
TITLE
* Federal Interagency Program on Child and Family Statistics. (1998) America's Children: KeyNational Indicators of Well-being. Washington DC: US Government Printing Office.
1997 Kids Count: Summary and findings.
Kids Count Data Book: State Profiles of Child Well-Being.
* Jehl J. (1998) The Measure of Success. What are the Policy Implications of the New NationalIndicators of Child Well-being? Washington, DC: The Policy Exchange. The Institute for EducationalLeadership. Special Report #11.
Discussion. Family and Child Well-Being Research Network.
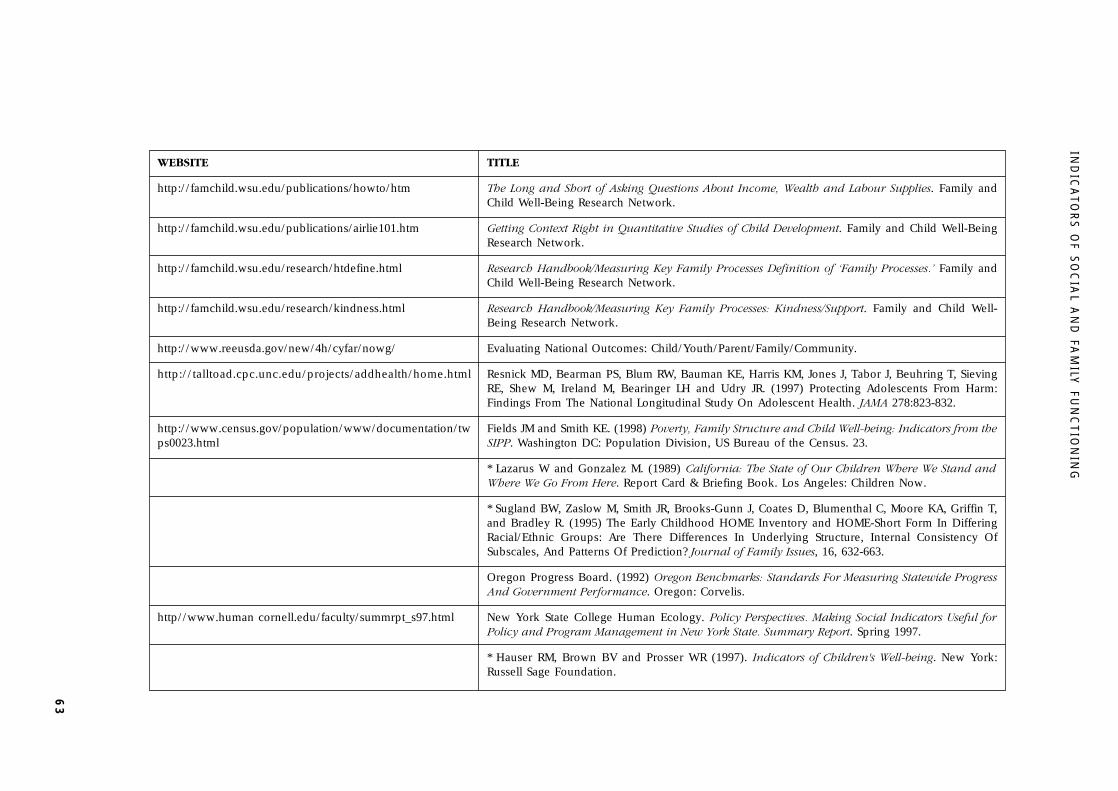
63
IND
ICA
TOR
S O
F S
OC
IAL A
ND
FAM
ILY F
UN
CT
ION
ING
WEBSITE
http://famchild.wsu.edu/publications/howto/htm
http://famchild.wsu.edu/publications/airlie101.htm
http://famchild.wsu.edu/research/htdefine.html
http://famchild.wsu.edu/research/kindness.html
http://www.reeusda.gov/new/4h/cyfar/nowg/
http://talltoad.cpc.unc.edu/projects/addhealth/home.html
http://www.census.gov/population/www/documentation/twps0023.html
http//www.human cornell.edu/faculty/summrpt_s97.html
TITLE
The Long and Short of Asking Questions About Income, Wealth and Labour Supplies. Family andChild Well-Being Research Network.
Getting Context Right in Quantitative Studies of Child Development. Family and Child Well-BeingResearch Network.
Research Handbook/Measuring Key Family Processes Definition of ‘Family Processes.’ Family andChild Well-Being Research Network.
Research Handbook/Measuring Key Family Processes: Kindness/Support. Family and Child Well-Being Research Network.
Evaluating National Outcomes: Child/Youth/Parent/Family/Community.
Resnick MD, Bearman PS, Blum RW, Bauman KE, Harris KM, Jones J, Tabor J, Beuhring T, SievingRE, Shew M, Ireland M, Bearinger LH and Udry JR. (1997) Protecting Adolescents From Harm:Findings From The National Longitudinal Study On Adolescent Health. JAMA 278:823-832.
Fields JM and Smith KE. (1998) Poverty, Family Structure and Child Well-being: Indicators from theSIPP. Washington DC: Population Division, US Bureau of the Census. 23.
* Lazarus W and Gonzalez M. (1989) California: The State of Our Children Where We Stand andWhere We Go From Here. Report Card & Briefing Book. Los Angeles: Children Now.
* Sugland BW, Zaslow M, Smith JR, Brooks-Gunn J, Coates D, Blumenthal C, Moore KA, Griffin T,and Bradley R. (1995) The Early Childhood HOME Inventory and HOME-Short Form In DifferingRacial/Ethnic Groups: Are There Differences In Underlying Structure, Internal Consistency OfSubscales, And Patterns Of Prediction? Journal of Family Issues, 16, 632-663.
Oregon Progress Board. (1992) Oregon Benchmarks: Standards For Measuring Statewide ProgressAnd Government Performance. Oregon: Corvelis.
New York State College Human Ecology. Policy Perspectives. Making Social Indicators Useful forPolicy and Program Management in New York State. Summary Report. Spring 1997.
* Hauser RM, Brown BV and Prosser WR (1997). Indicators of Children's Well-being. New York:Russell Sage Foundation.

IND
ICA
TOR
S O
F S
OC
IAL A
ND
FAM
ILY F
UN
CT
ION
ING
64 WEBSITE
http://rprogress.org
http://www.subjectmatters.com/indicators
http://www.cdc.gov/ncswwww/products/catalogs/sujects/mihs/1fnmihs.html
TITLE
* Brooks-Gunn J, Brown B, Duncan G, And Moore KA. (1995) Child Development In The ContextOf Family And Community Resources: An Agenda For National Data Collection. Washington, DC:National Academy Press.
Redefining Progress – Community Indicators Handbook.
Indicators Of Sustainability/Community Capital.
Kogan, M (1991) 1991 Longitudinal Follow Up To The 1988 National Maternal And Infant HealthSurvey Public - Use Data Files. Hyattsville, Md: Reproductive Statistics Branch, Division Of VitalStatistics, National Center For Health Statistics, Center For Disease Control And Prevention.
NEW ZEALAND
WEBSITE
htpp://www.moh.govt.nz
TITLE
Hodges I, Maskill C, Coulson J, Christie S, and Quigley R. (1998) Our Children's Health. KeyFindings On The Health Of New Zealand Children. Wellington: Ministry of Health.
Silva PA. and Stanton WR. (1996) From Child to Adult. The Dunedin Multidisciplinary Health andDevelopment Study. Auckland: Oxford University Press.
Fergusson DM, Horwood LJ, Shannon FT and Lawton JM. (1989) The Christchurch ChildDevelopment Study: A Review Of Epidemiological Findings. Paediatric And PerinatalEpidemiology 3:302-305.
Fergusson DM, Horwood JL, and M Lynskey. (1994) The Childhood's of Multiple ProblemAdolescents: A 15-Year Longitudinal Study. Journal of Child Psychology and Psychiatry 35:1123-1140.

65
IND
ICA
TOR
S O
F S
OC
IAL A
ND
FAM
ILY F
UN
CT
ION
ING
AUSTRALIA
WEBSITE TITLE
Eckersley R. (1998) Measuring Progress. Is Life Getting Better? Collingwood, Victoria: CSIROAustralia.
Bor W, Najman JM, Andersen M, Morrison J, and Williams G. (1993) Socioeconomic DisadvantageAnd Child Morbidity: An Australian Longitudinal Study. Social Science And Medicine. 36:1053-1061.
Australian Bureau Of Statistics. (1999) Children, Australia: A Social Report. Canberra: AustralianBureau Of Statistics.
* Webster A. (1998) ABS Statistics On Children and Child Indicators In Changing Families,Challenging Futures, Australian Institute Of Family Studies Conference. Melbourne: AustralianBureau Of Statistics.
* Wood L. (1999) Healthy Communities: A Review Of Relevant Projects and Feasibility ForHealthway. Perth WA: Unpublished Report To Healthway.
Onyx J and Bullen P. (1997) Measuring Social Capital in Five Communities in NSW: An Analysis.Sydney: Centre for Community Organisations and Management.
Zubrick SR, Silburn SR, Garton A, Burton P, Dalby R Carlton, J, Shepherd C, and Lawrence D. (1995)Western Australian Child Health Survey: Developing Health and Well-being in the Nineties. Perth(WA): Australian Bureau of Statistics and the Institute for Child Health Research. ABS Catalogue No.4303.5.
Silburn SR, Zubrick SR, Garton AF, Burton P, Dalby R, Carlton J, Shepherd C, and Lawrence D.(1996) Western Australian Child Health Survey: Family and Community Health. Perth: AustralianBureau of Statistics and the TVW Telethon Institute for Child Health Research. ABS Catalogue No.4304.5.
Zubrick SR, Silburn SR, Gurrin L, Teoh H, Shepherd C, Carlton J, and Lawrence D. (1997) WesternAustralian Child Health Survey: Education, Health and Competence. Perth: Australian Bureau ofStatistics and the TVW Telethon Institute for Child Health Research. ABS Catalogue No. 4305.5.
NB. If there is difficulty accessing these websites through the URL provided, use northernlight.com search engine to gain access to the website via a key word search,entering the key word/s in the title.
* Asterisk indicates key paper distributed to workshop participants prior to workshop.

APPENDIX C
Participants at the National Workshop on Indicators of Social and Family Functioning
April 12-13, 1999, Australian National UniversityState Name Address
NSW Dr Garth Alperstein Area Community Paediatrician
Central Sydney Community Health Service
Level 6 Queen Mary Building
Grose Street CAMPERDOWN 2050
NSW Mr Paul Bullen Managing Director, Management Alternatives Pty Ltd
PO Box 181 COOGEE 2034
ACT Ms Jenny Dean Assistant Director, Family & Community Statistics
Australian Bureau of Statistics
PO Box 10 BELCONNEN 2616
ACT Ms Barbara Dunlop First Assistant Statistician, Australian Bureau of Statistics
PO Box 10 BELCONNEN 26167
ACT Mr Richard Eckersley Visiting Fellow, NECPH
Australian National University CANBERRA 0200
NSW Ms Judi Geggie Assistant Director Family Action Centre
University of Newcastle University Drive CALLAGHAN 2308
ACT Ms Jacki Grau Graduate Administrative Assistant
Australian Institute Health & Welfare
GPO Box 570 CANBERRA 2601
ACT Mr Tony Greville Head, Population Health Unit
Australian Institute Health & Welfare
GPO Box 570 CANBERRA 2601
SA Dr Diana Hetzel Principal Policy Adviser (Medical)
Strategy Planning & Policy Division
Department of Human Services
PO Box 65 RUNDLE MALL 5000
ACT Mr Mike Langan Assistant Director, Health Section
Australian Bureau of Statistics
PO Box 10 BELCONNEN 2616
ACT Ms Marion McEwin Assistant Statistician, Social Branch
Australian Bureau of Statistics PO Box 10 BELCONNEN 2616
I N D I C A T O R S O F S O C I A L A N D F A M I LY F U N C T I O N I N G
6 6

6 7
I N D I C A T O R S O F S O C I A L A N D F A M I LY F U N C T I O N I N G
ACT Mr Paul Meyer Senior Analyst, Australian Institute Health & Welfare
GPO Box 570 CANBERRA 2601
VIC Ms Penny Mitchell Research Fellow attached to National Youth Suicide Prevention Communication Project
Australian Institute of Family Studies
300 Queen Street MELBOURNE 3000
ACT Ms Lynelle Moon Senior Analyst, Australian Institute Health & Welfare
GPO Box 570 CANBERRA 2601
ACT Ms Helen Moyle Head, Child & Family Services Unit
Australian Institute of Health and Welfare
GPO Box 570 CANBERRA CITY 2601
QLD Professor Jake Najman Head, Dept Anthropology & Sociology
University of QUEENSLAND 4072
NSW Dr Victor Nossar Service Director Department Community Paediatrics
PMBag 17 LIVERPOOL 2170
QLD Professor Brian Oldenburg Head of School of Public Health
Queensland University of Technology
Victoria Park Road, KELVIN GROVE 4059
NSW Ms Mary Osborn Project Officer, NSW Women’s Health Policy
NSW Health, Locked Bag 961 NORTH SYDNEY 2059
ACT Ms Valerie Pearson Research Officer, Family & community Statistics, Australian
Bureau of Statistics PO Box 10 BELCONNEN 2616
ACT Ms Judy Putt Project Officer, National Crime Prevention
Attorney General’s Dept Robert Garran Offices
National Circuit, CANBERRA 2600
ACT Dr Bryan Rogers Fellow, Psychiatric Epidemiology Research Centre
Australian National University, CANBERRA 0200
WA Dr Ian Rouse 31 Saw Drive
(Workshop Facilitator) DARLINGTON 6070
NSW Mr Peter Sainsbury Director, Division Population Health
Central Sydney Area Health Service
Level 6 Queen Mary Building
Grose Street CAMPERDOWN 2050
VIC Professor Peter Saunders Research Manager, Australian Institute of Family Studies
300 Queen Street MELBOURNE 3000
ACT Ms Suzy Saw Department of Health & Aged Care
GPO Box 9848 (MDP 19) CANBERRA 2601

SA Assoc Prof Michael Sawyer Director, Research & Evaluation Unit
Women’s & Children’s Hospital
72 King William Rd NTH ADELAIDE 5006
WA Mr Sven Silburn Senior Clinical Lecturer
Division Psychosocial Research
TVW Telethon Institute for Child Health Research
PO Box 855 WEST PERTH 6872
ACT Ms Alison Stanford Director, Child Abuse Prevention & Family Support
Family Relationships Branch
Department of Family & Community Services
MDP 69 GPO Box 9848, CANBERRA 2601
VIC Dr John Toumbourou Senior Lecturer, Centre for Adolescent Health
William Buckland House
2 Gatehouse Rd, PARKVILLE 3052
NSW Professor Graham Vimpani Area Director, Child Adolescent & Family Health Services
University of Newcastle
Locked Bag 1014 WALLSEND 2287
NSW Dr Don Weatherburn Director Bureau of Crime Statistics & Research
Level 8, 111 Elizabeth Street SYDNEY 2000
NSW Ms Barbara Wellesley National Director ‘Good Beginnings’ National Parenting Project
Suite 32 8-24 Kippax St SURREY HILLS 2010
QLD Dr Neil Wigg Director Community Child Health Service
184 St Paul’s Terrace FORTITUDE VALLEY 4006
VIC Ms Sarah Wise Research Fellow, Australian Institute of Family Studies
300 Queen Street MELBOURNE 3000
WA Ms Anwen Williams Senior Research Officer
Division Psychosocial Research
TVW Telethon Institute for Child Health Research
PO Box 855 WEST PERTH 6872
ACT Ms Elvie Yates Director Family & Community Statistics
Australian Bureau of Statistics PO Box 10 BELCONNEN 2616
NSW Dr Lis Young Child Health Medical Officer
SouthWestern Sydney Health Service
Suite 9, 67 Jacaranda Avenue BRADBURY 2560
WA Assoc Prof Stephen Zubrick Head Division Psychosocial Research
TVW Telethon Institute for Child Health Research
PO Box 855 WEST PERTH 6872
I N D I C A T O R S O F S O C I A L A N D F A M I LY F U N C T I O N I N G
6 8

Indicators of Social and Family Functioning
FaCS245.0008