Embed Size (px)
Citation preview

Indicators of Management Capability: Developing a Framework Penny Tamkin, Jim Hillage, Rebecca Willison, The Institute for Employment Studies

© Crown Copyright ISBN 1-903696-12-7
Published by: COUNCIL FOR EXCELLENCE IN MANAGEMENT AND LEADERSHIP 211 Piccadilly LONDON W1J 9HF
Tel. + 44 (0) 207 830 9780 Fax + 44 (0) 207 830 9781 http://www.managementandleadershipcouncil.org
This report was prepared for the Council by The Institute for Employment Studies. The report informed the measurement work of the Council and has been instrumental in their recommendation for a national framework of indicators of the UK’s management and leadership capability to be set up.
iii
Contents
Contents iii
Executive Summary v
Stages in the model vi Conclusions and next steps viii
1. Introduction 1
2. The Framework 4
2.1 The original framework 4 2.2 Importance of management skills 5 2.3 Revising the framework 6 2.4 Links in a chain 9 2.5 The framework 9 2.6 The indicators 14
3. Development of Capability 21
3.1 The stock and flow of managers 21 3.2 Education and qualifications 23 3.3 Ongoing formal and informal training and
development 27 3.4 Experience 35
4. Managerial Capability 36
5. Management Practice 38
5.1 High level work practices 38 5.2 Quality 40
6. Organisational Outcomes 42
6.1 Business activity 42 6.2 Corporate performance 43 6.3 Conclusions 47
7. Individual Outcomes 49
7.1 Pay levels 50 7.2 Promotions and job change 52

iv
7.3 Employment experience 53
8. Conclusions 56
8.1 Theoretical underpinning 57 8.2 The data collected 57 8.3 Conclusions from the data 67
9. Notes on CEML data 70
9.1 Presentation of the data 70 9.2 Data used 71
10. References 75

v
Executive Summary
The Council for Excellence in Management and Leadership (CEML) has asked the Institute for Employment Studies (IES) to help develop a scheme of national performance indicators to do with the development and utilisation of management and leadership capability, and the performance benefits arising from its application. The framework is designed to: draw public attention to the issue of management and leadership capability within the UK and to inform the review and development of policy.
In developing this framework of indicators, the Institute has reviewed a previous framework which focused on management development rather than management capability. We have developed a model of management capability that helps inform the framework and suggest possible indicators. We present this model and discuss some of the linkages between the various stages of the model and some of the other factors that may have an effect.
The framework starts before capability itself by identifying those factors that help develop capability. We have also looked at how capability might be expressed in activities at work and in corporate performance measures of various kinds. The model could be seen to represent a chain of impact that links management capability to business performance and other outcome measures and we present the data in various distinct stages along this chain:
l Indicators of the development of management capability ie education and qualifications, experience, ongoing formal and informal training and development and the management environment.
l Indicators of management capability itself ie management knowledge, skills and aptitudes.
l Indicators of the application of capability to management practice ie HRM and high level work practices, quality processes, research and development, market promotion etc.
l Indicators of business activity and outcome ie spend on innovation, patenting activity, customer and employee satisfaction, productivity, profitability and shareholder value.

vi
l Indicators of individual benefit such as lower rates of unemployment, higher salary, promotions and improved employment.
Having developed a model that focuses on the central measure of management capability, but which also examines how capability may be developed and how capability might be expressed in utilisation, we have identified a number of indicators ie available data sources that might shed some light on the various parts of the model. A range of national data sets have been reviewed with the purpose of identifying appropriate measures which have been evaluated against some key criteria:
l Relevant — throw at least some light on management capability.
l Repetitive — for trends to be tracked the data needed to be collected on a regular basis and preferably annually.
l Comprehensive — ie refer to or be representative of managers in the UK (or at least most of it), rather than just a sub-set.
l Compatible — in terms of coverage, dates etc. so as to sit comfortably alongside other sources in a single framework.
l Cost-effective — which basically means readily available from existing data sources (although there may be some scope for extending those data sources in the future through additional questions).
Stages in the model
We go on to present the results of our analysis of available data under each of our main stages in the model:
Development of capability
The data show that the educational level of managers is rising although there is some evidence that the best graduates may not be attracted to business and management studies. In contrast, the rates of formal and informal training and development are decreasing in frequency and in duration. This decline is predominately at the middle range ie more than a few days and less that two weeks of training. Longer training and development appears to be holding steady. Data on kinds of training indicate that less training is delivered off the job.
Organisational data sources are more optimistic but are less robust. Various surveys indicate that organisations continue to feel that management development remains a high and increasing priority.

vii
Capability
Measures of capability are very few and we were limited to data contained within the DfES’ Employers Skills Survey which has two measures of interest. The first is an indicator of the relative difficulty in filling managerial jobs. The number of hard-to-fill managerial vacancies as a proportion of all managers is much less than the proportion of all hard-to-fill vacancies as a proportion of all employment. This would indicate that there is relatively little problem with the labour market supply of managers.
The second measure is of internal skills gaps ie the frequency with which the existing managerial workforce is judged to be deficient in skills. These were slightly more common than recruitment difficulties. Six per cent of employers thought that a significant proportions of their managers had a skills gap. The most commonly identified skill gaps were in management skills followed by communication skills and team working.
Management practice
We might expect better management to be expressed in better management practice ie more employees being appraised, more and better training of employees, better communication and employee involvement systems etc.
Unfortunately we could identify very few data sources that met our original data evaluation criteria, and many which were of interest ie WERS are infrequently repeated. We present relevant data from these surveys but there is no trend data available.
Other reviewed data concentrates on the prevalence of quality standards. These are becoming steadily more common with IiP being the most popular. Others such as ISO and the EFQM are also rising but from a very low base.
The overall picture is of limited information on management practice but with improving levels of quality standards.
Organisational outcomes
We look at both measures of organisational activity, ie innovation activity and patents lodged, and measures of outcome from the perspective of customers, employees and the organisation.
Innovation data is now available from the DTI Innovation Survey but this is a new survey and trend data has not yet been acquired. Patent registrations in the UK are down in recent years.
Outcome data were not available for customers of for employees, but data on productivity shows the UK has steadily narrowed the productivity gap with the rest of out competitors.

viii
Individual outcomes
All other things being equal, it might be expected that better managers would have more successful careers than poorer ones. We discuss the difficulties of proving this relationship and review the data which implies that the most educated and qualified managers are indeed those who earn more on average and who experience lower periods of unemployment. Limited data also implies more positive job moves for the most educated managers.
Conclusions and next steps
We have looked at three questions in assessing the value of the framework:
l Is the framework a good idea?
l Does it meet its original purpose?
l If not, could it and in what circumstances?
We view the framework as having usefully focused attention on the capability of managers and providing more robust evidence to support or refute concerns over the UK’s position compared to other countries. The evidence collected however, provides a very mixed picture of management capability. Some of the indicators are showing signs of improvement, others are declining and many are not as comprehensive as we would like. We conclude that better quality information needs to be gathered for the model to be truly tested.
We suggest a comprehensive literature review to evidence the linkages implicit in our model and a review of our suggested indicators in the light of this review. We also feel that there are a number of potentially relevant surveys that could be amended slightly or funded more frequently, that could provide useful information on management capability. There are also a number of surveys that allow the potential for multidimensional analysis of the interplay of factors, and the unique respondent identifier in government sponsored organisational surveys also provides the potential for more complex analysis of the relationship between organisational factors and outcomes. We also recommend that consideration be given to funding a new management survey or of creating distinct elements to existing surveys to gather the information we need more coherently.

Indicators of Management Capability: Developing a Framework 1
1. Introduction
We live in a global, highly competitive and rapidly changing world. A world in which national competitiveness is the key to national prosperity and the focus of much policy and research effort. There are an enormous number of influences on competitiveness, some are outside our control but many are well within our sphere of influence. Amongst those we can affect are all those factors that contribute to how well people work and how their contribution is utilised. Managers obviously play a key leadership role in maximising and delivering individual and organisational performance. Yet, management capability has been of concern within the UK. The Competitiveness Indicators report (DTI, 2001) suggests that UK management under-performs in relation to some of our key competitors. Their conclusion is that UK managers are under-qualified, have inadequate levels of training and development and are perceived to be less competent on a range of factors that their US, German and Japanese counterparts.
In response to such concerns the Government has established the Council for Excellence in Management and Leadership (CEML) to look broadly at how the ability and performance of UK managers can be raised. CEML has identified that at a basic level, one of the difficulties in improving capability is an absence of any rigorous data on current levels of capability. The Institute for Employment Studies (IES) was commissioned to draw on existing data sources to create a scheme of national measures, statistics and performance indicators covering the development and utilisation of management and leadership capability in the UK and the performance benefits arising from its application.
The framework was initially intended to provide the basis for three separate activities:
1. Attracting public attention to the issue of management leadership capacity in the UK and allowing the identification of trends over time through the annual publication of a small number of performance indicators.
2. Informing the review and development of policy through a wider set of indicators.

The Institute for Employment Studies 2
3. Facilitating the development of theories and models aimed at improving management and leadership capacity and utilisation by providing a reference point for serious research.
The study builds on previous work by IES (Tamkin and Hillage, 1997) which developed a framework of information on the volume, nature and impact of management development undertaken in the UK. This review is both broader in scope in terms of the interest in ‘management capability’ rather than management development and has a greater clarity of purpose. As a result this study explores a much wider range of data.
In trying to create a framework of potential indicators, we have attempted to explore data that meets certain key criteria:
l Relevant — throw at least some light on management capability.
l Repetitive — for trends to be tracked the data needed to be collected on a regular basis and preferably annually.
l Comprehensive — ie refer to or be representative of managers in the UK (or at least most of it), rather than just a sub-set.
l Compatible — in terms of coverage, dates etc. so as to sit comfortably alongside other sources in a single framework.
l Cost-effective — which basically means readily available from existing data sources (although there may be some scope for extending those data sources in the future, through additional questions).
In developing this framework we have looked carefully at the requirements of CEML, our previous work and how that might help, and current knowledge and understanding of management capability. We began by reviewing the original framework in the light of the changed requirements and prevailing data sources.
The original framework focused on measuring management development activity and effectiveness and so although of relevance, it did not cover all areas of interest to this study. We reviewed this original framework to reflect measures of management capability, supported by exploring the literature on measuring the capability of managers and how this links with business performance measures. This literature was gathered and reviewed by The Institute for Employment Research (IER) for a related project commissioned by DTI (ref). Using the revised framework we have identified the most appropriate data sources and gathered a range of indicators going back to 1995 (where possible) to create time series data.
The concept of the framework and potential data sources have been discussed with a range of interviewees (eg from the DTI, Institute of Management and CBI) and presented and debated at two seminars (Sandhurst 2001, DTI 2001).

Indicators of Management Capability: Developing a Framework 3
In this report we begin by presenting and explaining the new framework that serves as the model for exploring a range of potential indicators. We then go on to present the data, for ease of presentation these data are reported against the key stages in the model:
l Indicators of the development of management capability ie education and qualifications, experience and ongoing formal and informal training and development.
l Indicators of management capability itself ie management knowledge, skills and aptitudes.
l Indicators of the application of capability to management practice ie HRM and high level work practices, quality processes, research and development, market promotion etc.
l Indicators of business activity and outcome ie spend on innovation, patenting activity, customer and employee satisfaction, productivity, profitability and shareholder value.
l Indicators of individual benefit such as lower rates of unemployment, higher salary, promotions and improved employment.
In each of these sections we discuss the quality of the indicators used and our assessment of UK performance under each. It is worth highlighting that the task of measuring and monitoring the capability of UK managers is not an easy one. Important measurements, including the central one of management capability, are inherently difficult to make. They, like all measures of human ability and behaviour are much less tangible than physical assets.
Finally we present an overview of the framework and suggestions for its development and maintenance.

The Institute for Employment Studies 4
2. The Framework
The direct measurement of management capability is fraught with difficulty even at an individual level. In looking for robust national data it is even more difficult. In recognition of this, it is important to develop a model that captures not only the core area of capability but also looks at other metrics that may reflect on the development of capability, or be an indicator of capability in action. We applied a similar approach to the earlier development of the framework to measure management development activity and impact.
2.1 The original framework
Tamkin and Hillage (1997) set out a framework which focused on the incidence and impact of management development (see Table 2.1). It distinguished between indicators derived from data sources which measured the activity of individuals and those which measured the activities of organisations. It also drew a distinction between measurements of:
l Inputs — ie actions that demonstrate commitment to, intention to participate in, or actual participation in, management development activity. The indicators selected revolved around the willingness to commit resources and devote time to management development activity.
l Process — commitment on its own is obviously not enough to secure development unless it is accompanied by relevant learning activities. The interest here was in the nature of the development activities (eg whether they take place on or off the job) and whether they led to qualifications for instance.
l Outputs — ie the immediate result of effective training and development activity in terms of better trained and more competent managers. However relevant indicators were few and far between and we had to rely on qualifications — eg number of relevant qualifications gained at an individual level and proportion of ‘qualified’ managers at a corporate level.
l Outcomes — ie the impact of good quality development and training should be seen in better performance at an individual and corporate level. Again there was an absence of good data, but we looked at salary growth, as a proxy for performance, as

Indicators of Management Capability: Developing a Framework 5
well as an indicator of the benefits of training (a link demonstrated in the literature). At an organisational level we identified indicators relating to productivity, as well as managers perceptions of the benefits of management development.
The four columns reflected different points on a chain of impact between the input of development and the outcome of improved management performance.
2.2 Importance of management skills
The importance of skill acquisition is increasingly well documented. The latest national skills assessment (Campbell, 2001) demonstrates that the demand for skills is increasing across the board. Management skills are one of the key ‘hotspots’. Jobs in management occupations are growing rapidly and an increasing number of other employees are undertaking a range of management tasks. This raises a key point for the focus of the framework. A distinction can be drawn between management skills and the skills of managers. The former refers to elements of managerial capability which might be required by people in a range of occupations. The latter refers to the competencies required by people in predominantly management occupations. Both the jobs and their skill content may be different.
For the purposes of this framework we have focussed on managerial jobs, primarily because the da ta sources on which we will draw are much stronger on managers as an occupational group than management as a skill set. We acknowledge however, that the resultant picture is incomplete and future iterations of the
Table 2.1: The original framework for management development performance indicators
Inputs (resources)
Processes (activities)
Outputs (results)
Outcomes (benefits)
Individuals (ie Managers)
Payment of fees
Involvement in training
Time spent on training
Nature of development: on/off the job certifiable
Qualifications Salary progression
Job satisfaction
Corporate Money committed
Volume of training
Organisational commitment: plans budget purpose
Needs assessment
Method of development
Use of standards
Trained Managers Perceptions of benefits
Organisational performance
Source: IES 1997

The Institute for Employment Studies 6
framework should strive to focus on management skills wherever possible.
2.3 Revising the framework
In considering how to present data on management capability we applied the same philosophy, ie to also look at the antecedents to capability and the impact they might have and to see what measures exist. There are however, some key differences between the approach of the previous project and this one. Whereas management development is a process with inputs, throughputs and outputs, management capability could be seen as a particular state, the outcome of a given set of inputs with the potential to achieve and/or be realised in a set of outputs and outcomes.
In reviewing the framework we identified and considered a number of alternative models which chart the impact of management development (eg DTZ Pieda, 1998). We also examined alternative sets of policy indicators, eg the National Learning Targets and the DTI’s competitive indicators (DTI, 2001). Furthermore, we have debated the model and discussed it in some depth with IER who have undertaken a literature review of evidence that relates to the framework and to the impact of management capability more generally (Bosworth and Wilson, 2002). On the basis of these inputs we have developed an alternative way of presenting the framework, as set out in Figure 2.2.
At the centre of the model is management capability, measured by the skill levels of managers. On the left are the factors that might be expected to contribute to the development of capability eg ‘inputs’ in terms of the experience of education and workplace training and development activity, the investment that organisations put into the training and development of their managers, and the environment within which managers operate. On the right are the outcomes of capability ie the ‘benefits’ for the individual (eg as measured by salary and job satisfaction) and their organisations (eg as measured by the prevalence of effective management practices), leading to improvements in corporate activity and performance (eg productivity).
The model is not uncontentious and there are a range of other factors which exert influence on both sides of the figure and which need to be taken into account in any study of the relationships underpinning the elements of the framework. These include:
l the economic, social and judicial context within which managers work
l the dynamics inherent in the model
l the importance of considering quality not just quantity of, for example, inputs

Indicators of Management Capability: Developing a Framework 7
l mediating factors that influence the relationship between the elements
l unclear boundaries with regard to where certain indicators might best sit
l feedback loops between parts of the model.
Context
It has been pointed out (Bosworth and Wilson, 2002) that the context within which management operates is very influential. This context includes the culture and systems of governance of organisations and at a broader level, the factors that constitute the legal, economic and social systems of economies and the educational traditions and infrastructure.
Dynamics
Another important factor is the dynamics inherent in the model and the environment within which it operates. One of the first of these is to set any model and data on management capability within a system model which takes into account the entry into management and the flows within and out of it. Measures especially of development activity and qualification levels, and relative measures of skill levels, need to be set within the context of the total management population and its flows. This enables decisions to be made on the size of any problem, the degree to which progress is being made and the actions that still need to be taken which are impossible within a static model or one where there is no sense of proportionality. Increases in the numbers of qualified managers is not necessarily good news if the total population of managers is increasing faster. CEML have produced a report on the stock and flow of UK managers (Williams, 2001) which helps place the understanding of relative capability in context.
Quality
There is also an issue of responding to quality on the input side of the model. Management development and training and management experience, are all concepts with quality dimensions that will affect the impact they subsequently have on management capability. These quality dimensions are however very difficult to measure and therefore tend to be ignored in any metric, which tend to focus merely on quantitative activity.
Mediating factors
On the impact side of the model there are also factors that may mediate the impact of one box on the next, for example the effect of management capability on management practice will be

The Institute for Employment Studies 8
affected by the organisation’s strategies and goals. Similarly the links between business activities and business outcomes will be mediated by the strategic choices made by the organisation and its ability to co-ordinate activities appropriately and to manage risk. These are all factors that are very difficult to measure meaningfully.
Boundaries
Some of the boundaries between the boxes are unclear. For instance we have debated whether management qualifications should be considered a demonstration of management capability or a quality indicator of educational achievement, ie more a confirmation that a certain level of knowledge has been gained which may or may not be applied in practice (and therefore be associated with higher skill levels).
IER for instance have placed management rules within their box of management capabilities reasoning that such rules may have considerable impact on capability. We have moved it outside of the box preferring the clarity of focusing on individual skill, knowledge and aptitude. We treat management rules as an input, one of those factors that may help develop capability or facilitate its expression. However, this is a debatable point.
Feedback loops
Finally there are some aspects of the model that may act as feedback loops. A result of better management may be the operation of certain management practices ie the adoption of appraisal systems, quality processes, higher level work practices which may either act directly as learning experiences or in themselves influence the development of or the rules of the enterprise that can themselves influence capability.
2.3.1 The value of the model
Despite these concerns, we present the model as the basis for setting out the indicators. It should be considered as a simplification of the process for the purpose of identifying data that already exists and that which might be easily collected that might throw some light on aggregate management capability in the UK. The model is helpful in that it:
l is centred on management capability
l captures the key factors that are likely to influence management capability
l highlights the main range of benefits from improved capability.

Indicators of Management Capability: Developing a Framework 9
2.4 Links in a chain
At the heart of the framework is the assumption that there is a relationship between managerial capability and the training and development that managers receive, both within formal education, eg through business school courses, and through more informal training or development. On the other side of the framework is the assumption that improved capability results in improved individual performance leading to better organisational benefits. Thus the framework could contain a range of indicators which not only seek to measure ‘managerial capability’ itself, but also the factors which may influence it and the benefits which could flow from it.
It was not the purpose of this study to review the literature on the links between training, skills and performance, although in the search for relevant indicators we did encounter a growing body of evidence that seeks to demonstrate the chain of impact. At an individual level, there is a positive relationship between education level and wage levels and also between training and wages (Campbell, 2001). Furthermore Dearden et al. (2000) show that higher levels of training are positively associated with improved productivity. Other studies also link a range of management practices, eg covering the management of people, with positive business performance (eg Richardson and Thompson, 1999). The focus of the IER review (Bosworth and Wilson, 2002) is on measurement, rather than on the evidence that supports the links in the chain. However they do refer to various examples of research that suggest that individual HR initiatives have resulted in improved individual or organisational performance (eg Bartel, 1995; Bishop, 1994; Ichniowski et al., 1997; Mendelsson and Pillai, 1999). IES has undertaken research to demonstrate the link between management skill, employee satisfaction, customer satisfaction, customer loyalty and turnover (Barber, Bevan, and Hayday, 1999).
We found few studies which focused on management skills and capability and this may be an area that warrants at least a more comprehensive review, if not further empirical research.
2.5 The framework
The framework can be interpreted as a flow of causality from left to right, notwithstanding all the provisos we have previously discussed regarding other influences. This has the advantage of having high face validity ie it would seem logical for better management to result in better individual and organisational performance, and for management skills to be capable of development. Empirical support for the model is however patchy as we have seen, and CEML or its successor, might wish to

The Institute for Employment Studies 10
Figure 2.2: Framework for the Measurement of Management Capability
Source: IES 2002
Management rules and other environmental
factors
Education and
qualifications
Experience
Ongoing formal and
informal training and development
Management
Capability
(knowledge, skills, aptitudes)
Stock of UK Managers
Wastage Recruits
Management practice
(HRM, HRD quality,
management of innovation, R&D
Business Impact Business activity Business Outcome
l innovation l customer satisfaction l products l productivity l profit l shareholder value l employee satisfaction
Individual Impact
l salary
l promotions
l better jobs

Indicators of Management Capacity: Developing a Framework 11
concentrate on filling some of these gaps through case study or other research.
2.5.1 Developing capability
The framework begins with an explicit focus on the management population. Data on management numbers and information on the flows into and out of the management population provides the context within which the rest of the data can be interpreted. In our model, the numbers are shown as providing the context for the measures of management capability and its development because:
1. The number of managers may, in gross terms, affect the national ‘managerial and leadership capacity’, on the assumption that the more there are the greater the capacity to manage – although such a measure may be criticised as it does not focus on the quality of management.
2. The second reason is that the rest of the framework needs a base, eg the proportion of managers who receive development or management education or who are qualified to a certain level etc. The number qualified on its own tells us relatively little. Changes in the proportions could be a result of changes in either side of the equation (ie more or fewer managers or an increase or decrease in the number of qualifications held). The stock of managers therefore provides a useful context for the rest of the indicators.
On the left hand side of the model are those factors judged to be inputs to management capability. We have highlighted four different inputs:
l Education and qualifications
l Ongoing training and development
l Experience
l Management rules and systems.
Education and qualifications
The educational background and formal qualifications of managers has been subject to scrutiny in the literature because of the realisation that managers in the UK tend to be less well qualified than those of our competitors. It should be noted that we have treated qualifications as an indication of educational level and attainment and therefore as an input to capability rather than as a proxy for capability per se. In their literature review IER (Bosworth and Wilson, 2002) place qualifications as a measure of capability.
These qualifications may be in management related subjects or they may be unrelated, we have tried to gather data on both

The Institute for Employment Studies 12
educational attainment ie highest level qualification and on management related qualifications.
Ongoing training and development
Closely related to this first input is that on ongoing training and development. This may well include study for qualifications that, once attained, will form part of the data on education and qualification levels, but will also include much shorter periods of training and development. This would include both formal, off the job and informal on-the-job, training and development. The latter is of increasing importance with the growth of e-learning and other technologies that may deliver learning to the desktop in small, relatively quickly digested packages, and the increasing integration of development within the workplace. It is important to capture data on the incidence of training ie the frequency with which managers attend events and the duration of each training event. We would also seek to understand as much as possible the kind of training and development being undertaken and the means by which it is delivered. Whether training is likely to lead to a qualification might be an indicator of its rigour and hence quality.
Experience
Undoubtedly, managers also develop their skills and capabilities in much less formal ways than through explicit education, training or development. Various qualitative studies have shown that learning through job challenge or role models can be a key element in changing management behaviour. IER (Bosworth and Wilson, 2001) have suggested that tenure in relevant posts or experience of working in successful organisations, may all form part of this development through experience. We have included this in the model although we suspect that there will be little existing relevant data.
Management rules and systems
Finally we seek to recognise the impact of management rules built into organisational structures as being another means by which managers’ behaviour and hence capability can be influenced and developed. IER have included this within the concept of management capability but we prefer to consider it as an influence on capability rather than an element of capability itself. Whilst explicitly recognising the influence in the model, we also anticipate that there will be relatively little data.
2.5.2 Capability
At the centre of the model is the key measure of management capability. We have taken capability to mean the skills, knowledge

Indicators of Management Capacity: Developing a Framework 13
and aptitudes of managers of relevance to the management role. Whilst being at the centre of the framework, the measurement of capability poses many problems.
There are for instance, many different ways of articulating capability. At a fundamental level there has been debate around the differences between management and leadership skills with the emphasis of management being on the present and dealing with the day to day, whereas leadership focuses on the future and developing vision and strategy to move the organisation forward. For the purposes of this framework, we do not differentiate between them. There are also other differences in the definition of capability, some have sought to define the key clusters of management competence (eg Cheetham and Chivers, 1996) and others have suggested a number of behavioural dimensions with good management determined by positioning behaviour along these dimensions (eg Winterton, 2001).
If definition is a problem, measurement will inevitably be difficult too, and there are very few existing readily available measures of capability. We present some data that maps onto this element of the framework but feel that this is an area where the data is light.
2.5.3 Impact of capability
To the right of the model are measures of the impact of management capability. We have suggested that capability is likely to affect:
l Management practices
l Organisational activity
l Organisational outcomes
l Individual outcomes.
Management practice
We have already touched on some of the literature that suggests that there are linkages between the adoption of certain ‘high level’ work practices and business performance. We might expect that the adoption of better management practice would be associated with better managers. Amongst such practices might be the adoption of quality systems such as ISO 9000, IiP or the Business Excellence Model; the implementation of HRM and HRD practices in areas such as resourcing; training; performance management and reward; research and development; and marketing activity.

The Institute for Employment Studies 14
Organisational activity
The adoption of better management practice might be expected to have an impact on organisational activity such as product innovation and launch.
Organisational outcomes
These are the bottom line measures, the outcomes on customers, employees, shareholders and the organisation itself. They include measures of customer satisfaction, retention, repeat business and loyalty; for the organisation and its shareholders, measures of productivity, profitability and market valuation; and for the employees measures of satisfaction, loyalty, commitment and retention.
Individual outcomes
It might also be expected that better managers will tend to do better than their less able peers in terms of securing better jobs and rewards. These should be visible in terms of comparative pay, promotion experiences, and the incidence and duration of unemployment.
2.6 The indicators
Having established the overall framework, we have searched for appropriate indicators which are presented in detail in the next chapter. In developing our indicators we are obviously constrained by the availability of data and the application of our criteria covered in chapter one, ie that the indicators are:
l Relevant — throw at least some light on management capability.
l Repetitive — for trends to be tracked the data needed to be collected on a regular basis and preferably annually.
l Comprehensive — ie refer to or be representative of managers in the UK (or at least most of it), rather than just a sub-set.
l Compatible — in terms of coverage, dates etc. so as to sit comfortably alongside other sources in a single framework.
l Cost-effective — which basically means readily available from existing data sources (although there may be some scope for extending those data sources in the future, through additional questions).
Taking these considerations into account (and based on our trawl through the data sources) we have identified the following range of indicators for each of the boxes in Figure 2.2. The indicators we have used are summarised in Table 2.2.

Indicators of Management Capacity: Developing a Framework 15
2.6.1 Number of managers
The number of managers is important for establishing a base for the other indicators in the framework and to root the framework in an understanding of the size of the stock. It is difficult to establish an accurate measure for the number of managers in the UK, or its constituent countries. Williams (2001) estimates the number to be around four to 4.5 million, although depending on the definitions used, estimates range from 2.5 to six million. Despite the difficulties at arriving at a definitive figure, it would be illuminating to include some measure of the number of managers in the framework, to provide an element of context. We have also sought data on the flows ie on the recruitment of new managers and the wastage of managers through retirement or job change.
2.6.2 Management education
Management capability it likely to be at least in part a function of managers’ knowledge and experience (both in general terms and relating specifically to management education). Therefore in this section there are indicators of management education as measured by data on the highest qualification level held by people in the management occupational group available from the Labour force Survey (LFS) and the British Household Panel Survey (BHPS). We also have data on qualifications awarded from HES, FEFC, Association of MBAs, and QCA.
2.6.3 Management development activity
There are a range of possible indicators which could throw some light on the training and development of managers. They can be divided between those referring to individuals and those based on organisational activity.
Individual-based indicators — include the number of managers engaged in recent training activity. Information could be collected on the amount of training (ie time-spent), its form (in terms of off or on-the-job, use of distance learning etc.) and who pays the cost. The extent to which individuals pay for their own management education could be seen as an indicator of their commitment. Ideally we would like to get some data on the quality of training and to be able to measure the extent that managers participate in informal learning activities such as mentoring or coaching. Data sources explored are the LFS, BHPS, and WERS.
Another set of measures includes current participation in management education courses within higher education, or other business school courses. Data sources include the UCAS, CEL Graduate Tracking Survey, HESA and FEFC data.

The Institute for Employment Studies 16
Organisational-based indicators — here we look to identify the commitment organisations attach to management development through, for example, the existence of a management development policy or budget and the amount of money devoted to management development activity. However such indicators are not without their problems. The existence of a management development policy, could also be seen as an aspect of good management practice (ie sit within another box in the framework). The existence of a management development budget might also tell us more about the formality of the management practices in an organisation rather than their interest in developing managers. On balance we have chosen to consider such indicators as part of the development of capability, ie as a demonstration of organisational commitment, but this may be a point worthy of further discussion. Data sources include CIPD training survey, Thomson, Mabey et al. (1997 and 2000) and the DfES Learning and Training at work survey.
Other inputs suggested by the model and for which we explore data, include measures of managerial experience and aspects of the organisational environment such as management rules. We have not, to date, identified any reasonable measures of such activity.
2.6.4 Management skill levels
Skill levels could either be self-assessed, although this is unlikely to be done in any objective fashion, it could be illuminating. On the other hand skill levels could be assessed by employers (although in small organisations this could be the same as the previous measurement). An objective way to assess skill levels is to apply some form of objective test, but this is largely unfeasible. Qualification levels provide a degree of objectivity but will not necessarily pick up management skills as opposed to general skill and knowledge, nor do they address the application of the skills and knowledge gained. As we have already discussed we treat qualifications as a measure of educational attainment rather than management capability per se.
Indicators at this point in the model are likely to be based more on perceptions than objective assessment — the more rounded or objective the basis of the perception, the stronger the quality of the data supporting the indicator. Furthermore it would be more interesting if we could identify separate aspects of management (eg distinguishing between strategic capability, financial management, people management etc.) as well as generating an overall assessment of management capability. The data we have used centre on the DfES’ Employers Skills Survey and WERS employee survey, but in each case the research instruments were not designed for the purpose to which we are putting them and so the data are not as centrally relevant as we would like.
Indicators of Management Capacity: Developing a Framework 17
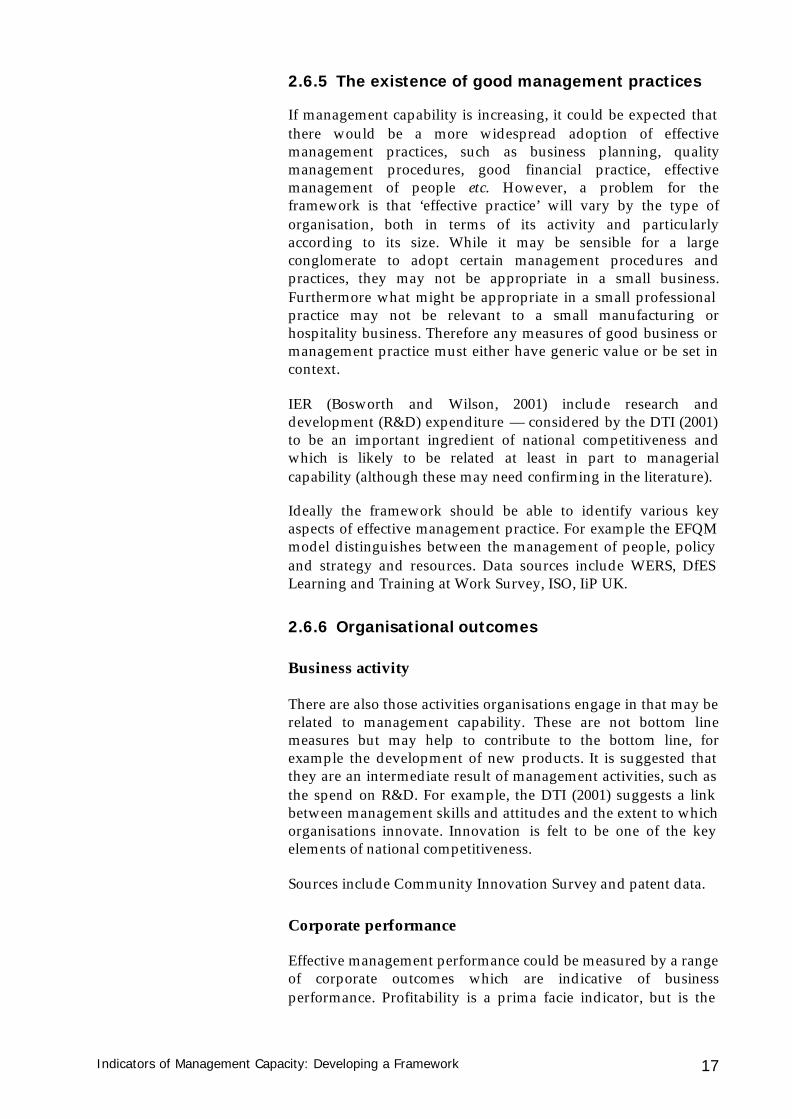
2.6.5 The existence of good management practices
If management capability is increasing, it could be expected that there would be a more widespread adoption of effective management practices, such as business planning, quality management procedures, good financial practice, effective management of people etc. However, a problem for the framework is that ‘effective practice’ will vary by the type of organisation, both in terms of its activity and particularly according to its size. While it may be sensible for a large conglomerate to adopt certain management procedures and practices, they may not be appropriate in a small business. Furthermore what might be appropriate in a small professional practice may not be relevant to a small manufacturing or hospitality business. Therefore any measures of good business or management practice must either have generic value or be set in context.
IER (Bosworth and Wilson, 2001) include research and development (R&D) expenditure — considered by the DTI (2001) to be an important ingredient of national competitiveness and which is likely to be related at least in part to managerial capability (although these may need confirming in the literature).
Ideally the framework should be able to identify various key aspects of effective management practice. For example the EFQM model distinguishes between the management of people, policy and strategy and resources. Data sources include WERS, DfES Learning and Training at Work Survey, ISO, IiP UK.
2.6.6 Organisational outcomes
Business activity
There are also those activities organisations engage in that may be related to management capability. These are not bottom line measures but may help to contribute to the bottom line, for example the development of new products. It is suggested that they are an intermediate result of management activities, such as the spend on R&D. For example, the DTI (2001) suggests a link between management skills and attitudes and the extent to which organisations innovate. Innovation is felt to be one of the key elements of national competitiveness.
Sources include Community Innovation Survey and patent data.
Corporate performance
Effective management performance could be measured by a range of corporate outcomes which are indicative of business performance. Profitability is a prima facie indicator, but is the

The Institute for Employment Studies 18
function of a wide range of factors, not just management capability and may be ‘too distant’ to be of relevance (Richardson and Thompson, 1999). For the purposes of this framework, the measures of corporate performance ideally should be more closely associated with managerial capability. Labour productivity may be a more relevant indicator and has featured in a number of studies examining the links between training and people performance (Dearden et al., 2000).
We have tried to identify data that provides information on outcomes for a range of stakeholders eg employee satisfaction, customer satisfaction, organisational outcomes such as productivity measures and business survival:
l Customer satisfaction — various studies (eg Barber et al., 1999) demonstrate a link between effective line management and positive business performance as demonstrated by improved customer satisfaction. We could not find data for this indicator and it may be that some form of national or generic measurement of customer satisfaction is desirable if the obvious data problems could be overcome.
l Employee satisfaction — is an intervening link in the chain from management activity to customer satisfaction. There is some data in WERS employee survey, there is also data in the LFS on employee absence rates and accidents.
l Business survival, eg as measured by the number of insolvencies from DTI.
l Productivity measures from DTI.
2.6.7 Individual outcomes
Earnings growth is often taken as an indirect measure of personal performance (see for example Dearden et al. 2000) and therefore we could use managers’ salaries as a general indicator of the impact of management capability. However such an indicator may need careful interpretation. Earnings reflect a range of factors in addition to performance, eg market scarcity, cost of living etc. Other individual outcomes include positive job moves (BHPS), incidence and length of unemployment (LFS) and the ways in which these vary by managers’ education and training backgrounds.
Data sources include LFS, WERS, MBA Career and Salary Survey.

Indicators of Management Capacity: Developing a Framework 19
Table 2.2: The framework of indicators
Management Numbers
Development of capability) Capability Management practice Outcomes (benefits)
Data and source
Stock of UK managers (LFS)
Recruitment and wastage data
Education and qualifications
Managers’ qualification levels (LFS highest qualification, where gained)
Qualifications awarded (HES, FEFC, MBA Salary and Career Survey)
Number of applicants to Business Management Courses and Acceptances (UCAS), Number of enrolments to Business and Management courses (FEFC)
Number of management NVQs awarded (QCA)
Ongoing training and development
Volume of management training and development.(LFS - training in last 3 months and last 4 weeks, time spent on training last week, length of training programme. WERS Employees - amount of training in last 12 months)
Type of training and development undertaken (LFS on or off job, WERS)
Individual’s commitment to management development (LFS who pays, MBA Salary and Careers Survey levels of employer funding)
Employer support for management
Capability
Proportion of managers fully proficient, skills missing amongst existing managers, skills missing amongst potential recruits (ESS)
Employees views of management capability (WERS)
World Competitiveness Indicators
Higher level work practices
Use of appraisal systems, quality reviews, employee involvement (WERS)
Use of formal strategic plan (WERS)
Formal and informal methods of management (Thomson and Mabey)
Levels of training of employees (DfES Learning and Training at Work – learning opportunities offered, % of employees receiving on/off job training, existence of training budget?, av. costs per employee, existence of business plan. Lloyds/TSB Small Business — priorities for off the job training, barriers to development).
Amount of training WERS
Quality
IiP - % working in IiP involved/ recognised companies (IiP UK, WERS)
Impact of IiP (CIPD survey).
Organisational activity
Innovation (DTI Community Innovation Survey - Internal and external training spend related to innovation, percentage of turnover attributable to new products, % of enterprises which are innovators. CBI Innovation survey - % of UK companies saying increased skills of staff very important outcome of innovation and lack of skills as barrier, Patents – European Patents Office)
Organisational outcome
Employee satisfaction (BHPS)
Management satisfaction (WERS)
Customer satisfaction no data
Productivity
Business survival company insolvencies (DTI)
Individual Outcome
Comparative salary growth of those participating in training & development and

The Institute for Employment Studies 20
development activity (DfEE Business Benefits of Management Development – proportion of managers covered by management development activity, CIPD Training Survey – annual training budget per head, use of coaches and mentors, use of different training methods, Thomson and Mabey et al. – the existence of management development policy, priority given, resources committed as % of payroll, days spent, success and impact of development. DfES Learning and Training at Work – % of employees receiving on/off job training, av. days per manager, types of off job training, types of qualifications training leads to, location of off the job training, methods of provision, satisfaction with off the job training)
Experience
Previous role (BHPS)
Management rules
No data
Numbers ISO 9000 recognised (ISO and WERS)
EFQM
those not (LFS)
Comparative unemployment experience of trained and/or developed managers (LFS)
Promotion information ie impressions of job move – BHPS, MBA Salary and Careers Survey

Indicators of Management Capacity: Developing a Framework 21
3. Development of Capability
The development of capability encompasses four sub themes:
l Education and qualifications
l Ongoing formal and informal training and development
l Experience
l Management rules and other environmental factors.
We have collected data against the first three of these factors which we present and discuss here. The final sub theme of management rules is in recognition of two potential influences on the expression and development of management capability: that the freedom to act within individual organisations may enhance or constrain management capability, and that the rules of the organisation may provide a positive developmental experience for managers, encouraging and ensuring the practice of positive behaviours. The measurement of such an environment would be very difficult and inevitably very subjective, and not surprisingly, we could find no existing suitable measures.
Before considering these four areas we briefly review the data on the stock and flow of managers to place the rest of the framework data in context.
3.1 The stock and flow of managers
The issues concerning the stock and flow of managers are well rehearsed elsewhere (eg Bosworth, 1999 and Williams, 2001). One of the key problems is the variety of data sources and definitions available.
On the latter we have focussed on the SOC 1 definition (ie managers and administrators) using the SOC 2000 classification where possible, although others (eg Bosworth) add in foremen and supervisors, obviously expanding the population.

The Institute for Employment Studies 22
A significant source for the data in our framework is the Labour Force Survey. This suggests that the number of managers is rising eg from 3.3 million in 1995 to 3.6 million in 2000 in Great Britain. However, over this time employment generally has also risen and the proportion of managers in the overall employed workforce has remained broadly static at around 15 per cent (see Figure 3.1). It is important to note that the 2001 data is based on the SOC 2000 definitions which result in a ten per cent reduction in the number of managers (ie around 3.2 million, some 13 per cent of the employed workforce). It is important to note that the LFS data tend to under-report the number of managers compared to other sources (Williams, 2001).
Wilson et al. forecast that the number of managers will increase slightly over the next five to ten years (mainly in the area of functional managers) and decline as a percentage of total employment, in contrast to previous forecasts of expansion. They argue that ’the reclassification of many jobs in SOC 2000 from managerial to other categories has served to moderate somewhat previous estimates of growth using SOC 1990 categories’.
Such data only refer to the stock of managers at any one time, which in turn reflects the net effect of flows into and out of managerial jobs. Wilson et al. estimate that there is a net requirement of approximately 100,000 managers a year to cope with the slight expansion in demand, flows between different jobs and retirements and mortality (ie losses to the labour force as a whole).
Finally it is important to note that these data only refer to managerial jobs. There is little quantitative data (and none we could find of relevance) on the number of people who require
Figure 3. 1: Percentage of employees who are managers or administrators
0%
2%
4%
6%
8%
10%
12%
14%
16%
1995 1996 1997 1998 1999 2000 2001
Years
Source: Labour Force Survey, Spring Quarters 1995-2001

Indicators of Management Capacity: Developing a Framework 23
and/or utilise management skills, perhaps as part of an otherwise non-managerial job.
3.1.1 Overall picture
The general picture is one of a gradually rising management population, although it is likely that more and more people are having to use management skills in their jobs (which may not be classified as managerial).
3.1.2 Managerial characteristics
We have not included data on managerial characteristics but they are available eg on gender (two-thirds of managers are male); age (as with the rest of the workforce the managerial cadre is ageing); ethnicity (with minority groups slightly under-represented but increasing as a proportion) and disability.
3.2 Education and qualifications
We have looked at three sources on the existing qualification levels of managers: the LFS which collects highest qualification level, QCA NVQ statistics on the achievement of management NVQs awarded each year, the Association of MBA’s statistics on the numbers of MBAs awarded each year.
Table 3.1: Degree classes obtained by business and management studies graduates
Academic year ending
1995 1996 1997 1998 1999 2000
Business Management (%)
First class 3.1 3.0 2.9 3.6 3.4 4.0
Upper second 40.0 41.3 40.1 40.7 40.8 40.7
Lower second 40.5 43.6 45.0 42.7 41.7 41.4
Third class/pass/unclassified 15.8 12.1 12.0 13.0 14.2 14.0
Total = n 15,497 16,995 17,667 17,323 18,666 19,100
All subjects (%)
First class 7.0 6.9 7.1 7.6 7.9 8.2
Upper second 40.3 40.9 41.1 42.3 42.4 42.9
Lower second 34.9 35.5 35.6 34.8 34.9 34.0
Third class/pass/unclassified 17.5 16.8 16.2 15.4 14.9 15.2
Total = n 237,798 251,248 255,260 258,753 263,671 265,270
Source: HESA Students in Higher Education
The Institute for Employment Studies 24
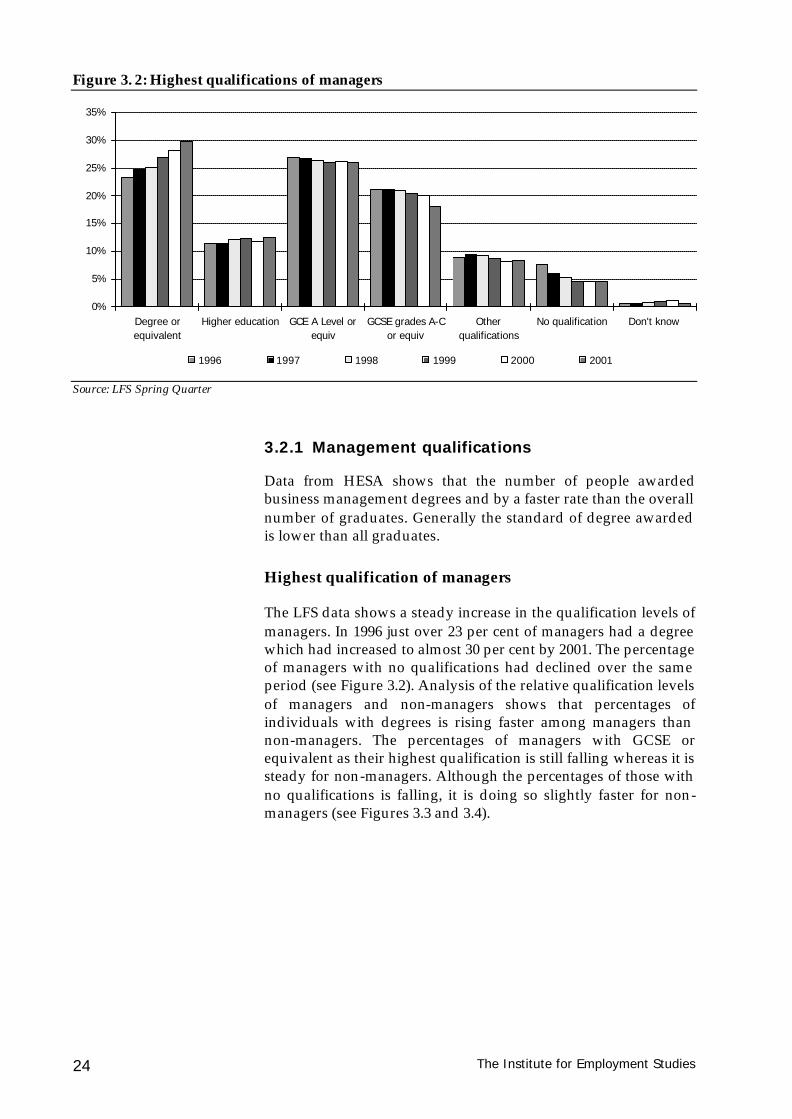
3.2.1 Management qualifications
Data from HESA shows that the number of people awarded business management degrees and by a faster rate than the overall number of graduates. Generally the standard of degree awarded is lower than all graduates.
Highest qualification of managers
The LFS data shows a steady increase in the qualification levels of managers. In 1996 just over 23 per cent of managers had a degree which had increased to almost 30 per cent by 2001. The percentage of managers with no qualifications had declined over the same period (see Figure 3.2). Analysis of the relative qualification levels of managers and non-managers shows that percentages of individuals with degrees is rising faster among managers than non-managers. The percentages of managers with GCSE or equivalent as their highest qualification is still falling whereas it is steady for non-managers. Although the percentages of those with no qualifications is falling, it is doing so slightly faster for non-managers (see Figures 3.3 and 3.4).
Figure 3. 2: Highest qualifications of managers
0%
5%
10%
15%
20%
25%
30%
35%
Degree orequivalent
Higher education GCE A Level orequiv
GCSE grades A-Cor equiv
Otherqualifications
No qualification Don't know
1996 1997 1998 1999 2000 2001 Source: LFS Spring Quarter

Indicators of Management Capacity: Developing a Framework 25
3.2.2 Management NVQs
Management NVQs are awarded at levels 3, 4 and 5. The overall trends have been increasing at level 3, relatively steady at level 4 and in sharp decline at level 5 (see Figure 3.5). Level 3 was only introduced in 1998 and has proved to be popular with a rapid increase in take up with in excess of 3,000 awards per year. At level 4, although current rates are down on the peak years of 1996 and 1997, 2001 showed an increase against what seemed to be a decline. The highest level management NVQ — level 5 has however shown considerable decline to very low numbers currently. This gives mixed messages, overall numbers of management NVQs are increasing (from 3,776 in 1995 to 6,771 in
Figure 3. 3: Comparison of managers and non-managers with degrees
0
5
10
15
20
25
30
35
1996 1997 1998 1999 2000 2001
Year
% o
f m
an
ag
ers
/no
n-m
an
ag
ers
Degree or equivalent Degree or equivalent Source: LFS, 2001
Figure 3. 4:Comparison of managers and non-managers low qualifications
0
5
10
15
20
25
1996 1997 1998 1999 2000 2001
Year
% o
f m
an
ag
ers
/no
n-m
an
ag
ers
managerial GCSE managerial no qualification non-managerial GCSE non-managerial no qualification Source: LFS, 2001

The Institute for Employment Studies 26
2001) and there has been an increase in the percentage of the management population who have an NVQ from 0.11 per cent in 1995 to 0.21 per cent in 2001, but there has been a shift from level 5 to level 3 which has proved very popular. Of course this does not necessarily mean that any substitution has taken place of the lower level qualification for the higher and it may be that people have either been attracted to the NVQ in replacement of other qualifications such as the DMS, and the kinds of managers who in the mid 1990s were attracted to high level NVQs are now achieving different kinds of qualifications.
3.2.3 MBAs
Whereas high level management NVQs have shown a decrease in the period studied, the numbers awarded MBAs have shown a steady increase over the same period (see Figure 3.6). In 1995 MBA graduates numbered just over 8,000 per year, whilst in 2000 numbers were approaching 11,000. The proportion of managers with an MBA is also increasing from just under one per cent in 1995 to 1.7 per cent in 2000. This is based on UK domiciled graduates and makes no allowance for wastage.
3.2.4 Overall picture
The overall picture is that qualification levels are increasing, in common with the rest of the working population.
Figure 3. 5: Trends in Management NVQ’s awarded
0
500
1000
1500
2000
2500
3000
3500
4000
1995 1996 1997 1998 1999 2000 2001
Years
tho
usa
nd
s
Level 3 Level 4 Level 5 Source: QCA NVQ Statistics

Indicators of Management Capacity: Developing a Framework 27
3.3 Ongoing formal and informal training and development
There are a number of sources of data on the level of training and development taking place. We have looked at the Labour Force Survey which asks respondent if they have received any job related education and training in the last 13 weeks and the last four weeks, both measures of the incidence of training. Respondents are also asked for the time spent on the training in the last week and the length of the development programme they are undertaking, both measures of the investment in training and development. The LFS also has data on whether the training was on or off the job and who paid the fees.
The Workplace Employee Relations Survey (WERS) ‘employees’ also contains data on levels of training and development. Respondents are asked how much training they have had in the last 12 months. Unfortunately we only have one survey for the period 1995 to present.
The CEL graduate tracking survey compares the training and development received from management and business graduates with that received by other disciplines, but is based on a fairly small sample and does not cover a long time series.
Other data collected are from organisational rather than individual sources. This includes the DfES Learning and Training at Work Survey with data on number of days training provided by employers and to which occupations, the average cost of training per employee, some data on the kinds of training provided, and whether the training leads to a qualification.
Figure 3. 6: Total numbers of MBA’s awarded
0
2000
4000
6000
8000
10000
12000
1995 1996 1997 1998 1999 2000
Years
tho
usa
nd
s
Source: Association of MBA’s

The Institute for Employment Studies 28
Other surveys of interest include the one-off CIPD Training and Development in Britain Survey for which we only have one year of data and two years of data for the management development survey by Thomson and Mabey et al. (1996 and 2000).
We also have data on the number of applicants to business and management courses.
3.3.1 Amount of training undertaken by individuals
The LFS has mixed messages with regard to the amount of training and development undertaken. The number of managerial respondents reporting that they had undertaken training in the
Figure 3. 7: Managers receiving job related training (previous 13 weeks)
0%
5%
10%
15%
20%
25%
30%
35%
1995 1996 1997 1998 1999 2000 2001
Years
% o
f m
anag
ers
Source: LFS Spring Quarter
Figure 3. 8: Managers reporting training in last four weeks
0%
5%
10%
15%
20%
1995 1996 1997 1998 1999 2000 2001
Years
% o
f m
anag
ers
Source: LFS Spring Quarter

Indicators of Management Capacity: Developing a Framework 29
last 13 weeks shows a small increase over the period since 1995 (see Figure 3.7). However, those reporting training in the last four weeks has shown a decline, this may mean that training is becoming less frequent and therefore less likely to be picked up in shorter time periods (see Figure 3.8).
The time spent on training by those who received training in the last week is shown in Figure 3.9 and indicates that shorter periods of training are becoming proportionally more popular compared to longer periods. A closer examination of data on the length of the training programme for those who completed training in the last four weeks, shows that much of this decline is associated with a decline in participation in shorter training programmes of less than two weeks. Participation in longer training episodes would appear to be steady or increasing. This suggests that long term
development programmes eg MBAs or degrees are still undertaken but the decline in training is in the shorter courses. This theory is also supported by data on whether training will lead to a qualification. Around 30 per cent of training and development undertaken in the last four weeks will lead to some form of qualification and this has been steady over a number of years.
Where training is undertaken shows a shift to on-the-job training (see Figure 3.10). Mixed delivery of training has also increased whilst off-the-job training has declined.
Figure 3. 9: Time spent (in hours) on training for managers in preceding week
0%
10%
20%
30%
40%
50%
60%
70%
1995 1996 1997 1998 1999 2000 2001
Years
% o
f m
anag
ers
0 - 9 10 to 19 20 - 29 30 - 39 More than 40 Source: LFS Spring Quarter

The Institute for Employment Studies 30
The WERS data does not give a time series and the latest data available is for 1998. The employee questionnaire asks if individuals have received training in the last 12 months and of what duration. Responses indicate that just over 73 per cent of managers had received training. Just over four per cent has received training of less than one day, nearly 13 per cent of between one to two days, 29 per cent of between two to five days 14.5 per cent between five and ten days and almost 12 per cent of more than ten days.
CEL Graduate Tracking Survey records the frequency of various training events for graduates in management related and non-management related degrees. Management graduates are more likely to receive a short course in business or personal skills (49 per cent versus 36 per cent), as likely to receive training of a short technical nature or training leading to a professional qualifications (just over 40 per cent and 27 per cent respectively), but less likely to attend an HE course (one per cent versus 16 per cent).
UCAS data on applicants to business management courses also shows a steady decline (see Figure 3.11) as does data on FE course enrolments (see Table 3.2).
The overall picture would appear to be of a decline in both the frequency and the duration of management training with a shift to less formal delivery methods, although there are some indications that more managers are being trained. The amount of management training leading to qualifications and taking extended periods appears to be static.
Figure 3. 10: Location of training for managers and administrators
0%
10%
20%
30%
40%
50%
60%
70%
80%
1995 1996 1997 1998 1999 2000 2001
Years
% o
f m
anag
ers
On the job training Training away from job Both Source: LFS Spring Quarter

Indicators of Management Capacity: Developing a Framework 31
3.3.2 Provision of management training
On the whole employers data is less useful as it tends to be cruder and less detailed. Employer data is also often very difficult to gather as devolvement of responsibility and budgets means that many organisations don’t keep the data or find it hard to collate.
The DfES training at work survey contains data on overall spend on training and development and the number of days of training delivered. This data is not broken down by managers and therefore we report it under organisational activity as a general measure of good HR practice. Respondents are asked if they provide training to certain occupations of staff, including managers. This shows a steady 68 per cent of organisations offer training to managers and senior administrators and this percentage is the same for both 1999 and 2000. In the 2000 survey, professionals and technical and scientific occupations are more likely to receive training (75 and 80 per cent respectively of organisations providing), craft and skilled operatives receive the same.
Figure 3. 11: HE Applicants to business management courses
27000
28000
29000
30000
31000
32000
33000
1996 1997 1998 1999 2000
Years
tho
usa
nd
s
Source: UCAS
Table 3.2: Enrolments on management courses in FE – FEFC and non-FEFC funded courses
1995/1996 1996/1997 1997/1998 1998/1999 1999/2000 2000/2001
Certificates 10,954 12,517 14,050 13,065 11,873 11,211
GCSE 96 180 216 125 254 89
GCE ‘A’ level 821 1,228 1,428 1,424 1,748 701
NVQ 17,852 21,528 21,469 19,265 16,894 12,239
Source: Keyfacts Enrolments Database, FEFC and LSC

The Institute for Employment Studies 32
The incidence of management training is also recorded and shows an increase from 36 per cent of responding organisations indicating that they provide management training in 1999, 41 per cent in 2000 and 45 per cent in 2001.
The CIPD Training and Development in Britain Survey is a small scale survey that has been running for three years but because of changes in questions and data reporting we only report the latest survey. Respondents were asked to estimate the extent of structured on the job training in the workplace and for managers and professionals, 43.2 per cent of respondents said that most do some kind of structured on the job training, and 48 per cent said that some do. Asked if staff had a formally appointed coach or mentor, nearly 14 per cent reported that most managers and professionals do, and a further 49 per cent said that some do. Thirty-seven per cent reported that none of their staff in these occupations do. The survey also provides detailed information on the range of development methods used but the responses were not specific to management development.
The management development survey by Thomson and Mabey is also only run very infrequently and so can only provide some contextual information. It does however provide some quite specific data on management development practice within organisations. Formal and informal methods are shown in Figures 3.12 and 3.13. The most popular formal method for companies with more than 100 staff external study or for qualifications, followed by in-company skill development (both individual and organisational skills) and external courses, all ahead of seminars and conferences. All methods show an increase on 1996 data. The most common informal method was planned on-the-job development (84 per cent), followed by coaching and then mentoring (80 and 65 per cent respectively). All of these methods
Figure 3. 12: Formal methods of management development
0% 10% 20% 30% 40% 50% 60% 70% 80% 90%
In-company job rotation
Job shadowing/sitting by Nellie
External placement/secondment
Planned on-the-jobdevelopment
Mentoring
Coaching
1996 2000 Source: Thomson and Mabey et al., 1997

Indicators of Management Capacity: Developing a Framework 33
show a considerable increase compared with 1996. The survey also provides data on the existence of a policy statement on management development, information on the priority given to management development by the organisation and resources committed, the number of days of formal management development per annum and measures of success and impact.
Amongst the sample organisations ie those with more than 100 employees, policy statements on management development have become more popular (from 43 per cent of organisations in 1996, to 51 per cent in 2000). The priority given to management development is also increasing with more organisations describing priority as high than in 1996 (see Figure 3.14).
Figure 3. 13: Informal methods of management training
0% 10% 20% 30% 40% 50% 60%
In-company job rotation
Sitting by Nellie' job observation
Learning curve, doing the job
Mentoring
Coaching
Other informal development
None
Not stated
Me
tho
ds
Source: Thomson and Mabey et al., 1997
Figure 3. 14: Priority accorded to management development
0%
10%
20%
30%
40%
50%
1-2 (LOW) 3 to 4 5 to 6 7 to 8 9-10 (HIGH)
1996 2000 Source: Thomson and Mabey, Achieving Management Excellence, 2000

The Institute for Employment Studies 34
Interestingly the survey provides an assessment of management development quality and; the success of management development and its impact (see Figures 3.15 and 3.16). One in five respondents believed that management development had no or low achievement of objectives, around a third felt it had medium success/impact and just over a third reported high or full achievement of objectives. These are slightly more negative than in 1996. Results on impact show one in five respondents felt that management development had had little or no impact, around a third felt it had some impact and 42 per cent felt it had high or immense impact, these two are less positive results than in 1996.
Figure 3. 15: Success of management development policies in achieving objectives (organisations with more than 100 employees only)
0% 5% 10% 15% 20% 25% 30% 35% 40% 45%
No or low achievement ofobjectives
Some achievement ofobjectives
High or full achievement ofobjectives
1996 2000 Source: Thomson and Mabey, Achieving Management Excellence, 2000
Figure 3. 16: Impact of management development on the organisation (organisations with more than 100 employees)
0% 10% 20% 30% 40% 50% 60%
Little or no impact
Some impact
High or immense impact
1996 2000 Source: Thomson and Mabey, Achieving Management Excellence, 2000

Indicators of Management Capacity: Developing a Framework 35
Although organisations were slightly more positive about impact than about achievement of objectives, the decline in both impact and success gives cause for concern.
3.3.3 Overall picture
Data from organisations is limited in its ability to give valuable information on the training and development of managers and because of various changes made to the surveys we have used, does not provide a good time series. It is therefore difficult to draw conclusions. There is limited evidence that managers and professionals continue to receive relatively high levels of training and development compared to other categories of staff. Organisations report that they are increasing their provision of management development and believe that they are attaching greater priority to it, however this conclusion is not supported by the data from individuals (eg from the LFS).
3.4 Experience
The World Competitiveness Yearbook, (IMD, 2001) contains some perceptual information on the levels of international experience of managers. We are currently seeing if we can get time series data.
We could not identify any other readily available data sources on experience.

The Institute for Employment Studies 36
4. Managerial Capability
In the absence of any objective test, the best available measure of managerial capability is the existence of any skill gaps or shortages reported by employers for the managers they employ. Shortages are defined as when employers find difficulties recruiting because there are insufficient applicants with the required skills, experience or qualifications. Skill gaps are defined as internal skill deficits where employers their employees current skills are insufficient to meet their current business needs.
A major source here is the DfES’ Employers Skill Survey which was conducted both in 1999 and 2001. A further survey (based on a restricted sample) is being conducted in 2002.
The survey asks employers whether they have any hard to fill vacancies and if so which occupations they apply to. This is a measure of the relationship between the availability of managers in the external labour market and demand from employers. The survey has a number of measures of skill shortages. Perhaps the most relevant is the number of hard-to-fill managerial vacancies (as defined by SOC 1) as a proportion of all managers. In 2001 the figure was 0.3 per cent, down from 0.5 per cent in 1999 and compare with 1.3 per cent (2001) and 1.4 per cent (1999) for all hard-to-fill vacancies as a percentage of all employment. This suggests a relatively benign and if anything improving external labour market for managers. The main skill deficits identified include applicants’ generic skills such as team-working, problem-solving and customer handling and specific practical and technical skills.
The Workplace Employees Relations Survey (1998) covered similar ground and found that 6.5 per cent of employers had difficulty filling managerial vacancies.
Perhaps a more relevant measure is the employers’ perception of the proficiency of their managers, which is used by the Employers Skills Surveys to assess the prevalence of skill gaps — ie internal labour market deficiencies. The 2001 survey found that six per cent of employers thought that a significant proportion of their managers had a skills gap (ie were less than fully proficient), compared with eight per cent in 1999. In another measure, the prevalence of skill gaps among managers also fell between the

Indicators of Management Capacity: Developing a Framework 37
two surveys (ie with four per cent of managers being reported as being less than fully proficient in 2001 compared with 4.8 per cent in 1999. The comparable figures for all employees were 4.1 per cent and 4.9 per cent). This suggests that while the trend (as measured by just two points) is positive and in line with all employees. The most commonly identified skill gaps were management skills (further data from the 2002 survey should illuminate what respondents meant by such skills), followed by communication skills and team-working skills. The skills survey (Felstead, Gallie and Green, 2002) explores the importance attached to certain key management skills (coaching staff, developing staff careers, motivating staff, resource control, and strategic thinking) by those who have managerial responsibilities. There is unfortunately no trend data yet available but there is some evidence that coaching skills are increasing in importance from the respondents own assessments.
WERS (1998) provides some further depth to the nature of internal managerial skill deficits. Respondents to the employee questionnaire indicated that:
l 24 per cent were poor at ‘dealing with work problems’ that the employee or others may have had
l 30 per cent of managers were poor at ‘keeping everyone up-to-date about proposed changes’
l 34 per cent were poor at ‘responding to suggestions from employees’
l 38.5 per cent were poor at ‘providing everyone with a chance to comment on proposals’.
4.1.1 Overall picture
Looking at two measures of skill deficit used in the Employers Skill Surveys it is apparent that for employers skill gaps among managers are more of an issue than skill shortages, although in both areas other occupations were a source of even more concern. For example the extent of managers’ skill gaps are in line with the findings for all employees. On skill shortages, employers report fewer problems among managers than in other occupational groups.

The Institute for Employment Studies 38
5. Management Practice
The model suggests that better management may be expressed through better management practice ie the adoption of certain high level work practices and the achievement of better quality products, services and processes. We therefore present a range of indicators that might throw some light on these practices. We have used data from WERS, IiP UK, ISO and the British Quality Foundation. Unfortunately for most of these sources there is no time series data and therefore we present current figures. These measures are essentially ‘input’ measures of activity and indicate the extent to which managers and organisations are committed to managing people better and developing better products. In the next section when we concentrate on organisational impact, we will look at the output measures of this activity in terms of new products or services and outcome measures of impact on the organisation.
5.1 High level work practices
WERS gives some very interesting data on workplace practices and has the advantage of both the organisational survey and an employees survey.
WERS reports findings on the training and development of the workforce, the existence of a formal strategic plan, the use of problem solving groups, the achievement of various quality standards and the use of appraisals.
The DfES Learning and Training at Work survey (LTWS) has data on training and development practice in organisations, eg the existence of a training budget and plan, average days training provided per employee, the average costs of training per employee, types of off the job training and methods used.
5.1.1 Training and development practice
WERS data indicates that almost three-quarters of respondents had a business plan (74.3 per cent) of which 84 per cent included mention of employee development. This is much higher than the findings of the DfES LTWS where latest data (2001) indicates that 60 per cent of respondents had a business plan, nearly half of

Indicators of Management Capacity: Developing a Framework 39
respondents (49 per cent) had a training plan and 38 per cent a training budget. These were all increases on the 2000 survey findings of 55 per cent, 39 per cent and 27 per cent respectively.
WERS also has indicators of the amount of training and development that is taking place ie what proportion of employees have had formal off the job development in the last 12 months. Almost 18 per cent of respondents said all did, eight per cent more than 80 per cent, 16 per cent between 40 and 80 per cent, 34 per cent said between 20 and 40 per cent of staff received formal training and 21 per cent less than 20 per cent. Nearly one-quarter of respondents said that no staff had received formal off the job training.
When asked how much time was spent in training there was a range of responses shown in Figure 5.1, with almost 40 per cent of organisations suggesting between two to five days, a quarter between one and two days and 15 per cent between five and ten days. LTWS shows average number of days training has increased from 1.9 days in 1999 to 2.2 days in 2000, however the average number of days per employee trained has decreased slightly from 8.6 to 8.2. This would suggest that more employees are being trained but for less time each. The survey also records average cost of training. The most popular subject for training from WERS was on health and safety with almost 65 per cent of organisations providing such training. This was followed by training to operate new equipment at 45 per cent, teamworking 44 per cent and improving communication, computing skills and customer service at around 40 per cent. LTWS also shows that health and safety training is the most popular form of training at 78 per cent of respondents in 2001 (69 per cent in 2000 and 62 per cent in 1999), followed by job specific training at 70 per cent, induction training at 58 per cent, new technology at 48 per cent and management and supervisory training and 45 and 42 per cent. LTWS also
Figure 5.1: Time spent in formal off-the-job training
No time2%
Less than one day9%
1 to less than 2 days25%
2 to less than 5 days37%
5 to less than 10 days16%
10 days or more11%
Source: WERS’98

The Institute for Employment Studies 40
records increases in the provision of both on and off the job training (off the job increased from 34 per cent 1999 to 41 per cent 2000, and on the job from 58 per cent to 66 per cent). The survey also indicates an increase in training leading to formal qualifications from 43 per cent of respondents in 1999 to 55 per cent in 2001. Satisfaction levels with the training provided by private companies and colleges is steady between 1999 and 2000 with just over half of respondents very satisfied, and just over a third fairly satisfied. Very small percentages were dissatisfied.
5.1.2 Other management practices
Baseline data for some management practices are provided by WERS 1998:
Problem solving groups used by 33 per cent of respondents with data on the proportions of the workforce involved in them, (around 46 per cent involving most or all employees, 11 per cent around half of employees and 35 per cent involving a few).
Data on the use of appraisals by employee groups is also provided (almost 60 per cent of respondents appraise managers and administrative staff, 30 per cent professionals, 36 per cent secretarial and clerical, 23 per cent sales staff, and smaller proportions of other staff. Twenty-five per cent do not conduct any appraisals).
Without any trend data it is impossible to draw conclusions regarding management practice.
5.2 Quality
Data for ISO 9000 shows that the numbers of accredited UK companies is steadily increasing although the proportions of all companies that are accredited is still very small at 4.3 per cent (see Figure 5.2). Similarly the percentage of the workforce working in IiP involved companies has steadily increased, (see Figure 5.3). In 1998 almost 13 per cent of the workforce of the UK worked in an IiP accredited company, increasing to almost a quarter in 2001. Commitments have, however, shown a decline from 21 per cent of the workforce in 1998 to 14 per cent in 2001. This would imply that continuing increases in the penetration of IiP will slow down.
The EFQM has shown much lower penetration currently standing at 0.17 per cent of UK companies down on the 1999 rate of 0.18 per cent.
WERS too contains data on ISO 9000/BS 5750 and IiP.

Indicators of Management Capacity: Developing a Framework 41
5.2.1 Overall picture
The data indicate that there is a steady increase of engagement with quality initiatives although absolute numbers of organisations accredited is still very low. Data from WERS indicates that some quality practices such as problem solving groups are much more common. IiP has been a very successful initiative with some 24 per cent of employees now working for an IiP accredited company, but the growth of IiP accreditation looks likely to slow.
There are suggestions that business planning processes are increasing – or at least becoming more formal — however to be able to draw sensible conclusions we need much more information on the adoption of other management practices.
Figure 5.2: Accreditations for ISO 9000
0%
1%
2%
3%
4%
5%
1995 1996 1997 1998 1999 2000
Years
% o
f to
tal U
K c
om
pan
ies
Source: The ISO Survey
Figure 5.3: Percentage of workforce working in IiP involved companies
0%
5%
10%
15%
20%
25%
30%
35%
40%
45%
Sep-98 Aug-99 Jun-01
Recognitions Commitments TOTAL Source: Investors in People UK, Management Report

The Institute for Employment Studies 42
6. Organisational Outcomes
We have looked at measures of both organisational activity and corporate outcomes. Organisational activity is a measure of the outputs of management practice and will include the production of new products and services, organisational outcomes are measures of bottom line performance measures from the perspective of consumers, employees, shareholders and the organisation.
6.1 Business activity
We have gathered two kinds of data on organisational outcomes, evidence on innovation activity from the DTI’s innovation survey and information on patent activity in the UK.
The DTI innovation survey 1999 gives data on proportion of turnover that is due to innovative products, the proportion of turnover that is devoted to technological development activities for both manufacturing and service organisations and the proportion of enterprises that are judged to be innovators. This data is comparable to the EU average as the survey is now conducted throughout the European Union. The proportion of turnover due to innovative products varies by the size of the enterprise. Larger companies tend to be greater innovators than smaller and all tend to lag behind the EU average for equivalent
Figure 6.1: Proportion of turnover due to innovative products
0% 5% 10% 15% 20% 25% 30% 35% 40%
Small
Medium
Large
All
UK EU Average Source: DTI, Innovation Survey, 1999

Indicators of Management Capacity: Developing a Framework 43
size organisations. See Figure 6.1.
The proportion of turnover that is devoted to development activity is relatively consistent with size for manufacturing organisations at around three per cent of turnover. This is higher than the EU average for small and medium companies but reverses for large companies (small organisations 3.3 per cent in the UK versus 2.5 per cent EU, medium 2.9 per cent UK versus 2.3 per cent EU, large 3.2 per cent UK versus 4.2 per cent EU). For service organisations there is considerable variation by size and UK companies tend to perform better compared to the EU. (Small organisations 6.9 per cent in the UK versus 2.9 per cent EU, medium 2.7 per cent UK versus 2.3 per cent EU, large 3.7 per cent UK versus 2.9 per cent EU). See Figure 6.2.
The survey judges 50 per cent of manufacturing enterprises and 54 per cent of service enterprises to be innovators.
Patents data is available from the European Patents Office annual reports. We report the percentage of European Patents granted to the UK. Figure 6.3 indicates that the percentage of patents granted to the UK is reasonably steady at around five per cent. A comparison of absolute numbers however shows a decline in the number of patents (1,897 in 1996, 2,081 in 1997, 1,992 in 1998, and 1,831 in 1999, and 1,377 patents in 2000).
6.2 Corporate performance
We have looked to identify a range of measures of business performance:
l Customer satisfaction
Figure 6.2: Proportion of turnover devoted to technological development activities
0%
1%
2%
3%
4%
5%
6%
7%
8%
Small Medium Large All Small Medium Large All
% t
urn
ove
r
UK EU Average
Manufacturing Services
Source: DTI, Innovation Survey, 1999

The Institute for Employment Studies 44
l Employee satisfaction
l Business survival, eg as measured by the number of insolvencies
l Productivity.
We found no existing data sources of customer satisfaction and so do not report on this measure.
6.2.1 Employee satisfaction
Whilst many organisations conduct surveys of employee satisfaction, the results are rarely in the public domain and are frequently the result of unique questions reflecting the particular
Figure 6.3: UK Industrial disputes
0
200
400
600
800
1000
1200
1400
1994 1995 1996 1997 1998 1999 2000
Years
Nu
mb
ers
Working days lost (thousands) Stoppages Workers involved (thousands) Source: ONS
Figure 6.4: UK Patent activity
1
2
3
4
5
6
1996 1997 1998 1999 2000
Years
Per
cen
t
% of European patents that were granted to the UK*
Source: European Patents Office

Indicators of Management Capacity: Developing a Framework 45
concerns of the organisation. The proposals from CEML on corporate reporting are pertinent here and may be useful in the future.
Industrial disputes may form an interesting picture of one element of employee satisfaction. We report data on industrial disputes (Figure 6.4), this shows an erratic picture of disputes in terms of working days lost and numbers of workers involved. There are no clear trends.
6.2.2 Business survival
DTI insolvency data (Figure 6.5) shows that there has been a steady increase in insolvencies since 1996. Insolvencies are obviously affected by the economic cycle and related to issues such as globalisation and growing business uncertainty, and new forms of commerce such as e-commerce. This data would indicate that a watch needs to be kept on the trends and the underlying causes to be able to comment over time.
6.2.3 Productivity
Productivity is a measure of how well the UK economy is using its resources by relating the quantity of inputs to outputs. We have used two main measures of productivity in this report — output per hour worked and output per worker. Output per hour worked has the advantage of being readily available and is also not influenced by the number of hours worked over a given period and consequently takes account of part time working.
Output per worker, has the advantage of being easier to calculate with readily available data. We report it, as it is used by the
Figure 6.5: Company insolvencies
0.0
0.2
0.4
0.6
0.8
1.0
1.2
1995 1996 1997 1998 1999 2000 2001
Years
pe
r ce
nt
Company insolvencies as a % of all companies Source: DTI; Company Insolvencies

The Institute for Employment Studies 46
Government in establishing policy objectives (HM Treasury, 2000). Other productivity measures such as total factor productivity (TFP) takes into account capital as well as labour. TFP attempts to measure output per unit of input (labour and capital). However, it is more difficult to explain, requires a measure of capital stock which may not be either available of reliable.
It is generally acknowledged that the UK does not compare well with our competitors on productivity measures. Figure 6.6 shows labour productivity per hour worked for the UK compared to the EU average. This shows that the productivity gap between the UK and the EU has progressively narrowed between 1995 and 2001. The interpretation of productivity is complex and the DTI’s UK Competitiveness Indicators discuss the impact of innovation and investment in information and communication technology (ICT). The growth of productivity in the US, in excess of growth in Europe is felt to be partly due to the investment and rapid advances in ICT.
Other data from ONS reports both GDP per hour worked and GDP per worker. We present this in Figures 6.7 and 6.8.
The presentation of these data are slightly different to that above which takes the EU average to be 100. In Figures 6.7 and 6.8, the UK is taken to be 100 and our competitors productivity reported relative to that. This confirms that the UK is closing the gap relative to all our competitors with the exception of the US which has shown an increase in productivity in recent years.
Figure 6.6: The UK’s productivity gap
10%
20%
30%
40%
50%
60%
70%
80%
90%
100%
1995 1996 1997 1998 1999 2000 2001
Years
Source: Eurostat, National Accounts and OECD

Indicators of Management Capacity: Developing a Framework 47
6.3 Conclusions
The data on innovation implies that UK manufacturing, especially large organisations, lags behind our EU competitors, whereas for service organisations we tend to be ahead, so there are mixed messages for the UK.
The Innovation Survey, should become a regular feature and therefore trends in the information it contains should be increasingly available and useful.
Outcome data concentrates on productivity, which shows the UK narrowing its productivity gap with its competitors. Data on
Figure 6.7: GDP per worker (UK=100)
0
20
40
60
80
100
120
140
France Germany Japan USA G7
1995 1996 1997 1998 1999 2000 Source: ONS
Figure 6.8: GDP per hour worked (UK=100)
0
20
40
60
80
100
120
140
France Germany Japan USA G7
1995 1996 1997 1998 1999 2000 Source: ONS

The Institute for Employment Studies 48
outcomes from the perspective of other stakeholders is light and yet would be very helpful to add to the overall picture. On the whole the measures we have indicate positive progress.

Indicators of Management Capacity: Developing a Framework 49
7. Individual Outcomes
It might be expected that, all things being equal, better managers would have more successful careers than poorer managers. Their employing organisations, or others in a competitive labour market, should recognise their capability and reward it with better paid jobs, and more promotions. Therefore we might expect that one of the outcomes of developing capability, will be individual as well as organisational benefits. However, even if this is the case it provides some challenges to measure it. Partly we cannot separate capable from less capable managers in our data sets because of the issues of definition described in Section 2.5.2, but more importantly such benefits may be relative rather than absolute. The more capable will have advantage over the less capable. If management capability grows overall, there will merely be a substitution effect with the best doing better than the others, regardless of the ability of the others.
In terms of using our framework of indicators to provide any insight into these dynamics, we think the most we can expect is to be able to see (if our model applies), that generally the most well trained and qualified managers are those who achieve better personal outcomes than the others.
We identified a number of sources of data on individual impact. These cluster into data on:
l Pay levels
l Promotion/job change
l Employment experiences.
The MBA Salary and Career Survey has data on promotions and salary increases and other benefits since graduation. The BHPS asks questions as to whether the current position is an improvement on the previous, the CEL Graduate tracking survey gathers data on the career satisfaction of management graduates, compares salary levels of graduates who had received training with those who had not, and the employment destinations of management and non-management graduates. HESA first destination statistics also has data on unemployment. The LFS enables the comparison of employed managers and administrators and the unemployed whose last job was as a

The Institute for Employment Studies 50
manager or administrator, and the comparison of salaries of those who had received education or training to those who had not.
7.1 Pay levels
The issue is not whether pay levels of managers have increased per se, which the New Earnings survey (ONS) shows have (Figure 7.1). The relevant indicator is whether pay for ‘better’ managers is higher than for others. Data from the LFS shows that consistently since 1995, the pay of managers who had received work related education or training in the previous 13 weeks is higher than those who had not (Figure 7.2). This does not of course imply causality. We also checked for the interplay of education and training as it is clear from many studies, that more educated individuals tend to earn more than those less educated. It is also true, that those who are most educated tend to receive more training and development from their employer. However, the relationship between pay and participation in training and education is complex. We have looked at both ends of the management spectrum: those with degrees and those with no qualifications. Figure 7.3 charts the pay levels of degree-level managers only, and shows that those without training tend to earn consistently more than those with a degree. At the other end of the scale (Figure 7.4) managers with no qualification who had experienced training in the past 13 weeks generally earned more than those without training, although the gap appears to be narrowing.
Figure 7.1: Mean gross weekly pay for Managers and Administrators
0.00
100.00
200.00
300.00
400.00
500.00
600.00
700.00
1995 1996 1997 1998 1999 2000 2001
Year
£
Source: New Earnings Survey, ONS
The CEL Graduate Tracking Study shows that the median salary of management graduates rose by 48 per cent between 1998 and 2001, whereas that for non-management graduates increased by 54 per cent. The impact of training was greater for management

Indicators of Management Capacity: Developing a Framework 51
Figure 7.3: Mean weekly salary (£) of managers and administrators by whether they have had training in the last 13 weeks - those with degree or equivalent qualifications
0
100
200
300
400
500
600
700
800
900
1996 1997 1998 1999 2000 2001Years
Training No Training Source: LFS Survey, Spring Quarters
Figure 7.2: Gross weekly salaries of trained vs. untrained managers
0
100
200
300
400
500
600
700
1995 1996 1997 1998 1999 2000 2001
Years
Training No Training Source: LFS Survey, Spring Quarters
Figure 7.4: Mean weekly salary (£) of Managers and administrators by whether they have had training in the last 13 weeks - those with no qualifications
0
50
100
150
200
250
300
350
400
450
1996 1997 1998 1999 2000 2001Years
Training No Training Source: LFS Survey, Spring Quarters

The Institute for Employment Studies 52
graduates than the whole sample — median salary with training was £22,000 for both management and non-management alike, but without training management graduates median salary was £15,750 compared to the whole sample median salary of £18,000.
The MBA salary and Careers survey has subjective data from MBA graduates as to whether certain benefits had accrued post MBA. The results for the 1997 and 2000 survey are shown in Figure 7.4. About one-third of graduates in both years said that their salary and benefits package had increased, but there was an increase in graduates who said they had been promoted or given more responsibility (from 34 per cent to 43 per cent) and those who said that had changed functional area or responsibility (from 27 per cent to 35 per cent). Assessment of pre to post salary increases for respondents implies average increases in salary post MBA of just over 40 per cent (25 per cent when adjusted for inflation).
The evidence would appear to be that better educated and trained managers are paid more. However, there is also some evidence that management studies may not be the best degrees in terms of pay rewards and incentives which might imply that management may not attract the best graduates. More work on relative pay levels would be helpful.
7.2 Promotions and job change
It might be expected that more able managers would experience more positive job changes either to more demanding, better paid jobs (promotion) or to more interesting work (positive job change). One of the difficulties in measuring job change is to be able to differentiate between change which is positive compared to that which is negative ie the result of redundancy or dismissal. The BHPS has an item which records if the respondent thinks their current job is an improvement on their previous one but other sources of job change information do not enable us to make this distinction and we have not reported them.
The MBA salary and career survey also records the number of promotions of MBA graduates but as there is no comparator with non-graduates, this is not very helpful. In comparing 1997 data with 2000, there would be appear to be an increasing number of promotions for MBA graduates — see Figure 7.5. but this is a survey of post 1991 graduates and therefore numbers of promotions would be expected to increase over time. There is a tendency for MBA graduates to move away from functional roles to general management and to be more likely to move to board director and senior management roles and away from middle and junior management or professional roles.
The CEL graduate tracking survey indicates that graduates of management studies are similar to non management studies in

Indicators of Management Capacity: Developing a Framework 53
terms of career satisfaction (79 per cent of both sets of graduates intend to say in the same field and 77 per cent of management graduates and 78 per cent of non management graduates are satisfied with career progress
Overall, the data on promotions is inconclusive and this is partly due to the difficulty of collecting unambiguous data.
7.3 Employment experience
Various data sets give some data on the likelihood of experiencing unemployment. Using HESA data we can compare Business and Management graduates against all subjects (Table 7.1). Business and Management Graduates are both more likely to be in paid employment and more likely to be unemployed compared to graduates from all subjects.
Over the period unemployment for all graduates has fallen. HESA data also tells us the proportion of Business and Management
Figure 7.5: Number of promotions of MBA graduates since 1991
0%
5%
10%
15%
20%
25%
30%
35%
None One Two Three Four or more
Number of promotions
1997 2000 Source: MBA Salary and Career Survey
Table 7.1: Employment status of business and management studies of graduates
Business and Management All subjects
Paid employment Unemployed Paid employment Unemployed
1995 70.5 10.3 57.9 9.2
1996 75.1 8.5 63 8.2
1997 76.7 7.2 65.3 7
1998 77 6.3 66.8 5.8
1999 75.6 6.3 65.8 5.5
2000 75.6 6.1 66.6 5.5
Source: HESA First Destination Statistics 1999-2000

The Institute for Employment Studies 54
graduates who enter management and admin jobs (see Figure 7.6). This shows that currently less than 40 per cent do so and therefore implies that some caution should be applied to interpretations of graduate data. The CEL graduate tracking study also shows that Business and Management graduates are more likely to be in full time employment and at higher rates than the HESA data (94 per cent compared to 86 per cent of non-business graduates, 2001 data) with a further four per cent of both management and non-management studies graduates working part time.
The LFS enables us to compare the qualification levels of employed managers with those who are currently unemployed and whose last job was as a manager or administrator. Table 7.2 tracks the outcomes from 1996 to 2001. This shows that employed managers have consistently higher qualification levels than unemployed.
The evidence is that unemployment is more likely amongst less well qualified managers. This would be consistent with data for the economy as a whole.
Figure 7.6: Proportion of business and management studies - graduates entering management and admin employment
0%
10%
20%
30%
40%
50%
1995 1996 1997 1998 1999 2000
Years
Source: HESA First Destination Statistics 1999-2000

Indicators of Management Capacity: Developing a Framework 55
Table 7.2: Comparison of qualification levels for employed and unemployed managers
Employed 1996 1997 1998 1999 2000 2001
Degree or equivalent 23.4 24.8 25.1 26.5 28 29.6
Higher Education 11.4 11.5 12.1 12.2 11.7 12.3
GCE ‘A’ level or equivalent 26.9 26.7 26.2 26.1 26.2 26
GCSE Grades A-C or equiv. 21.1 21.1 20.9 20.2 19.9 18.1
Other qualifications 8.9 9.4 9.4 9.0 8.3 8.4
No qualifications 7.8 6 5.5 5.0 4.8 4.9
Don’t know 0.6 0.6 0.7 1.0 1.1 0.6
Unemployed 1996 1997 1998 1999 2000 2001
Degree or equivalent 14.3 14.5 20.4 18.8 21.5 20.1
Higher Education 10.3 9.1 9 6.7 10 13.2
GCE ‘A’ level or equivalent 24.1 26.7 24.3 26.3 24.1 20.7
GCSE Grades A-C or equiv. 21.6 22.2 17.6 26.8 21.9 23.4
Other qualifications 14.8 18.4 14.1 11.2 13.4 11.6
No qualifications 15 9.1 13.7 10.2 8.3 10.1
Don’t know 0 0 0.8 0 0.8 0.9
Source: LFS Spring Quarter

The Institute for Employment Studies 56
8. Conclusions
In concluding our report, we have considered three key questions:
l Is the framework a good idea?
l Does it meet its original purpose?
l If it doesn’t now, could it and in what circumstances?
We have held numerous discussions with researchers, policy makers and agencies, employers’ representatives and other intermediaries. Whilst several commented on the difficulty of gathering data, nearly all were supportive of the concept and the model. Our work in developing the model and populating the framework with data, has also convinced us that the framework is worthwhile. There has been a long standing and widely held belief that UK management capability is not as good as it should be, is less developed than that of our competitors and is part of the explanation for the UK’s productivity gap. The framework focuses attention on management capability more explicitly and provides the vehicle for a more rigorous exploration of the UK’s standing compared to our competitors.
Whilst we feel the framework to be worthwhile, we also acknowledge that data sources are not as complete as we would like. In fact, the data we have been able to collect is too full of gaps to be able to draw strong conclusions and is especially light in measures of management capability itself. Unfortunately this means that it is difficult to make an assessment of relative management capability at this stage.
So this brings us to our final question as to what might deliver a more comprehensive data set that would help formulate policy and assist academic research in this area. We address this in three sections:
l The theoretical underpinning to the model
l The data itself, its quality and comprehensiveness
l The messages from the data collected across the framework.

Indicators of Management Capacity: Developing a Framework 57
8.1 Theoretical underpinning
Although a full literature review was not a specified element of the study, we do discuss (in Section 2.4) some of the literature that gives support to the model we have developed. A further review of the literature conducted by IER (Bosworth and Wilson, 2002), focused on measurement issues associated with the model rather than evidence to support the assertion inherent in the model ie that management capability is related to management practice, business activity and business outcomes, and can be enhanced by development. We believe that the research we have undertaken would benefit from a comprehensive review of the evidence on the linkages suggested in the model.
8.1.1 Recommendations
That CEML, or its successor, initiate a detailed review of the evidence that connects management capability to organisational activity and outcomes. This would serve to:
l provide a theoretical underpinning for the framework
l validate the existing (and/or uncover potential) indicators at various points.
8.2 Data sources
We have collected and reported on a considerable amount of data in the framework, and as far as possible we have tried to meet our criteria as laid out in Section 2.6. We are concerned that much of the data does not fully meet the needs of the model ie it tends to be one-off and not show trends, does not cover enough managers or is not compatible with other sources. Given our previous comments on the value of the framework, we see this as a key area for the development of the framework and therefore highlight these deficiencies within each of the elements of the framework and summarise them below:
8.2.1 Development of capability
The first issue is to be clear on the information we would ideally like to have to be able to comment fully on the development of capability.
What would we like to know?
l The amount of development that managers participate in, both in terms of the incidence, ie the number of discreet events and the number of days.
l More specifically, the amount of management development that is undertaken.

The Institute for Employment Studies 58
l The reasons the development is undertaken eg to perform the current job better, to update existing skills or to acquire new skills, to improve promotion prospects, for personal development, for a qualification, or because the development was compulsory.
l Clarity on the focus of development eg managing H&S, managing diversity, managing strategy, managing change, communication and involvement, developing others, managing performance, managing innovation.
l Greater understanding of the format of the training eg formal off the job, formal on the job, coaching from manager or other, mentoring formal and informal, project working, secondments, action learning, electronic learning.
l Assessment of the value of the training/development to the individual or organisation.
l The existence of a formal plan or strategy for management development or a specified budget.
Where might we find it?
The LFS is one of the most comprehensive data sources but this strength is also a limitation for this research as it does not focus in sufficient detail on managers or the practice of management. It cannot tell us if training and development undertaken could be considered management development or more general training/development. Neither does the LFS contain any qualitative indicators of the impact or effectiveness of the development experienced. It is also difficult to extract data on the pursuit of academic qualifications by practising managers, the LFS does not indicate if they are in management related subjects. Furthermore, data from HESA and others cannot tell us if the student is a practising manager.
Data on organisational activity (eg the DfES Learning at Work Survey) also tends not to focus on management development per se and therefore cannot provide information on the amount or type of management development being provided. The CIPD survey is rather small scale and changes in questions mean we have not been able to report a series of data. The Thomson and Mabey study (2001) has some information of interest that is not available elsewhere eg the methods used and if this were supported by evidence that this is an important differentiator in the development of capability, it would be especially useful. More frequent collection of this data, perhaps extended to cover further aspects of management activity, would be helpful to the framework.
We could find no data on experience or the organisational environment and rules, although Thomson and Mabey (2000) identified this as a key source of management capability. Any data would have to come from a survey of managers and would need

Indicators of Management Capacity: Developing a Framework 59
to discover the type and form of experience and its contribution to management capability.
8.2.2 Capability
In measuring management capability more directly, we have identified that relatively little data exists. We first look at what we might ideally like to know.
What would we like to know?
l Views of management capability at a broad generic level ie what is the overall view of UK management capability from the perspective of senior executives, managers themselves and subordinates.
l The ability to see how UK managers compare with those in other countries.
l The ability to measure capability by level of management ie senior managers, middle managers, junior managers and supervisors.
l More specifically, the ability of managers to manage certain aspects of their role eg new technology, e-business, managing strategy, managing change, managing production/service, managing process, managing quality, managing innovation, managing people (vision, values, empowerment, performance, diversity).
l In understanding capability, it would be useful to be able to compare the skill demands of the management role, an understanding of their relative importance and the proficiency of managers in executing them. This would help highlight gaps and how they might be filled.
Where might we find it?
The data we have identified here are designed to demonstrate skill deficits rather than the stock of skills. Thus they identify where skills are missing rather than needed and being supplied. Ideally we would wish to use data which:
l identified the overall demand for managerial skills, and
l assessed the extent to which those skills were available.
The problem with the latter is that in the absence of an objective test of capability, we are reliant on perceptions. The data we have used (ie the Employers Skill Survey) provides only an employer perspective. It could be argued (especially in small firms) that as the respondent could have been the sole or prime manager in the workplace they might have been unlikely to comment negatively on their own skill levels. It would be useful to triangulate such information with other perspectives eg from employees or external

The Institute for Employment Studies 60
customers or contacts. We are not aware of such a source although WERS does provide a potential model as it looks at managerial skills levels from both employer and employee angles.
We have identified a potential source of data on UK management capability which is the World Competitiveness Yearbook. This reports both hard data and the results of a survey and includes perceptions on international experience of managers, the degree to which competent senior managers are available in the national labour market and a question as to whether domestic and international managers have the same level of competence (although it is not clear whether response might indicate competence is lower or higher). There are also items on whether health and safety is adequately managed and on whether business leaders respond with regard to their social responsibility.
Ideally therefore we would like to be able to assess capability at a number of levels eg:
l Through some form of general expert view – ie the systematic collection of the assessment of individuals with a general perspective on managerial capability (eg Chairs of major corporations, heads of business schools, senior public servants etc.) — perhaps along the lines of the Competitiveness Yearbook.
l Secondly we would want a comprehensive employer perspective – collecting data from a number of angles with the aim of assessing both
• demand (how many people in your organisation use managerial skills, what form do these skills take, which are the most important etc.) as well as
• supply and/or the conjunction of the two (eg to what extent are employees who deploy managerial skills proficient at x or y or z?)
l Thirdly we would propose collecting similar data from employees (including managers themselves) along similar dimensions, ie this would provide both a self-assessment and a peer-group assessment on the nature of managerial skills required and the extent to which managers and others have them. One of the by-products of such an approach is that it could identify skills that were under-utilised by employers.
l Finally a further shaft of light could be shed on managerial capability by customers and/or suppliers — again ideally focusing on similar skill areas as employees and employers.
8.2.3 Management practice
The identification of the take up of various management practices is also an area where data is light. We identify ideal requirements and then review existing sources.

Indicators of Management Capacity: Developing a Framework 61
What we would like to know?
l Understanding which management practices are adopted within organisations (eg business plans, development plans, formal practices in recruitment, appraisal, pay and reward structures such as profit sharing, employee involvement initiatives, R&D spend, quality initiatives).
l Utilising evidence from the literature to identify the high level work practices associated with business performance and measuring their uptake and by which kinds of organisations?
l Identifying which employees are affected within the organisation
l Assessing the quality of the implementation?
Where might we find it?
We found little data in existing surveys. We could find no readily available series data on the processes organisations engage in such as high level work practices etc. WERS is the best source but is repeated only infrequently. If WERS were also to contain information on management capability, this would help make some of the linkages more explicit.
A literature review exploring those management practices most associated with organisational performance might help focus some of the detailed questions in surveys such as WERS and help identify what is the incidence of good management practice.
Our data on quality processes is limited to accreditation for ISO 9000 and EFQM and does not pick up those organisations who are moving towards accreditation or those organisations which are using some of the quality principles without being accredited or seeking accreditation.
8.2.4 Business activity
On the whole this is an area where there is more information available and maps on to our ideal framework.
What would we like to know?
We have assumed in our model that there is a link between management capability and management practice, and that this in turn impacts on business activity. Better management of innovation should lead to more innovative organisations who successfully capture market share.
l The amount of R&D activity going on in organisations
l The proportions of staff involved in R&D
l The spend on R&D

The Institute for Employment Studies 62
l The level of innovation taking place
l The success of innovation in terms of new products, processes and market uptake.
Where might we find it?
The main data source is the DTI innovation survey which does not as yet form a data series. It is a useful source however, and will be much more helpful to the model over time. As information emerges from the literature and from the work of the DTI, it may be that this survey might also collect information on the management of innovation.
Other potential sources include the World Competitiveness Indicators Yearbook on R&D personnel nation-wide per capita.
8.2.5 Corporate performance measures
Measures of corporate performance are strong in some aspects such as information on productivity and profit, but much weaker in others. We think there is a case to be made for data on different perspectives of company performance as well as financial.
What would we like to know?
l The level of customer satisfaction and customer loyalty within organisations
l the components of customer views ie views on quality of service/product, customer care, cost, speed, individual service
l the views of employees on their organisation, the support they receive, the management style, their engagement with the organisation, trust and confidence
l the performance of the company in terms of successful innovation, productivity, turnover, profit?
Data sources
We have been unable to find any data on customer satisfaction and this may be an issue for the national reporting initiative of CEML.
Data on employee satisfaction is also scant. We have identified data in the BHPS but have not yet collected or reported it. There is also an item in the World Competitiveness Indicators Yearbook on worker motivation and we have used data on industrial disputes and levels of absence as a kind of proxy measure.
Other potential measures which may warrant further investigation include the number of UK companies in the ‘World’s Most Respected Companies’ (source FT.com).

Indicators of Management Capacity: Developing a Framework 63
8.2.6 Individual outcomes
There is a logical link between capability and personal success but measures will always be comparative ie the best should do better than the rest. Ideally we would want data that enabled us to make these kinds of comparison.
What we would like to know
l The added value of education and training and development on personal career success ie being able to measure the impact on pay, promotion and periods of unemployment
l The impact of capability on relative rewards as above.
Where might we find it?
We cannot measure individual capability at present and so are limited to being able to compare different qualification levels and ongoing training and development activity with outcomes using sources such as the LFS and the BHPS. Whilst this is possible for pay and unemployment rates, it is much more difficult for promotion activity.
8.2.7 Recommendations
We think there are two possible means of filling the gaps in the framework; either by adding questions or modules to existing surveys or by creating new surveys. We believe the latter is the option that allows greatest flexibility and which is most likely to generate specific data that maps onto the framework. It is however more expensive and will take some time in terms of generating support and resources. We explore both options:
Changes to existing sources
We have taken the view that the framework should ideally focus on management skills rather than designated managers. To do so we need better information on the population of people who utilise management skills in their jobs (as opposed to those who are managers), and this knowledge needs to underpin the framework.
We also ideally would like to gather information from a number of perspectives to be able to comment on management capability with confidence, this includes the views of organisations, managers themselves at different levels in the hierarchy, the people they manage and others such as customers and colleagues.

The Institute for Employment Studies 64
Management development
The LFS is probably the most easily adjusted survey to include additional data on management development.
l We suggest that attention is given to additional questions that are designed to pursue definition of management skills as opposed to the skills of managers. This could be done by asking a question of respondents in employment to determine if they have either managerial or supervisory responsibilities.
l Questions could also be asked as to the purpose of the development ie whether part of induction into current job or employer, whether to improve skills, knowledge or performance in current job, whether to prepare for a new job or role, whether to improve promotion or career move opportunities, whether for personal development, to align with new technology, to update existing skills etc..
l More detailed questions may also be possible on the format of the training ie whether it is delivered through project working, secondments, electronic learning packages delivered to the desktop, computer based training via a learning centre, coaching or mentoring, action learning etc.. This is probably easiest to do via a prompt card.
We doubt however if the LFS can be expected to gather more detailed information on management training and development specifically, although an option might be to include a management module dropped into the LFS annually. Other options are to use specific organisational surveys such as that of the CIPD or Thomson and Mabey.
l Additional questions could be added to organisational surveys on the kind of management development taking place ie managing diversity/H&S/change/strategy/communication /performance/innovation/developing others
l Questions on the quality of development could also be included and its impact. Thomson and Mabey look at impact and success, and based on the similarity of responses, these could be joined into a single measure.
Capability
The Employers Skills Survey could probe management skill levels more explicitly as currently questions on management will only be asked if serious skill gaps are identified ie fewer than 50 per cent of managers are fully proficient. We suggest that the management skills questions are asked of all respondents as they are likely to be a key element of the experience of other skills shortages etc..

Indicators of Management Capacity: Developing a Framework 65
WERS could also pose more detailed questions on management skills and skill gaps and has the advantage of also gathering views of employees who could be asked about those aspects of management that they are most likely to experience ie managing people, developing people, supporting staff, devolution, managing diversity etc..
l we suggest exploring more explicitly the nature of skills gaps through the ESS ie probing the ability of managers at different levels to manage new technology, e-business, strategy, change, production etc..
l WERS is a very useful data set for the purposes of our framework and would be invaluable if repeated more frequently.
l We would also like to see WERS include more general information on management capability from the employer and employee perspective.
l Organisational surveys could be used to explore relative capability of UK managers compared to others eg the Community Innovation Survey could be used to evaluate relative assessments of own managers with those of competitors within own country and other countries.
Management practice
The absence of information on management practice has been noted and the best existing source we could find was WERS. The literature review might be able to focus attention on which management practices are most associated with positive performance outcomes and therefore provide information on which are the most important to collect measures. We suggest:
l WERS could then specifically collect information on the incidence of practices associated with higher levels of business performance
l and could give a better assessment of the breadth of practices ie who they apply to and how frequently they are undertaken
l some assessment of the quality of implementation might be possible though the WERS employees survey.
l More specifically, information on the adoption of quality practices as well as quality standards might be included.
l We would hope that the CIS is maintained and consideration could be given to include questions on the management of innovation as well as innovation activity.

The Institute for Employment Studies 66
Corporate Outcomes
We have noted that there is no data on customer satisfaction and could also find no existing surveys that might be a vehicle for a more explicit review.
As we understand it, the corporate reporting initiative of CEML has recommended that a number of soft measures should be included in accounting returns. The measurement of customer satisfaction should be considered.
Individual outcomes
There are gaps in being able to identify positive job moves and the LFS is the survey best placed to capture this information.
l A question could be posed in LFS of those who have experienced job moves in the last year to explore whether this was a promotion, sideways move to a better job, demotion and whether the move was voluntary, made by the employer or for other reasons.
l The LFS or the BHPS could be used to ask if the respondent feels that any training they have received has led to positive job outcomes ie increased pay, increased responsibility etc..
The AMBA survey could also be very useful with some minor changes or could serve as a model for other surveys.
New data
Additions to existing surveys may certainly help close some of the gaps in the model but these surveys were all developed for other purposes, and some like the LFS are under great pressure for additional questions. If there is a serious desire to understand the quality of management capability in the UK and the ways in which it is changing over time, we need to specifically ask questions of individuals who practice management and of organisations who utilise these skills. The option we most favour is a dedicated management capability survey of a representative sample of managers (determined through gaining a measure of management via the LFS) that looks explicitly at management capability and covers the various aspects of the model ie development of managers, qualification levels, capability, and management practice. This could either be a stand alone household survey or an explicit element of the Skills Survey (Felstead, Gallie and Green, 2002).
Another option would be to develop a brief survey of chief executives (perhaps in conjunction with a national newspaper) that would gather some key data, as the world competitive indicators does. This survey would ask a few key attitudinal questions on management capability.

Indicators of Management Capacity: Developing a Framework 67
More complex analysis of existing survey evidence
We also feel that there is a case for more complex analysis of existing surveys where they provide evidence across a number of the boxes of the framework. The LFS and the BHPS are both examples of individual surveys that collect data on development, qualifications and some element of individual outcomes that could be analysed more rigorously to understand the relationships across the framework.
There is also the possibility of measuring across a number of existing organisational surveys linked through the respondent ‘unique identifier’. We suggest a pilot study to examine the feasibility of this ie to identify which surveys might provide useful information for the framework and then to explore the size of the sample that has responded to several surveys and for which richer information might exist. We understand that the DTI might be willing to fund such a study.
8.2.8 Priorities
We have made numerous suggestions for meeting the gaps in the framework. We suggest the most pressing areas for action are consideration of:
l Commissioning a literature review on evidence for the linkages across the model.
l The amendment of ‘ideal’ indicators in the light of the literature.
l The use of the ESS to include questions of all respondents on management capability. As we understand it, the ESS will become the responsibility of the LSC in the coming year and therefore discussions should be opened with them
l The review of WERS to include questions on capability and to review the questions asked on management activity
l Repeating WERS more regularly
l Additional questions in LFS or the creation of a management module that might be placed annually, on purpose of the training and development of managers and some assessment of its usefulness and impact
l And most importantly we believe, the development of a management capability survey or an explicit addition to the Skills Survey (Felstead, Gallie and Green, 2002).
8.3 Conclusions from the data
Given all we have just said it should not be surprising that we feel that the current version of the framework does not give clear messages on management capability within the UK. There are

The Institute for Employment Studies 68
obviously major measurement issues in that much ideal data is not available or cannot take into account all of the intervening factors that might be important (spelt out in the IER literature review).
At this stage what is clear is that not all indicators point in the same direction, that some are woefully lacking and others lack a time series that might create a more reliable picture.
8.3.1 The model
l The development of capability would seem to indicate that managers are becoming proportionally more qualified, but that levels of ongoing training and development are in decline. This includes enrolments for management and business related HE and FE courses. Data would appear to indicate that informal methods of development are becoming proportionally more frequent compared to formal.
l Trends in management capability are not clear from the data we have, and the same is true regarding management practice. Quality indicators show an increase in engagement with quality initiatives but from a very low base for ISO and EFQM. The evidence indicates that the growth in IiP is likely to slow.
l The data we have, indicates that there are quite good personal benefits to managers of being better qualified (and better trained).
Table 8.1: Summary of findings
Aspect of the model Indicator Direction of trend
Development of capability Education levels
Training and development activity
Training and development provision
⇑
⇓
⇔
Capability ESS proficiency ⇔
Management activity Business practice ie HRM
Quality
⇔
⇑
Business activity Innovation in manufacturing
Innovation in service
Patents
⇓
⇑
⇓
Business outcome Customer satisfaction
Employee satisfaction
Productivity
⇔
⇔
⇑
Individual outcomes Salary growth
Promotions
Employment activity
⇑
⇔
⇑ Key:

Indicators of Management Capacity: Developing a Framework 69
Improving ⇑ Declining ⇓ Insufficient trend data ⇔
Source: IES, 2001
l Corporate performance indicators are lacking for key stakeholders of employees and customers. Business performance indicators suggest improvements in productivity although the UK still lags our competitors, the gap is closing on all bar the US. Company insolvencies show an increase.
Without much better data on management capability and management practices we feel that the framework has too many gaps to draw strong conclusions. We do however think the exercise has been worthwhile and the further population and ongoing maintenance of the framework will serve to deliver the original objectives ie to attract attention to the issue of management and leadership capacity in the UK and allow the identification of trends over time and to inform the development of policy. Including, we might add, the means to develop additional indicators. We believe that once attention is focused on this issue, additional information will be forthcoming of value to the framework.
8.3.2 What next?
We suggest a number of steps that should be considered next:
l Wider consultations on the form, content and value of the framework
l Wider consultation on better ways of populating it with the aim of building a momentum of commitment, interest and activity to fill it.
l A ‘home’ for the framework and its subsequent, ongoing development and population.
We suggest that CEML or its successor might wish to co-ordinate a wider debate amongst key interested parties as to the framework and the issues we have raised.

The Institute for Employment Studies 70
9. Notes on CEML data
9.1 Presentation of the data
l Absolute numbers v proportions — most of the data come in absolute numbers, ie x’000 managers doing this or y number of training days. Where ever possible we have sought to contextualise the data by expressing as a proportion of the relevant population. In some cases we still need to decide the best way to present the data and in all cases, where possible, we would seek to express them as trends over time.
l Individuals or organisations — as in the previous version of the framework data can be based on individuals (ie managers) or organisations (with management). We have included both types of data in the framework, although there may be concerns about their compatibility.
l Linked data sets — the more comprehensive data sets include information on all aspects of the framework. The Labour Force Survey for example ask individuals (including managers) about their training and development activity, their employment history and (to a limited extent) their income. This means that comparisons can be carried out within the data set (and in some cases by linking the data to other sources, eg Dearden et al.). Other data sources are more limited in scope, eg the New Earnings Survey is the most comprehensive source of information on managers’ pay, but does not collect any information on say development or training activity or skill levels. We have focussed on data that are most relevant for the indicators, rather than data which might lend themselves to multi-variable analysis, which might be more interesting for research purposes (see below).
l Definitions of managers — where available we have used the 2000 version Standard Occupational Classification and concentrated on Class 1: ‘Managers and senior officials’. The earlier version of the classification system (SOC 1990) had a slightly different definition of ‘managers and administrators’.

Indicators of Management Capacity: Developing a Framework 71
9.2 Data used
9.2.1 The Labour Force Survey
National level data for SOC group 1 (managers and senior officials). Data used for CEML is from every Spring Quarter from 1995 to 2001 with the exception of data on who pays fees for training which is from winter quarters. Not all variables go back as far as 1995 but they have been collected as far as possible.
9.2.2 WERS
Began in 1980 and was subsequently collected in 1984 and 1990. Most recent data collected in 1998 which is the only one in the CEML time-span. A date for the next survey has not been set although there should be one in the future.
The survey is divided into two sections:
l The Panel Questionnaire – covers a random selection of 2,061 workplaces who had taken part in the 1990 survey. Not much of use to CEML in this data.
l The Cross Sectional Questionnaire (made up of management questionnaire, worker representative questionnaire and survey of employees) — 846 workplaces who had taken part in the 1990 survey.
We have used the management questionnaire (completed by 2,000 managers) and the employee questionnaire (completed by 30,000 employees) .
9.2.3 New Earnings Survey
National individual level data and the sample coverage is one per cent of all employees on PAYE. Data is collected annually and began in 1975. We have data from 1999 to 2001 which was extracted from NOMIS and data from 1995 to 1998 which was provided by ONS.
9.2.4 Employer Skills Survey
We have 1999 data from the ESS Statistical Report and 2001 extracted directly from the data. The 1999 data covered companies with more than four employees so the data extracted from 2001 data has companies with four or less employees excluded in order to make the data comparable.

The Institute for Employment Studies 72
9.2.5 MBA Salary and Career Survey
Surveys carried out in 1992, 1995, 1997 and 1999. Survey covers 6,400 graduate members of the association of MBA’s. For CEML we have used data from the 1997 and 1999 reports. We have been unable to obtain the report on the 1995 data from the Association of MBA’s.
9.2.6 UCAS Statistical Database
Annual data from 1996 downloaded from the UCAS website. Sample covers all applicants through UCAS to business management courses.
9.2.7 HESA First Destination Statistics and Student Statistics
Coverage is students from publicly funded HE institutions in the UK (not including those of EU domicile who are studying in the UK). Sample size is 233,130 out of 302,170 qualifying (77 per cent response rate). Our data covers graduates from first degrees in business management.
9.2.8 Thomson and Mabey
Survey includes 500 telephone interviews with the person responsible for human resource development within an organisation in 2000. Data was collected in the same format as two surveys in 1996 (although different organisations sizes were involved).
9.2.9 DTI UK Innovation Survey
Started in 1998 and is collected annually. The UK did not take part in the first survey (1998) and the third survey results (2000) have not yet been published. We have some data from the second survey (1999) but have not been able to get access to all data – only what has been published in reports. Organisational level data.
9.2.10 CIPD Training Survey
An annual survey which began in 1999. Latest survey (2001) was collected from CIPD members with 25 or more employees. Data collected from 502 managers/directors at organisational level. We have all three reports but the latest survey asks slightly different questions or has different response categories which means it cannot be compared with older data. Therefore, we have only used 2001 data. However, data is likely to be collected in the same format in the future.

Indicators of Management Capacity: Developing a Framework 73
9.2.11 IiP
Data extracted from IiP management reports which are produced quarterly and published on the website. The totals are cumulative and therefore include all recognition’s and commitments to date.
9.2.12 DfES Learning and Training at Work
Annual survey which began in 1999. Consists of 4,000 interviews with employers who have one or more employees. Results are weighted to population estimates from the Annual Business Inquiry. We have full data from 2000, most of which is comparable to the 1999 data. The 2001 data has not yet been released but some headline figures are available and have been used where applicable.
9.2.13 DfEE Business Benefits of Management Development
One off survey of 127 firms in 1997/1998. Firms that had undertaken management development were targeted and had at least six months experience post management development.
9.2.14 CE Graduate Tracking Survey
One off survey of 1,050 people graduating in 1998. Data collected in 2001. Participants were all management studies graduates or had progressed to a job with supervisory responsibility.
9.2.15 DTI Insolvency Statistics
Annual insolvency figures from 1995 to 2001 obtained from the DTI website. Collected separately for England/Wales and Scotland. Figures are derived from the records of the DTI insolvency service and Companies House. Company insolvencies include compulsory liquidations and creditors voluntary liquidations. Percentage of all companies figures are calculated using the number of registered companies at Companies House.
9.2.16 Lloyds TSB Management Development
One off survey which forms part of a series of business management reports based on firms largely in manufacturing, retail and business services. The survey received responses from 350 small (fewer than 50 employees) businesses in Britain. Survey carried out in 1999.

The Institute for Employment Studies 74
9.2.17 FEFC/LSC
Data provided by the LSC from their keyfacts enrolments spreadsheets. Totals include all FE qualifications (whether funded by the FEFC/LSC or not). We have data from 1995 onwards.
9.2.18 BHPS
Data collected annually over 9 waves. Began in 1999 – most recent is 2000. National household survey. Original sample was of 10,000 people within 5,000 households. Collected by ISER.
9.2.19 ISO9000
We have the number of certificates granted from 1995 to 2001. Percentage of companies with certificates has been calculated using the number of registered UK companies at Companies House.
9.2.20 CBI UK Innovation
A one-off web based survey of 356 UK companies in 2000.
9.2.21 Patents
Have the number of European patents granted to the UK and the percentage of European patents granted to the UK (note with these percentages that although the patents are for Europe they may be granted to countries world-wide — overall about half of European patents are granted to European countries). We have data from 1996 to 2001. 1995 data was not available.
9.2.22 QCA NVQ Statistics
Data provided by QCA on the number of Management NVQ’s awarded at the end of each academic year between 1995 and 2001.
9.2.23 GDP per hour worked
Data collected from Eurostat comparing the UK with the EU15.
9.2.24 British Quality Foundation
Number of companies who are members of the British Quality Foundation extracted from the BQF Directors Reports. Percentage of UK companies who are members is calculated using the total number of registered companies at Companies House.

Indicators of Management Capacity: Developing a Framework 75
10. References
Barber L, Hayday S, Bevan S (1999), From People to Profits, IES Report No. 355
Bosworth D, Wilson R (2002), Report on IES Framework for the DTI, IER
Bosworth D, Davies R, Hogarth T, Wilson R, Shury J (2000), Employers Skills Survey: Statistical Report, DfEE
Bosworth D (1999), Empirical evidence of management skills in the UK Skills Task Force Research Paper 18, SKT 23, DfEE
Bosworth D and Massini S (xxxx) Management Skills and Skill Deficiencies UMIST
British Quality Foundation (2000), Directors Report
CBI (2001), A question of culture? Collaborative innovation in UK business, Confederation of British Industry, 3M, Design Council
CEL (2001), Graduate Tracking Survey, CEML
CIPD (2001) Training and Development Survey Report, CIPD
Campbell M (2001), Skills in England, 2001, DfES
Cheetham G and Chivers G (1996) ‘Towards a holistic model of professional competence’, Journal of European Industrial Training’, 20, 5: 20-30
Craggs A, Jones P (1998), UK Results from the Community Innovation Survey, DTI
Dearden L, Reed H, Van Reenen J (2000), Who Gains When Workers Train?, Institute for Fiscal Studies
Department for Trade and Industry (2001), UK Competitiveness Indicators
DTI (2001), Insolvency Press Notice: Company Insolvencies, Department of Trade and Industry

The Institute for Employment Studies 76
DTZ Pieda Consulting (1998), The evaluation of the business benefits of management development, DfEE Research Report No. RR66, Sheffield
Employers Skills Survey (2001), DfES
European Patent Office (2000), Annual Report, EPO
European Patent Office (1999), Annual Report, EPO
European Patent Office (1998), Annual Report, EPO
European Patent Office (1997), Annual Report, EPO
European Patent Office (1996), Annual Report, EPO
Flestead A, Gallie D, Green F (2002), Work Skills in Britain 1986-2001, DfES Publications WSB1, 2002
Haskel J, Holt R (1999), Anticipating Future Skill Needs: Can it be Done? Does it need to be Done?, Skills Task Force Research Paper 1
HESA (2001), First Destinations of Students Leaving HE Institutions 1999/2000, Higher Education Statistics Agency
HESA (2001), Students in Higher Education Institutions 1999/2000, Higher Education Statistics Agency
HESA (2000), First Destinations of Students Leaving HE Institutions 1998/1999, Higher Education Statistics Agency
HESA (2000), Students in Higher Education Institutions 1998/1999, Higher Education Statistics Agency
HESA (1999), First Destinations of Students Leaving HE Institutions 1997/1998, Higher Education Statistics Agency
HESA (1999), Students in Higher Education Institutions 1997/1998, Higher Education Statistics Agency
HESA (1998), First Destinations of Students Leaving HE Institutions 1996/1997, Higher Education Statistics Agency
HESA (1998), Students in Higher Education Institutions 1996/1997, Higher Education Statistics Agency
HESA (1997), First Destinations of Students Leaving HE Institutions 1995/1996, Higher Education Statistics Agency
HESA (1997), Students in Higher Education Institutions 1995/1996, Higher Education Statistics Agency

Indicators of Management Capacity: Developing a Framework 77
HESA (1996), First Destinations of Students Leaving HE Institutions 1994/1995, Higher Education Statistics Agency
HESA (1996), Students in Higher Education Institutions 1994/1995, Higher Education Statistics Agency
HM Treasury (nd), Productivity in the UK: The Evidence and the Government’s Approach , The Stationary Office
IER (2001), Projections of Occupations and Qualifications 2000/2001, University of Warwick for the DfEE
IFF Research (2000), Learning and Training at Work 1999, DfEE Research Report RR202
IMD (2001), World Competitiveness Yearbook
IPD (2000), Training and Development in Britain, Institute of Personnel and Development
IPD (1999), Training and Development in Britain, Institute of Personnel and Development
Investors in People (2001), Management Information Report – period 4, Investors in People UK
Investors in People (1999), Management Information Report – period 4, Investors in People UK
Investors in People (1998), Management Information Report – period 6, Investors in People UK
International Organisation for Standardisation (2000), The ISO Survey of ISO9000 and ISO14000 Certificates
Johnson S (1999), Management Skills, Skills Task Force Research Paper 3
Labour Force Survey, Office of National Statistics
Learning and Skills Council (2002), Enrolment Figures from keyfacts Enrolments Spreadsheets
Lloyds TSB Small Business Research Trust (1999), Quarterly Small Business Management Report: Management Development, Open University Business School
MBA Salary and Career Survey (2000), Association of MBA’s
MBA Salary and Career Survey (1997), Association of MBA’s
Mabey C, Thomson A (2001), The Learning Manager, Institute of Management

The Institute for Employment Studies 78
Mabey C, Thomson A (2000), Achieving Management Excellence: A Survey of UK Management Excellence at the Millennium, Institute of Management
New Earnings Survey (2001), Office of National Statistics
ONS (2002), Learning and Training at Work 2001 First Release, DfES
ONS (2002), International Comparisons of Productivity, Office of National Statistics
QCA Data News (2002), Data from Annual NVQ Statistics Supplement, QCA
Patterson M, West M et al. (1997), Impact of People Management Practices on Business Performance, IPD
Richardson R, Thompson M (1999), ‘The Impact of People Management Practices on Business Performance’, Issues in People Management, CIPD
Spilsbury D (2000), Learning and Training at Work, IFF for the DfEE, DfEE Research Report 269
Tamkin P, Hillage J (1997), Management Development in the UK: A Framework of Indicators, a report for the MCI
Thomson A, Storey J et al. (1998), Management Development, The Association of MBA’s
Universities and Colleges Admissions Service (2001), UCAS Statistical Database Online
Williams S (2001), Upstream, downstream: The flow and stock of UK managers, a report for CEML, Centre for the Study of Education and Training, Lancaster University
Williams S (2001), Diversity in the management and Leadership Population, CEML
Williams S (2001), Non-Higher Education Qualifications in Business and Management, Centre for the Study of Education and Training, Lancaster University
Winterton J, Parker M et al. (2000), Future Skill Needs of Managers, Employment Research Institute & York Consulting
Workplace Employee Relations Survey (1998), Department of Trade and Industry, Economic and Social Research Council, Policy Studies Institute