Embed Size (px)
Citation preview
INDICATORS OF ICT APPLICATION
IN SECONDARY EDUCATION
OF SOUTH−EAST EUROPEAN COUNTRIES
UNITED NATIONS EDUCATIONAL, SCIENTIFIC AND CULTURAL ORGANIZATION
UNESCO INSTITUTE FOR INFORMATION TECHNOLOGIES IN EDUCATION
UNESCO IITE SUB−REGIONAL PROJECT FOR SOUTH−EASTERN EUROPE INFORMATION AND COMMUNICATION TECHNOLOGIES FOR THE DEVELOPMENT OF EDUCATION AND THE CONSTRUCTION OF A KNOWLEDGE SOCIETY
STATISTICAL SURVEY
MOSCOW 2005

2
UNESCOUNESCO Institute for Information Technologies in Education (IITE)
© UNESCO Institute for Information Technologies in Education, 2005
All rights reserved
Printed in the Russian Federation
AUTHOR
Petia Assenova
IITE PROJECT COORDINATOR
Boris Kotsik
UNESCO IITE SUB-REGIONAL PROJECT FOR SOUTH-EASTERN EUROPE INFORMATION AND COMMUNICATION TECHNOLOGIES FOR THE DEVELOPMENT
OF EDUCATION AND THE CONSTRUCTION OF A KNOWLEDGE SOCIETY
Indicators of ICT Application in Secondary Education of South-East European Countries. Statistical survey
The survey Indicators of ICT Application in Secondary Education of South-East European Countries aims at investigating
the main factors, tendencies, problems and solutions for ICT applications in secondary schools of South-Eastern
Europe, at collecting data and at developing recommendations stimulating national educational policies, strategies and
their implementation.
Thе survey presents the results of the statistical research Indicators of ICT Application in Secondary Education
accomplished within the framework of the UNESCO IITE sub-regional project for South-Eastern Europe Information
and Communication Technologies for the Development of Education and the Construction of a Knowledge Society.
FOR FURTHER INFORMATION PLEASE CONTACT:
UNESCO Institute for Information Technologies in Education
8 Kedrova St. (Bld. 3), Moscow, 117292, Russian Federation
Tel.: 7 095 129 2990
Fax: 7 095 129 1225
E-mail: [email protected]
Web: www.iite.ru

TABLE OF CONTENTS
FOREWORD .............................................................................................................................................................. 4
ABBREVIATIONS ...................................................................................................................................................... 5
DESCRIPTION OF THE RESEARCH ....................................................................................................................... 6
Organization of the Research ................................................................................................................................ 7
System of Indicators ............................................................................................................................................. 8
Study Results ....................................................................................................................................................... 9
Indicators Group 1. National ICT Policy and Action Plan.................................................................................. 9
Indicators Group 2. Statistics ...................................................................................................................... 12
2.1. Computer Equipment ..................................................................................................................... 12
2.2. Internet Access .............................................................................................................................. 15
2.3. School Personnel – Level of Experience ........................................................................................... 18
GENERAL CONCLUSIONS AND RECOMMENDATIONS ................................................................................... 24
REFERENCES ......................................................................................................................................................... 25
APPENDIX 1. Basic Indicators .................................................................................................................................. 26
APPENDIX 2. List of Persons Responsible for Submission of Information ................................................................. 28
APPENDIX 3. Questionnaire Used for Data Collection ............................................................................................. 29
APPENDIX 4. National Policies of Bulgaria and Croatia in the Sphere of ICT Application in Education ................... 35
APPENDIX 5. Summary Table of Statistics Data ........................................................................................................ 37
LIST OF DIAGRAMS
Diagram 1.Percentage of schools with computer classrooms ................................................................................ 13
Diagram 2.Average number of students per computer in schools with computer classrooms ................................. 14
Diagram 3. Percentage of schools having computer classrooms equipped with computers not older than 1995 .......... 14
Diagram 4. Percentage of schools with a local network in the total number of schools with computer classrooms .. 15
Diagram 5. Percentage of schools with Internet access via dial-up connection (IC) and via dedicated channel (ID) .... 17
Diagram 6. Percentage of schools with e-mail only .............................................................................................. 17
Diagram 7. Percentage of schools having their own web sites ................................................................................ 18
Diagram 8. Percentage of elementary school teachers (TE1), teachers of Informatics and/or Information
technologies (TI1), teachers of other subjects (TO1) and administrators (AD1) who have taken
computer literacy courses of less than 30 hours .................................................................................. 20
Diagram 9. Percentage of elementary school teachers (TE2), teachers of Informatics and/or Information
technologies (TI2), teachers of other subjects (TO2) and administrators (AD2) who have
taken computer literacy courses 30–70 hours ..................................................................................... 21
Diagram 10. Percentage of elementary school teachers (TE3), teachers of Informatics and/or Information
technologies (TI3), teachers of other subjects (TO3) and administrators (AD3) who have taken
computer literacy courses of more than 70 hours .............................................................................. 22
Diagram 11. Percentage of elementary school teachers (TEE), teachers of Informatics and/or Information
technologies (TIE), teachers of other subjects (TOE) and administrators (ADE) with elementary computer skills ................................................................................................................................. 22
Diagram 12. Percentage of elementary school teachers (TEA), teachers of Informatics and/or Information technologies (TIA), teachers of other subjects (TOA) and administrators (ADA) with advanced computer skills ................................................................................................................................. 23
LIST OF TABLESTable 1. Presence or absence of the following in the implementation of the national policies on ICT
application in education .................................................................................................................... 10
Table 2. ICT national curriculum ................................................................................................................... 11
Table 3. Level of ICTs introduction as a separate subject ................................................................................. 12
3

FOREWORD
A number of UNESCO programmes aims at education development. One of the main UNESCO programmes
Education for All emphases the provision of basic education for everyone by renewing educational systems and
informational support for them. The programme includes analysis of the national policies and strategies, and activities
expanding the role of knowledge and communications among all actors of education.
Following these objectives UNESCO educational programmes raise the role of education exchanging qualitative
information and knowledge at international, national and regional levels. It could be achieved by promoting the
application of information and communication technologies (ICTs) in education in different aspects – management
of education, information support, and teaching.
Although, European countries are advanced technologically as a whole, Europe exposes a diversity of situations and
some contrast between Western and South-Eastern countries. Alongside with countries with highly developed
education systems employing advanced teaching approaches and newest ICTs, there are other states that are only in
initial stages of deploying such tools. UNESCO is challenged to help alleviate a growing gap in educational
development and delivery systems, especially by assisting the South-East European countries.
To ensure the free flow of, and equitable access to knowledge, information, data and best practices on ICT application
in education, the UNESCO Institute for Information Technologies in Education (IITE) has launched sub-regional
project for South-Eastern Europe Information and Communication Technologies for the Development of Education and
the Construction of a Knowledge Society funded by the Japanese Funds-in-Trust for the Capacity Building of Human
Resources. Nine countries from the region are involved in the project: Albania, Bosnia and Herzegovina, Bulgaria,
Croatia, former Yugoslav Republic of Macedonia (FYRO Macedonia), Republic of Moldova, Romania, Serbia and
Montenegro, and Turkey.
Ministries of education, national commissions for UNESCO, pre- and in-service pedagogical institutions and national
focal points for cooperation with IITE coordinate the events under the project at the national level. At the international
level the activities are coordinated and supported by IITE.
The report presents the results of the statistical survey Indicators of ICT Application in Secondary Education of South-
East European Countries within the framework of the project.
4
Abbreviations for participating countries
5
ALB Albania
BIH Bosnia and Herzegovina
BUL Bulgaria
CRO Croatia
MCD FYRO Macedonia
MOL Republic of Moldova
ROM Romania
SCG Serbia and Montenegro
ABBREVIATIONS
IT – information technologies
ICTs – information and communication technologies
EI – educational institutions
OS – operational systems
SEE – South-Eastern Europe
GDP – gross domestic product

DESCRIPTION OF THE RESEARCH
The survey Indicators of ICT Application in Secondary Education of South-East European Countries aims at investigating
the main factors, tendencies, problems and solutions for ICT applications in secondary schools of the South-Eastern
Europe (SEE), at collecting data and developing recommendations to stimulate national educational policies, strategies
and their implementation.
To start the activity IITE held the expert meeting Indicators of ICT Application in Secondary Education within the
framework of the IITE sub-regional project for SEE Information and Communication Technologies for the Development
of Education and the Construction of a Knowledge Society in Bucharest, Romania, in February 2004. National specialists
and experts responsible for educational statistics were invited to discuss the procedures of data collection and analysis
for the survey.
During the meeting IITE presented the results of the similar research carried out by IITE for CIS countries. IITE
experts suggested exemplary questionnaires for data collection. The participants of the meeting found the research
topical for their countries and agreed to participate in further activities. Special discussion was devoted to the analysis
of the proposed questionnaires to make up the appropriate one for the study.
On the basis of suggestions and recommendations of the expert meeting IITE developed the questionnaire which was
consequently used in the study.
As indicated in the IITE position paper Information and Communication Technologies in Secondary Education “the
unique role of ICTs in improving education quality is based on their ability to effectively facilitate the fulfilment of both
necessary and sufficient conditions for receiving quality education. The necessary conditions would include such
educational components as:
• well-equipped classrooms and lecture halls;
• highly professional administrators in managerial positions at the educational institutions;
• highly qualified teaching and technical personnel;
• easy access for students and teachers to quality textbooks and professional literature as well as to modern teaching
aids and supplementary information.”
The questionnaire for the survey was based on a system of indicators reflecting necessary conditions of education
quality. It included questions concerning national ICT policy and action plan; financial support; educational target
groups; ICT curriculum, computer equipment, and ICT school staff.
Almost all participating countries submitted the required data. Figure 1 presents the survey geography.
6
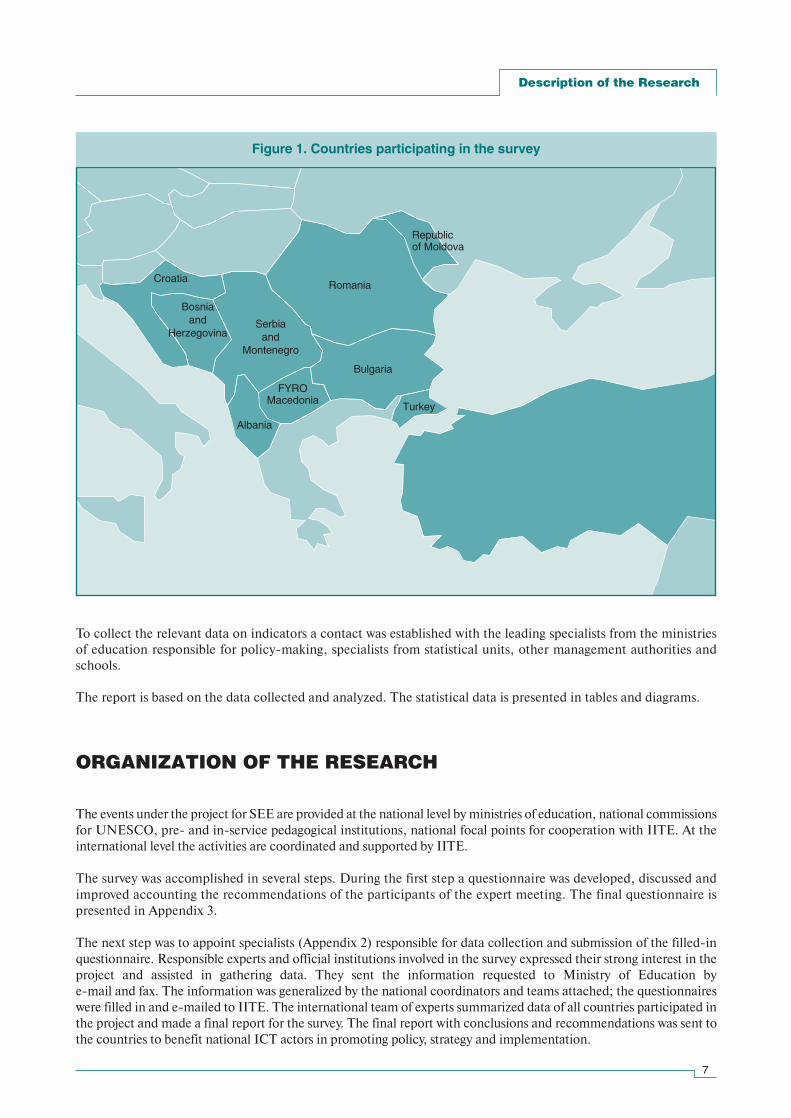
To collect the relevant data on indicators a contact was established with the leading specialists from the ministries
of education responsible for policy-making, specialists from statistical units, other management authorities and
schools.
The report is based on the data collected and analyzed. The statistical data is presented in tables and diagrams.
ORGANIZATION OF THE RESEARCH
The events under the project for SEE are provided at the national level by ministries of education, national commissions
for UNESCO, pre- and in-service pedagogical institutions, national focal points for cooperation with IITE. At the
international level the activities are coordinated and supported by IITE.
The survey was accomplished in several steps. During the first step a questionnaire was developed, discussed and
improved accounting the recommendations of the participants of the expert meeting. The final questionnaire is
presented in Appendix 3.
The next step was to appoint specialists (Appendix 2) responsible for data collection and submission of the filled-in
questionnaire. Responsible experts and official institutions involved in the survey expressed their strong interest in the
project and assisted in gathering data. They sent the information requested to Ministry of Education by
e-mail and fax. The information was generalized by the national coordinators and teams attached; the questionnaires
were filled in and e-mailed to IITE. The international team of experts summarized data of all countries participated in
the project and made a final report for the survey. The final report with conclusions and recommendations was sent to
the countries to benefit national ICT actors in promoting policy, strategy and implementation.
7
Description of the Research
Figure 1. Countries participating in the survey
Republic of Moldova
Romania
Bulgaria
Croatia
Bosnia and
HerzegovinaSerbia
andMontenegro
Albania
FYROMacedonia
Turkey

SYSTEM OF INDICATORS
The survey questionnaire aims at exploring the main factors important for effective implementation of national
education policy.
The questionnaire includes 18 questions that could be grouped according to the following topics:
Indicators Group 1: National ICT Policy and Action Plan. This group focuses on existing picture; means of
implementation; financial support; curricula; educational software; at what level ICTs are taught first. The picture is
drawn on the lists of the official documents on ICT usage in secondary education (D); government curricula for
Informatics/Information technologies as separate subjects (PR), ICTs as a separate course (SI) and integration of ICTs
in other subjects (SS).
Indicators Group 2: Statistics. This group draws attention to computer equipment of schools; the average number of
students per one computer; Internet access; type of connection; availability of e-mail and school web sites; types of
software installed; ICT school staff (teachers of Informatics/ICTs and teachers of other subjects) – level of their
experience. In particular, this group is presented by the following indicators:
• Percentage of schools with computer classrooms (SC);
• Average number of students per computer in schools with computer classrooms (NC);
• Percentage of schools having computer classrooms with computers not older than 1995 (SCN);
• Percentage of schools with a local network in the total number of schools with computer classrooms (SCL);
• Percentage of schools without Internet access (IO);
• Percentage of schools with e-mail only (IL);
• Percentage of schools with access via dial-up connection (IC);
• Percentage of schools with access via dedicated channel (ID);
• Percentage of schools having their own web sites (IW);
• Elementary school teachers (TE);
• Teachers of Informatics and/or Information technologies (TI);
• Teachers of other subjects (excluding Informatics or Information technologies) (TO);
• Administrators (AD);
• Percentage of elementary school teachers with elementary computer skills (TEE);
• Percentage of elementary school teachers with advanced computer skills (TEA);
• Percentage of teachers of Informatics and/or Information technologies with elementary computer skills (TIE);
• Percentage of teachers of Informatics and/or Information technologies with advanced computer skills (TIA);
• Percentage of teachers of other subjects (excluding Informatics or Information technologies) with elementary
computer skills (TOE);
• Percentage of teachers of other subjects (excluding Informatics or Information technologies) with advanced
computer skills (TOA);
• Percentage of administrators with elementary computer skills (ADE);
• Percentage of administrators with advanced computer skills (ADA).
Refer to Appendix 1 for the detailed list of data indicators, conventional symbols, and calculation methods.
These indicator groups defined the content of the questionnaire’s guidelines for the survey Indicators of ICT Application
in Secondary Education of South-East European Countries.
8
INDICATORS OF ICT APPLICATION IN SECONDARY EDUCATION...
Country 1990 1999
Croatia ... 4.2
Bulgaria 5.2 ...
Republic of Moldova ... 4.0
Turkey 2.2 3.7
Romania 2.8 3.5
FYRO Macedonia ... 4.1
STUDY RESULTS
Indicators Group 1. National ICT Policy and Action Plan
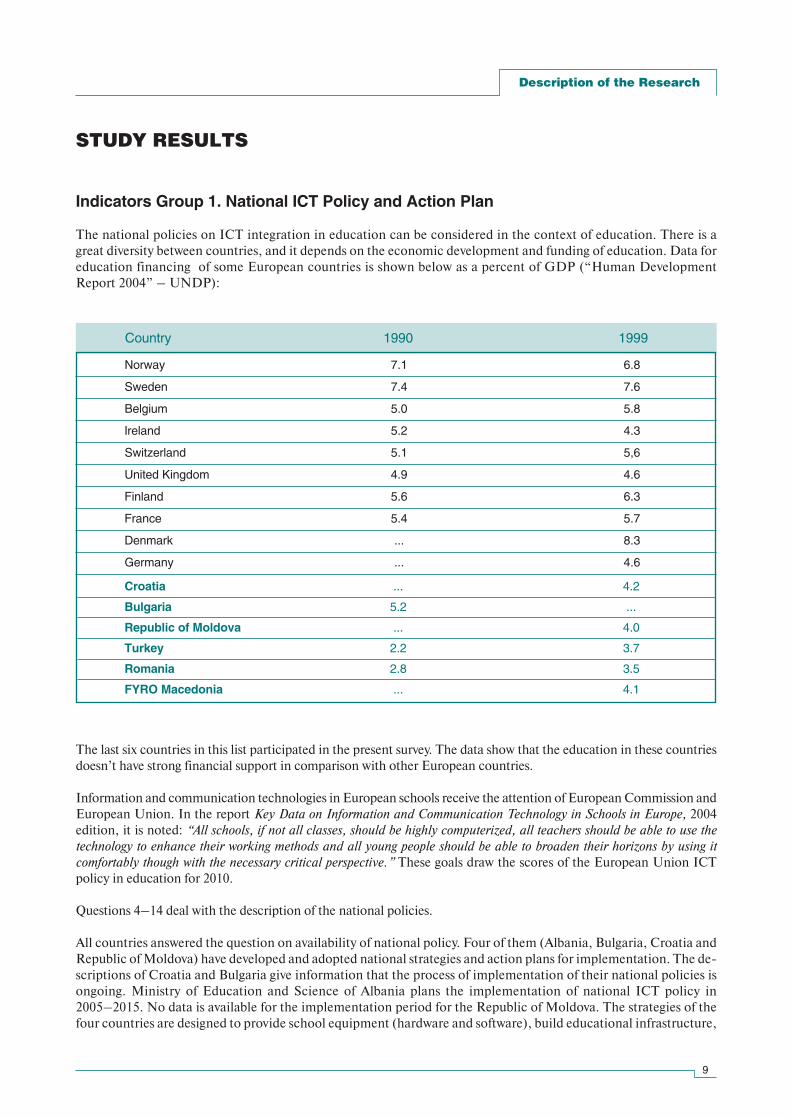
The national policies on ICT integration in education can be considered in the context of education. There is a
great diversity between countries, and it depends on the economic development and funding of education. Data for
education financing of some European countries is shown below as a percent of GDP (“Human Development
Report 2004” – UNDP):
9
Norway 7.1 6.8
Sweden 7.4 7.6
Belgium 5.0 5.8
Ireland 5.2 4.3
Switzerland 5.1 5,6
United Kingdom 4.9 4.6
Finland 5.6 6.3
France 5.4 5.7
Denmark ... 8.3
Germany ... 4.6
Description of the Research
The last six countries in this list participated in the present survey. The data show that the education in these countries
doesn’t have strong financial support in comparison with other European countries.
Information and communication technologies in European schools receive the attention of European Commission and
European Union. In the report Key Data on Information and Communication Technology in Schools in Europe, 2004
edition, it is noted: “All schools, if not all classes, should be highly computerized, all teachers should be able to use the
technology to enhance their working methods and all young people should be able to broaden their horizons by using it
comfortably though with the necessary critical perspective.” These goals draw the scores of the European Union ICT
policy in education for 2010.
Questions 4–14 deal with the description of the national policies.
All countries answered the question on availability of national policy. Four of them (Albania, Bulgaria, Croatia and
Republic of Moldova) have developed and adopted national strategies and action plans for implementation. The de-
scriptions of Croatia and Bulgaria give information that the process of implementation of their national policies is
ongoing. Ministry of Education and Science of Albania plans the implementation of national ICT policy in
2005–2015. No data is available for the implementation period for the Republic of Moldova. The strategies of the
four countries are designed to provide school equipment (hardware and software), build educational infrastructure,
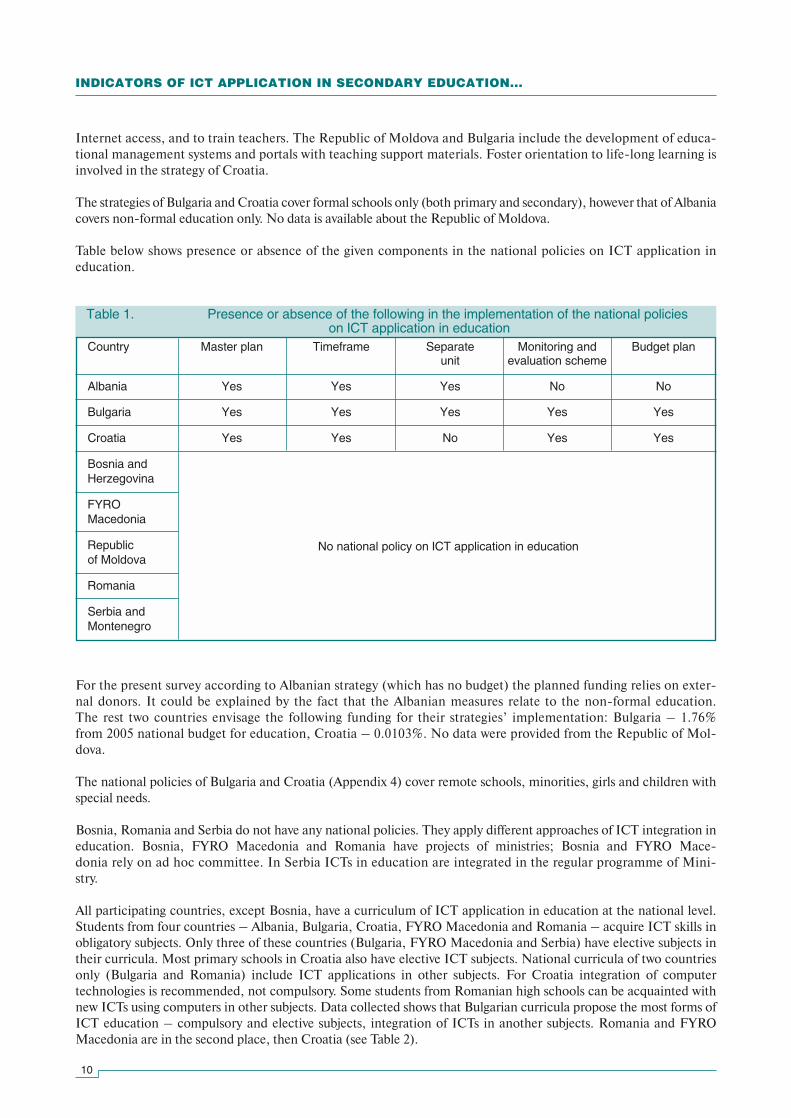
Table 1. Presence or absence of the following in the implementation of the national policies on ICT application in education
Internet access, and to train teachers. The Republic of Moldova and Bulgaria include the development of educa-
tional management systems and portals with teaching support materials. Foster orientation to life-long learning is
involved in the strategy of Croatia.
The strategies of Bulgaria and Croatia cover formal schools only (both primary and secondary), however that of Albania
covers non-formal education only. No data is available about the Republic of Moldova.
Table below shows presence or absence of the given components in the national policies on ICT application in
education.
For the present survey according to Albanian strategy (which has no budget) the planned funding relies on exter-
nal donors. It could be explained by the fact that the Albanian measures relate to the non-formal education.
The rest two countries envisage the following funding for their strategies’ implementation: Bulgaria – 1.76%
from 2005 national budget for education, Croatia – 0.0103%. No data were provided from the Republic of Mol-
dova.
The national policies of Bulgaria and Croatia (Appendix 4) cover remote schools, minorities, girls and children with
special needs.
Bosnia, Romania and Serbia do not have any national policies. They apply different approaches of ICT integration in
education. Bosnia, FYRO Macedonia and Romania have projects of ministries; Bosnia and FYRO Mace-
donia rely on ad hoc committee. In Serbia ICTs in education are integrated in the regular programme of Mini-
stry.
All participating countries, except Bosnia, have a curriculum of ICT application in education at the national level.
Students from four countries – Albania, Bulgaria, Croatia, FYRO Macedonia and Romania – acquire ICT skills in
obligatory subjects. Only three of these countries (Bulgaria, FYRO Macedonia and Serbia) have elective subjects in
their curricula. Most primary schools in Croatia also have elective ICT subjects. National curricula of two countries
only (Bulgaria and Romania) include ICT applications in other subjects. For Croatia integration of computer
technologies is recommended, not compulsory. Some students from Romanian high schools can be acquainted with
new ICTs using computers in other subjects. Data collected shows that Bulgarian curricula propose the most forms of
ICT education – compulsory and elective subjects, integration of ICTs in another subjects. Romania and FYRO
Macedonia are in the second place, then Croatia (see Table 2).
10
INDICATORS OF ICT APPLICATION IN SECONDARY EDUCATION...
Country Master plan Timeframe Separate Monitoring and Budget planunit evaluation scheme
Albania Yes Yes Yes No No
Bulgaria Yes Yes Yes Yes Yes
Croatia Yes Yes No Yes Yes
Bosnia andHerzegovina
FYRO Macedonia
Republic of Moldova
Romania
Serbia andMontenegro
No national policy on ICT application in education

Table 2. ICT national curriculum
There is special educational software for ICT curricula in five countries of the region: Albania, Bulgaria, Croatia,
FYRO Macedonia and Romania. Bulgarian data shows availability of special educational software in other subjects
supported by ICTs. In Romania special educational software is developed under Ministry of Education programme
Educational IT-Based System.
According to Key Data on Information and Communication Technology in Schools in Europe, 2004 edition, the
picture of ICT teaching in primary schools is the following. Most countries involve compulsory ICT minimum in
primary education, except Bulgaria, Czech Republic, Hungary, Italy, Latvia, Lithuania and Slovakia. Romanian
pupils learn ICTs as a subject in primary schools. Belgium, Denmark, Germany, Greece, Finland, Norway,
Portugal, Spain, Sweden propose ICT usage as a tool for other subjects. United Kingdom, Netherlands and Poland
apply both approaches – a separate subject and integration of ICTs in other subjects. ICT is a compulsory subject
for all day primary schools in Greece. In United Kingdom a separate subject is defined by the National Curriculum,
but the way it is taught is a matter of school (separate lessons, cross-curricular teaching or a combination of both).
In Northern Ireland the teaching objectives for ICTs are included in the statutory requirements for all subjects. For
Hungary and Bulgaria non-compulsory courses are possible. This picture changes fast. European countries, in
which ICTs is not a compulsory subject in the curriculum for 2002/2003, are now exception to the rule. In primary
education ICT is a part of the compulsory education for most European countries, except Bulgaria, Czech
Republic, Hungary, Italy, Latvia, Lithuania and Slovakia.
What is a European state at the secondary school level? The surveys show that all European countries offer ICT
compulsory curriculum at this level. Italian curriculum does not include ICT compulsory matter either in lower
secondary school or in upper secondary one. Bulgaria offers compulsory subjects in the upper secondary school
only.
In most cases the national curricula combine two approaches to ICT teaching – a separate subject and integrating ICTs
in other subjects. Spain has ICT a compulsory subject in the first two years of secondary education, and in new
curriculum ICT skills may be used as a tool. For France in the first year of upper secondary school ICTs is a core
curriculum option. Luxemburg applies both approaches – in technical secondary schools ICTs is a separate subject but
in all other types – ICTs is integrated as a tool.
In conclusion, ICTs are often included in the curriculum as a separate subject and a tool for other subjects. Also there
is a tendency to promote teaching ICTs as a separate subject.
What does the data give for the survey?
11
Country Compulsory subject Elective subject Integrating ICTs Othersin other subjects
Albania X
Bosnia X
Bulgaria X X X X
Croatia X X
FYRO Macedonia
X X X
Republic of Moldova X
Romania X X
Serbia X X
Description of the Research
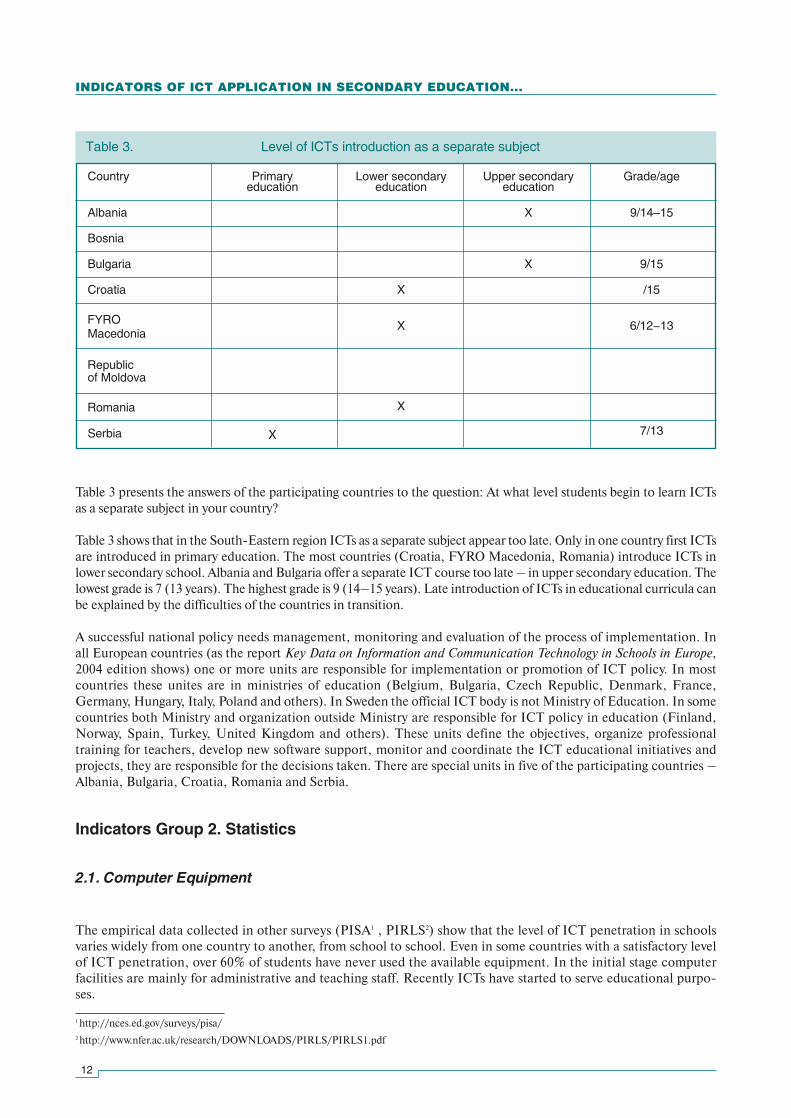
Table 3. Level of ICTs introduction as a separate subject
Table 3 presents the answers of the participating countries to the question: At what level students begin to learn ICTs
as a separate subject in your country?
Table 3 shows that in the South-Eastern region ICTs as a separate subject appear too late. Only in one country first ICTs
are introduced in primary education. The most countries (Croatia, FYRO Macedonia, Romania) introduce ICTs in
lower secondary school. Albania and Bulgaria offer a separate ICT course too late – in upper secondary education. The
lowest grade is 7 (13 years). The highest grade is 9 (14–15 years). Late introduction of ICTs in educational curricula can
be explained by the difficulties of the countries in transition.
A successful national policy needs management, monitoring and evaluation of the process of implementation. In
all European countries (as the report Key Data on Information and Communication Technology in Schools in Europe,
2004 edition shows) one or more units are responsible for implementation or promotion of ICT policy. In most
countries these unites are in ministries of education (Belgium, Bulgaria, Czech Republic, Denmark, France,
Germany, Hungary, Italy, Poland and others). In Sweden the official ICT body is not Ministry of Education. In some
countries both Ministry and organization outside Ministry are responsible for ICT policy in education (Finland,
Norway, Spain, Turkey, United Kingdom and others). These units define the objectives, organize professional
training for teachers, develop new software support, monitor and coordinate the ICT educational initiatives and
projects, they are responsible for the decisions taken. There are special units in five of the participating countries –
Albania, Bulgaria, Croatia, Romania and Serbia.
Indicators Group 2. Statistics
2.1. Computer Equipment
The empirical data collected in other surveys (PISA1 , PIRLS2) show that the level of ICT penetration in schools
varies widely from one country to another, from school to school. Even in some countries with a satisfactory level
of ICT penetration, over 60% of students have never used the available equipment. In the initial stage computer
facilities are mainly for administrative and teaching staff. Recently ICTs have started to serve educational purpo-
ses.
12
INDICATORS OF ICT APPLICATION IN SECONDARY EDUCATION...
Country Primary Lower secondary Upper secondary Grade/ageeducation education education
Albania X 9/14–15
Bosnia
Bulgaria X 9/15
Croatia X /15
FYRO Macedonia
X 6/12-13
Republic of Moldova
Romania X
Serbia X 7/13
1 http://nces.ed.gov/surveys/pisa/
2 http://www.nfer.ac.uk/research/DOWNLOADS/PIRLS/PIRLS1.pdf

Diagram 1. Percentage of schools with computer classrooms
EURYDICE3 report Key Data on Information and Communication Technology in Schools in Europe – 2004 shows that
in most European countries there are no centralized decisions for investment in computer equipment – it is a ques-
tion of local authorities or schools. Some countries such as Belgium (Flemish part), United Kingdom (England,
Scotland), Malta and Slovenia have recommendations for “the number of pupils working on one computer”. Bulgaria,
Greece, Lithuania and Portugal move to reduce the ratio. In most European countries (in 2000) there are 20 students
per one computer. Denmark, Finland, Liechtenstein, Luxemburg, Norway, Sweden and United Kingdom have the ra-
tio less than 10; in Bulgaria and Latvia – 30 pupils per one computer; in Greece, Portugal and Romania – more than
50. This picture changes quickly. It is noticed that this ratio is better in the countries where these decisions are not del-
egated to local authorities.
For the survey data related to quantity and quality of hardware equipment in secondary schools of the countries from
South-Eastern Europe is shown by the following indicators:
• SC – percentage of schools with computer classrooms;
• NC – average number of students per computer in schools with computer classrooms;
• SCN – percentage of schools having computer classrooms equipped with computers not older than 1995;
• SCL – percentage of schools with a local network in the total number of schools with computer classrooms.
The following formulas are used in calculations:
This data is shown in Diagrams 1–4 below.
Diagram 1 presents data on the percentage of the secondary schools from participating countries with computer class-
rooms. The best results belong to Croatia and FYRO Macedonia (all schools have computer labs – at least one per
school). Serbia and Bosnia go next.
13
SCCSC =
______ * 100%
S
NSCNC =
______ * 100%
C
CNSCN =
______ * 100%
SCC
SLSCL =
______ * 100%
SCC
3 The information network on education in Europe
ALB BIH BUL CRO MCD MOL ROM SCG
■ SC 30 90 36 100 100 54 40 97
100
90
80
70
60
50
40
30
20
10
0
% 100
90
80
70
60
50
40
30
20
10
0
%
Description of the Research

Diagram 3. Percentage of schools having computer classrooms equipped with computers not older than 1995
Diagram 2. Average number of students per computer in schools with computer classrooms
Diagram 3 shows the quality of the computer equipment and percentage of schools that have classrooms equipped with
computers not older than 1995. Macedonian schools use new ICTs, though they are few in number. Serbia and Croatia are
next. The lowest result belongs to Bosnia – 50% computer equipment was bought before 1995.
14
INDICATORS OF ICT APPLICATION IN SECONDARY EDUCATION...
ALB BIH BUL CRO MCD MOL ROM SCG
■ NC 60 50 40 17 150 50 25 32
160
140
120
100
80
60
40
20
0
% 160
140
120
100
80
60
40
20
0
%
ALB BIH BUL CRO MCD MOL ROM SCG
■ SCN 90 50 – 90 100 54 85 98
100
90
80
70
60
50
40
30
20
10
0
% 100
90
80
70
60
50
40
30
20
10
0
%
Diagram 2 presents the average number of students using one computer in schools with computer classrooms. The best
result is 17 students per computer in Croatia. It is close to average European statistics. Romania is next with 25 students
per computer, and the worst result of 150 is in FYRO Macedonia.

Diagram 4. Percentage of schools with a local network in the total number of schools with computer classrooms
Countries by group 1999 2002
15
ALB BIH BUL CRO MCD MOL ROM SCG
■ SCL 1 5 64 100 100 54 70 67
100
90
80
70
60
50
40
30
20
10
0
% 100
90
80
70
60
50
40
30
20
10
0
%
All developing countries ... 40.9
Central and Eastern Europe and the CIS 0 71.8
High human development 2.5 382.6
Medium human development 0 37.3
Low human development 0 5.9
High income 3.1 445.8
Middle income 0 59.5
Low income 0 13.0
World 0.5 99.4
Description of the Research
Diagram 4 gives the picture of availability of the local networks in schools with computer classrooms. The best
results are in Croatia. FYRO Macedonia has high result due to the fact that they have few well-equipped computer
classrooms with local networks. Albania shows the lowest result – only 1% schools have LAN. More than half of
schools with computer labs in Bulgaria, Croatia, FYRO Macedonia, Republic of Moldova, Romania and Serbia
use local networks.
2.2. Internet Access
UNDP Human Development Report 2004 gives the following number of Internet users per 1,000 people:

According to this report the best index for European countries is:
The countries participating in this survey show the following results:
Comparison of data reveals that the number of Internet users has increased essentially in the last three years.
For European countries the level of Internet access has always been lower than the level of computeri-
zation. The schools with more computers have high rates of computers with Internet access (Fin-
land, Iceland, Liechtenstein, Luxemburg, Sweden). The surveys of OECD and PISA in 2000 show the high-
est result in Luxemburg – 87.8% computers are connected to the Internet, in Finland – 83.7%, in Island –
82.6%.
For the present survey data collected on Internet access of the secondary schools is described by the following
indicators:
• IO – percentage of schools without Internet access;
• IL – percentage of schools with e-mail only;
• IC – percentage of schools with access via dial-up connection;
• ID – percentage of schools with access via dedicated channel;
• IW – percentage of schools having their own web sites.
The following formulas are used in calculations:
Countries 1999 2002
Countries 1999 2002
16
INDICATORS OF ICT APPLICATION IN SECONDARY EDUCATION...
Finland 4.0 508.9
France 0.5 313
Iceland 0 647.9
Netherlands 3.3 506.3
Norway 7.1 502.6
Sweden 5.8 573.1
Switzerland 5.8 351.0
United Kingdom 0.9 423.1
Albania 0 3.9
Bulgaria 0 80.8
Croatia 0 180.4
FYRO Macedonia 0 48.4
Republic of Moldova 0 34.1
Romania 0 101.5
Turkey 0 72.8
This data is shown in Diagrams 5–8 below.
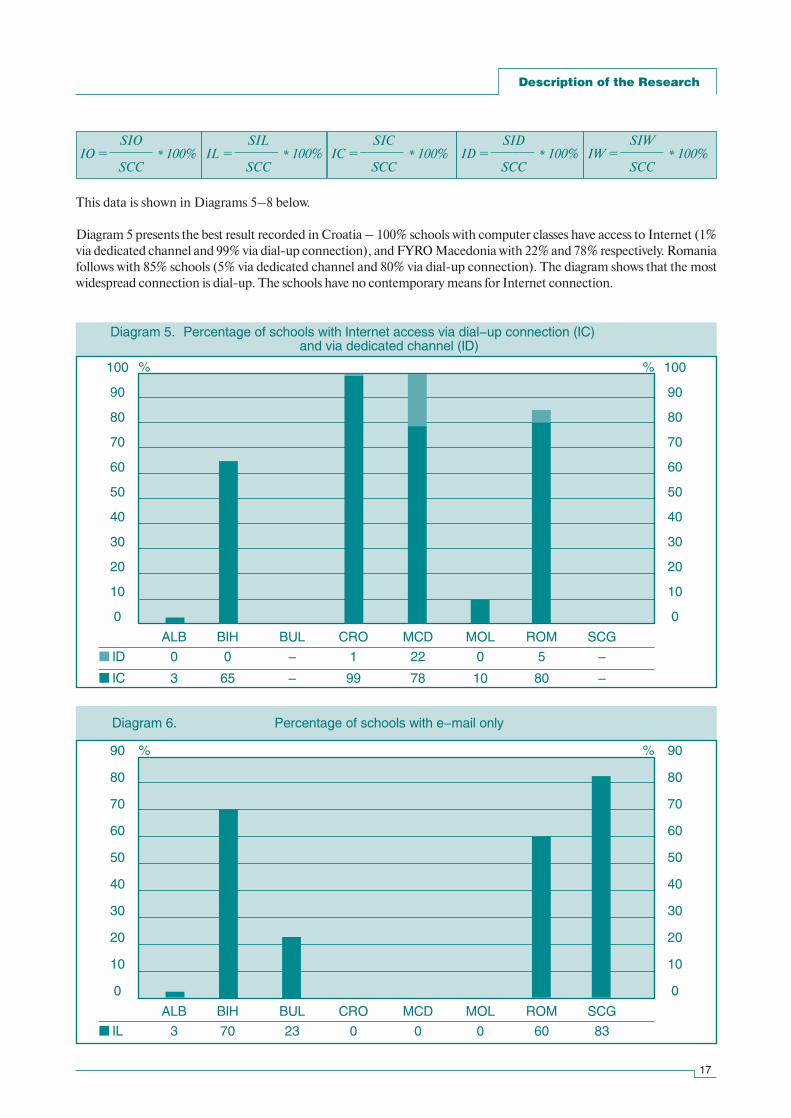
Diagram 5 presents the best result recorded in Croatia – 100% schools with computer classes have access to Internet (1%
via dedicated channel and 99% via dial-up connection), and FYRO Macedonia with 22% and 78% respectively. Romania
follows with 85% schools (5% via dedicated channel and 80% via dial-up connection). The diagram shows that the most
widespread connection is dial-up. The schools have no contemporary means for Internet connection.
17
SIOIO =
______ * 100%
SCC
SILIL =
______ * 100%
SCC
SICIC =
______ * 100%
SCC
SIDID =
______ * 100%
SCC
SIWIW =
______ * 100%
SCC
ALB BIH BUL CRO MCD MOL ROM SCG
■ ID 0 0 – 1 22 0 5 –
■ IC 3 65 – 99 78 10 80 –
100
90
80
70
60
50
40
30
20
10
0
%
Diagram 5. Percentage of schools with Internet access via dial-up connection (IC) and via dedicated channel (ID)
100
90
80
70
60
50
40
30
20
10
0
%
ALB BIH BUL CRO MCD MOL ROM SCG
■ IL 3 70 23 0 0 0 60 83
90
80
70
60
50
40
30
20
10
0
%
Diagram 6. Percentage of schools with e-mail only
90
80
70
60
50
40
30
20
10
0
%
Description of the Research

Diagram 7. Percentage of schools having their own web sites
Diagram 7 shows the percentage of schools that have their own web sites. The common picture is that it is not a
widespread practice for secondary schools to develop and use sites. The highest result is 79% schools with Internet,
which have own sites, are in Serbia. Croatia follows with 49% schools. The rest six countries (Albania, Bulgaria, Bosnia,
FYRO Macedonia, Republic of Moldova and Romania) have low result – less than 10% schools possess their own sites.
Schools in FYRO Macedonia and the Republic of Moldova do not have sites.
2.3. School Personnel – Level of Experience
According to EURYDICE data ICT specialists teach ICTs as a separate subject, or teach how to use ICTs as a tool for other
subjects, or support other subjects. In almost all countries these specialists are employed at secondary school level. In most
countries there is a preliminary education leading to a qualification as an ICT specialist teacher. In most cases this education
is provided at universities and lasts 3, 4 or 5 years. In many European countries the qualified teachers may take further edu-
cation to obtain a qualification of ICT specialists. In the majority of countries there are special national programmes for in-
service education of teachers. They have different duration and may last up to two years. This education provides courses for
teachers of all school levels. Teachers are not the only target group for in-service ICT training (Czech Republic, Germany,
Finland, Latvia, Lithuania, Slovenia, Sweden). In some countries in-service education is compulsory for teachers, but in most
countries – not. In other countries these courses may be prescribed or recommended following evaluation procedures.
All participating countries understand that teachers are a key element in ICT education, and even the best ideas could not
succeed without well-trained teachers. It is reflected in the national policies, and each country plans training of different
target groups: teachers of ICTs, teachers of other subjects, teachers of elementary school, administrators.
Data collected about the readiness of the school staff to use or teach computers and ICTs in their work is described by
such indicators as:
• TE1 – percentage of elementary school teachers who have taken <30 hour computer literacy courses;
• TE2 – percentage of elementary school teachers who have taken 30–70 hour computer literacy courses;
• TE3 – percentage of elementary school teachers who have taken >70 hour computer literacy courses;
• TI1 – percentage of teachers of Informatics and/or Information technologies who have taken <30 hour
computer literacy courses;
18
INDICATORS OF ICT APPLICATION IN SECONDARY EDUCATION...
ALB BIH BUL CRO MCD MOL ROM SCG
■ IW 1 5 7 45 14 0 10 79
80
70
60
50
40
30
20
10
0
% 80
70
60
50
40
30
20
10
0
%
• TI2 – total number of teachers of Informatics and/or Information technologies who have taken 30–70 hour
computer literacy courses;
• TI3 – percentage of teachers of Informatics and/or Information technologies who have taken >70 hour
computer literacy courses;
• TO1 – percentage of teachers of other subjects (not including Informatics or Information technologies) who
have taken <30 hour computer literacy courses;
• TO2 – percentage of teachers of other subjects (not including Informatics or Information technologies) who
have taken 30–70 hour computer literacy courses;
• TO3 – percentage of teachers of other subjects (not including Informatics or Information technologies) who
have taken >70 hour computer literacy courses;
• AD1 – percentage of administrators who have taken <30 hour computer literacy courses;
• AD2 – percentage of administrators who have taken 30–70 hour computer literacy courses;
• AD3 – percentage of administrators who have taken >70 hour computer literacy courses;
• TEE – percentage of elementary school teachers with elementary computer skills;
• TIE – percentage of teachers of Informatics and/or Information technologies with elementary computer skills;
• TOE – percentage of teachers of other subjects (not including Informatics or Information technologies) with
elementary computer skills;
• ADE – percentage of administrators with elementary computer skills;
• TEA – percentage of elementary school teachers with advanced computer skills;
• TIA – percentage of teachers of Informatics and/or Information technologies with advanced computer skills;
• TOA – percentage of teachers of other subjects (not including Informatics or Information technologies) with
advanced computer skills;
• ADA – percentage of administrators with advanced computer skills.
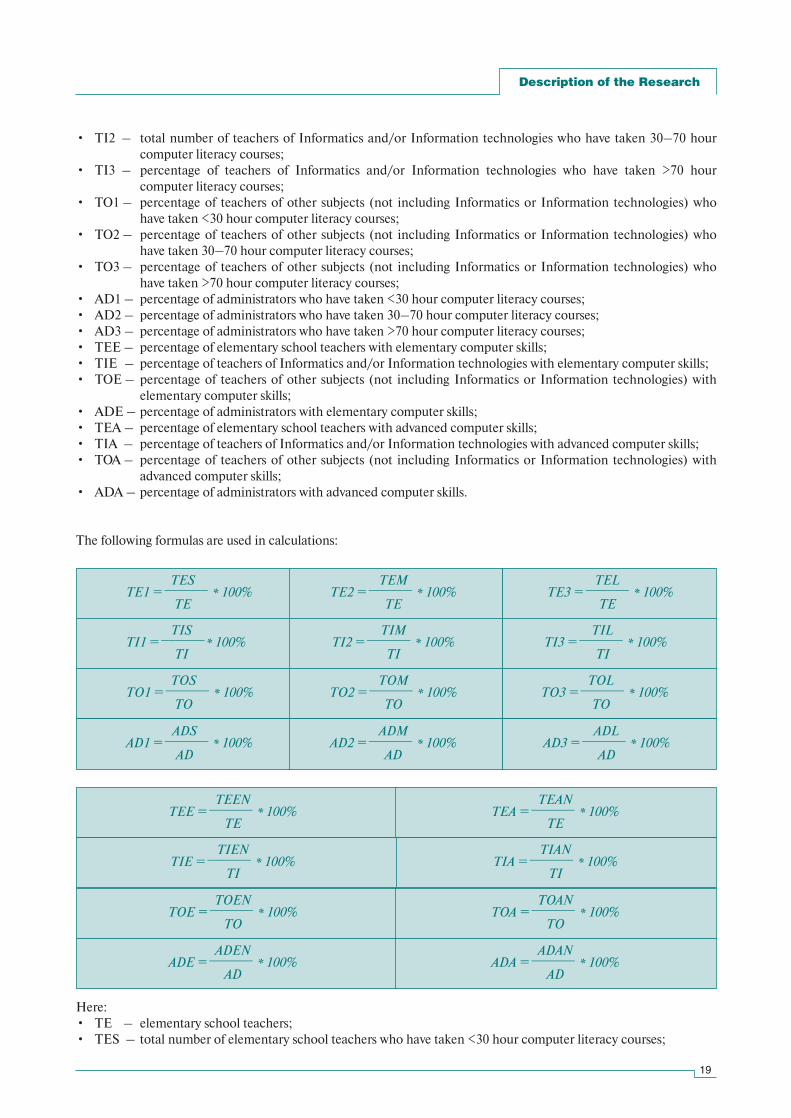
The following formulas are used in calculations:
Here:
• TE – elementary school teachers;
• TES – total number of elementary school teachers who have taken <30 hour computer literacy courses;
19
TESTE1 =
______ * 100%
TE
TEMTE2 =
______ * 100%
TE
TELTE3 =
______ * 100%
TE
TISTI1 =
______* 100%
TI
TIMTI2 =
______ * 100%
TI
TILTI3 =
______ * 100%
TI
TOSTO1 =
______ * 100%
TO
TOMTO2 =
______ * 100%
TO
TOLTO3 =
______ * 100%
TO
ADSAD1 =
______ * 100%
AD
ADMAD2 =
______ * 100%
AD
ADLAD3 =
______ * 100%
AD
TEENTEE =
______ * 100%
TE
TEANTEA =
______ * 100%
TE
TIENTIE =
______ * 100%
TI
TIANTIA =
______ * 100%
TI
TOENTOE =
______ * 100%
TO
TOANTOA =
______ * 100%
TO
ADENADE =
______ * 100%
AD
ADANADA =
______ * 100%
AD
Description of the Research

Diagram 8. Percentage of elementary school teachers (TE1), teachers of Informatics and/or Information technologies (TI1), teachers of other subjects (TO1)
and administrators (AD1) who have taken computer literacy courses of less than 30 hours
• TEM – total number of elementary school teachers who have taken 30–70 hour computer literacy courses;
• TEL – total number of elementary school teachers who have taken >70 hour computer literacy courses;
• TI – teachers of Informatics and/or Information technologies;
• TIS – total number of teachers of Informatics and/or Information technologies who have taken <30 hour
computer literacy courses;
• TIM – total number of teachers of Informatics and/or Information technologies who have taken 30–70 hour
computer literacy courses;
• TIL – total number of teachers of Informatics and/or Information technologies who have taken >70 hour
computer literacy courses;
• TO – total number of teachers of other subjects (excluding Informatics or Information technologies);
• TOS – total number of teachers of other subjects (excluding Informatics or Information technologies) who have
taken <30 hour computer literacy courses;
• TOM– total number of teachers of other subjects (excluding Informatics or Information technologies) who have
taken 30–70 hour computer literacy courses;
• TOL – total number of teachers of other subjects (excluding Informatics or Information technologies) who have
taken >70 hour computer literacy courses;
• AD – total number of administrators;
• ADS – total number of administrators who have taken <30 hour computer literacy courses;
• ADM– total number of administrators who have taken 30–70 hour computer literacy courses;
• ADL – total number of administrators who have taken >70 hour computer literacy courses.
Diagrams 8–12 give the picture of the staff training in secondary schools of the participating countries.
Diagram 8 below shows the percentage of the school personnel (Informatics/ICT teachers, teachers of other subjects,
teachers of elementary school and administrators) who have taken training courses less than 30 hours. The best complex
results are achieved in Bosnia – 90% teachers from elementary schools and 90% teachers of different than Informatics/ICT
subjects have passed courses of less than 30 hours. The Bosnia data about the administrators is a little less, but high enough
– 70%. Romania follows – 95% school administrators and 80% teachers of Informatics/ICTs have taken short courses.
From the data collected it is seen that the lowest result belongs to FYRO Macedonia. As a whole training of the different
target groups is not proportional in each country.
20
INDICATORS OF ICT APPLICATION IN SECONDARY EDUCATION...
ALB BIH BUL CRO MCD MOL ROM SCG■ TE1 0 90 – – 2 4 5 –■ TI1 35 5 – – 35 37 80 –■ TO1 0 90 – – 2 7 10 –■ AD1 40 70 – – 2 12 95 –
100
90
80
70
60
50
40
30
20
10
0
% 100
90
80
70
60
50
40
30
20
10
0
%
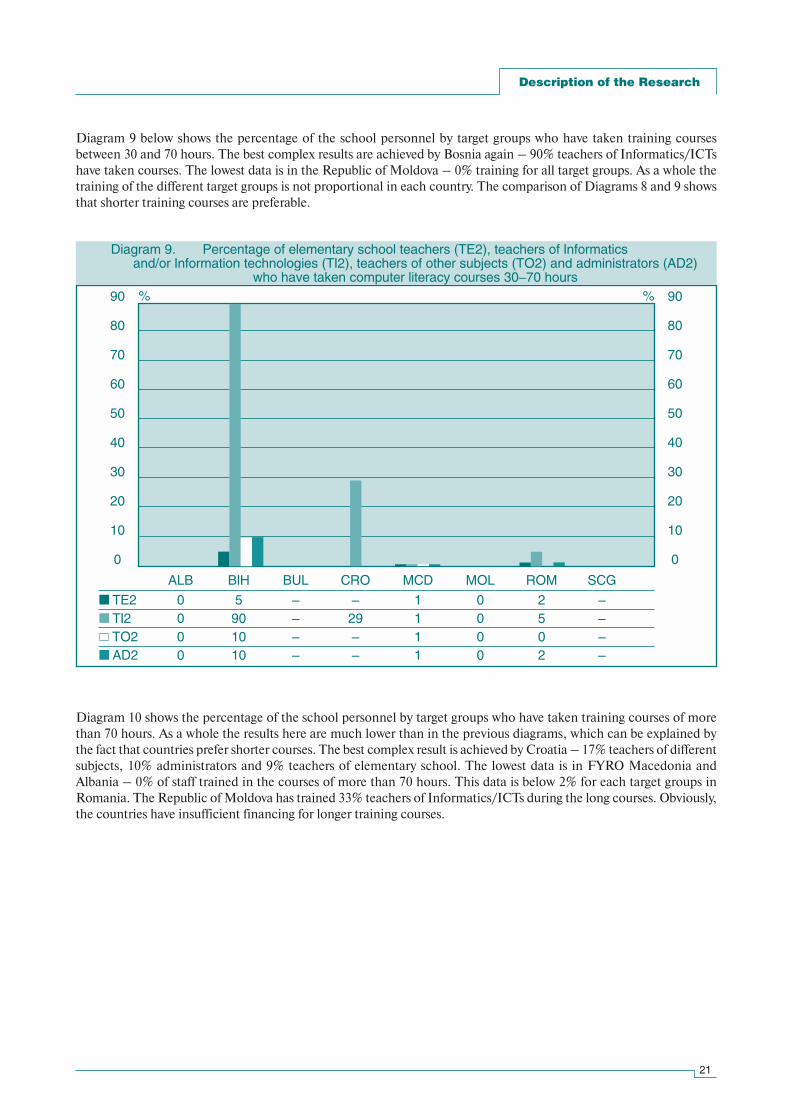
Diagram 9 below shows the percentage of the school personnel by target groups who have taken training courses
between 30 and 70 hours. The best complex results are achieved by Bosnia again – 90% teachers of Informatics/ICTs
have taken courses. The lowest data is in the Republic of Moldova – 0% training for all target groups. As a whole the
training of the different target groups is not proportional in each country. The comparison of Diagrams 8 and 9 shows
that shorter training courses are preferable.
Diagram 10 shows the percentage of the school personnel by target groups who have taken training courses of more
than 70 hours. As a whole the results here are much lower than in the previous diagrams, which can be explained by
the fact that countries prefer shorter courses. The best complex result is achieved by Croatia – 17% teachers of different
subjects, 10% administrators and 9% teachers of elementary school. The lowest data is in FYRO Macedonia and
Albania – 0% of staff trained in the courses of more than 70 hours. This data is below 2% for each target groups in
Romania. The Republic of Moldova has trained 33% teachers of Informatics/ICTs during the long courses. Obviously,
the countries have insufficient financing for longer training courses.
21
ALB BIH BUL CRO MCD MOL ROM SCG
■ TE2 0 5 – – 1 0 2 –■ TI2 0 90 – 29 1 0 5 –■ TO2 0 10 – – 1 0 0 –■ AD2 0 10 – – 1 0 2 –
90
80
70
60
50
40
30
20
10
0
%
Diagram 9. Percentage of elementary school teachers (TE2), teachers of Informatics and/or Information technologies (TI2), teachers of other subjects (TO2) and administrators (AD2)
who have taken computer literacy courses 30–70 hours90
80
70
60
50
40
30
20
10
0
%
Description of the Research

Diagram 11 presents the elementary computer literacy of each target group. Croatia school staff as a whole has the high-
est elementary computer literacy – 90% administrators, 85% teachers on Informatics/ICTs, 85% teachers of other sub-
jects. Albania and FYRO Macedonia have the highest results for teachers of Informatics/ICTs – 100% of them in both
countries have elementary computer literacy. For Romania this data vary for all target groups from 10% to 40%.
22
INDICATORS OF ICT APPLICATION IN SECONDARY EDUCATION...
ALB BIH BUL CRO MCD MOL ROM SCG■ TE3 0 5 – 9 0 0 0 –■ TI3 0 5 – – 0 33 1 –■ TO3 0 0 – 17 0 0 0 –■ AD3 0 0 – 10 0 0 2 –
35
30
25
20
15
10
5
0
%
Diagram 10. Percentage of elementary school teachers (TE3), teachers of Informatics and/or Information technologies (TI3), teachers of other subjects (TO3) and administrators
(AD3) who have taken computer literacy courses of more than 70 hours
35
30
25
20
15
10
5
0
%
ALB BIH BUL CRO MCD MOL ROM SCG■ TEE 2 20 – 85 15 – 10 –■ TIE 100 90 – 10 100 74 – –■ TOE 15 20 – 85 35 – 30 –■ ADE 67 50 – 90 20 – 40 –
100
90
80
70
60
50
40
30
20
10
0
%
Diagram 11. Percentage of elementary school teachers (TEE), teachers of Informatics and/or Information technologies (TIE), teachers of other
subjects (TOE) and administrators (ADE) with elementary computer skills100
90
80
70
60
50
40
30
20
10
0
%

Diagram 12 presents the advanced computer literacy of each target group. No homogeneous results exist for all
countries. It is natural that the highest values for each country belong to the teachers of Informatics/ICT. Romania and
Albania present data showing 100% advanced literacy for their Informatics teachers. Croatia follows with 90%. The
lowest values relate to teachers of elementary school.
23
ALB BIH BUL CRO MCD MOL ROM SCG
■ TEA 1 5 – 15 2 – 0 –
■ TIA 100 70 – 90 50 26 100 –■ TOA 4 5 – 15 2 – 3 –
■ ADA 25 10 – 10 0 – 60 –
100
90
80
70
60
50
40
30
20
10
0
%
Diagram 12. Percentage of elementary school teachers (TEA), teachers of Informatics and/or Information technologies (TIA), teachers of other
subjects (TOA) and administrators (ADA) with advanced computer skills100
90
80
70
60
50
40
30
20
10
0
%
Description of the Research

GENERAL CONCLUSIONS AND RECOMMENDATIONS
The report presents the specialized comparative research exploring the state-of-art of Informatics/ICTs and ICT
applications in other subjects in schools from South-East European region. After the analysis of the data collected the
following conclusions and recommendations were made:
Concerning the organization of the survey:
• The countries from the South-East European region demonstrated a strong interest in the given comparative survey
and participated responsibly in the questionnaire development, data collection and interpretation of the national
results.
• During all stages of the survey there was a lack of advanced tools for monitoring, ways for verifying reliability and
authenticity of the data gathered, assurance of the homogenous data from different countries.
• There is a need in providing similar comparative studies periodically in order to stimulate countries to develop and
effectively implement a modern ICT education policy.
Recommendations to the educational policy- and decision-makers:
• To strengthen the national policies, action plans and ways of implementation in their variety and complexity, taking
advantages of the approaches of the other countries of this project;
• To track the process of changes in other European countries in the field of Informatics/ICT education and
integration of ICTs into different subjects and to hold the line of drawing closer to European education;
• To provide similar research at the national level regularly and to improve the situation;
• To promote national curriculum for both Informatics/ICTs and for integration of ICTs in other subjects;
• To support national curriculum with a variety of educational software;
• To disseminate the best national and international practices in schools.
24
REFERENCES
Basic ICT Usage Indicators in Secondary Education in the Baltic and CIS States. IITE, Moscow, 2002
Human Development Report 2004, United Nations Development Programme
http://hdr.undp.org/reports/global/2004/
Information and Communication Technologies in Secondary Education. Position paper. IITE, Moscow, 2004
Key Data on Information and Communication Technology in Schools in Europe. 2004 edition, EURYDICE
programme, European Commission
http://www.eurydice.org/Documents/KDICT/en/FrameSet.htm
25

APPENDIX 1
Basic Indicators
26
D – The list of official documents on ICTs in secondary education
PR – Government curriculum on Informatics/ICTs in secondary schools
SI – ICTs as a separate course
SS – ICT integration in other subjects
S – Total number of schools
SC – Percentage of schools with computer classrooms
SCC – Total number of schools with computer classrooms
NC – Average number of students per computer in schools with computer classrooms
NSC – Total number of students in schools with computer classrooms
C – Total number of computers in computer classrooms
SCN – Percentage of schools having computer classrooms equipped with computers not older than 1995
CN – Total number of computers in computer classrooms not older than 1995
SCL – Percentage of schools with a local network in the total number of schools equipped with computer class-
rooms
SL – Total number of schools with a local network in the total number of schools with computer class-
rooms
IO – Percentage of schools without Internet access
SIO – Total number of schools without Internet access
IL – Percentage of schools with e-mail only
SIL – Total number of schools with e-mail only
IC – Percentage of schools with access via dial-up connection
SIC – Total number of schools with access via dial-up connection
ID – Percentage of schools with access via dedicated channel
SID – Total number of schools with access via dedicated channel
IW – Percentage of schools having their own web sites
SIW – Total number of schools having their own web sites
TE – Elementary school teachers
TI – Teachers of Informatics and/or Information technologies
TO – Teachers of other subjects (not including Informatics or Information technologies)
AD – Administrators
TE1 – Percentage of elementary school teachers who have taken <30 hour computer literacy courses
TES – Total number of elementary school teachers who have taken <30 hour computer literacy courses
TE2 – Percentage of elementary school teachers who have taken 30–70 hour computer literacy courses
TEM – Total number of elementary school teachers who have taken 30–70 hour computer literacy courses
TE3 – Percentage of elementary school teachers who have taken >70 hour computer literacy courses
TEL – Total number of elementary school teachers who have taken >70 hour computer literacy courses
TI1 – Percentage of teachers of Informatics and/or Information technologies who have taken <30 hour computer
literacy courses
TIS – Total number of teachers of Informatics and/or Information technologies who have taken <30 hour
computer literacy courses
TI2 – Percentage of teachers of Informatics and/or Information technologies who have taken 30–70 hour
computer literacy courses
TIM – Total number of teachers of Informatics and/or Information technologies who have taken 30–70 hour
computer literacy courses
TI3 – Percentage of teachers of Informatics and/or Information technologies who have taken >70 hour computer
literacy courses
TIL – Total number of teachers of Informatics and/or Information technologies who have taken >70 hour
computer literacy courses
TO1 – Percentage of teachers of other subjects (excluding Informatics or Information technologies) who have
taken <30 hour computer literacy courses

TOS – Total number of teachers of other subjects (excluding Informatics or Information technologies) who
have taken <30 hour computer literacy courses
TO2 – Percentage of teachers of other subjects (excluding Informatics or Information technologies) who have
taken 30–70 hour computer literacy courses
TOM – Total number of teachers of other subjects (excluding Informatics or Information technologies) who
have taken 30–70 hour computer literacy courses
TO3 – Percentage of teachers of other subjects (excluding Informatics or Information technologies) who have
taken >70 hour computer literacy courses
TOL – Total number of teachers of other subjects (excluding Informatics or Information technologies) who have
taken >70 hour computer literacy courses
AD1 – Percentage of administrators who have taken <30 hour computer literacy courses
ADS – Total number of administrators who have taken <30 hour computer literacy courses
AD2 – Percentage of administrators who have taken 30–70 hour computer literacy courses
ADM – Total number of administrators who have taken 30–70 hour computer literacy courses
AD3 – Percentage of administrators who have taken >70 hour computer literacy courses
ADL – Total number of administrators who have taken >70 hour computer literacy courses
TEE – Percentage of elementary school teachers with elementary computer skills
TEEN – Total number of elementary school teachers with elementary computer skills
TEA – Percentage of elementary school teachers with advanced computer skills
TEAN – Total number of elementary school teachers with advanced computer skills
TIE – Percentage of teachers of Informatics and/or Information technologies with elementary computer skills
TIEN – Total number of teachers of Informatics and/or Information technologies with elementary computer skills
TIA – Percentage of teachers of Informatics and/or Information technologies with advanced computer skills
TIAN – Total number of teachers of Informatics and/or Information technologies with advanced computer skills
TOE – Percentage of teachers of other subjects (excluding Informatics or Information technologies) with
elementary computer skills
TOEN – Total number of teachers of other subjects (excluding Informatics or Information technologies) with
elementary computer skills
TOA – Percentage of teachers of other subjects (excluding Informatics or Information technologies) with
advanced computer skills
TOAN – Total number of teachers of other subjects (excluding Informatics or Information technologies) with
advanced computer skills
ADE – Percentage of administrators with elementary computer skills
ADEN – Total number of administrators with elementary computer skills
ADA – Percentage of administrators with advanced computer skills
ADAN – Total number of administrators with advanced computer skills
27
Appendix 1

APPENDIX 2
List of Persons Responsible for Submission of Information
ALBANIARexhep ÇukoPosition: Director
Ministry of Education and Science
Contact information:
BOSNIA AND HERZEGOVINAStevan Trbojevic, M.D., Ph.D.Position: The Chairman of the team for ICTs
and DE Implementation at BiH Universities
Contact information:
BULGARIADimitar TzvetkovPosition: Director of ICT department
Ministry of Education and Science
Contact information:
CROATIARatimir KvaternikPosition: Educational consultant
Ministry of Science, Education and Sports
Contact information:
FYRO MACEDONIAKaterina ZdravkovaPosition: Full professor
Faculty of Natural Sciences and Mathematics
Contact information:
Arhimedova, bb
1000 Skopje
REPUBLIC OF MOLDOVAIurie Mocanu Position: Head of the department
Ministry of Education
Contact information:
ROMANIAOlimpius IstratePosition: Teaching Assistant
University of Bucharest, Teacher Training Department
Contact information:
SERBIAIvana ZlatanovicPosition: Director
Institute for Education Quality and Evaluation
Ministry of Education and Sports
Contact information:
28

29
APPENDIX 3
Questionnaire Used for Data Collection
4. Does your Ministry have a national policy on ICT application in education?
If yes, is this policy applicable to:
5. Please state below your national policy on ICT application in education:
1. Country:
2. Person responsible for data provision: Name:
Contact information:
Position:
3. Name of Ministry:
Yes No (if no, proceed to question no. 10)
formal school only (both primary and secondary)
non-formal only
both formal and non-formal
POLICY
6. Please check below the columns Yes, No to indicate presence or absence of the following in theimplementation of the national policy on ICT application in education:
30
INDICATORS OF ICT APPLICATION IN SECONDARY EDUCATION...
NoYes
Master plan
Time-frame
Budget plan
Appropriations from the national budget
Separate body/structure/organization/bureau
Monitoring and evaluation scheme
Yes No
included in the national budget for education
other sources (please specify):
If yes, what percentage of the national budget for education is allocated for ICTs?
7. Is there a separate budget appropriated for the implementation of the national policy on ICTapplication in education?
If no, where does funding come from?
31
Appendix 3
8. In the implementation of national policy on ICT application in education in your country, do youinclude as clientele the following:
9. If your country has no national policy on ICT application in education, how does your ministryintegrate ICTs in education?
(Please proceed to question no. 10)
NoYes
Remote schools?
Minorities?
Girls?
Children with special needs?
others (please specify):
ICT application in education is not the ministry’s responsibility
ICT application in education is regulated at:
regional level
provincial level
district level
municipal level
* The committee especially established for this purpose
as part of the regular programme of ministry
as a project of ministry
under an ad hoc committee*

32
INDICATORS OF ICT APPLICATION IN SECONDARY EDUCATION...
10. At national level, is there a prescribed curriculum on ICT application in education?
11. Are there special educational software products in prescribed curriculum on ICTs for:
12. At what level are ICTs first taught as a subject?
13. Is there a separate body in ministry to monitor and evaluate implementation of ICT curriculumin schools?
If yes, how is ICT taught in the classroom?
If yes, please indicate name and describe its functions below:
Please specify:
Yes No
(if no, proceed to question no. 14)
ICTs as a separate subject? other subjects supported by ICTs?
Yes No
primary lower secondary upper secondary
grade level year level
as a separate subject
integrated in other subjects
others (pls. specify)
electiveobligatory

33
Appendix 3
If no, how is implementation of ICT curriculum in schools monitored and evaluated? Please describebelow.
Please provide the following statistics at the national level.
Please don’t leave any fields blank.
If for some indicators the official statistics is not available, but expert estimation can be provided, please,put the corresponding figures in brackets. If information is not available, please, put N/A. Please put “0”only for zero values.
14. If there is no prescribed curriculum on ICTs at the national level, how do schools implement thenational policy on ICTs in education?
15. Computer equipment in schools:
16. Internet access. Please give percentage of schools:
based on the mission and vision statement of schools
schools are given the discretion to develop own curriculum on ICTs
(1) Percentage of schools with computer classrooms
(2) Average number of students per computer in schools with computer classrooms
(1) with no access
(3) Percentage of schools having computer classrooms equipped with computers notolder than 1995
(4) Percentage of schools with a local network in the total number of schools withcomputer classrooms
others (please specify):
STATISTICS

Teachers of Informatics and/or Information technologies
Elementary school teachers
34
INDICATORS OF ICT APPLICATION IN SECONDARY EDUCATION...
17. School staff development in computer literacy. Please indicate the percentage of schoolpersonnel* who took computer literacy courses during 2003/2004 school year (the period fromSeptember 2003 till September 2004).
18. Level of computer expertise of school personnel. Please indicate the percentage of schoolpersonnel* for each level of ICT proficiency:
(2) with e-mail only
(3) with access via dial-up connection
(4) with access via dedicated channel
(5) having their own web sites
Teachers of other subjects (excluding Informatics or Information technologies)
Administrators
< 30 hours 30–70 hours >70 hours
Elementary school teachers
Teachers of Informatics and/or Information technologies
Teachers of other subjects (excluding Informatics or Information technologies)
Administrators
Elementarycomputer skills
Advancedcomputer skills
* The percentage is taken in relation to total quantity of school staff in appropriate category

35
APPENDIX 4
National Policies of Bulgaria and Croatia in the Sphere of ICT
Application in Education
BULGARIA
The main goals of the strategy are:
• To modernize the whole education system and improve the quality of education so that all students are prepared to
enter the information society by achieving a satisfactory level of computer literacy.
• To develop the skills of all teachers and use ICTs for teaching and learning.
• To provide quality education system based on the experience of the EU countries. The following priorities can be
defined on the basis of the analysis of the present situation and the experience of other countries, as well as on the
basis of the general policy of the government for modernization of the education in the context of building an
information society in Bulgaria:
– Training of staff. Providing multi-channel technical support.
– Providing sufficient technical resources.
– Providing appropriate software and educational multimedia content.
– Changing and updating the legal framework of the ICTs education.
– Changing the educational content and organization of the educational process.
– Providing and implementing an efficient management information system to support the process of
decision-making.
CROATIA
On 25 May 2002 Government of the Republic of Croatia accepted and approved the strategic document Information and
Communication Technology – Croatia in 21st Century and nominated the institutions in charge of the strategy. In October
2002 the government signed the Agenda for Electronic South-East Europe (eSEE Agenda) taking the charges and
responsibilities to harmonize legislature with EU in the field of building knowledge society, thus harmonizing strategic
documents and regional cooperation in the field of application and use of ICTs. In order to foster and speed up the
process of informatization, in 2003 the programme e-Croatia was adopted. The strategic document in Chapter 6 present
the strategy in the field of primary and secondary education stressing the following:
• Through informatization process the stage should be reached where the presently prevailing system of tea-
ching factografic knowledge and ex cathedra teaching should be changed to a system that will teach pupils
and students problem-solving approach, thus ensure having after school the basic skills of how to search, analyze
and synthesize data and information by use of ICTs and know how to utilize ICTs as a tool in solving problems
rather than memorizing data, information and processes in order to be able to repeat them when required.
• During the schooling pupils and students should master the skills of using computers and networks (primary
school), skills in basic text processing, spreadsheet calculations, and Internet and sound theoretic knowledge of
ICTs (secondary school). Proper theoretic knowledge should enable them to overcome the problems of quick
obsolescence of the equipment and software and prepare them for life-long learning using ICTs intensively and
efficiently. The curriculum should be designed like the curriculum for science in the depth and scope and
methods of teaching. All other subjects should introduce ICTs in teaching and learning.
• The important step is teacher training to use ICTs in all subjects. The teachers of ICTs should be also trainers for
other teachers.

• Foster orientation toward life-long learning and stress more on education of ICT professionals at all levels
including secondary education.
• Educate the young people for life and work in the knowledge society.
• Schools should be provided with modern ICT infrastructure for teaching and learning.
The implementation programme for 2004 includes:
• start the project Information System for Primary and Secondary Education;
• provide additional equipment to schools;
• implement the national portal for teachers;
• organize and carry out further teacher training to use ICTs in teaching and learning;
• introduction of ICT subject as compulsory in all primary and secondary schools.
36
INDICATORS OF ICT APPLICATION IN SECONDARY EDUCATION...

37
i 100% of personnel younger than 30; others 2%
ii Refers to personnel younger than 30
iii Refers to personnel younger than 30; others <5%
N/A
Summary Table of Statistics Data
AP
PE
ND
IX 5
Co
un
try
Computerequipment
Internet access.Percentage of schools
in total number of schools Elementa−
ry schoolteachers
Teachers ofICTs
Subjectteachers
Admini−strators
Elementaryschool
teachers
School stuff development. Percentage of schoolpersonnel who took computer literacy courses
during 2003/2004 school year
Computer competence. Percentage of schoolpersonnel for elementary/advanced level of ICT
proficiency
ALB
BIH
BUL
CRO
MCD
MOL
ROM
SСG
30
90
35.7
100
100
54
40
97
0
90
–
2
3.5
5
0
5
–
1
0
2
0
5
9
0
0
0
Ave
rage
num
ber
of s
tude
nts
per
com
pute
r in
scho
ols
with
com
pute
r cla
ssro
oms
Per
cent
age
of s
choo
ls w
ith c
ompu
ter
clas
sroo
ms
to to
tal n
umbe
r of s
choo
ls
Per
cent
age
of s
choo
ls w
ith c
ompu
ters
not
old
erth
an 1
995
in t
he t
otal
num
ber
of s
choo
ls
with
com
pute
r cla
ssro
oms
Per
cent
age
of s
choo
ls w
ith a
loca
l net
wor
k in
the
tota
l nu
mbe
r of
sc
hool
s w
ith
com
pute
rcl
assr
oom
s
60
50
40
17
>150
50
25
32
90
50
N/A
90
100
54
85
98
1
5
63.7
100
100
54
70
67.2
with
no
acce
ss
97
35
76.4
0
<25
90.1
N/A
20.6
with
e-m
ail o
nly
3
70
23
0
0
0
60
82.6
with
acc
ess
via
dial
-up
conn
ectio
n
3
65
N/A
99
0
9.9
80
N/A
with
acc
ess
via
dedi
cate
d ch
anne
l
0
0
N/A
1
>75
0
5
N/A
havi
ng th
eir o
wn
web
site
s1
5
7
45
>60
0
10
79.2
<30
hrs
30–7
0 hr
s
>70
hrs
35
5
–
30-35
36.6
80
0
90
29
1
0
5
0
5
–
0
33.4
1
<30
hrs
30–7
0 hr
s
>70
hrs
0
90
–
2
7.34
10
0
10
–
1
0
0
0
0
17
0
0
0
<30
hrs
30–7
0 hr
s
>70
hrs
40
70
–
2
11.8
95
0
10
–
1
0
2
0
0
10
0
0
2
<30
hrs
30–7
0 hr
s
>70
hrs
2
20
85
<15
N/A
10
1
5
15
<2
N/A
0
Ele
men
tary
com
pute
r ski
lls
Adv
ance
d co
mpu
ter s
kills
Teachersof ICTs
100
90
10
100
73.7
0
100
70
90
>50
26.3
100
Ele
men
tary
com
pute
r ski
lls
Adv
ance
d co
mpu
ter s
kills
Subjectteachers
15
20
85
100 i
N/A
N/A
30
4
5
15
2 ii
3
Ele
men
tary
com
pute
r ski
lls
Adv
ance
d co
mpu
ter s
kills
Admini−strators
67
50
90
15 iii
40
25
10
10
0
60
Ele
men
tary
com
pute
r ski
lls
Adv
ance
d co
mpu
ter s
kills

38

39

40


![ICT indicators: LIRNEasia's perspectivelirneasia.net/wp-content/uploads/2010/07/Samarajiva...ICT indicators: LIRNEasia's perspective Rohan Samarajiva ; rohan [at] lirneasia.net International](https://img.dokumen.tips/doc/110x75/5f4b65d06608e07e916cd5e8/ict-indicators-lirneasias-ict-indicators-lirneasias-perspective-rohan-samarajiva.jpg)